/


Текст
THE OFFICIAL MAGAZINE OF TECHNICAL ANALYSIS
TRADERSWORLD
July, August, September 2023 Issue #89
Fibonacci Secrets
An Exploration into the
Roots and Results
of the
Fibonacci
Growth
Sequence
WWW.TRADERSWORLD.COM
WWW
WW
W.TR
TR
R AD
A ERS
E R SWO
S W O RLD
SW
D.C
.COM
OM July,
J u l y,
y, August.
Aug
g ust.
uss t. SSeptember
e p tem
epte
t e m b er
e r 22023
022 3
1
Advertisers
July, August, September 2023 Issue #89
Global Cup Trading Championship 03
Traders World 04
Magic in the Markets 05
ChartPattern 06
CosmoEconomics 16
CosmoEconomics 17
CosmoEconomics 34
CosmoEconomics 41
CosmoEconomics 46
Neverloss Trading 48
Chicago Quant Technologies 87
Timing Solution 112
Amazon Kindle Books 113
Editor-in-Chief
Larry Jacobs - Winner of the World Cup Trading
Championship for stocks in 2001. BS, MS in Business and
author of 6 trading books.
Phone 417-414-0799
Copyright 2022 Halliker’s, Inc. All rights reserved. Information in this publication must
not be reproduced in any form without written permission from the publisher. Traders
World™ (ISSN 1045-7690) is published usually 4 to 4 times a year by Halliker’s, Inc., 2508
W. Grayrock Dr., Springfield, MO 65810. The subscription to Traders World is $19.95 per
year normally it it $34.95. That gives you access to next issues plus all the past issues in a pdf
format for 1 year.
Created in the U.S.A. is prepared from information believed to be reliable but not guaranteed us
without further verification and does not purport to be complete. Futures and options trading are
speculative and involves risk of loss. Opinions expressed are subject to revision without further
notification. We are not offering to buy or sell securities or commodities discussed. Halliker’s Inc.,
one or more of its officers, and/or authors may have a position in the securities or commodities
discussed herein. Any article that shows hypothetical or stimulated performance results have certain inherent limitations, unlike an actual performance record, simulated results do not represent
actual trading. Also, since the trades have not already been executed, the results may have under
- or over compensated for the impact, if any, of certain market factors, such as lack of liquidity.
Simulated trading programs in general are also subject to the fact that they are designated with
the benefits of hindsight. No representation is being made that any account will or is likely to
achieve profits or losses similar to those shown. The names of products and services presented
in this magazine are used only in editorial fashion and to the benefit of the trademark owner
with no intention of infringing on trademark rights. Products and services in the Traders World
Catalog are subject to availability and prices are subject to change without notice. Although Halliker’s, Inc. is interested in presenting you with advertisements for quality products and services,
Halliker’s, Inc. cannot spend the time to do the due diligence it takes to ensure that only reliable
services and products are advertised with us. Also Halliker’s, Inc. dba Tradersworld may be an
affilate with some of our writers and advertisers.
Tradersworld.com and Tradersworldonlineexpo.com and the magazine Tradersworld are
owned, operated and published by Halliker’s, Inc. and contains advertisements, sponsored
content, paid insertions, affiliate links or other forms of monetization. These sights and
the magazine abides by word of mouth marketing standards. We believe in honesty of
relationship, opinion and identity. The compensation received may influence the advertising
content, topics or posts made in this blog. That content, advertising space or post will be
clearly identified as paid or sponsored content.
Tradersworld is never directly compensated to provide opinion on products, services,
websites and various other topics. The views and opinions expressed on this website are
purely those of the authors. If we claim or appear to be experts on a certain topic or product
or service area, we will only endorse products or services that we believe, based on our
expertise, are worthy of such endorsement. Any product claim, statistic, quote or other
representation about a product or service should be verified with the manufacturer or
provider. This site does not contain any content which might present a conflict of interest
and makes no representations, warranties, or assurances as to the accuracy, currency or
completeness of the content contain on this website or any sites linked to or from this site.
Affiliate Disclosure - Some ads in this magazine may contain affiliate links which are a
means for this magazine to earn money.
IMPORTANT NOTICE! No representation is being made that the use of this strategy
or any system or trading methodology will generate profits. Past performance is not
necessarily indicative of future results. There is substantial risk of loss associated with
trading securities and options on equities. Only risk capital should be used to trade. Trading
securities is not suitable for everyone. Disclaimer: Futures, Options, and Currency trading
all have large potential rewards, but they also have large potential risk. You must be aware
of the risks and be willing to accept them in order to invest in these markets. Don’t trade
with money you can’t afford to lose. This website is neither a solicitation nor an offer to Buy/
Sell futures, options, or currencies. No representation is being made that any account will
or is likely to achieve profits or losses similar to those discussed on this web site. The past
performance of any trading system or methodology is not necessarily indicative of future
results.
CFTC RULE 4.41 – HYPOTHETICAL OR SIMULATED PERFORMANCE RESULTS
HAVE CERTAIN LIMITATIONS. UNLIKE AN ACTUAL PERFORMANCE RECORD,
SIMULATED RESULTS DO NOT REPRESENT ACTUAL TRADING. ALSO, SINCE
THE TRADES HAVE NOT BEEN EXECUTED, THE RESULTS MAY HAVE UNDEROR-OVER COMPENSATED FOR THE IMPACT, IF ANY, OF CERTAIN MARKET
FACTORS, SUCH AS LACK OF LIQUIDITY. SIMULATED TRADING PROGRAMS IN
GENERAL ARE ALSO SUBJECT TO THE FACT THAT THEY ARE DESIGNED WITH
THE BENEFIT OF HINDSIGHT. NO REPRESENTATION IS BEING MADE THAT ANY
ACCOUNT WILL OR IS LIKELY TO ACHIEVE PROFIT OR LOSSES SIMILAR TO
THOSE SHOWN.
Use of any of this information is entirely at your own risk, for which Halliker’s, Inc. dba
Traders World its affiliates, employees or owners will not be liable. Neither we nor any third
parties provide any warranty or guarantee as to the accuracy, timeliness, performance,
completeness, or suitability of the information and content found or offered in the material
for any particular purpose. You acknowledge that such information and materials may
contain inaccuracies or errors and we expressly exclude liability for any such inaccuracies
or errors to the fullest extent permitted by law. All information exists for nothing other than
entertainment and general educational purposes. We are not registered trading advisors.
WWW.TRADERSWORLD.COM July, August. September 2023
2
WWW.TRADERSWORLD.COM July, August. September 2023
3
Contents
July, August, Septembet 2023 Issue #89
Will They Call This Forthcoming Event A Black Swan? Andrew
Pancholi 07
TradersWorld Magazine
Premium Subscription
Get everything we have for only $19.95 per year
Save 50% over our regular subscription of $39.95
A Case for recession or Depression Between 2025 and 2028 by
L. David Linsk 18
Bespoke Gann Maser Charts by Joharunes Sundberg 35
Octave Harmonics and Market Vecor Lineof Thrust by Alexander
Straker 42
7KH6LJQL¿FDQFHRI+LJK3UREDELOLW\7UDGLQJE\7KRPDV%DUPDQQ
49
Using Attractors to predict Price Movement b Sunny J. Harris 64
Adapt of Fail: Building the Mindset for Success in Trading by
Rande Howell 70
Fibonacci Secrets by Rob Mitchell 74
An Investing Strategy Silently Making Motivated People Wealthy
by Chris Vermeulen 78
W.D. Ganns Squaring of Time and Price by D.K. Burton 83
Decoding Investment Strategies with Heikin-Ashi by Dr. Keith
Wade 85
6 Key Factors for Superior Strategic Trading by Steve Wheeler
88
The Kicker Signal by Stephen W. Bigalow 100
Delorean Time Trading b Rick Versteeg 109
QUARTERLY MAGAZINE SUBSCRIPTION
Read articles explaining classical trading
techniques, such as W.D. Gann, Elliott Wave,
astro-trading as well as modern technical
analysis explaining indicators in eSignal,
NinjaTraders, MetaStock & Market Analyst.
COMPLETE BACK ISSUES OF TRADERS
WORLD Magazine (ISSUES 1-84)
You also get our complete archive of 84 back
issues from 1986 to present. This, contains
articles, product reviews, hundreds of chart
examples, how-to-trade articles and much
format, which you can read online anytime.
In every issue, you get the information
you need to trade the markets better with
charting, astro, cycles, oscillator tools.
Works for stocks, bonds, futures, options.
60-Day Money Back Guarantee
CLICK TO SUBSCRIBE
1-417-414-0799
www.TradersWorld.com
www.TradersWorldOnlineExpo.com
WWW.TRADERSWORLD.COM July, August. September 2023
4
WWW.TRADERSWORLD.COM July, August. September 2023
5
WWW.TRADERSWORLD.COM July, August. September 2023
6
tŝůůdŚĞLJĂůůdŚŝƐ&ŽƌƚŚĐŽŵŝŶŐ
ǀĞŶƚ><^tE͍
LJŶĚƌĞǁWĂŶĐŚŽůŝ
ĂƐĞĚŽŶĂDĂƌŬĞƚdŝŵŝŶŐZĞƉŽƌƚĞĚŝƚŽƌŝĂůĨŝƌƐƚƉƵďůŝƐŚĞĚϭƐƚ:ƵŶĞϮϬϮϯ
dŚŝƐŵŽŶƚŚ͕/ǁĂŶƚƚŽƐŚĂƌĞƐŽŵĞŝŶĐƌĞĚŝďůLJǀĂůƵĂďůĞĐLJĐůĞƐǁŝƚŚLJŽƵ͘
dŚŝƐƐŚŽƵůĚŐŝǀĞLJŽƵĂƐŝŐŶŝĨŝĐĂŶƚĂĚǀĂŶƚĂŐĞŝŶLJŽƵƌƉŽƌƚĨŽůŝŽŵĂŶĂŐĞŵĞŶƚ͘
KƵƌƐLJƐƚĞŵŝƐĨůĂŐŐŝŶŐƵƉĂƐŝŐŶŝĨŝĐĂŶƚŽƉƉŽƌƚƵŶŝƚLJƚŚĂƚĐŽƵůĚǁĞůůƉƌŽǀŝĚĞůŝĨĞĐŚĂŶŐŝŶŐƌĞǁĂƌĚƐŝĨ
ŵĂŶĂŐĞĚĐŽƌƌĞĐƚůLJ͘
ƐďƌŝĞĨĞĚƚŽƉƌŝǀĂƚĞĐůŝĞŶƚƐĂĨĞǁŵŽŶƚŚƐĂŐŽ͕ǁĞĂƌĞĂƉƉƌŽĂĐŚŝŶŐŽŶĞŽĨƚŚĞŵŽƐƚŝŵƉŽƌƚĂŶƚƚƵƌŶŝŶŐ
ƉŽŝŶƚƐŝŶĂƉĂƌƚŝĐƵůĂƌĐŽŵƉůĞdž͘DŽƌĞŽŶƚŚĞƐƉĞĐŝĮĐƚŝŵŝŶŐŽĨƚŚŝƐŝŶĂŵŽŵĞŶƚ͘
tĞĐĂŶĂůƐŽƌĞǀĞƌƐĞĞŶŐŝŶĞĞƌƚŚĞƐŝƚƵĂƚŝŽŶĂŶĚĚĞĚƵĐĞǁŚĂƚƉŽƚĞŶƚŝĂůůLJůŝĞƐĂŚĞĂĚǁŝƚŚŝŶƚŚĞ
ŐĞŽƉŽůŝƚŝĐĂůƐƉŚĞƌĞŽĨŽƵƌǁŽƌůĚ͘
ƐĞǀĞƌ͕ůĞƚƵƐďĞŐŝŶǁŝƚŚƚŚĞƐƵƉĞƌůŽŶŐͲƚĞƌŵĐLJĐůĞƐĂŶĚƚŚĞŶŚŽŶĞƚŚŝŶŐƐĚŽǁŶƚŽƚŚĞĐůŽƐĞƐƚǁĞĞŬůLJ
ĂŶĚĚĂŝůLJĐLJĐůĞƐƉŽƐƐŝďůĞ͘
^ƚĂƌƚŝŶŐǁŝƚŚƚŚĞďŝŐƉŝĐƚƵƌĞ͕ǁĞĐĂŶƐĞĞ͕ŽǀĞƌƚŚĞůĂƐƚϯϬϬLJĞĂƌƐ͕ƚŚĂƚƚŚĞƌĞŚĂǀĞďĞĞŶƐĞǀĞƌĂůŵĂũŽƌ
ĐŽŵŵŽĚŝƚLJŵƐ͘
,ĞƌĞŝƐƚŚĞĚĂƚĂĨƌŽŵƚŚĞ&ŽƵŶĚĂƚŝŽŶĨŽƌƚŚĞ^ƚƵĚLJŽĨLJĐůĞƐŐŽŝŶŐĂůůƚŚĞǁĂLJďĂĐŬƚŽϭϳϰϵ͘
WWW.TRADERSWORLD.COM July, August. September 2023
7
^ĞǀĞƌĂůƉŽŝŶƚƐĂƌĞŽĨŝŶƚĞƌĞƐƚ͘
ZĞŐƵůĂƌĨŽůůŽǁĞƌƐŽĨƚŚĞDĂƌŬĞƚdŝŵŝŶŐZĞƉŽƌƚǁŝůůŬŶŽǁĂďŽƵƚƚŚĞǀĞƌLJĐůĞĂƌǁĂƌĐLJĐůĞƐ͘dŚĞƐĞ
ŵĂƚŚĞŵĂƚŝĐĂůƉĂƚƚĞƌŶƐĂƌĞĐůĞĂƌůLJǁŽǀĞŶŝŶƚŽƚŚŝƐĐŚĂƌƚ͘
tŚĂƚǁĞƐĞĞŝƐƚŚĂƚĐŽŵŵŽĚŝƚLJŵƐƚĞŶĚƚŽĐŽŝŶĐŝĚĞǁŝƚŚǁĂƌƐ͘
dŚĞŵƚŚĞŶƚĞŶĚƐƚŽĐŽŶƚŝŶƵĞŽŶĂĨƚĞƌƚŚĞĞŶĚŝŶŐŽĨƚŚĞĂƉƉƌŽƉƌŝĂƚĞǁĂƌƐ͘
dŚĞĮƌƐƚƉŽŝŶƚŽĨŝŶƚĞƌĞƐƚŝƐƚŚĞĐŽŵŵŽĚŝƚLJŵƚŚĂƚƉĞĂŬĞĚĂƌŽƵŶĚϭϳϴϭ͘
dŚĞLJĞĂƌϭϳϴϭƐĂǁƚŚĞĂƚƚůĞŽĨzŽƌŬƚŽǁŶǁŚŝĐŚĞĨĨĞĐƚŝǀĞůLJďƌŽƵŐŚƚƚŚĞŵĞƌŝĐĂŶZĞǀŽůƵƚŝŽŶƚŽ
ĐŽŵƉůĞƚŝŽŶǁŝƚŚƚŚĞƌŝƚŝƐŚŚĂǀŝŶŐďĞĞŶĞdžƉĞůůĞĚĨƌŽŵŵĞƌŝĐĂŶƐŽŝů͘
dŚĞƌĞĂĨƚĞƌ͕ǁĞƐĞĞƚŚĞĐŽŶĐůƵƐŝŽŶŽĨƚŚĞEĂƉŽůĞŽŶŝĐtĂƌƐůĞĂĚŝŶŐƚŽĂĐŽŵŵŽĚŝƚLJŵƚŚĂƚƉĞĂŬĞĚ
ƌŽƵŶĚĂďŽƵƚϭϴϭϴ͘dŚĞĚĞĐŝƐŝǀĞĂƚƚůĞŽĨtĂƚĞƌůŽŽǁĂƐĨŽƵŐŚƚŽŶ:ƵŶĞϭϴ͕ϭϴϭϱ͘
dŚĞhŶŝƚĞĚ^ƚĂƚĞƐŽĨŵĞƌŝĐĂƐĞĞƐŝƚƐĞůĨŝŶĐŝǀŝůǁĂƌʹEŽƌƚŚǀĞƌƐƵƐ^ŽƵƚŚʹďĞƚǁĞĞŶƚŚĞLJĞĂƌƐŽĨϭϴϲϭƚŽ
ϭϴϲϱ͘
EŽƚĞŚŽǁƐƚĞĞƉůLJĐŽŵŵŽĚŝƚLJƉƌŝĐĞƐƌŽƐĞŝŶƚŽƚŚĞƉĞĂŬƐƌĞůĂƚŝŶŐƚŽƚŚĞh^ZĞǀŽůƵƚŝŽŶĂƌLJtĂƌĂƐǁĞůůĂƐ
ƚŚĞh^ŝǀŝůtĂƌ͘'ƌĂŝŶƐĂŶĚĐŽƚƚŽŶǁĞƌĞŬĞLJŵŽǀĞƌƐ͘dŚĞƐĞĐŽŵŵŽĚŝƚŝĞƐǁĞƌĞƉƌŝĐĞĚĂŶĚƚƌĂĚĞĚŝŶ
ĚŽůůĂƌƐ͘
/ŶĨĂĐƚ͕ĐŽƚƚŽŶ͕ǁŚŝĐŚŚĂĚƉƌĞǀŝŽƵƐůLJďĞĞŶƚƌĂĚŝŶŐĂƚƚŚƌĞĞĐĞŶƚƐƉĞƌƉŽƵŶĚ͕ƚƌĂĚĞĚĂƚΨϭ͘ϴϵƉĞƌƉŽƵŶĚ
ŽŶϮϯƵŐƵƐƚϭϴϲϰ͘
WWW.TRADERSWORLD.COM July, August. September 2023
8
dŚŝƐƉĂƌƚŝĐƵůĂƌĐŽŵŵŽĚŝƚLJƐĂǁĂϲϬĨŽůĚŝŶĐƌĞĂƐĞŝŶƉƌŝĐĞ͘tŚLJ͍
/ƚǁĂƐƋƵŝƚĞƐŝŵƉůLJĂĐĂƐĞŽĨĚĞŵĂŶĚĂŶĚƐƵƉƉůLJ͘^ƵƉƉůLJĚƌŽƉƉĞĚƌĂƉŝĚůLJ͘
ůůƚŚĞŵĞŶŚĂĚůĞĨƚƚŚĞĐŽƚƚŽŶĨŝĞůĚƐĂŶĚǁĞĂƌĞŶŽǁĨŝŐŚƚŝŶŐĂǁĂƌ͘ĞŵĂŶĚǁĞŶƚƵƉĞdžƉŽŶĞŶƚŝĂůůLJ͘
tŚLJ͍
ĞĐĂƵƐĞĂůůƚŚŽƐĞŵĞŶŶĞĞĚĞĚƵŶŝĨŽƌŵƐƚŚĂƚǁĞƌĞŵĂĚĞĨƌŽŵĐŽƚƚŽŶ͘
dŚĞŶĞdžƚŵĂũŽƌŵƉĞĂŬĞĚŝŶƚŚĞLJĞĂƌϭϵϮϬ͘
dŚŝƐĨŽůůŽǁĞĚƚŚĞ&ŝƌƐƚtŽƌůĚtĂƌǁŚŝĐŚĞŶĚĞĚŝŶϭϵϭϴ͘dŚĞŝŶĞƌƚŝĂŽĨƚŚĞŝŶĨůĂƚŝŽŶĂƌLJĐŽƐƚƐŽĨǁĂƌ
ĐŽŶƚŝŶƵĞĚĂůůƚŚĞǁĂLJƚŚƌŽƵŐŚŝŶƚŽϭϵϮϬ͘
dŚŝƐĐŽŵŵŽĚŝƚLJŵǁĂƐĨŽůůŽǁĞĚďLJĨƵƌƚŚĞƌĐŽŵŵŽĚŝƚLJƉƌŝĐĞŵĂŶŝĂƚŚĂƚƉĞĂŬĞĚĂƌŽƵŶĚϭϵϰϲ͘dŚŝƐ
ƚŝŵĞƚŚĞǁŽƌůĚŚĂĚďĞĞŶĂƚǁĂƌͲtŽƌůĚtĂƌ//͘
dŚŝƐǁĂƐĂǁĂƌƚŚĂƚůĂƐƚĞĚƐŝdžLJĞĂƌƐĂŶĚŽŶĞĚĂLJĐŽŵŝŶŐƚŽĂĐŽŶĐůƵƐŝŽŶŽŶϮ^ĞƉƚĞŵďĞƌϭϵϰϱ͘
EŽƚĞŚŽǁǁĞĂƌĞŝŶƚŚĞϴϮƚŽϴϰLJĞĂƌtĂƌĐLJĐůĞĨƌŽŵƚŚĞϭϵϯϵŽƵƚďƌĞĂŬŽĨƚŚĞ^ĞĐŽŶĚtŽƌůĚtĂƌ͘
,ĞŶĐĞ͕ƚŚĞŝŵƉĂĐƚŽĨƚŚĞĞǀĞŶƚƐŝŶhŬƌĂŝŶĞĂƐǁĞůůĂƐƚŚĞƌŝƐĞŽĨŚŝŶĂĂŶĚŝƚƐƉŽǁĞƌƐŚŽƵůĚŶŽƚďĞ
ƵŶĚĞƌĞƐƚŝŵĂƚĞĚ͘
dŚĞŬĞLJƉŽŝŶƚ/͛ŵƚƌLJŝŶŐƚŽŵĂŬĞŚĞƌĞŝƐƚŚĂƚ/ďĞůŝĞǀĞǁĞĐŽƵůĚďĞŽŶƚŚĞǀĞƌŐĞŽĨĂ
ƐŝŐŶŝĨŝĐĂŶƚĐŽŵŵŽĚŝƚLJŵŽǀĞƚŽƚŚĞƵƉƐŝĚĞͲŽŶĞƚŚĂƚĐŽŝŶĐŝĚĞƐǁŝƚŚĞƐĐĂůĂƚŝŶŐƚĞŶƐŝŽŶƐ͘
ĞĨŽƌĞǁĞůŽŽŬĂƚƚŚŝƐ͕/ũƵƐƚǁĂŶƚƚŽƉŽŝŶƚŽƵƚĂŶŽƚŚĞƌŽďƐĞƌǀĂƚŝŽŶĨƌŽŵƚŚŝƐĐŚĂƌƚ͘
WWW.TRADERSWORLD.COM July, August. September 2023
9
KďƐĞƌǀĞƚŚĞůŽǁƐ͘
tĞƐĞĞƐŝŐŶŝĨŝĐĂŶƚůŽǁƐĂƌŽƵŶĚϭϳϴϵĂŶĚϭϳϵϯ͘
ƚƚŚŝƐƉŽŝŶƚŝŶƚŝŵĞƚŚĞƉĞŽƉůĞŽĨ&ƌĂŶĐĞǁĞƌĞĞŵďƌŽŝůĞĚŝŶƚŚĞ&ƌĞŶĐŚZĞǀŽůƵƚŝŽŶƐĞĞŬŝŶŐƚŚĞ
ĚĞƉŽƐŝŶŐŽĨƚŚĞŝƌĂƵƚŽĐƌĂƚŝĐĂŶĚƉƌŽŇŝŐĂƚĞŵŽŶĂƌĐŚLJ͘
dŚĞŶĞdžƚŝŵƉŽƌƚĂŶƚůŽǁƐĐĂŵĞŝŶĚƵƌŝŶŐƚŚĞϭϴϰϬƐ͘
dŚĞLJĞĂƌϭϴϰϴǁĂƐŬŶŽǁŶĂƐƚŚĞLJĞĂƌŽĨƌĞǀŽůƵƚŝŽŶĂĐƌŽƐƐ
ƵƌŽƉĞ͘
ǀĞƌLJŵĂũŽƌ
ƵƌŽƉĞĂŶŶĂƚŝŽŶƐĂǁĂ
ĐŚĂůůĞŶŐĞƚŽŝƚƐƌƵůĞƌƐ͘
tŚĂƚĐĂƵƐĞĚƚŚŝƐ͍
KŶ&ĞďƌƵĂƌLJϮϭ͕ϭϴϰϴ<ĂƌůDĂƌdž͕ƚŽŐĞƚŚĞƌǁŝƚŚŚŝƐĨƌŝĞŶĚ&ƌŝĞĚƌŝĐŚ
ŶŐĞůƐƉƵďůŝƐŚĞĚƚŚĞŽŵŵƵŶŝƐƚ
ŵĂŶŝĨĞƐƚŽ͘dŚĞƌĞƐƚŝƐůŝƚĞƌĂůůLJŚŝƐƚŽƌLJ͘
tŝƚŚƌĞŐĂƌĚƐƚŽƚŚĞůŽǁŝŶƚŚĞϭϴϵϬƐ͕ĞǀĞŶƚƐǁĞƌĞŵŽƌĞƐƵďƚůĞ͘dŚĞhŶŝƚĞĚ^ƚĂƚĞƐǁĞŶƚƚŚƌŽƵŐŚƐĞǀĞƌĞ
ĞĐŽŶŽŵŝĐĚĞƉƌĞƐƐŝŽŶĨŽůůŽǁŝŶŐƚŚĞƉĂŶŝĐŽĨϭϴϵϯ͘
/ƚǁĂƐƚŚŝƐĞĐŽŶŽŵŝĐĐƌŝƐŝƐƚŚĂƚǁĂƐƌĞƐƉŽŶƐŝďůĞĨŽƌďƌŝŶŐŝŶŐƚŚĞ'ŝůĚĞĚŐĞƚŽĂĐůŽƐĞ͘
dŚĞŶĂƚŝŽŶƐĂǁĐŽŶƐŝĚĞƌĂďůĞƵŶƌĞƐƚĐƵůŵŝŶĂƚŝŶŐŝŶŶƵŵĞƌŽƵƐƐƚƌŝŬĞƐŝŶŝƚƐŝŶĚƵƐƚƌŝĂůǁŽƌŬĨŽƌĐĞ͘
dŚĞůŽǁŝŶϭϵϯϯǁĂƐƐŝŐŶŝĨŝĐĂŶƚ͘
WWW.TRADERSWORLD.COM July, August. September 2023
10
dŚĞhŶŝƚĞĚ^ƚĂƚĞƐǁĂƐŝŶƚŚĞĚĞƉƚŚƐŽĨƚŚĞ'ƌĞĂƚĞƉƌĞƐƐŝŽŶ͘dŚŝƐŚĂĚďĞĞŶĨƵƌƚŚĞƌĞdžĂĐĞƌďĂƚĞĚďLJƚŚĞ
ĚƵƐƚďŽǁůǁŚŝĐŚĚĞĐŝŵĂƚĞĚƚŚĞƉƌĂŝƌŝĞƐĂŶĚŝƚƐĐƌŽƉƐ͘ŐĂŝŶ͕ǁĞŚĂǀĞĐŽǀĞƌĞĚƚŚĂƚŝŶĂƌĞĐĞŶƚĞĚŝƚŝŽŶŽĨ
ƚŚĞDĂƌŬĞƚdŝŵŝŶŐZĞƉŽƌƚ͘
DĞĂŶǁŚŝůĞ͕ŝŶ'ĞƌŵĂŶLJ͕ƚŚĞŶĞǁůLJĂƉƉŽŝŶƚĞĚŚĂŶĐĞůůŽƌ͕ĚŽůĨ,ŝƚůĞƌ͕ďĞŐŝŶƐƚŽŐĂŝŶŵŽŵĞŶƚƵŵĂƐƚŚĞ
'ĞƌŵĂŶƉŽƉƵůĂĐĞŚĂĚŚĂĚĞŶŽƵŐŚŽĨƚŚĞƌĞƉĂƌĂƚŝŽŶƐĨŽƌĐĞĚƵƉŽŶƚŚĞŵ͘
KŶĞŽĨƚŚĞŽĨĨƐŚŽŽƚƐŽĨƚŚŝƐŚĂĚďĞĞŶƚŚĞŚLJƉĞƌŝŶĨůĂƚŝŽŶƐĞĞŶĚƵƌŝŶŐƚŚĞtĞŝŵĂƌZĞƉƵďůŝĐ͘
dŚĞƐƵďƐĞƋƵĞŶƚĨůĂƚƚĞƌůŽǁƐĐŽŵĞŝŶĚƵƌŝŶŐƚŚĞϭϵϲϬƐ͘/ŶƚŚŝƐƚŝŵĞƉĞƌŝŽĚǁĞƐĞĞĂƐŽĐŝĂůƌĞǀŽůƵƚŝŽŶ͘
tĞƐĞĞƚŚĞŚŝƉƉŝĞƐĐĞŶĞŽĨƚŚĞϭϵϲϬƐĂƐǁĞůůĂƐƚŚĞŽďũĞĐƚŝŽŶƐƚŽƚŚĞĚƌĂĨƚĂŶĚsŝĞƚŶĂŵtĂƌ͘
tŝƚŚƚŚĞƐƵƉĞƌůŽŶŐͲƚĞƌŵĐLJĐůĞƐĂƐĂďĂĐŬĚƌŽƉůĞƚ͛ƐŶŽǁŵŽǀĞŝŶƚŽƚŚĞƉƌĞƐĞŶƚ͘
dŚĞDĂƌŬĞƚdŝŵŝŶŐZĞƉŽƌƚĚŽĞƐŶ͛ƚƵƐƵĂůůLJůŽŽŬĂƚƚŚĞĐŽŵŵŽĚŝƚLJĐLJĐůĞƐʹƚŚŝƐǁĞĚŽŽŶĂƉĞƌƐŽŶĂůďĂƐŝƐ
ǁŝƚŚƉƌŝǀĂƚĞĐůŝĞŶƚƐĂŶĚǁŝƚŚŵĞŵďĞƌƐŽĨƚŚĞDĂƐƚĞƌdƌĂĚĞƌƐŽƵƌƐĞĂŶĚWƌŽĨĞƐƐŝŽŶĂůWůĂƚĨŽƌŵ͘
dĂŬĞĂůŽŽŬĂƚƚŚŝƐŵŽŶƚŚůLJĐŚĂƌƚŽĨƚŚĞdZͬZ/ŶĚĞdž͘
hŶĚĞƌƚŚŝƐ͕LJŽƵǁŝůůƐĞĞŽƵƌW&KƐƵƉĞƌůŽŶŐͲƚĞƌŵŚŝƐƚŽŐƌĂŵƐ͘
&ŝƌƐƚůLJ͕ŶŽƚĞŚŽǁƚŚĞƉƌĞǀŝŽƵƐƉĞĂŬƐŚĂǀĞĐŽŝŶĐŝĚĞĚǁŝƚŚƐŝŐŶŝĨŝĐĂŶƚƌĞǀĞƌƐĂůƐŝŶƚŚŝƐŝŶĚĞdž͘
WWW.TRADERSWORLD.COM July, August. September 2023
11
EĞdžƚ͕ŶŽƚĞƚŚĂƚǁĞĂƌĞĂƉƉƌŽĂĐŚŝŶŐĂǀĞƌLJŝŵƉŽƌƚĂŶƚƉĞĂŬƐƵŐŐĞƐƚŝŶŐƚŚĂƚǁĞĂƌĞĂďŽƵƚƚŽƐĞĞĂŶ
ŝŵƉŽƌƚĂŶƚƌĞǀĞƌƐĂů͘
ůĞĂƌůLJ͕ƚŚĞŽĚĚƐǁŽƵůĚĨĂǀŽƵƌĂůŽǁĐŽŵŝŶŐŝŶ͘
EŽǁƚŚŝƐŝƐĂŵŽŶƚŚůLJĐŚĂƌƚĂŶĚƚŚĞƌĞĨŽƌĞǁĞŶĞĞĚƚŽďĞŽŶĂůĞƌƚ͘
dŚĞŬĞLJŵŽŶƚŚŝƐ:ƵůLJ͘
ĨĨĞĐƚŝǀĞůLJ͕ŐŝǀĞŶƚŚĂƚǁĞƵƐƵĂůůLJůŽŽŬŽŶĞďĂƌĞŝƚŚĞƌƐŝĚĞŽĨƚŚĞƉĞĂŬ͕ǁĞŶŽǁŶĞĞĚƚŽďĞŽŶĂůĞƌƚĨŽƌĂ
ƐŝŐŶŝĨŝĐĂŶƚŝŶĨůĞĐƚŝŽŶƉŽŝŶƚ͘
ŶĚŚĞŶĐĞ/ǁĂŶƚƚŽƌĂŝƐĞƚŚŝƐƐĐĞŶĂƌŝŽƌŝŐŚƚŶŽǁƌĂƚŚĞƌƚŚĂŶůĞĂǀĞŝƚĂƐƚŚĞŵĂŝŶƐƚŽƌLJĨŽƌŶĞdžƚŵŽŶƚŚ͘
<ĞLJƚŝŵĞǁŝŶĚŽǁƐŝŶĐůƵĚĞϭϯƚŚƚŽϭϱƚŚŽĨ:ƵŶĞ͕ϮϯƌĚ:ƵŶĞĂŶĚŝŶ:ƵůLJ͕ũƵƐƚƉƌŝŽƌƚŽ/ŶĚĞƉĞŶĚĞŶĐĞĂLJ
ŚŽůŝĚĂLJĂŶĚƚŚĞŶƚŚĞǀĞƌLJůĂƐƚǁĞĞŬŽĨ:ƵůLJ͘
dŚŝƐůĂƚƚĞƌƉŽŝŶƚŝƐƚŚĞƐƚƌŽŶŐĞƐƚďƵƚǁĞŶĞĞĚƚŽďĞĂůĞƌƚĨŽƌĚĂƚĞƐďĞĨŽƌĞƚŚĞŶ͘
/ŶƚŚĞƐŚŽƌƚƚĞƌŵ͕ďŽƚƚŽŵŝŶŐƉƌŽĐĞƐƐĞƐƌĂƌĞůLJƚĂŬĞƉůĂĐĞŽǀĞƌŶŝŐŚƚ͘dŚĞLJƚĞŶĚƚŽƉůĂLJŽƵƚŽǀĞƌĂĨĞǁ
ǁĞĞŬƐ͘
tŚĂƚĐŽŶĐůƵƐŝŽŶƐĐĂŶǁĞĚƌĂǁĨƌŽŵƚŚŝƐ͍
/ĨǁĞƐĞĞĂƐŝŐŶŝĨŝĐĂŶƚŵŝŶĐŽŵŵŽĚŝƚLJŵĂƌŬĞƚƐ͕ƚŚĞŶŶŽƚĞƚŚĂƚƚŚŝƐŚĂƐŚŝƐƚŽƌŝĐĂůůLJĐŽƌƌĞůĂƚĞĚǁŝƚŚ
ƚŚĞĞƐĐĂůĂƚŝŽŶŽĨǁĂƌĐLJĐůĞƐĂŶĚŐĞŽƉŽůŝƚŝĐĂůƚĞŶƐŝŽŶ͘
/ƚŝƐƉŽƐƐŝďůĞƚŚĂƚǁĞƐĞĞĂŐĞŽƉŽůŝƚŝĐĂůĞǀĞŶƚƚŚĂƚƚƌŝŐŐĞƌƐƚŚŝƐ͘KƚŚĞƌƐǁŚŽĚŽŶ͛ƚďĞůŝĞǀĞŝŶĐLJĐůĞƐƌĞĨĞƌ
ƚŽƚŚĞƐĞŝŶĐŝĚĞŶƚƐĂƐ͞ůĂĐŬ^ǁĂŶ͟ĞǀĞŶƚƐ͘
LJƚŚĞŝƌǀĞƌLJŽǁŶŶĂƚƵƌĞĐŽŵŵŽĚŝƚLJĐLJĐůĞƐĂƌĞŝŶĨůĂƚŝŽŶĂƌLJ͘dŚŝƐƉŽƚĞŶƚŝĂůƐĞƚƵƉĐŽƵůĚĨƵĞůŝŶĨůĂƚŝŽŶ
ĨƵƌƚŚĞƌ͘
WƌĞƐĞŶƚůLJ͕ŵŽƐƚĐŽŵŵŽĚŝƚŝĞƐĂƌĞƚƌĂĚĞĚŝŶh^ĚŽůůĂƌƐ͘ŽƵůĚƚŚŝƐƉŽƚĞŶƚŝĂůŵŝŶĐŽŵŵŽĚŝƚLJƉƌŝĐĞƐ
ƐŝŐŶŝĨLJĂƐŝŐŶŝĨŝĐĂŶƚǁĞĂŬĞŶŝŶŐŽĨƚŚĞĚŽůůĂƌ͍>ĂƐƚŵŽŶƚŚ͛ƐDĂƌŬĞƚdŝŵŝŶŐZĞƉŽƌƚĐŽǀĞƌĞĚƚŚĞƐƵƉĞƌůŽŶŐͲ
ƚĞƌŵĐLJĐůĞƐƚŚĂƚůŽŽŬĂƚĚĞͲĚŽůůĂƌŝƐĂƚŝŽŶ͘
/ƚŝƐĞŶƚŝƌĞůLJƉŽƐƐŝďůĞƚŚĂƚŽƚŚĞƌĐƵƌƌĞŶĐŝĞƐƉŽƚĞŶƚŝĂůůLJďĞĐŽŵĞƚŚĞďĂƐĞĨŽƌĐĞƌƚĂŝŶƚLJƉĞƐŽĨĐŽŵŵŽĚŝƚLJ
ƚƌĂĚŝŶŐ͘
KƚŚĞƌĨĂĐƚŽƌƐƚŽĐŽŶƐŝĚĞƌŝŶĐůƵĚĞƚŚĞƉŽƚĞŶƚŝĂůƌĞƚƵƌŶŽĨƚŚĞĚƵƐƚďŽǁůĐƌŝƐŝƐ͘dŚŝƐǁŽƵůĚŚĞĂǀŝůLJŝŵƉĂĐƚ
ƚŚĞŐƌĂŝŶƐƚŚĂƚĂƌĞŐƌŽǁŶŝŶƚŚĞhŶŝƚĞĚ^ƚĂƚĞƐ͘dŚŝƐŝƐĨŽůůŽǁŝŶŐƚŚĞϵϬLJĞĂƌƌŽĂĚŵĂƉĞdžĂĐƚůLJ͘
ZĞŐĂƌĚůĞƐƐ͕ǁĞŶĞĞĚƚŽďĞŽŶĂůĞƌƚĨŽƌƐŝŐŶŝĨŝĐĂŶƚĚŝƌĞĐƚŝŽŶĂůĐŚĂŶŐĞƐĂĐƌŽƐƐĂƌĂŶŐĞŽĨŵĂƌŬĞƚƐ͘
/ƚŝƐŽŶƚŚŝƐďĂƐŝƐǁĞŶŽǁnjŽŽŵŝŶƚŽƚŚĞĚĂŝůLJW&KĚĂƚĞƐǁŝƚŚĂƌĞĐƌĞĂƚĞĚƵƐŝŶŐĚĂŝůLJĐLJĐůĞƐ͘dŚĞĂŝŵŽĨ
ƚŚĞDĂƌŬĞƚdŝŵŝŶŐZĞƉŽƌƚŝƐƚŽƐĞĞŬ^hW
ZDZKĐLJĐůĞƐĂŶĚŚŽŶĞƚŚĞŵĚŽǁŶƚŽŝŶĚŝǀŝĚƵĂůĚĂLJƐ͘
WWW.TRADERSWORLD.COM July, August. September 2023
12
/ďĞůŝĞǀĞƚŚĂƚt'ĂŶŶĚŝĚĞdžĂĐƚůLJƚŚŝƐĂŶĚŚĂǀŝŶŐŚĞůƉĞĚdŚĞ:ŽŶĞƐĨĂŵŝůLJǁŚŽŽǁŶƚŚĞǁŽƌŬƐŽĨt͘͘
'ĂŶŶƚŚĞƌĞŝƐĞǀŝĚĞŶĐĞŽĨƚŚŝƐ͘/ƚŝƐĂůƐŽǀĞŝůĞĚŝŶŚŝƐŬdƵŶŶĞůdŚƌƵdŚĞŝƌ͘
tĞĚŽŶŽƚŬŶŽǁĞdžĂĐƚůLJǁŚĂƚt'ĂŶŶǁĂƐĚŽŝŶŐ͘
dĂŬĞĂůŽŽŬĂƚƚŚŝƐĐŚĂƌƚ͘
KƵƌƌĞƐĞĂƌĐŚĂŶĚƉƌŽŐƌĂŵŵŝŶŐŚĂƐůĞĚƵƐƚŽĐƌĞĂƚĞƚŚĞƐĞŚŝƐƚŽŐƌĂŵƐ͘
dŚŝƐŝƐŶŽƚǀŽůƵŵĞͲŝƚŝƐŽƵƌƉƌŽƉƌŝĞƚĂƌLJWƌŽĨŝƚ&ŝŶĚŝŶŐKƌĂĐůĞƐLJƐƚĞŵ͘
dŚŝƐŝĚĞŶƚŝĨŝĞƐĨƵƚƵƌĞŵĂƌŬĞƚƚƵƌŶƉŽŝŶƚƐ͘
tŚĞŶĞǀĞƌǁĞƐĞĞĂƐƉŝŬĞĐŽŵŝŶŐƵƉǁĞĐĂŶĞdžƉĞĐƚĂƚƌĞŶĚĐŚĂŶŐĞͲƐĞĞƚŚĞŽŶĞƐƚŽƚŚĞƌŝŐŚƚŚĂŶĚƐŝĚĞ͘
tŚLJ͍ĞĐĂƵƐĞƚŚŝƐŝƐǁŚĞƌĞĂƐĞƌŝĞƐŽĨŵĂƚŚĞŵĂƚŝĐĂůĐLJĐůĞƐĐŽŵĞƚŽŐĞƚŚĞƌ͘
^ŽŚŽǁĚŽǁĞƵƐĞƚŚŝƐ͍ƐǁĞĂƉƉƌŽĂĐŚƚŚĞƐĞƚŝŵĞǁŝŶĚŽǁƐǁĞƉƌŽƚĞĐƚŽƉĞŶƚƌĞŶĚŝŶŐƉŽƐŝƚŝŽŶƐĂŶĚ
ƚĂŬĞƉƌŽĨŝƚƐ͘
dŚŝƐŚĞůƉƐŽƉƚŝŵŝnjĞƌŝƐŬĂŶĚŐŝǀĞƐLJŽƵĂĚŝƐƚŝŶĐƚĞĚŐĞ͘:HXVHDVHULHVRIWKHVHF\FOHSDWWHUQVWR
LGHQWLI\ERWKORQJWHUPDQGVKRUWWHUPWXUQLQJSRLQWV
,ĞƌĞŝƐĂŶĞdžĂŵƉůĞƉĂŐĞĨƌŽŵƚŚĞ:ƵŶĞϮϬϮϯDĂƌŬĞƚdŝŵŝŶŐZĞƉŽƌƚ͘
WWW.TRADERSWORLD.COM July, August. September 2023
13
dŚĞŚŝƐƚŽŐƌĂŵƐĂƌĞŝŶƚĞƌƉƌĞƚĞĚĨŽƌLJŽƵĂŶĚƚŚĞŬĞLJĚĂƚĞƐĂƌĞŐŝǀĞŶ͘tĞĂůƐŽŝĚĞŶƚŝĨLJƚŚĞƐƚƌŽŶŐĞƌ
ǁĞĞŬůLJĂŶĚŵŽŶƚŚůLJĐLJĐůĞƐ͘
tŚĞŶĂŵŽŶƚŚůLJĐLJĐůĞĨĂůůƐǁŝƚŚŝŶĂǁĞĞŬůLJĐLJĐůĞ͕ǁĞŽĨƚĞŶŐĞƚĂƐŝŐŶŝĨŝĐĂŶƚƚƌĞŶĚĐŚĂŶŐĞĂŶĚƚŚŝƐŝƐƚŚĞ
ŬĞLJƚŽŵĂƌŬĞƚƚŝŵŝŶŐ͘
WWW.TRADERSWORLD.COM July, August. September 2023
14
^ŽǁŚŽĞdžĂĐƚůLJŝƐƚŚĞDĂƌŬĞƚdŝŵŝŶŐZĞƉŽƌƚĨŽƌ͍
x
x
x
x
x
x
x
x
x
/ƚŝƐĨŽƌƚŚĞƚƌĂĚĞƌůŽŽŬŝŶŐƚŽƐŚĂƌƉĞŶƚŚĞŝƌĞŶƚƌLJĂŶĚĞdžŝƚƉŽŝŶƚƐ͘
/ƚŝƐĨŽƌƚŚŽƐĞǁŚŽƐĞĞůŝŵŝƚĂƚŝŽŶƐŝŶƚĞĐŚŶŝĐĂůĂŶĂůLJƐŝƐ͘
/ƚŝƐĨŽƌƚŚĞƉŽƌƚĨŽůŝŽŵĂŶĂŐĞƌǁĂŶƚŝŶŐĂŶĞĚŐĞƚŚƌŽƵŐŚŵĂƌŬĞƚƚŝŵŝŶŐ͘
&ŽƌĂŶLJŽŶĞǁŚŽďĞůŝĞǀĞƐƚŚĂƚŵĂƚŚĞŵĂƚŝĐĂůĐLJĐůĞƐƌĞƉĞĂƚůŝŬĞĐůŽĐŬǁŽƌŬ͘
dŚŝƐŝƐĨŽƌƚŚĞĨƌƵƐƚƌĂƚĞĚŝŶǀĞƐƚŽƌǁŚŽŬĞĞƉƐƌĂĐŬŝŶŐƵƉůŽƐƐĂĨƚĞƌůŽƐƐ͘
/ƚŝƐĨŽƌƚŚĞŶĞǁƚƌĂĚĞƌƐǁŚŽĐƵƚƚŚĞŝƌǁŝŶŶĞƌƐƐŚŽƌƚ͘
/ƚŝƐĨŽƌƚŚĞŝŶǀĞƐƚŽƌĐŽŶĨƵƐĞĚďLJĨƵŶĚĂŵĞŶƚĂůƐƚŽƌŝĞƐ͘
/ƚŝƐĨŽƌƐǁŝŶŐƚƌĂĚĞƌƐƐƚƌƵŐŐůŝŶŐǁŝƚŚŽǀĞƌƚƌĂĚŝŶŐ͘
dŚŝƐŝƐĨŽƌĂŶLJŽŶĞůŽŽŬŝŶŐƚŽƚĂŬĞĐŽŶƚƌŽůŽĨƚŚĞŝƌƌĞƚŝƌĞŵĞŶƚĂŶĚŽǁŶĨŝŶĂŶĐŝĂůĚĞƐƚŝŶLJ͘
ůůƚŚŝƐŝŶĨŽƌŵĂƚŝŽŶĂŶĚƚŚĞŚŝƐƚŽŐƌĂŵƐĂƌĞƉƌŽǀŝĚĞĚĞǀĞƌLJŵŽŶƚŚŝŶƚŚĞDĂƌŬĞƚdŝŵŝŶŐZĞƉŽƌƚ͘
dŚĞƌĞƉŽƌƚĐŽǀĞƌƐƚŚĞ^ΘWϱϬϬ/ŶĚĞdž͕ƌƵĚĞKŝů͕'ŽůĚ͕ŽůůĂƌ/ŶĚĞdž͕
ƵƌŽĂŶĚŝƚĐŽŝŶ͘tĞĂůƐŽ
ůŽŽŬĂƚĨŽƌƚŚĐŽŵŝŶŐŐĞŽƉŽůŝƚŝĐĂůĐLJĐůĞƐƐŽƚŚĂƚǁĞĐĂŶďĞƉƌĞƉĂƌĞĚĨŽƌǁŚĂƚůŝĞƐĂŚĞĂĚ͘
ZĞĂĚĞƌƐŽĨƚŚŝƐǁŽƌŬǁĞƌĞĨŽƌĞǁĂƌŶĞĚĂďŽƵƚƚŚĞƉĂŶĚĞŵŝĐ͕ƚŚĞϮϬϮϮŵĂƌŬĞƚƚŽƉ͕ƚŚĞŵŝŶ
ŐƌĂŝŶƐĂŶĚŵƵĐŚŵƵĐŚŵŽƌĞ͘
dŚŝƐŝƐĐƌŝƚŝĐĂůŝŶĨŽƌŵĂƚŝŽŶĨŽƌƚŚŽƐĞǁŚŽǁĂŶƚƚŽŐĞƚĂĚĞĐŝƐŝǀĞĞĚŐĞŝŶƚƌĂĚŝŶŐĂŶĚŝŶǀĞƐƚŝŶŐ͘
zŽƵĐĂŶĨŝŶĚŽƵƚŵŽƌĞŚĞƌĞ͘
ŚƚƚƉƐ͗ͬͬǁƐϮϮϳ͘ŝƐƌĞĨĞƌ͘ĐŽŵͬŐŽͬDdZDͬůĂƌƌLJͬ
ŶĚƌĞǁWĂŶĐŚŽůŝŝƐƚŚĞĐƌĞĂƚŽƌŽĨƚŚĞDĂƌŬĞƚdŝŵŝŶŐZĞƉŽƌƚĂŶĚŝƐĐŽͲĂƵƚŚŽƌŽĨƚŚĞďĞƐƚƐĞůůĞƌĞƌŽ,ŽƵƌ͘
,ŝƐƉƵďůŝƐŚĞĚǁŽƌŬƐĨŽƌĞǁĂƌŶĞĚƉĞŽƉůĞŽĨƚŚĞĨŽƌƚŚĐŽŵŝŶŐƉĂŶĚĞŵŝĐďĂĐŬŝŶϮϬϭϴĂƐǁĞůůĂƐƚŚĞϮϬϮϬ
ĐƌĂƐŚĂŶĚƉƌĞĐŝƐĞůLJƚŝŵĞĚƚŚĂƚĂŶĚƚŚĞϮϬϮϮŵĂƌŬĞƚƚŽƉ͘,ĞĨŽƌĞƚŽůĚƚŚĞϮϬϬϬĞƋƵŝƚLJŚŝŐŚƐ͕ƚŚĞϮϬϬϳͲϬϴ
'ůŽďĂů&ŝŶĂŶĐŝĂůƌŝƐŝƐ͕ĂŶĚƚŚĞĐŽŵŵŽĚŝƚLJŵƐŽĨϮϬϬϴĂŶĚϮϬϭϬ͘ŶĚƌĞǁĂůƐŽƐƉĞĐŝĂůŝnjĞƐŝŶ
ŐĞŽƉŽůŝƚŝĐĂůĨŽƌĞĐĂƐƚŝŶŐƵƐŝŶŐŵĂƚŚĞŵĂƚŝĐĂůĐLJĐůĞƐ͘,ĞĐŽŶƐƵůƚƐƚŽƐŽŵĞŽĨƚŚĞůĂƌŐĞƐƚďĂŶŬƐĂŶĚ
ŝŶƐƚŝƚƵƚŝŽŶƐŝŶƚŚĞǁŽƌůĚĂŶĚĂĚǀŝƐĞƐŐŽǀĞƌŶŵĞŶƚĂŐĞŶĐŝĞƐĂŶĚƚŚĞŵŝůŝƚĂƌLJ͘,ĞƐŝƚƐŽŶƚŚĞďŽĂƌĚŽĨƚŚĞ
&ŽƵŶĚĂƚŝŽŶ&ŽƌdŚĞ^ƚƵĚLJŽĨLJĐůĞƐƐĞƚƵƉďLJƚŚĞh^WƌĞƐŝĚĞŶĐLJŝŶϭϵϰϭ͘
WWW.TRADERSWORLD.COM July, August. September 2023
15
NEW FINANCIAL MARKET ONLY WEBSITE!
IћѠѡіѡѢѡђȱќѓȱCќѠњќљќєіѐюљȱEѐќћќњіѐѠ
ѤѤѤǯCќѠњќEѐќћќњіѐѠǯѐќњ
MEMBERSHIP IS FREE0(0%(5',6&28176
ђѐќњђȱюћȱ ȱђњяђџȱ-
ђѡȱ ȱќќјѠ
ALL BOOKS NOW AVAILABLE AS PDFȂS
i
ќџљёȂѠȱђѠѡȱџѐѕіѣђȱќѓȱюџјђѡȱќќјѠӔ
ѕђȱ ќљёђћȱєђȱќѓȱђѐѕћіѐюљȱћюљѦѠіѠ
ѕђȱієєђѠѡȱіѠѡȱќѓȱȱіћюћѐіюљȱѠѡџќљќєѦӔ
ђѠѡȱёѣюћѐђёȱ юћћȱќѢџѠђѠȱќѢѡȱѡѕђџђӔ
юћћȱђюёіћєȱіѠѡ ӕȱџǯȱюѢњџіћєȱіѠѡѠ
ђѠђюџѐѕȱќќјѠȱќћȱюѤȱќѓȱіяџюѡіќћӔ
i
i
i
i
i
N E W D A N I E L T. F E R R E R A W E B S I T E !
ѤѤѤǯюћђџџђџюǯѐќњȱ
All Ferrera Work Collected in One Central Place
i Including All of DanȂs Articles Posted FREE!ȱ
i All Ferrera Books & Courses at BIG Discounts!
ȱ
NEW NON-MARKET ȱ ȱ ȱWEBSITE!
ѤѤѤǯюѐџђёѐіђћѐђ ћѠѡіѡѢѡђǯѐќњ
њђњяђџѠѕіѝȱіѠȱѓџђђӔȱȱȱȱȱȱȱȱȱѠѝђѐіюљȱњђњяђџȱёіѠѐќѢћѡѠӔ
ђѐќњђȱюȱ ȱђњяђџȱ- ђѡȱ ȱђќќјѠȱѓќџȱȱ
i
i
i
i
ȱ ȱ ȱȱ¢ȱȱȱȱȱǭȱǯ
The Sacred Science Translation Society is back to work!
ŗŘȱ ȱȱȱǷȱǰȱǯǯǯ
2 New Kayser Translations by Joscelyn Godwin & New Site!
NEW HANS KAYSER WEBSITE
ǯ ¢ǯȱ
,ඇඌඍංඍඎඍൾඈൿ&ඈඌආඈඅඈංർൺඅ(ർඈඇඈආංർඌ6ൺർඋൾൽ6ർංൾඇർൾ,ඇඌඍංඍඎඍൾ
ඐඐඐ&ඈඌආඈ(ർඈඇඈආංർඌർඈආඐඐඐ6ൺർඋൾൽ6ർංൾඇർൾ,ඇඌඍංඍඎඍൾർඈආ
,ඇඌඍංඍඎඍൾ#&ඈඌආඈ(ർඈඇඈආංർඌർඈආ,ඇඌඍංඍඎඍൾ#6ൺർඋൾൽ6ർංൾඇർൾ,ඇඌඍංඍඎඍൾർඈආ
7ඈඅඅ)උൾൾ6ൺආൾ3ඁඈඇൾൿඈඋ%ඈඍඁ,ඇඍൾඋඇൺඍංඈඇൺඅ
WWW.TRADERSWORLD.COM July, August. September 2023
16
PREDICT
THE
SLOPE
OF
EVERY TREND
TRADING WITH
SELENE’S CHARIOT
USING CELESTIAL MECHANICS
& ANCIENT GEOMETRY
BY SEAN ERIKSON
OUR MOST POPULAR ADVANCED ASTRO-BASED SWING-TRADING SYSTEM
CLICK HERE FOR FULL DETAILS, DESCRIPTION OF TOOLS & EXAMPLES...
THE DREAM ASTRO-TOOL KIT...
WHAT YOU WILL LEARN...
6HDQ (ULNVRQ D SURIHVVLRQDO IXQG PDQDJHU¶V
- HOW TO SQUARE A CHART
EUHDNWKURXJK DVWUR-WUDGLQJ FRXUVH XVHV &HOHVWLDO
0HFKDQLFV DQG $QFLHQW *HRPHWU\ WR SURMHFW LQ - HOW TO ACCURATELY PROJECT THE
DGYDQFHWKHEXACT SLOPEZLGWK OHQJWKRIHYHU\ EXACT SLOPE OF EVERY TREND!
WUHQGRQHYHU\WLPHIUDPHLQHYHU\PDUNHW6HULRXVO\ - HOW TO CREATE CHANNELS THAT WILL
LW5($//<'2(6WKDW
ALWAYS HOLD THE MARKET ACTION!
6HOHQH V WRROV DUH FORVHVW WR DQ $QGUHZV 3LWFKIRUN - HOW TO PROJECT THE TREND
H[FHSWWKDWWKH\DOZD\VZRUN7KHFHQWHUOLQHSURMHFWV TERMINATION POINT AT 75% ACCURACY
WKHH[DFWVORSHRIHYHU\WUHQGEVERY TIMEZKLOHWKH
FKDQQHOV FRQWDLQ WKH EUHDGWK RI EVERY PRYH $Q WITH A 2ND OPTION AT 25% ACCURACY!
- WHAT ASTRO FACTOR CONTROLS EVERY
AMAZING 7RRO
Read Author¶s Biography & Trading History Here«
TREND IN EVERY TIME FRAME!
:'Gൺඇඇ¶V-LൺඐඈൿVංൻඋൺඍංඈඇ-(එඉඅൺංඇൾൽ
THE SCIENCE BEHIND W. D. GANN’S SYSTEMS
THE LAW OF VIBRATION BY
THE PATTERNS & NUMBERS
EXPOSING THE UNDERLYING SECRETS
OF W.D. GANN & DR. BAUMRING
BY DR. LORRIE V. BENNETT
WHAT IS NUMBERS ABOUT? $IWHU-\HDUVRI
GHYHORSPHQW/RUULH V%HQQHWW V0DJQXP2SXVRQ
Gann's Secret Number System LVILQDOO\'21(
7KHSULQWYHUVLRQLVVKLSSLQJ2QOLQH)RUXPILOOHG
ZLWKRYHUSRVWV7KHPDWHULDOLV7+(0267
FXWWLQJ-HGJH*DQQZRUN(9(5SXEOLVKHG
'U%HQQHWWdeciphered Gann¶s secret code LQ
KLVP\VWHULRXVERRNThe Magic Word WRGLVFRYHU
WKH 13 Sacred Numbers XSRQ ZKLFK KLV
numerical cycle system is based. Read More...
W. D. GANN’S SECRET VIBRATION CODE
/$:2)9,%5$7,21%<7+(180%(56
FINALLY CRACKED!
- BOOK 1 - LOV BY THE PATTERNS
- BOOK 2 - LOV BY THE NUMBERS
- BOOK 3 - LOV BY THE PLANETS - IN 2024
- BOOK 4 - LOV BY THE GEOMETRY - IN 2026
BOOKS 1 & 2 NOW IN PRINT!
35,17(',7,2112:$9$,/$%/(
ORDER FROM THIS LINK...
92/80(6-
3$*(6
$0$67(53,(&(
THE FIRST EVER UNVEILING OF WD GANN¶S
6<67(02)180(5,&$/+$5021,&6
,ඇඌඍංඍඎඍൾඈൿ&ඈඌආඈඅඈංർൺඅ(ർඈඇඈආංർඌԦඐඐඐ&ඈඌආඈ(ർඈඇඈආංർඌർඈආ
(ආൺංඅ
ංඇඌඍංඍඎඍൾ#&ඈඌආඈ(ർඈඇඈආංർඌർඈආԦ867ඈඅඅ)උൾൾ
-756-6141
,ඇඍൾඋඇൺඍංඈඇൺඅ
-
-Ԧ 6ൾൾඈඎඋඐൾൻඌංඍൾൿඈඋඈඎඋൿඎඅඅർൺඍൺඅඈඈൿආൺඋൾඍർඈඎඋඌൾඌ
WWW.TRADERSWORLD.COM July, August. September 2023
17
A Case for Recession or Depression Between 2025 and 2028
By L. David Linsky
This article is one of a 2-part series exploring the next iteration of the 84-year War and
Revolution cycle which, interestingly, is centered on July 4th, 2026.
In conjunction with that event, I want to bring to light an additional cycle of potentially
great negative significance as well, which occurs within the same time frame between
2025 and 2028.
It is not a matter of whether
the above event will occur, it
is simply a matter of its
ultimate severity.
At
the
core
of
this
proposition and one of the
first complete expositions
regarding an astronomically
based theory of business
and economic cycles, was
given by Louise McWhirter
in her book McWhirter
Theory of Stock Market Forecasting, published in 1938 (reprint available at
www.CosmoEconomics.com). Her theory proposed the primary trend of business and
economic volumes were
due to the 18.6-year cycle
of the Moon’s North Node
as
it
circumnavigates
around the sky.
This 18.6-year North Node
cycle is also at the
foundation of the 9-year
(18.6/2 = 9.3) and 56-year
(18.6 x 3 = 55.8) economic
cycles.
The moon’s orbit around
the Earth is inclined by 5
degrees,
8
minutes
relative to the plane of the
Earth’s orbit (the ecliptic)
WWW.TRADERSWORLD.COM July, August. September 2023
18
around the sun. The point at which the moon crosses the ecliptic from south to north is
called the Ascending Node or North Node. The point at which the moon crosses the
ecliptic from north to south is called the Descending Node or South Node.
Therefore, the North and South Nodes are not physical objects like a planet, but
mathematical points that happen to rotate and circumnavigate around the celestial sky or
zodiac in an 18.6-year cycle. We use the zodiac for positional reference because it divides
the 360-degree sky into 12 equal parts of 30 degrees each that are easily measured and
referenced.
The moon’s nodes move clockwise around the celestial sky versus the planets which
move in a counterclockwise fashion.
McWhirter’s premise states that as the North Node travels around the zodiac, there is an
extremely high correlation between the position of the North Node and the business /
economic cycle. Below is a graphic of McWhirter’s Theory of Stock Market Forecasting.
A more granular breakdown of the North Node’s position relative to the business cycle for
each zodiac sign follows on the next page.
WWW.TRADERSWORLD.COM July, August. September 2023
19
x
Aquarius: Often the extreme low of business activity or the bottom of the economic cycle.
x
Capricorn: Business activity starts to turn up from the bottom of the economic cycle.
x
Sagittarius: Business activity continues to move higher towards the normal level.
x
Scorpio:
Business activity reaches a normal level.
x
Libra:
Business activity starts to move above the normal level.
x
Virgo:
Business activity continues to gain momentum higher.
x
Leo:
Often the extreme high of business activity or the top of the economic cycle.
x
Cancer:
Business activity starts to fade from the top of the economic cycle.
x
Gemini:
Business activity continues to fall towards normal.
x
Taurus:
Business activity reaches a normal level.
x
Aries:
Business activity starts to fall below normal.
x
Pisces:
Business activity accelerates towards the bottom of the economic cycle.
Some other related works worth noting about astronomically related business cycles are
publications by Samuel Benner - Benner’s Prophecies (1875), J.M. Funk - Cycles of
Prosperity and Depression (1933), W.D. Gann - Financial Timetable (1909), and LCdr.
David Williams – Astro Economics (1959) and Financial Astrology (1982). (Most of these
works are also available in reprint from www.CosmoEconomics.com.)
Mainstream academia needs to give greater consideration to the potential underlying
astronomical cause of all cycles. Statistically, they offer the highest level of correlation
and accuracy.
Floods, famine and earthquakes, plus other significant geo-physical related or tectonic
events can be explained and predicted with regularity and good precision by the
movement and alignment of the planets. Meteorologists would be better equipped to
predict months or years in advance when and where some types of weather systems
would occur, and whether certain parts of the years would be unseasonably hot or dry,
cold or wet, if they took the time to study planetary phenomenon and how they correlate
highly to weather related events.
Historically, some of the worst and most widespread economic events occur when the
North Node is in those areas of the sky or zodiac known as Pisces and Aquarius. This
time frame represents the very bottom of the business and finance cycle and offers a very
high correlation to economic recessions and depressions. This 18.6-year cycle is also the
underlying cause of the 18–19-year Real Estate cycle.
More granular timing of the beginning and end of various economic cycles are
accomplished by study of the aspects or angles between various planets and their
placement in the sky. McWhirter states these secondary forces can either increase or
decrease the economic impact of the Node by +/- 20%.
WWW.TRADERSWORLD.COM July, August. September 2023
20
I am keenly aware of the stigma and derision anything astronomically based receives
from the general public and academia as it relates to financial markets or any type of
mass human event. I too once held those beliefs with a high degree of derision. However,
after repeatedly witnessing some highly skilled market traders utilizing astronomical
phenomenon to make market projections with near pinpoint accuracy, I had to investigate
these astronomically based methods for myself.
Suffice to say, it opened a new realm of perception and knowledge which some consider
to be the underlying cause of all market movement and collective human behavior. All
things repeat in cycles, and these repeating economic cycles must be based upon and
driven by something scientifically based, for they cannot exist out of thin air with absolutely
no scientific foundation.
Astronomy is the study of all celestial objects and is an accepted scientific study. Simply
stated, once you know what planetary pattern causes what type of events, when that
pattern repeats you can expect that event to repeat again as well. Very high correlations
cannot be ignored. Those that have studied astronomical phenomenon in this regard
know this to be true.
Astronomy and how it relates to mass human psychology and earthly events is as serious
a science as any other field of study. There is an abundance of university studies that
bear this out and provide explanations as to how this can occur. But that is not the purpose
of this article.
Following is a review of the past 10 North Node cycles spanning 167 years as they passed
through Pisces and Aquarius. Each of these 10 cycles correlates to a strong economic
recession and significant drop in the financial markets.
In addition to a very brief comment for each event, I have included glyphs of an
astronomical wheel from the Aspectarian program called Astrolog, to illustrate a pictorial
reference and representation of the Zodiac and the position of the North Node during
each economic cycle. Astrolog is a free program and can be found at www.Astrolog.org.
The price charts below illustrate the effects on financial markets when the moon’s North
Node traverses through those parts of the sky known as Pisces and Aquarius.
WWW.TRADERSWORLD.COM July, August. September 2023
21
The North Node (NN) was mid-Pisces (section 12) at the market top in 2007, and towards
the end of Aquarius, as illustrated below on March 6th of 2009, when the financial markets
hit bottom. This bottom represented a 54.5% drop from the 2007 high.
WWW.TRADERSWORLD.COM July, August. September 2023
22
At the October 1987 crash bottom, the NN was about to ingress (enter) Pisces. This
produced a 41% drop in 2 months.
WWW.TRADERSWORLD.COM July, August. September 2023
23
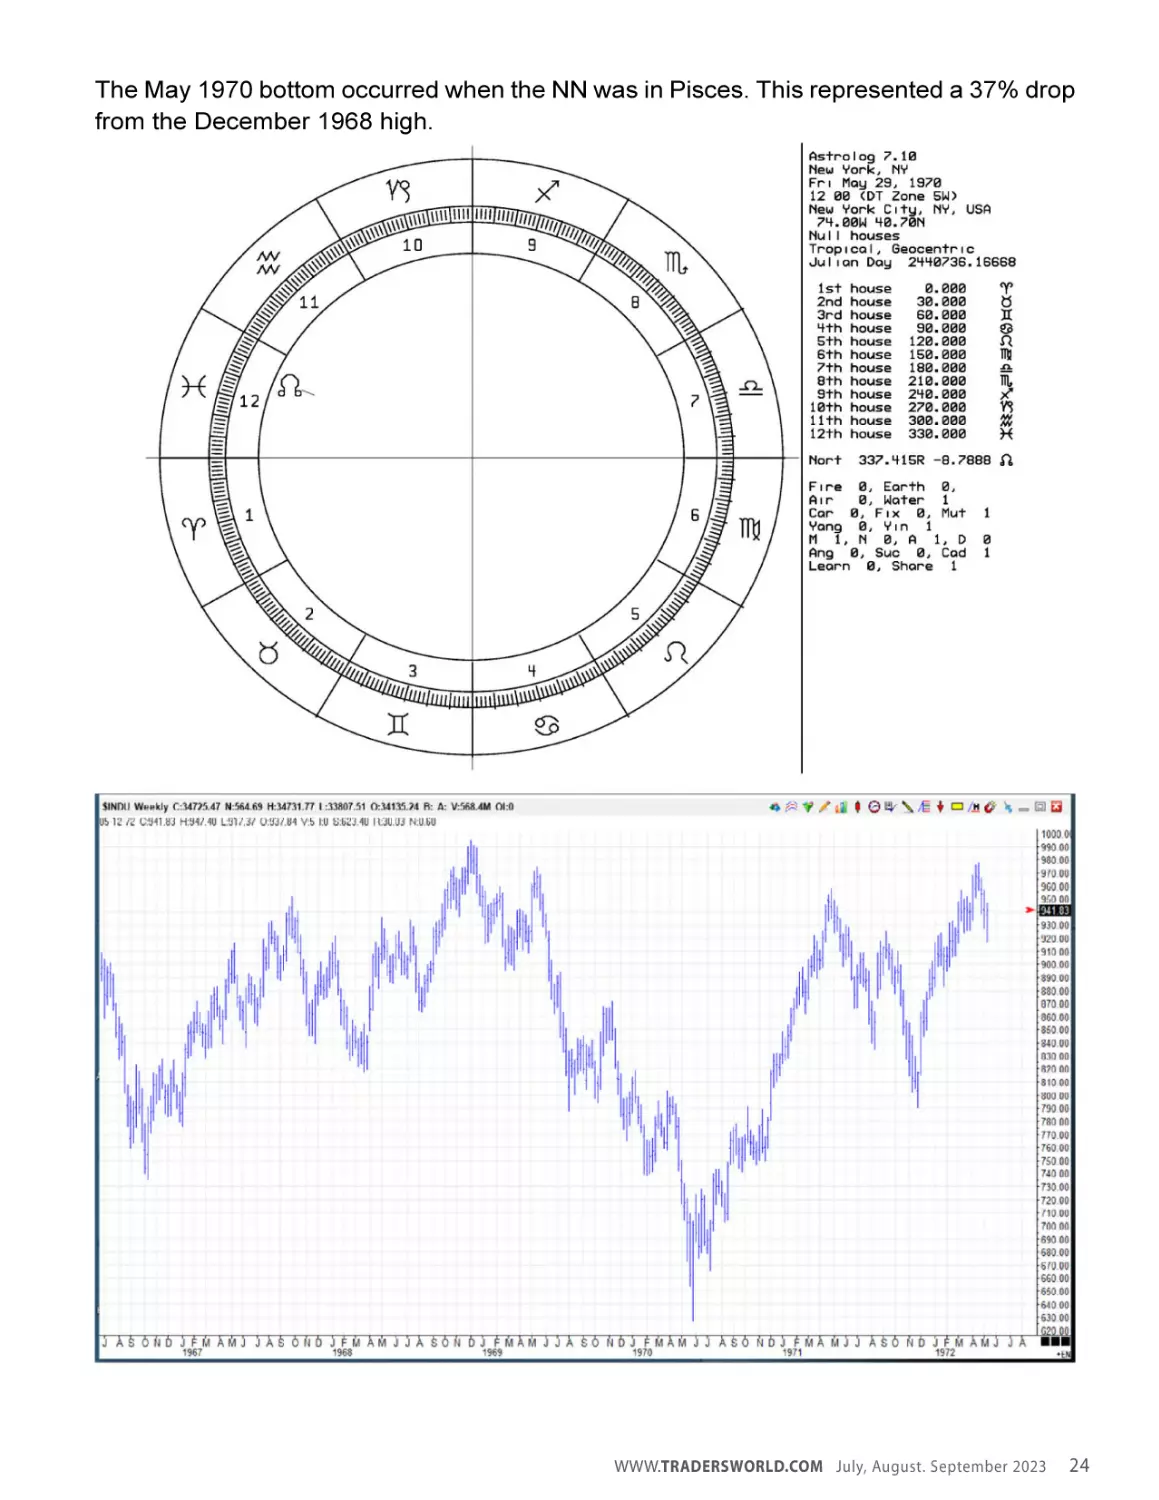
The May 1970 bottom occurred when the NN was in Pisces. This represented a 37% drop
from the December 1968 high.
WWW.TRADERSWORLD.COM July, August. September 2023
24
The NN just left Aquarius at the 1953 bottom and entered Capricorn. Notice how the
market made a slight bottom then shot up just as the NN left Aquarius in September of
1953. This cycle produced a modest 14% drop in about 9 months.
WWW.TRADERSWORLD.COM July, August. September 2023
25
The July 1932 bottom represented about a 90% drop when the NN was in Pisces. A
planetary cycle about 34 years later brought in the 1966 high which lasted almost 17
years. It was 34 years later again that brought in the 2000 market high.
WWW.TRADERSWORLD.COM July, August. September 2023
26
When the markets closed for over 4 months starting on 7/31/1914, the NN was again in
Pisces.
KtͲϭϵϭϰŽƚƚŽŵ
ϭϮϬ͘ϬϬ
ϭϭϬ͘ϬϬ
ϭϬϬ͘ϬϬ
ϵϬ͘ϬϬ
ϴϬ͘ϬϬ
ϳϬ͘ϬϬ
ϲϬ͘ϬϬ
ϱϬ͘ϬϬ
ϰϬ͘ϬϬ
ϭͬϲͬϭϵϭϮ
ϭͬϲͬϭϵϭϯ
ϭͬϲͬϭϵϭϰ
ϭͬϲͬϭϵϭϱ
ϭͬϲͬϭϵϭϲ
WWW.TRADERSWORLD.COM July, August. September 2023
27
ϭͬϳͬϭϴϵϯ
ϯͬϰͬϭϴϵϯ
ϰͬϮϵͬϭϴϵϯ
ϲͬϮϰͬϭϴϵϯ
ϴͬϭϵͬϭϴϵϯ
ϭϬͬϭϰͬϭϴϵϯ
ϭϮͬϵͬϭϴϵϯ
Ϯͬϯͬϭϴϵϰ
ϯͬϯϭͬϭϴϵϰ
ϱͬϮϲͬϭϴϵϰ
ϳͬϮϭͬϭϴϵϰ
ϵͬϭϱͬϭϴϵϰ
ϭϭͬϭϬͬϭϴϵϰ
ϭͬϱͬϭϴϵϱ
ϯͬϮͬϭϴϵϱ
ϰͬϮϳͬϭϴϵϱ
ϲͬϮϮͬϭϴϵϱ
ϴͬϭϳͬϭϴϵϱ
ϭϬͬϭϮͬϭϴϵϱ
ϭϮͬϳͬϭϴϵϱ
Ϯͬϭͬϭϴϵϲ
ϯͬϮϴͬϭϴϵϲ
ϱͬϮϯͬϭϴϵϲ
ϳͬϭϴͬϭϴϵϲ
ϵͬϭϮͬϭϴϵϲ
ϭϭͬϳͬϭϴϵϲ
ϭͬϮͬϭϴϵϳ
ϮͬϮϳͬϭϴϵϳ
ϰͬϮϰͬϭϴϵϳ
ϲͬϭϵͬϭϴϵϳ
ϴͬϭϰͬϭϴϵϳ
ϭϬͬϵͬϭϴϵϳ
ϭϮͬϰͬϭϴϵϳ
ϭͬϮϵͬϭϴϵϴ
ϯͬϮϲͬϭϴϵϴ
ϱͬϮϭͬϭϴϵϴ
ϳͬϭϲͬϭϴϵϴ
ϵͬϭϬͬϭϴϵϴ
ϭϭͬϱͬϭϴϵϴ
ϭϮͬϯϬͬϭϴϵϴ
The North Node just entered Aquarius when the 1896 bottom occurred. This represented
about a 41% drop from the high 3 years previously.
KtͲϭϴϵϲŽƚƚŽŵ
ϰϰ͘ϬϬ
ϯϵ͘ϬϬ
ϯϰ͘ϬϬ
Ϯϵ͘ϬϬ
Ϯϰ͘ϬϬ
WWW.TRADERSWORLD.COM July, August. September 2023
28
The 1878 bottom was about a 38% drop. The North Node was again in Pisces.
WWW.TRADERSWORLD.COM July, August. September 2023
29
The 1859 bottom represented about a 62% drop from the 1853 high as the North Node
just entered Aquarius.
WWW.TRADERSWORLD.COM July, August. September 2023
30
The last NN cycle covered is the 1842 bottom which represented about a 74% drop from
1836 high. At this bottom the NN was in Capricorn. From some monthly market data of
unknown origin, it suggests this bottom occurred in 1842-43.
WWW.TRADERSWORLD.COM July, August. September 2023
31
Based upon the above chart which covers an entire century, one can easily see the
repetition and time relationships between 1842 bottom, 1859 bottom, 1878 bottom and
the 1896 bottom. You will also note these bottoms form the primary and most severe
market lows during each 18.6 +/- year iteration of North Node cycle entering Pisces and
Aquarius.
The North Node will enter Pisces again in January of 2025 (right after the 2024
presidential elections), in Aquarius July of 2026 and Capricorn in March of 2028.
Below is a composite chart from Quick Trade Plus by Alphee Lavoie, comprising of 7
complete cycles of the North Node circumnavigating the celestial sky from 1885 to the
present, relative to prices of the Dow Jones Industrial average.
Because the North Node circumnavigates the sky in a clockwise fashion, the graph below
must be read from right to left.
In doing so, we notice the lowest average DOW prices relative to the position of the North
Node occurs when the North Node is in Pisces (blue), just as we have documented above.
Based upon the historical movement of the North Node, we can expect an economic
downturn of some degree to occur between January of 2025 and March of 2028. Once
the North Node enters Capricorn in March of 2028, the business cycle should start to
WWW.TRADERSWORLD.COM July, August. September 2023
32
slowly reverse, if not earlier. Keep in mind, financial markets are separate from, but
integrally integrated into the economic business cycle from which the North Node
specifically reflects.
As an example, and regarding the Great Depression, the financial markets started to
recover at the July 1932 bottom, yet the economic depression on the population continued
for the next decade until the beginning of WWII, which is what pulled the United States
out of economic depression. 1942 was also the beginning of the next 45-year planetary
market cycle, which generally starts a significant bull market, as it did in this case as well.
The next significant 45-year cycle bottom should occur in 2032.
(1897 bottom + 45 = 1942 bottom + 45 = 1987 bottom + 45 = 2032 bottom)
My next article will provide an analysis of the 84 Year War or Revolution Cycle for which
the next iteration is centered around July of 2026. At that time the North Node will just be
entering Aquarius. This iteration will be accompanied by some potentially positive
secondary planetary cycles. These secondary positive cycles could possibly help blunt
the negativity from these 2 damaging cycles I have written about.
Let’s hope they do, because if these 2 cycles, the War/Revolution cycle and the
Recession/Depression cycle wind-up reinforcing each other and negate the smaller
positive cycles, it could be a very rough ride for a few years, to say the least.
If you would like to send me any comments or questions, please email them to my
publisher at institute@cosmoeconomics.com and he will forward them to me. Or for more
information about my research and work, please see my author page at the Institute of
Cosmological Economics: https://www.cosmoeconomics.com/EZ/ice/ice/lee-linsky.php
All Back issues of Traders World magazine
on 3 DVDs mailed to you first class mail.
Issues 1 - 89.
$49.95
3 DVDs
Free shipping
click to order
WWW.TRADERSWORLD.COM July, August. September 2023
33
THE SECRET SCIENCE
OF
SQUARING
W. D. GANN’S LOST SYSTEM OF ASTRO-FORECASTING
BY JOHANNES SUNDBERG
A NEW BREAKTHROUGH IN MAPPING
W.D. GANN’S PLANETARY GEOMETRY
& SQUARING PRICE WITH TIME
309 PAGES, ONLINE AUTHOR FORUM
SEE SUNDBERG’S AUTHOR PAGE HERE!
³One morning, I was standing in the shower, preparing to go to
work with a blank mind, still not really awake. Suddenly, , MXVW
IHOWDVXGGHQIODVKDQLGHD
³:K\GR\RXQRWWU\WRDSSO\WKH
VTXDUHV WKLV ZD\"´ I felt overwhelmed, it was a powerful
experience! I had to rush to work, but the first thing I did when I
got home again was to turn on my computer. , LPPHGLDWHO\
NQHZWKDWWKLVPXVWKDYHEHHQWKHUHDOPHWKRGWKDW*DQQKDG
GLVJXLVHG VR HOHJDQWO\ And I had discovered it on my own«or
with the help of some angel that whispered it into my ear that
morning in the shower«´ -Johannes Sundberg
7KLVZRUNUHYHDOVVRPHRI*DQQ¶VEHVWKLGGHQVHFUHWVLQ
TRADING APPROACH SPECIFICS:
SDUWLFXODU KRZ WR 6TXDUH 3ULFH DQG 7LPH LQ WKH SURSHU
ZD\,WVWULYHVWREXLOGDVROLGEDVHIRULQWHUSUHWLQJ*DQQE\ The astro-geometric tools are used to project trade
setups with superb risk:reward ratios to use for
VKRZLQJ VWHS E\ VWHS KRZ WKH FRVPRORJLFDO IRUFHV DUH
short to intermediate-term position trading
WUDQVODWHGLQWRPDUNHWSULFHVHYHU\GD\
³I am 100% convinced that these methods were used by Gann!
I am sure that he had more tools than this in his toolbox, but
these strategies are nevertheless a standalone profitable
system. The beauty of this method is that it is quite simple to
understand and apply, and it is true Gann. Everyone who has
read his courses and books will react: "Oh, that is what he
meant! Could it really be that easy?" Gann hid what he really
meant in plain sight. I think this understanding will advance
many much further along in their Gann studies while also
providing a clean and straight-forward trading strategy that
they can profit from.´-Johannes Sundberg
-3URMHFWLRQVDUHJHQHUDOO\accurate to the day!
-7UDGHVUXQIURPVHYHUDOGD\VWRVHYHUDOZHHNVRU
HYHQPRQWKV $OVRGD\WUDGLQJDSSOLFDWLRQV«
-2QFHDFULWLFDOWUDGHVHWXSLVLGHQWLILHGZKHQWKH
PDUNHWUHDFKHVWKDWSRLQWDVHWRIastro-geometric
filters DUHXVHGWRLVRODWH³VTXDUHG trades´ZKLFK
SURGXFHDERXWDQ80% success rate
,Q 3RVLWLRQ 7UDGLQJ ZH LGHQWLI\ VLJQLILFDQW KLJKSUREDELOLW\ WUDGH VHWXSV ZLWK D PLQLPXP 1:3
risk:reward ratioWDNLQJSODFHZLWKLQDWLPHIUDPHRI
VHYHUDO GD\V WR VHYHUDO ZHHNV JHQHUDOO\ WKRXJK VRPH
WUDGHVPD\UXQIRUPDQ\PRQWKVZKHQD0DMRUWXUQLQJ
SRLQW LV LGHQWLILHG DQG D VLJQLILFDQW WUHQG EHJLQV
7KH UHDO VWUHQJWK RI WKH PHWKRGV LV WKH SRVVLELOLW\ RI
LGHQWLI\LQJ trading setups with high probability RI
VXFFHVVDstop-loss level at a minimum distanceDQG
Dprecise target price7KHEHVWWUDGHVDUHWKRVHZKHUH
WKHWDUJHWSULFHLVDWDGLVWDQFHWKDWLV PDQ\ PXOWLSOHV
RIWKHVWRS-ORVVGLVWDQFH
0DSSLQJ&HOHVWLDO0HFKDQLFVRQWRD&KDUW
NEW TITLE COMING SOON«
6LQFHWKHSDWKVRIWKHDVWURQRPLFDOIRUFHVDUHNQRZQDQG
FDQ EH FDOFXODWHG DJHV LQ DGYDQFH VR FDQ ZH IRUHFDVW WKH
IXWXUH MXVW OLNH WKH DVWURQRPHU GRHV 7KLV ERRN SUHVHQWV D
XQLTXH PHWKRGRORJ\ VKRZLQJ KRZ WR SX]]OH WRJHWKHU WKH
GLIIHUHQW SLHFHV WKDW *DQQ OHIW EHKLQG LQWR WR D ZRUNDEOH
WUDGLQJPHWKRGRORJ\7KURXJKWKLVUHWKLQNLQJRIWKHXVHRI
DVWUR-JHRPHWU\ ZH FDQ JHQHUDWH VXSHUE WUDGH VHW-XSV ZLWK
ORZULVNDQGH[WUHPHO\DWWUDFWLYHUHWXUQV
-RKDQQHV 6XQGEHUJ LV D -\HDU SURIHVVLRQDO WUDGHU DQG SUNDBERG¶S BOOK 2 OUT IN JULY!
SRUWIROLR PDQDJHU ZKR UHGLVFRYHUHG *DQQ V PHWKRG RI A NEW SET OF POWERFUL & ACCURATE
DVWUR-JHRPHWULF SULFHWLPH PRGHOOLQJ DQG GHYHORSHG INTRADAY ASTRO-TRADING TECHNIQUES
SUHFLVH DSSOLFDWLRQV WR SURMHFW *DQQ¶V SODQHWDU\
JHRPHWU\ VWUDLJKW RQWR D PDUNHW FKDUW SURYLGLQJ D PDS -),1',1*7+(KEYNOTE 2)$0$5.(7
ZKLFKUHODWHVDVWURQRPLFDOPRWLRQZLWKWKHPDWKHPDWLFV -)25(&$67,1*(1(5*<=21(6:TAROT
DQGJHRPHWU\WKHVTXDULQJRISULFHDQGWLPH
7KH PDUNHW JHRPHWU\ LWVHOI LV GHWHUPLQHG E\ 3ODQHWDU\
7LPH WKXV GHILQLQJ VTXDUHV DQG IRUFH RI E\ WKH DQJXODU
JHRPHWU\ $V VXFK WRROV OLNH *DQQ¶V ³JHRPHWULFDO
DQJOHV´ LI SURGXFHG FRUUHFWO\ ZLOO EH SODQHWDU\ EDVHG
DQGZLOOSHUIHFWO\DGKHUHWRWKHPDUNHWDFWLRQZLWKJUHDW
SUHFLVLRQZLWKQRVFDOHVTXDULQJ
BOOK 1 - 2021 TRADING & FORECAST RESULTS
-86,1*CROSSING LINES 72&$//78516
-*$11¶66&,(1&(2)HARMONIC 721(6
-*$11¶6YARDSTICK
+2:7286(,7
-7+(72 ANGELS 2)7+(0$*,&.$/7$527
-3$8/)267(5CASE 7+(HASBROUCKS
BOOK 2 - 2022 TRADE & FORECAST RESULTS
,ඇඌඍංඍඎඍൾඈൿ&ඈඌආඈඅඈංർൺඅ(ർඈඇඈආංർඌԦඐඐඐ&ඈඌආඈ(ർඈඇඈආංർඌർඈආ
(ආൺංඅ
ංඇඌඍංඍඎඍൾ#&ඈඌආඈ(ർඈඇඈආංർඌർඈආԦ867ඈඅඅ)උൾൾ
-756-6141
WWW.TRADERSWORLD.COM July, August. September 2023
34
BESPOKE GANN MASTER CHARTS
A SPINOFF OF THE LAW OF VIBRATION
By Johannes Sundberg
The summer has arrived, and I am looking forward ȱ ¢ȱ ȱ ¢ȱ ȱ ęȱ ȱ
manuscript of my latest book. The last 2-3 years has been spent researching and writing my
second book on W. D. Gann with a focus on the mysterious Law of Vibration. The fact is that the
ȱ ȱ¢ȱęȱȱŘŖŘŗ, but after a discussion with my publisher, Mr. William
Bradstreet Stewart, we decided to leave it out at the time of the publishing ¢ȱęȱǰ The
Secret Science of Squaring, and give it some time to mature.
In retrospect, that was a wise decision. There were some loose ends still not completed, and as
usually is the case with Gann, that rabbit hole was way deeper than I could have imagined two
years ago, even if I have researched Gann for 25 years. ȱȱȱȱȱę¢ȱȱ¢ȱ
goal ȱȱęlly able to leave the state of “the Hermit” to enjoy the summer in full.
In my last article (see Traders World #87), I explained that the true key to Gann is to be found
in the esoteric teachings of the ancient mystery schools. For some reason, this area has, to a
large extent, been ignored by Gann students ȱ ȱ ęȱ ȱ ȱ ȱ ȱ ȱ ȱ
physics, mathematics and to some extent chemistry. That is not necessarily wrong since the
areas that those sciences try to explain are a creation of a superior intelligence.
But it was not in that direction that Mr. William Gann pointed. Just take a look at his
“Recommended Reading List”. Tȱ ȱęȱbooks like Henry Cornelis Agrippa’s, Philosophy
of Natural Magic, or The Sixth and Seventh Books of Moses, and Papus’, Tarot of the Bohemians. How
often have you seen any references to these books when somebody has tried to explain Gann
and his methods? Had it not been for my background as a devoted student of spirituality, I
would probably have missed them too. But instead, I began to see how these esoteric practices
suddenly began to connect to what Gann was really up to.
It is now time to give these ancient teachings some recognition. Believe me, they will open up
the Gann treasure chest and what you will discover will go beyond your imagination. These
teachings are not products of some charlatans or superstitious people. On the contrary, they
have always been true, and the markets will prove it for us.
When it comes to the Law of Vibration, the speculations about what it really is have been going
on ever since Gann used the term in the famous Ticker Interview, done ¢ȱ ȱ ęȱ
legend, ȱ¢ě, ȱŗşŖş.
Most people look at numerology, astrology or chemistry. Others believe it is a system of
ȃȱȄȱȱȱȃ ȱȱĴȄǯȱȱȱȱ¡ȱȱ¢ȱ , but
none of them can give us the complete picture alone. If you ask me, I would say, “Everything
is vibrating, the Law of Vibration gives us a set of correspondences that explain the functioning
of the Universe by connecting music, astrology, light and colors with any other phenomena. It
WWW.TRADERSWORLD.COM July, August. September 2023
35
is rooted in the mysteries of the Kabbala, ancient Egypt and Greece”. This was what inspired
Gann, and he probably received some of his knowledge from the Freemasons, of which he was
a member, and probably from other secret societies too.
I am sure my readers will get some real Eureka-moments when they take part in my latest
ęǯȱȱ , ȱ ȱ ȱ ȱ ȱ ȱ ȱ ȱ ȱ ȱ ȱ ěǯȱ ¢ȱ
simple rule is: If a method works it is good, if it does not work it is not good, just ignore it.
Surprisingly often, the really simple methods turn out to be the most valuable ones. The
challenge is not to master some high degree of mathematics and physics, the challenge is to
look at the world in the right way, and that is an ability that has diminished more and more
as “science” has taken the leadership over spirituality.
ȱ¢ȱ ȱęȱȱ¢ȱȱȱȱ¡ȱȱ ȱ ȱ ȱ ȱmusic and
planetary movement to identify the turning points in the market. The good thing is that this
can be done on any time frame, from intraday 5-minute charts to weekly and monthly charts.
ȱ ȱ ¢ȱ ȱ
ȱ ȱ ¢ȱ ȱ ȱ ęȱ ȱ ȱ ȃ¢note”, in other words,
teach you how to identify the individual vibration of a security. When you have that,
everything else will start to fall in place.
ȱȱȱhas ȱȱȱęȱȱ¡ȱȱȱ¢ȱȱ ǯȱȱ, it is
more valuable to identify a ȱȱȱ ȱȱ
ȱȱȱ¡ȱȱȱtrend than a swing
that lasts for only a couple of days. From a trading perspective, ȱěȱȱ¢ȱȱ
that large, but it is sure more fun to pick the big swings! Curious readers can check my updated
Trading Records at the CosmoEconomics.com website, ȱȱȱ¡ of the big trades
I caught this last year using these tools.
ȱȱȱȱȱǯȱ ȱ ȱ¡ȱ ȱ ȱ¢ȱȱby ȃ ȱȄ,
and how that can help us pinpoint the highs and the lows in both time and price. We will also
look at how we can upgrade the “square the range” method (“one of my most valuable
discoveries”, according to Gann) and use it in a sequential fashion. We will also take a look at
Gann´s mysterious “Yardstick” that was mentioned in How to ȱęȱȱ, and
use it to catch the low of bear markets ȱęȱȱ¢-the-dip levels in rising trends.
¢ȱ ȱ ȱ ȱ ȱ ¢ȱ ȱ ȱ ȱ ȱ ŝŘȱȱ ȱ ȱ
connection to the Tarot. For some reason, Gann gave us several clues about angels in ȱȱ
ȱȱ. Just look at Robert Gordon’s invention, ȃ¢ȱȱȱȱ¢Ȅ, which is an
ȱ ȱ ȱ ȱȱ ǯȱ ȱ
ȱ ȱ ȱ ¡ȱ ȱ ȱ
ȱȃȄȱȱ ann’s famous 45° angle, for my readers. But just to give you one indication
about the importance Gann put on the angels, it can be mentioned that the word “angel” is
found 8 times (the octave), and “angels” 3 times in Tȱȱ, the last book published by
Gann.
¡ȱȱ ȱ ȱȱȱȱ ȱȱ . When he wanted to
show something important, he wrote certain important keywords a number of times that had
ȱę in Tȱȱȱȱ and in The ȱ. No, I will not ask
WWW.TRADERSWORLD.COM July, August. September 2023
36
you to pray to angels for predicting the stock market, but I will show you how these
“cosmological Ȅȱěȱȱȱȱȱȱ, ȱȱ ȱ ȱȱ¢ȱ
wise and enlightened men coded into the cards of Tarot around the year 1200. By restricting
ȱ ȱ ȱ ȱ , ¢ȱ ȱ ȱ ȱ ȱ
ȱ ȱ ȱ
falling into the wrong hands, thereby escaping the wrath of the church, which at that time did
ȱȱ¢ȱȱ Ĵen texts than the Holy Scriptures.
Gann’s Mathematical Formula for Market Predictions
At the end of his life, William D. Gann published a set of courses that were marketed in his
brochure, Why Money is Lost on Commodities and Stocks and How to Make ę, under the name
The Mathematical Formula for Market Predictions. ȱȱȱȱǰȱ ȱęȱȱSquare of 144
(2x72!), the Square of 90, and the Square of 52. But he also included a course called the Square of
67 for Soybeans. The reason was that the all-time low of Soybeans was 67 cents, which would
spin out key price and time cycles according to Gann. He called this the Natural Square of
¢ǯȱȱȱ¢ȱęȱȱwill ęȱȱconcept ¢ȱǯȱ
These “squares” were originally ȱȱȱ¢, and the user was expected to place
them upon their properly squared charts. My suspicion is that they were astrological in origin.
52 of course corresponds to the 52 weeks of the Earth year. 144 months is 12 years, and that is
the cycle of Jupiter, and 90 months is 7.5 years, a quarter of the Saturn cycle, or a sixth of the
synodic Saturn-ȱ¢ǯȱ ȱȱȱȱ ȱȱȱȱȱȱ
ȱȱȱ ȱȱ disclose the secrets behind them openly.
Nowadays, these squares are included in most software packages with some Gann
functionality, and we can see charts with them posted on social media quite frequently. Sadly,
the user usually does not know how they work, and most often they will fail. It is like people
ȱȱȱȱȱȱȱ, so force them upon their charts, without
understanding, and hope for the best.
ȱ ȱȱ ȱ ȱȱȱexperiment with my “crossing lines technique” was that
ȱ¢ȱȱȱȱȱ ȱȱȱȱproperly tuned Master Charts that will
actually work! ȱȱȱȱȱȱȱȱȱȱȱȱ¢ȱȱȱ
just substitute the planets with regular lines. You see,
ȱȱȱ¢ȱȱȱęȱȱ ȱ
planet is doing what, ȱ¢ȱ ȱȱȱȱon our charts anyway, and that
is all we need! As I wrote earlier, sometimes the easiest solutions are the best.
I can, of course, not go through the whole process behind them, but I can show you some
¡ȱȱȱ¢ȱȱȱȱȱȱȱ when applied correctly. I like to call
ȱȃȱȱȄȱȱȱȱȱȱȱȱȱśŘǰȱşŖȱnd
144.
First ȱȱȱȱȱȱȱȱǯȱ¢ȱȱ ȱȱȱȱȱȱȱȱȱ
ȱǯȱȱ¢ȱȱȱȱ ȱȱ£ȱȱȱȱȱȱȱ
for the price, but more importantly, how the crossings of the diagonal lines create turning
WWW.TRADERSWORLD.COM July, August. September 2023
37
points. The high in April 2023 is what Gann would have called “the half-way point” in time,
and that point is always extra important.
Next, we have the DXY – Dollar Index. This square is also active. Once again, we can see the
importance of the half-way point in time. The DXY reach a major high in September 2022, right
at the halfway point in time. In addition to that, it had also reached the top price of the square,
and the only way to go was down. Then the price declined and found support at the halfway
point in price. We had a buying opportunity quite recently when we had a crossing of the lines
at the same time as the price was resting on the half-way point in price. Each red arrow marks
a point where the lines of the square crossed.
WWW.TRADERSWORLD.COM July, August. September 2023
38
Since all good things come in threes, let’s throw in a third chart.
This is the Uranium ETF, ǯȱȱęȱ ȱȱȱȱȱȱȱȱ ¢ȱȱȱ
ȱ ȱ ¢ȱ in , ȱ ȱ ȱ ȱ ȱ ȱ ȱ ȱ ȱ ȱ ȱ
¢ǯȱ ȱ ǰȱ
ȱ had ȱ ȱ ȱ ȱ ȱ ¢ȱ , ȱ ȱ ȱ ȱ
recovered. We had ȱȱȱȱ ȱ ȱȱȱȱs. The remarkable thing
is, however,
ȱȱ ȱȱȱȱȱȱȱȱ. It was like URA
ȱȱȱ¢ȱȱ ȱȱȱȱȱȱǯȱ
These are ȱȱ ȱ¡ȱȱ ȱȱLaw of Vibration can ȱȱto ȱȱȱȱ
Master Sȱȱ¢ȱ ǯȱȱȱȱȱ¢ȱ ȱȱ¢ȱȱȱȱ
ȱȱȱȱ¢ǯȱ You do not need a Master Cȱȱǰȱȱȱ¢ȱ
ȱ ¢ȱȱȱȱȱȱǯȱȱ ȱȱȱȱȱ ȱȱȱ
ȱȱǯȱ ȱȱȱȱȱ ¢ȱtribute to our master, Mr. Gann, to use them and
ȱȱǯȱ
ǰȱe more chart as a bonus:
WWW.TRADERSWORLD.COM July, August. September 2023
39
This is the Swedish OMX-index, where I constructed a Master Square from the 2020 low. The
ěȱ ȱthis and thȱȱȱȱȱȱȱȱȱǯȱ ȱȱ¢ȱ
Ĵȱȱȱȱȱȱȱȱ ȱȱǯȱȱȱȱȱ
ȱ ȱȱȱŘŖŘŘ, and the market has since then gravitated around the major diagonal
moving upwards.
I hope to return soon with more examples and applications of the wonderful Law of Vibration.
ȱȱȱȱ¢ȱ ǰȱȱȱ¢ȱȱȱȱȱInstitute of Cosmological
Economics, (ĴDZȦȦ
ǯǯȦ
ȦȦȦǯǼǯȱ ȱ ȱ ¢ȱ
ȱ
ȱ ȱ ȱ ȱ ¢ȱ ȱ ȱ ǰȱ ȱ ȱ ȱ ȱ ¢ȱ ȱ ȱ
institute@cosmoeconomics.com and he will forward them to me.
ȱ¢ȱȱ summer!
Johannes Sundberg
All Back issues of Traders World magazine
on 3 DVDs mailed to you first class mail.
Issues 1 - 89.
$49.95
3 DVDs
Free shipping
click to order
WWW.TRADERSWORLD.COM July, August. September 2023
40
THE UNIVERSAL
GOLDEN KEYS SERIES - VќљѠ. 1-3
ȱBY
ALEXANDER STRAKER
9ඈඅ- PENDULUM MOTION: THE HARMONY OF THE CIRCLE
ȱ presents forecasting techniques built on a new principle, Circular Scaling, which has
never been presented before StrakerȂs work. It uses an ingenious method of charting via time-by-degrees to
plot the market according to the parameters of a circular scale using rotational mechanics. ONLY by charting
with Circular Scaling is the Key to accessing Pendulum Motion discovered! This is a breakthrough discovery
of its own, NOT part of traditional Gann analysis. These are completely new and original ideas developed by
the author, and never before seen in the markets. Alex proves their power, see his trading records at this link!
Wave59 Software Tools for ђћёѢљѢњȱќѡіќћ: There are now 3 sets of tools that have been programmed
for Wave59 (& Optuma soon!) which speed up the application so much that Straker ęȱ400% in 1 DAY
the 1st time he traded with them, leading to his recent 12,000% in 1 WEEK smashing ALL GannȂs records!
9ඈඅ- GOLDEN SPEED: THE GEOMETRY OF THE SQUARE
The most esoteric and critical secret to GannȂs work is the proper use of chart
scaling, often called or ȃsquaringȄȱ a chart. If not done correctly, GannȂs REAL
work is never seen! ItȂs a tiny tweak few understand but is key to tools working!
ȱ ȱ ȱ ęȱ ȱ ȱ Ȃs system of ȃSquare Scaling,Ȅȱ GannȂs
solution to embedding natural vibratory order into the structure of his charts.
The secret of scaling is THE most important key to using charts and improves
the function of all GannȂs tools! The secret is the Golden Mean and the Speed of
ȱȱĴȱȱȱȱȱȦǷȱȱȱȱȱȱ
Forces mapped upon the Cosmos! THE GOLDEN MEAN IS KEY TO GANN!
9ඈඅ- MUSIC OF THE SPERES:
ASTRO-GNOMONIC IMPUSE ૧ GEOMETRY OF TIME
Volume 3 of the ȱ ¢ȱ is a collection of the very
ȱ Ȧȱ ȱ ȱ ȱ ȱ ȱ ¢ȱ
made and consists of a never seen before set of interlocking
astro and mathematical principles. The real root of this
¢ȱ ȱ ȱ ȱ ȱ ęȱ ȱ ¡ȱ ȱ
the ȃtheoryȄȱ sections of books 1, 2 and 3 of this series. The
science backing the methods and consistent provability is
what makes this such a robust and logical solution to the
greatest Gann mystery of alldzȱ how was he using Astro?
Simple logic tells you that without mathematics being the
basis for GannȂs methods (whether geometric mathematics,
astronomical mathematics or another variation), there would
ȱ Ĵȱ ȱ ȱ ȱ ¢ȱ ȱ ¢ǯȱ ȱ ȱ
INSTITUTE
62/87,2172*$11¶6
6<67(02)6&$/,1*
675$.(575$',1*5(&25'6
5ETURN IN WEEK!
Straker's trading record is absolutely
PHENOMENAL!!! Recently, he traded
an initial $1000 up to $120,000 in 1
WEEK! Full PROOF posted at this link!
i
i
i
i
i
$1000 to $120,000 in 1 Week!
Not just luck...Over 600 trades!
Used Pendulum Motion & Book 3!
ȱǭȱĜȱ Ȧśşȱ
Smashed GannȂs Trading Record!!!
7+(3522),6,17+(75$',1*
i
i
i
i
ŗŖŖŖƖȦŗȱȱ ȱ
4000% in 2 Weeks in March 2020
ŚŖŖƖȱȱŗȱ¢ȱ Ȧ ȱȱśşȱ
śŖƖȦǯȱȱ
Ԥ
WWW.COSMOECONOMICS.COM
EMAIL: INSTITUTE@COSMOECONOMICS.COM ԤUS FREE: 800-756-6141 ԤINTL: 951-659-8181
OF
COSMOLOGICAL ECONOMICS
WWW.TRADERSWORLD.COM July, August. September 2023
41
KĐƚĂǀĞ,ĂƌŵŽŶŝĐƐĂŶĚDĂƌŬĞƚsĞĐƚŽƌ>ŝŶĞŽĨdŚƌƵƐƚ
LJůĞdžĂŶĚĞƌ^ƚƌĂŬĞƌ
^ŝŵƉůĞĐŽŶĐĞƉƚƐŝŶƚƌĂĚŝŶŐĐĂŶďĞĂŵŽŶŐƐƚƚŚĞŵŽƐƚƉŽǁĞƌĨƵů͘/ŶƚĞƌŵƐŽĨŵƵƐŝĐ͕ǁĞŚĞĂƌƚǁŽ
ŶŽƚĞƐŽĨƚŚĞƐĂŵĞƋƵĂůŝƚLJ;ĞŶĚŽĨĂĐLJĐůĞͿĂƚƉƌĞĐŝƐĞůLJĂĚŽƵďůŝŶŐŽƌŚĂůǀŝŶŐŽĨŵĂƚŚĞŵĂƟĐĂů
ĨƌĞƋƵĞŶĐLJ͘dŚŝƐŝƐŽĨĐŽƵƌƐĞĂŵƵƐŝĐĂůKĐƚĂǀĞ͕ĨŽƌĞdžĂŵƉůĞ͕ŵŝĚĚůĞƵƉƚŽŚŝŐŚŽŶĂƉŝĂŶŽ͘
t͘͘'ĂŶŶŚĞĂǀŝůLJĞŵƉŚĂƐŝnjĞƐƚŚĞƐŝŐŶŝĮĐĂŶĐĞŽĨƚŚĞϱϬйƌĞƚƌĂĐĞŵĞŶƚůĞǀĞůĨŽƌƚƌĂĚĞƌƐ͘
'ĂŶŶ͛ƐϱϬйƌĞƚƌĂĐĞŵĞŶƚƌƵůĞ͘
͞ŌĞƌĂŶŝŶŝƟĂůƐƵƐƚĂŝŶĞĚƉƌŝĐĞŵŽǀĞĞŝƚŚĞƌƵƉŽƌĚŽǁŶ͕ƉƌŝĐĞƐƌĞƚƌĂĐĞƚŽϱϬйŽĨ
ƚŚĞŝƌŝŶŝƟĂů ŵŽǀĞ͘/Ĩ ƚŚĞƌĞƚƌĂĐĞŵĞŶƚĞdžĐĞĞĚƐϱϬй͕ƉƌŝĐĞƐ ƐŚŽƵůĚ ĐŽŶƟŶƵĞƚŽ ƚŚĞ
ϲϮ͘ϱйůĞǀĞůďĞĨŽƌĞĂƌĞĂĐƟŽŶŽĐĐƵƌƐ͘͟
dŚĞƐĂŵĞƌƵůĞ'ĂŶŶĂƉƉůŝĞƐŚĞƌĞƚŽƉƌŝĐĞůĞǀĞůƐĂůƐŽĂƉƉůŝĞƐŝŶƟŵĞƐĞŐŵĞŶƚƐ͘,ĂǀŝŶŐƚŚŝƐ
ƵŶĚĞƌƐƚĂŶĚŝŶŐŵĂLJŶŽƚƐĞĞŵƚĞƌƌŝďůLJƌĞǀŽůƵƟŽŶĂƌLJŽƌƐŝŐŶŝĮĐĂŶƚ͕ŚŽǁĞǀĞƌĂŐůĂŶĐĞĂƚƚŚĞƐĞ
ƉƌŝŶĐŝƉůĞƐŝŶĂĐƟŽŶƌĞǀĞĂůƐĂƐƵƌƉƌŝƐŝŶŐŶƵŵďĞƌŽĨƵƐĞĨƵůƉƌŝĐĞĂŶĚƟŵĞŚĂƌŵŽŶŝĐƉŽŝŶƚƐŽĨ
ƌĞƐŽŶĂŶĐĞǁŚĞƌĞĂŵĂƌŬĞƚƌĞǀĞƌƐĂůďĞĐŽŵĞƐĂŚŝŐŚƉƌŽďĂďŝůŝƚLJ͘
/ĨǁĞƚŚĞŶĐŽŵďŝŶĞƐŽŵĞƐŝŵƉůĞƉƌŝŶĐŝƉůĞƐŽĨǀĞĐƚŽƌůŝŶĞŽĨƚŚƌƵƐƚĂŶĚƉĂƌĂůůĞůƐ͕ŵĂŶLJƌŽďƵƐƚ
ƚƌĂĚŝŶŐŝĚĞĂƐĞŵĞƌŐĞ͘&ŝƌƐƚ͕ůĞƚ͛ƐůŽŽŬĂƚƚŚĞϱϬйƌƵůĞŝŶĂĐƟŽŶ͘
^ƉŽƚŽīĞĞĂŝůLJǁŝƚŚƚŚĞϱϬйƌĞƚƌĂĐĞŵĞŶƚŵĂƌŬĞĚƚŽƚŚĞŵĂŝŶƐǁŝŶŐ͕ƵůƚƌĂͲƐŝŵƉůĞLJĞƚǀĞƌLJ
ƉŽǁĞƌĨƵů͊ /ƚ͛Ɛ ŶŽƚ ŽŶůLJ ƚŚĞ ϱϬй ƌĞƚƌĂĐĞŵĞŶƚ ƚŚĂƚ ŝƐ ƉŽǁĞƌĨƵů͕ ƚŚĞ ϱϬй ĞdžƚĞŶƐŝŽŶƐ ĂƌĞ ĂůƐŽ
ǁŽƌƚŚŶŽƟŶŐ͘
WWW.TRADERSWORLD.COM July, August. September 2023
42
^ƉŽƚŽīĞĞǁŝƚŚϱϬйĞdžƚĞŶƐŝŽŶƐĂƉƉůŝĞĚ͕ĐůĞĂƌƐƵƉƉŽƌƚĂŶĚƌĞƐŝƐƚĂŶĐĞŝŶďŽƚŚĐĂƐĞƐ͘DƵůƟƉůĞ
ĞdžƚĞŶƐŝŽŶƐǀĂůŝĚĂƚĞƚŚĞĐŽŶƟŶƵŝŶŐƌĞƐŽŶĂŶĐĞŽĨƚŚĞŵƵƐŝĐĂůKĐƚĂǀĞŚĂƌŵŽŶŝĐŝŶWƌŝĐĞĂƚǁŽƌŬ
ŝŶƚŚĞŵĂƌŬĞƚ͘
^ǁŝƚĐŚŝŶŐƚŽĂdŝŵĞǀŝĞǁƉŽŝŶƚ͘/ŶƚŚŝƐĐĂƐĞ͕ǁĞŵĞĂƐƵƌĞĂƉƌŝŽƌƐǁŝŶŐŽĨĂƐŝŵŝůĂƌĚĞŐƌĞĞĂƐ
ƚŚĞďĞŶĐŚŵĂƌŬ͘tĞĂƌĞĂƉƉůLJŝŶŐƚŚĞƚŽŽůƚŽƚŚĞƐǁŝŶŐďĞĨŽƌĞƚŚĞŵĂŝŶŵŽǀĞĂŶĚĐŽŵƉĂƌŝŶŐ
ƚŚŝƐƚŽƚŚĞƐǁŝŶŐĂŌĞƌƚŚĞŵĂŝŶŵŽǀĞ͘
KŶĐĞĂŐĂŝŶŝƚŝƐĐůĞĂƌƚŚĂƚϱϬйĂƐǁĞůůĂƐϭϬϬйŵƵƐŝĐĂůKĐƚĂǀĞƐĂƌĞǀĞƌLJƉŽǁĞƌĨƵůƟŵĞŵĂƌŬĞƌƐ
ǁŝƚŚƉƌŝĐĞĂĐƟŽŶƌĞǀĞƌƐĂůƐĂƚďŽƚŚůŝŶĞƐ͊
WWW.TRADERSWORLD.COM July, August. September 2023
43
dŽĞŶŚĂŶĐĞƚŚŝƐǀŝĞǁ͕ǁĞĐŽƵůĚĂĚĚĂƐŝŵƉůĞǀĞĐƚŽƌƚŚƌƵƐƚůŝŶĞƚŽƚŚĞĮƌƐƚƐǁŝŶŐƚŚĞŶĐŽƉLJΘ
ƉĂƐƚĞƚŚŝƐƚŽƚŚĞďĞŐŝŶŶŝŶŐŽĨƚŚĞƐĞĐŽŶĚƐǁŝŶŐ͘,ĞƌĞŝƐƚŚĞƌĞƐƵůƚ͘
dŚĞŵĂŝŶƉŽŝŶƚƚŽŽďƐĞƌǀĞŚĞƌĞŝƐƚŚĞĂŶŐůĞŽĨƚŚĞƚŚƌƵƐƚůŝŶĞĂŶĚŚŽǁƉƌŝĐĞĂĐƟŽŶĞƐƐĞŶƟĂůůLJ
ƚƌĂǀĞůƐĂůŽŶŐƚŚĞƐĂŵĞǀĞĐƚŽƌƵŶƟůŝƚ͛ƐĞŶĚƉŽŝŶƚǁŝƚŚƐŽŵĞŵŝŶŽƌŇƵĐƚƵĂƟŽŶƐĞŝƚŚĞƌƐŝĚĞ͘
ŶŽƚŚĞƌǁĂLJƚŽǀŝĞǁƚŚŝƐŝƐĂĚĚŝŶŐƉĂƌĂůůĞůƐƚŽƚŚĞǀĞĐƚŽƌĐƌĞĂƟŶŐĂĨƵůůĐŚĂŶŶĞůƚŚĂƚ͚ĐŽŶƚĂŝŶƐ͛
ƚŚĞƐǁŝŶŐ͘
dŚŝƐŶĞdžƚĐŚĂƌƚĐŽŵďŝŶĞƐĂůůƚŚĞĞůĞŵĞŶƚƐƐŽĨĂƌƚŽŐĞƚŚĞƌ͘,ĞƌĞŝƐƚŚĞƉŽǁĞƌŽĨĂƉƉůLJŝŶŐƚŚĞ
ϱϬйƉƌŝŶĐŝƉůĞŝŶƉƌŝĐĞĂŶĚƟŵĞƉůƵƐƐŝŵƉůĞǀĞĐƚŽƌůŝŶĞƐŽĨƚŚƌƵƐƚ͘
WWW.TRADERSWORLD.COM July, August. September 2023
44
dŚĞƌĞƐƵůƟŶŐƉŽƚĞŶƟĂůƚƌĂĚĞƐĞƚͲƵƉƌĞƋƵŝƌĞĚŵŝŶŝŵĂůĚŝƐĐƌĞƟŽŶ͕ĨŽůůŽǁƐĞĂƐLJƚŽƵŶĚĞƌƐƚĂŶĚ
ĂŶĚƐŝŵƉůĞƌƵůĞƐƚŚĂƚƐĞůĨͲǀĂůŝĚĂƚĞ͕ĂŶĚƉƌŽĚƵĐĞƐĂŶĂĐĐĞƉƚĂďůĞƌĞǁĂƌĚĨŽƌƌŝƐŬƌĂƟŽ͘
t͘ ͘ 'ĂŶŶ͛Ɛ ŐĞŶŝƵƐ Ăƚ ǁŽƌŬ ŚĞƌĞ͊ ^ŽŵĞƟŵĞƐ Ă ƐŝŵƉůĞ ĐŽŶĐĞƉƚ ĐĂŶ ůĞĂĚ ƚŽ Ă ǁŽŶĚĞƌĨƵů
ŽƉƉŽƌƚƵŶŝƚLJ͘/ŶŵĂŶLJƚƌĂĚĞƌƐĞdžƉĞƌŝĞŶĐĞ͕ƚŚĞϱϬй;ŽƌKĐƚĂǀĞͿƉƌŝŶĐŝƉůĞŝƐŽŶĞŽĨƚŚĞƐƚĂŶĚŽƵƚ
ĐŽŶĐĞƉƚƐǁŚŝĐŚĐŽŶƐŝƐƚĞŶƚůLJƉƌŽĚƵĐĞƐƌĞƐƵůƚƐŝŶĂŶLJŵĂƌŬĞƚĂŶĚƟŵĞĨƌĂŵĞ͘
&ŽƌŵŽƌĞŝŶĨŽƌŵĂƟŽŶŽŶŵLJƌĞƐĞĂƌĐŚĂŶĚƵƉŽŶŵLJϯͲsŽůƵŵĞhŶŝǀĞƌƐĂů'ŽůĚĞŶ<ĞLJƐ^ĞƌŝĞƐ͕
ƉůĞĂƐĞƐĞĞŵLJĂƵƚŚŽƌƉĂŐĞĂƚƚŚĞ/ŶƐƟƚƵƚĞŽĨŽƐŵŽůŽŐŝĐĂů
ĐŽŶŽŵŝĐƐŚĞƌĞ͗
ŚƩƉƐ͗ͬͬǁǁǁ͘ĐŽƐŵŽĞĐŽŶŽŵŝĐƐ͘ĐŽŵͬ
ͬŝĐĞͬŝĐĞͬĂůĞdžĂŶĚĞƌͲƐƚƌĂŬĞƌ͘ƉŚƉ
All Back issues of Traders World magazine
on 3 DVDs mailed to you first class mail.
Issues 1 - 89.
$49.95
3 DVDs
Free shipping
click to order
WWW.TRADERSWORLD.COM July, August. September 2023
45
THE PERFECT STORM
USING VEDIC ASTROLOGY TO PROJECT AN INTRADAY
TIME MAP OF MARKET ACTION IN THE S&P 500
Ѧȱџіѐȱђћіѐјюȱӕȱ ђћȱёјіћѠ
ȱ ȱ2ȱ
ȱȱȱ!
ȱȱȱȱȱȱ
We are very excited to release The Perfect Storm by Eric Penicka and Ken Adkins. This courses ȱ
ȱ¢ȱȱȱȱȱȱȱȱȱȱȱǭśŖŖȱȱȱ ¢ȱǯȱThe course and
accompanying software ȱ¢ȱ¢ Key Swing Zoneȱȱȱȱȱȱ¢. These
£ȱęȱȱ¢ȱȱȱǰȱȱȱ ȱȱȱȱ ȱȱȱ
ȱŘȱȱ¢ȱǰȱȱȱȱ ǯ
This work originated in a deep study of Vedic techniques applied to horse racing prediction, as
presented in ȱ¢Ȃȱ . Penicka and Adkins then reapplied the results of that predictive work
ȱȱęȱȱ ȱ¡ȱȱȱȱ¢ȱȱȱȱǯ
¢ȱȱȱ ¢ȱȱȱȱȱȱȱȱȱȱȱȱ ȃȄǰȱȱȱ
ȱ ȱ ȱ ȱ ȱ ȱ ¢ȱ ȱ ȱ ȱ . This course is focused upon the S&P Index, but
that is not the only market the astro-tools will work on. These ¢ȱ ȱ
ȱ ȱ ȱ ȱ ȱ
, so the techniques can be similarly applied to other markets, and samples in Euro, Gold, Oil,
Soybeans are shown at this link. Analysis & results of 9 months of trading on authorȂs YouTube here!
ȱ Ȃȱ ȱ-ȱћȱѠѡџќљќєђџȇѠȱ ђѦȱѡќȱ ќџѠђȱюѐіћє
Penicka's long term love of ¢ȱ ȱ ȱ ȱ dating as far back as the early 1980's became
the focus of his 2nd work. This highly original course of over ŝśŖȱ ȱ is a ¡ȱ ȱ ȱ
ȱȱȱȱȱȱ¢ȱȱȱę¢ȱȱȱȱǯȱ
ȱȱȱȱȱȱȱȱȱȱǰȱǰȱȱęȱȱȱ
ȱȱȱȱȱȱ ȱȱ¢ȱȱȱęȱȱȱȱȱȱ
events. This information is good to use on any pari-mutuel event, or any multi-contestant event the reader
may be interested in. ...ȱȱȱȱǰȱȱ ǰȱȱǯ
An intermediate level of understanding of astrological concepts and terminology are required as a
base to understand the material. Number and time cycles are also used and explored and have a power of
their own. Every known modern and ancient system of astrological prediction of such events has been
studied and compiled in this Magnum Opus of racing prediction wisdom. ȱ ǰȱ ȱ ¢ȱ ȱ
ȱȱȱȱȱȱȱȱȱȱǷȱ
Includes Advanced Software with ALL Horses, Tracks & Horoscopes already entered and working...
ȱ ȱ-ȱThe Periodic Table & The Law of Vibration
PenickaȂs Gann Science provides a viable solution to the Law of Vibration as Gann originally presented
ȱ ȱ ȱ ȱ ȱ ȱ ¢ěȱ ȱ 7KH7LFNHUDQG,QYHVWPHQW'LJHVWLQ
7KHDXWKRUWDNHV*DQQ¶V
H[DFWZRUGVDQGFRUUHODWHVWKHPZLWKWKHFXWWLQJHGJHVFLHQFHRI*DQQ¶VGD\WRGHPRQVWUDWHZKDW*DQQPHDQWZKHQKH
VDLGȃȱ ȱ ȱ Ȅ. He ȱȱ¢ȱ ȱęȱȱ¢ȱ ȃmathematical points of forceȄȱ
that governthe structure behind the market.
The author builds a solid foundation in the Natural Sciences of GannȂs day, showing how the emerging
science of the Periodic Table of Atomic Elements provides a system of order based upon the vibrational values of
the elements WKHPVHOYHV:KHQWKHHOHPHQWDOVWUXFWXUHLVGHWHUPLQHGIRUDQLQGLYLGXDOPDUNHWDȱ ȱ
ȱȱęȱȱȱȱ ȱȱȱȱȱȱȱȱȱȱȱǯȱ
INSTITUTE
Ԥ
WWW.COSMOECONOMICS.COM
EMAIL: INSTITUTE@COSMOECONOMICS.COM ԤUS FREE: 800-756-6141 ԤINTL: 951-659-8181
OF
COSMOLOGICAL ECONOMICS
WWW.TRADERSWORLD.COM July, August. September 2023
46
HOW TO TRADE LIKE W.D. GANN
PART - THE ADVANCED LESSONS
ђюџѠȱќѓȱђѓіћђёȱѤіћєȬџюёіћєȱѢљђѠȱіћȱȱђѠѠќћѠȱ
юћћȂѠȱђџѓђѐѡђёȱџюёіћєȱђѡѕќёќљќєѦȱюѢєѕѡȱѡќȱ іѠȱѡѢёђћѡѠȱ
BѦ TіњќѡѕѦ Wюљјђџ
W. D. GANN’S MECHANICAL SWING-TRADING SYSTEM EXPLAINED
PART 2 CHARTS 6 MORE SETS OF GANNȂS LESSONS
DEVELOPING MORE ADVANCED SYSTEM RULES
Part 1 on GannȂs ȱ ȱ ȱ ,
contained 16 yearsȂȱof examples on US Steel. But it was
not the only lesson that Gann wrote to illustrate his
ȱȱȱȱȱȱȱęǯȱ
There are a further six lessons! They show the
development of GannȂs teaching over a period of
nearly 25 years. The method remains basically the
same, but he made discoveries and additions to it.
More importantly, his own ability to put his thoughts
into words and examples grew over time. This second
book will complete the exploration of GannȂs
Mechanical Swing-Trading Methods.
- Chrysler Motors (1935) –ȱ the further
development of the US Steel system, using the
weekly chart, which Gann liked for stocks.
- Soybeans (1941) –ȱ a campaign lasting just over
one year that turned $1,000 into $57,000.
- ¢ȱ ǻŗşŚŜǼȱ ȱ Ĵȱ ǻŗşŚŜǼȱ –ȱ¡ȱěȱȱ
version of GannȂs trading system, expanded to 29
Rules plus resistance levels & a change in trend.
- Soybeans (1950) –ȱfor commodities using the 2day swing chart expanding the rules including the
most detailed examples of how Gann trades.
- Eggs (1949) –ȱ2-day swing chart, how to combine
ȱȱěȱȱǭȱȱȁcinchȂȱtrade.
- Rye and Soybeans (1954) –ȱ a lesson for
beginners from near the end of GannȂs life, with
ȁthe greatest advance in May Soybeans in historyȂǰȱ
turning $3,000 to $94,000 in 8 months!
ROBERT RUNDELȂS - MAGIC WORDS THRU THE ZODIAC
A DECODER KEY FOR GANNȂS ȁTUNNEL THRU THE AIRȂ
VOLUME 3 - NOW AVAILABLE!
VOL-3 THE LANGUAGE OF THE BRANCHES
Vol 1 - A Guide to the Work - Vol 2 - The Advanced Findings
ȱȱȱȱȱȱŗȱintroduces the Keys to cracking the complex symbolic
code that Gann used to conceal his greatest secrets within Tunnel.
It unveils a Masonic Gematria cypher which serves to decrypt
references and clues concealed in names, dates and other key
ȱȱȱ¡ǯȱȱĴȦȱȱȱȱȱ
determine potential anchor points for the engineering of important
underlying market cycles hidden by Gann in this way.
Volumes 2 & 3 continue RundleȂs research into further
advanced topics and references which conceal even more deeply
hidden and important RundleȂs research slowly unravels the
secrets of GannȂs system encoded into Tunnel. The insights in these
volumes represents over 25 years of ongoing tireless research!
INSTITUTE
OF
COSMOLOGICAL ECONOMICS
Ԥ
WWW.COSMOECONOMICS.COM
EMAIL: INSTITUTE@COSMOECONOMICS.COM ԤUS FREE: 800-756-6141 ԤINTL: 951-659-8181
WWW.TRADERSWORLD.COM July, August. September 2023
47
Algorithmic Trading
for Private Investors
C
High probability trade setups
Operate with clearly defined entries, exits, and stops.
Bring AI into your trading and keep the final decision.
'D\7UDGLQJ
x 6ZLQJ7UDGLQJ
x /RQJ7HUP,QYHVWLQJ
:H WHDFK RXU FRQFHSWV DQG VWUDWHJLHV RQHRQRQH RQO\
WDLORULQJRXUSURJUDPVWR\RXUZDQWVDQGQHHGV
6FKHGXOHD)UHH&RQVXOWLQJ+RXU
Experience how NeverLossTrading works in real-time and
which concept suits you best.
x
One-on-one training/coaching:
x Trading Strategies
x Money Management
x Risk Management
Assets ready for price moves
Tutorials, financial plan, action
plan, position sizing...
WWW.TRADERSWORLD.COM July, August. September 2023
48
The Significance of High Probability Trading
Thomas Barmann of NeverLossTrading
In the financial markets, traders constantly seek an edge to improve their
profitability. One crucial aspect of successful trading is using high-probability
indicators and strategies. These tools provide traders with valuable insights into
market directions and help them make informed decisions, ultimately increasing
their chances of success. This article will explore the importance of trading with
high-probability indicators and strategies and how they can significantly enhance
trading outcomes.
%HQHILWVRI+LJK3UREDELOLW\,QGLFDWRUV
High-probability indicators identify trading opportunities with a higher chance of
success and start with accurately forecasting the future price movements of
assets >65%, operating with a solid statistical edge and reducing the risk of false
signals or unprofitable trades, resulting in:
x
x
x
Enhanced Risk Management: Effective risk management is crucial in
trading. High probability indicators give traders more precise insights into
potential risk-reward ratios, allowing them to set appropriate stop-loss
levels and target profits, resulting in better risk management and
preserving capital in adverse market conditions.
Objective Decision Making: Emotions can cloud judgment and lead to
impulsive trading decisions. High probability indicators offer an objective
framework for decision-making, reducing the impact of emotions and
increasing trading discipline. As a result, traders can stick to their
strategies, avoid chasing unreliable signals, and maintain a consistent
approach.
Selecting Best Chances: By employing a systematic approach, traders can
filter out low-quality trades and focus on high-probability setups, enabling
consistent decision-making across different market conditions, reducing
WWW.TRADERSWORLD.COM July, August. September 2023
49
x
guesswork, and fostering a more systematic approach to achieve longterm profitability.
High-probability strategies can be adapted to different timeframes and
asset classes. Traders can tailor their strategies to suit their preferred
trading style: day trading, swing trading, or long-term investing. This
flexibility allows for better alignment with individual preferences and
market dynamics.
High probability systems specify trade setups in three dimensions:
Dimension-1: Buy or Sell threshold to enter a trade, to assure other market
participants trade in the same direction as you plan to
Dimension-2: Trade target, high probability exit to close the transaction
Dimension-3: Stop or trade adjustment level
The crowd follows the leaders. Hence we like to share our price move model
based on price change resulting from a supply and demand change.
NeverLossTrading Price Move Model
Now that we know how to specify the conditional entry, we need to specify the
positive exit and use what we call the SPU (Speed Unit)
Definition of NLT SPU
After defining two variables, we must specify the stop or trade adjustment level.
WWW.TRADERSWORLD.COM July, August. September 2023
50
What is a trade adjustment level?
It is the price to put the stop; however, instead of closing the trade at the stop
price level, you adjust or add to the trade, repairing the trade instead of
accepting a complete loss. The idea of Never Stop Loss Trading gave us our
brand name, but we shortened it a little.
So where to place the stop?
By our research, a risk-to-reward ratio of 1.2 concerning is beneficial for several
reasons:
x
x
x
x
Compensating for Uncertainty: There's always a degree of uncertainty in
trading. By employing a risk-to-reward ratio of 1.2, you provide a buffer
that compensates for potential unexpected price movements or market
volatility. This buffer helps account for the natural unpredictability of the
financial markets
Improved Win Rate: A risk-to-reward ratio of 1.2 can contribute to an
increased win rate. When the potential reward is slightly higher than the
risk, successful trades impact your overall profitability more. Therefore,
even if your win rate is not extraordinarily high, the favorable risk-toreward ratio can help generate consistent profits over time.
Balancing Risk and Reward: Using a risk-to-reward ratio of 1.2 ensures
that your potential reward is proportionate to the risk taken. In addition, it
establishes a balanced approach to trading, where you aim to maximize
your gains while managing and limiting potential losses.
Long-Term Profitability: A risk-to-reward ratio of 1.2 can contribute to
sustainable profitability over the long term. Maintaining a balanced riskreward profile creates a solid foundation for your trading strategy,
promoting consistent returns and minimizing the impact of occasional
losses.
You might think that a 1.2 times risk to reward is unfavorable; however, calculate
with an average winning percentage of 70%. For example, when you aim to gain
$250, you risk $300. Quantifying the equation with probability, the expectation
value of this setup is $250 x 0.7 - $300 x 0.3 = $85. However, if you work with a
narrow stop, you only win 20% of the time; for the rest, you get stopped, and
the equation calculates as follows: $250 x 0.2 - $100 x 0.8 = -30, producing a
negative expectation value with no chance of making money long-term.
2. Indication and Strategy
A trading indication and a strategy are two concepts in the trading field. Here's a
breakdown of their differences:
x
A trading indication, or a trading signal, refers to a specific event or
condition that suggests potential trading opportunities generated by
technical analysis tools, indicators, or algorithms that analyze market
data. Trading indications can be based on various factors such as price
movements, volume, patterns, or other market variables. They provide
traders with a signal to take action, such as entering or exiting a trade. In
WWW.TRADERSWORLD.COM July, August. September 2023
51
x
addition, trading indications highlight potential market conditions or
patterns that could be favorable for trading.
A trading strategy, on the other hand, is a broader plan that outlines a
trader's approach to the market. It encompasses a set of rules, guidelines,
and parameters that govern the trader's decision-making process
throughout different market conditions. A trading strategy considers
various factors, including market analysis, risk management, entry and
exit criteria, position sizing, and more. It provides a structured framework
for traders to make consistent trading decisions over time. Unlike a trading
indication, a strategy is not a specific event or signal but a comprehensive
plan that guides a trader's overall approach to trading.
In summary, a trading indication refers to a specific signal or event that suggests
a trading opportunity. In contrast, a trading strategy is a broader plan
encompassing rules and guidelines for consistently making trading decisions.
Trading indications can be part of a trading strategy and used as inputs for
decision-making. In this publication, we combine high-probability trade
indications with momentum and breakout strategies:
x
x
Breakout Trading involves entering trades when the price breaks out of a
defined range or a significant level of support or resistance. Traders using
breakout strategies attempt to capture pre-specified price movements
after a breakout. Our charts will include crucial breakout channels for day
and swing trading, where the system specifies and points critical border
breaks and border-to-border price attraction points.
Momentum trading focuses on assets exhibiting strong upward or
downward price momentum. They aim to enter positions in the direction of
the prevailing directional price move. Instead of assuming a longer-term
trend, the action focuses on acting at crucial price turning points with a
specific entry price level to a system-specified target and stop.
3. Examples
Let us start with day trading. Unfortunately, most day traders tend to overtrade
and, by their constant participation, reduce their profitability expectations. The
mindset of a high participation rate will be detrimental to your account balance,
and we will now put proof to this:
In our concept of day trading, we want NLT users to strive for a minimum return
per trade of $250, and when you consider a 1.2 times risk, this relates to a risk
of $300 per trade. Therefore, for calculating how often you want to trade an
instrument to achieve the highest statistical expectation value, we need to
consider various combinations of wins and losses to calculate the probability of
making $250 with a 70% winning probability and a $300 loss when losing. The
following are the variables to choose from:
W: Win
L: Loss
P(W): Probability of winning (70%)
P(L): Probability of losing (30%)
G: Gain per trade ($250)
L: Loss per trade ($300)
WWW.TRADERSWORLD.COM July, August. September 2023
52
In the next step, we create a probability table for different scenarios considering
trading one, two, or three times a day, integrating the probability of a series:
When you have a 70% chance of winning, the statistical likelihood of winning
three times in a row is 70% x 70% x 70% = 34%
dƌĂĚĞƐ
ϭ
ϭ
Ϯ
Ϯ
Ϯ
ϯ
ϯ
ϯ
ϯ
tŝŶƐ;tͿ
>ŽƐƐĞƐ;>Ϳ WƌŽďĂďŝůŝƚLJ
ϭ
Ϭ
Ϯ
ϭ
Ϭ
ϯ
Ϯ
ϭ
Ϭ
Ϭ
ϭ
Ϭ
ϭ
Ϯ
Ϭ
ϭ
Ϯ
ϯ
ϮΎW;tͿΎ;ϭͲW;tͿͿ
ϮΎW;>ͿΎ;ϭͲW;>ͿͿ
W;tͿΔϮ
ϮΎW;tͿΎW;>Ϳ
W;>ͿΔϮ
W;tͿΔϯ
ϯΎW;tͿΔϮΎW;>Ϳ
ϯΎW;tͿΎW;>ͿΔϮ
W;>ͿΔϯ
'ĂŝŶ;tΎ'Ϳ >ŽƐƐ;>Ύ>Ϳ
ΨϮϱϬ
Ϭ
ΨϱϬϬ
ΨϮϱϬ
Ϭ
ΨϳϱϬ
ΨϱϬϬ
ΨϮϱϬ
ΨϬ
Ϭ
ΨϯϬϬ
Ϭ
ΨϯϬϬ
ΨϲϬϬ
Ϭ
ΨϯϬϬ
ΨϲϬϬ
ΨϵϬϬ
EĞƚ'ĂŝŶ
WƌŽďĂďŝůŝƚLJΎ
džƉĞĐƚĂƚŝŽŶ ZĞůĂƚŝŽŶƚŽƚŚĞ
;'ĂŝŶͲ>ŽƐƐͿ EĞƚ'ĂŝŶ
sĂůƵĞ
ηŽĨdƌĂĚĞƐ
ΨϮϱϬ
Ψϭϳϱ
ͲΨϯϬϬ
ͲΨϵϬ
Ψϴϱ KŶĞdƌĂĚĞ
ΨϱϬϬ
ΨϮϰϱ
ͲΨϱϬ
ͲΨϭϱ
ͲΨϲϬϬ
ͲΨϭϴϬ
ΨϱϬ dǁŽdƌĂĚĞƐ
ΨϳϱϬ
Ψϭϱϴ
ΨϮϬϬ
ΨϭϬϱ
ͲΨϯϱϬ
ͲΨϭϴϵ
ͲΨϵϬϬ
ͲΨϮϰϯ
ͲΨϭϳϬ dŚƌĞĞdƌĂĚĞƐ
The table shows that the trader striving for one trade per day produces the
highest expected income, 70% higher than the expected value of striving for two
trades per day. Conversely, trading three times a day has a negative expectation
value.
Resulting action:
x
x
x
x
Fold trading is the instrument of choice after the first winner, which gives a
70% higher income expectation than a two trades per-day focus.
If your first trade loses, risk a second but only at high probable setups.
Never trade one asset more than two times in a day because three trades
have an overall negative expectation value
To strive for additional streams of income, trade multiple uncorrelated
instruments like a Stock Market Index, Crude Oil, and Euro/Dollar. In the
following, we share examples of those futures contracts.
How to find high-probability setups with a 70% chance of forecasting the price
move: Combining breakout and momentum indications and strategies.
Our system identifies critical day trading breakout zones by color-coding them in
gray, yellow and green. We then combine solid directional signals with those
channel breaks to obtain increased probabilities with the following:
x
x
x
x
x
System-specified price thresholds to enter trades so that you can operate
with buy-stop and sell-stop orders in the development of a price move
Forecasting high probable exit points where your trades close with limitorders
Set risk/reward-adequate stops to bring your trade to target and not
violate risk acceptance rules
Accepting strong price move indications only when the price breakout of a
system-specified price-containment or channel breaks without hindrance
to the target.
In our future trading examples, to strive for the desired target of $250
income per trade, you would trade two /6E (Euro/Dollar) and one /ES (EMini S&P 500 contract) or one /CL (Crude Oil contract). The required
margin per trade varies by broker between $500 and $12,000. If you can
WWW.TRADERSWORLD.COM July, August. September 2023
53
trade CFDs, your margin requirements provide the highest flexibility and
vary by broker.
NLT Timeless Day Trading at Channel Breaks
On the above day trading chart, you see two channels: gray and yellow. High
probability setups are when price moves breakout of the channels or revert to
the channel.
Situation-1: Buy > $1,0808, breaking out of the channel and reaching its target
(gray dot)
Situation-2: Sell_T < $1,0822, moving towards the gray channel, reaching its
target (gray dot)
Situation-3: Buy > $1.0819, passing the yellow channel and reaching its target.
Next, you see a live trade on the NLT Timeless Crude Oil Futures chart where the
price moved back into the channel and was assumed to get attracted to the
opposite channel border: Buy > $72.35 was suitable for a price change of the
underlying contract of about $600, and the trade came to target in about 20
minutes. The chart we share shows the trade entry screenshot:
x
x
x
Operating with buy-stop orders, the trade filled in the next candle's price
movement by surpassing the price threshold of $72.35
The stop for the trade was dimensioned below the dashed gray line and
kept risk/reward in a favorable relation
The trade target was put right below the yellow channel border, which was
reached at the commencement of the price movement of Crude Oil
Futures.
WWW.TRADERSWORLD.COM July, August. September 2023
54
Yes, all three trades came to target; however, with your new knowledge, your
best chance was to move to the following trading instrument of choice to trade
with the odds in your favor.
NLT Timeless Day Trading at Channel Breaks
The crude oil example shows you trade with a $600 reward expectation and a
referring $720 risk: $250 is just our minimum expectation for a unit of reward to
strive for.
The chart shows the screenshot at entry, and you see the upper yellow channel
border as a strong attraction point, like a price gravitation point. So we took
profit right before this border and closed the trade.
Day trading, at any instance, we work with buy-stop or sell-stop limit bracket
orders, which helps traders to:
x
x
x
Pre-enter the order instead of acting after the fact when an NLT price
threshold is surpassed
Having the target in place at the entry
Giving the trade enough room to unfold by an adequate stop.
Systematic trading is essential for long-term success.
We tell our students: to act like mountain lions, waiting for the moment a trade
with specific conditions comes their way and then strike, act, putting the order in
the market. But, unfortunately, constantly running after prey is not a successful
concept, and you now have statistical proof.
WWW.TRADERSWORLD.COM July, August. September 2023
55
Indeed, you can also trade stocks with channel border break, but today we focus
on Futures; they are solid day trading instruments where the /ES, E-mini S&P
500 Futures Contract is the most favored.
NLT Timeless Day Trading at Channel Breaks
The trade was good for a $262.50 price move per contract, following the NLT
principles.
Our systems also work for day trading Stocks and FOREX, and we are happy to
give you a demonstration:
contact@NeverLossTrading.com Subj. Demo
After sharing high-probability day trading setups, let us share swing trading
examples, holding stock positions for multiple days. Again we combine chart
indications with momentum and price breakout strategies.
x
x
x
x
Strong price move indication (announced by several NLT systems)
Uncorrelated price move (independent price movers produce more
directional price pressure)
The critical price channel in this concept is coded in cyan, and the channel
break offers a strong price move potential to the upside or downside
Improved reward-to-risk relation by trading for a 2-SPU target
In our first example, we pick IBM:
WWW.TRADERSWORLD.COM July, August. September 2023
56
IBM High Probability Trade Example
Chart Analysis
At Entry
x
x
x
x
x
x
Buy > $122.86, May 12, 2023, confirmed in the price movement of the
next candle, triggering the buy-stop order
The buy signal had a target at $126.20 (second blue dot)
The stop was below the signal-candle
The price broke out the cyan color channel indicating a solid price move
potential
The price move was uncorrelated, as the lower study indicates,
announcing a robust individual stock price move with institutional
engagement
If you want to use a trailing stop, use the red line of the NLT Double
Decker, which frames the price move and colors up-momentum in blue and
down in red. However, we highly recommend exiting after a 3-SPU move.
At Exit
x
x
x
On May 18, the trade came to its system-set target.
The transaction achieved a 2.7% return in four trading days or six days,
including the weekend. Again we propose a minimum risk unit of $300 and
a referring $250 return, striving for a swing trading budget of
$1,000/week
In case you trailed the stop, at the 3-SPU move, we expect institutional
holder to re-balance their inventories and flood supply with the assumption
of a potential price pullback. Hence, we take profit when the price expands
for 3-SPUs from entry.
WWW.TRADERSWORLD.COM July, August. September 2023
57
AMZN, High Probability Trade Example
AMZN, after going through a time of indecision (NLT Purple Zone), combined two
strong buy signals (Buy > $110.67) and made a price move to its target on
5/17/2023. If you trailed the stop, you took the 3-SPU expansion exit on May 18,
2023.
We want to make you a special offer: For three months after the publication of
the Worlds Traders Magazine, day traders will receive the day trading channels
for free and swing traders the cyan breakout channels ($2,497 value), helping
you to make sound and highly probable trading decisions:
contact@NeverLossTrading.com Subj.: WTM #89
When you operate with NLT Top-Line, you can find those opportunities by
analyzing the markets with your own scanners or by subscribing to the NLT Alerts
and never be late for a trade.
Email us, and we will send you a week of free swing trading alerts.
contact@NeverLossTrading.com Subj.: Swing Trading Alerts
WWW.TRADERSWORLD.COM July, August. September 2023
58
1. Patience
Patience is a virtue in trading. The most accomplished traders understand that
waiting for the right opportunity is often more rewarding than chasing every
trade. As a result, they possess the patience to wait for high-probability setups,
allowing them to enter positions with a better risk-reward ratio. Patience also
helps traders withstand temporary market fluctuations without succumbing to
fear or greed.
Odds Based Trading
Traders are probability thinkers; they act when it is highly probable to win. We
help our subscribers to specify those action points with odds-based decisionmaking models. The above table is for day trading by combining NLT
TrendCatching and Timeless Indicators. Following the model, solid traders wait
for NLT Floating signals at a channel-breaks to act. In addition, they check for
volume support and ensure no hindrance is in the way of an evolving price move.
The patience to wait for the right moment bends the odds in your favor;
widespread trading is not a successful model.
2. Risk Management
Effective risk management is paramount to long-term success in trading. The
best traders understand the importance of preserving capital and protecting
against potential losses. Accordingly, they employ strict risk management
techniques such as setting appropriate stop-loss levels, diversifying their
portfolios, and sizing their positions according to risk tolerance. By managing risk
prudently, successful traders can weather market volatility and avoid catastrophic
losses.
On our NLT Timeless charts, we use system-defined price increments to specify
the start and end of every candle, helping you multifold:
x
x
x
Each setup is in the system-appropriate risk/reward ratio, which is often
not given in time-based candles
Your entries and stops are less predictable by not following time-based
patterns
You trade for meaningful minimum price changes of the underlying instead
of being eaten up in volatility
WWW.TRADERSWORLD.COM July, August. September 2023
59
On day trading charts, we work with solid stops, while on swing-trading
positions, we teach you methods of trade repairs. The concept of repairing a
trade instead of accepting the stop was the basis for our brand name: Never
Stop Loss Trading, but we found it a bit lengthy. Hence, when a stop is triggered
on a stock trade, you protect the trade with options strategies, living through
times of trouble by collecting premiums. Imagine when you work with a high
probability of 70% and the 30% trades you lose, you can exit at breakeven;
what would that do to your expected result?
Calculation Example of Working with Protection
The table shows when you manage to exit losing trades at breakeven, the
expectation value of your profitability increases by 100%. If you can cut losers in
half by protecting your trades, your profit expectation increases by 39%. Hence,
a valuable piece of knowledge only a few traders possess, and we teach the
details in our trading programs.
3. Continuous Learning
The financial markets are ever-evolving, and the most successful traders never
stop learning. They thirst for knowledge and stay updated with market trends,
economic indicators, and trading strategies. Continuous learning enables traders
to adapt to changing market conditions, identify new opportunities, and refine
their skills. In addition, successful traders are committed to improving their
expertise through books, courses, mentorship, and networking with other
professionals. They constantly check the market for what is possible instead of
focusing on what they want to do.
Let us repeat that: the market conditions allow for the trading strategy regarding
holding open positions: day trading always works, swing trading is mostly
applicable, while longer-term holding of positions is not always favored.
We like the analyze the overall stock market development by the S&P 500, based
on SPY (ETF). Our charts color upwards-moves in blue and down-moves in red.
When the price movement has no up or down momentum, red and blue mix
building what we call an NLT Purple zone (directional price ambiguity): This was
the case from the week of 1/16/2023 to the end of the week of May 19, 2023.
Hence, we did not commit to longer-term trades, even if we wanted to.
Hence day trading and swing trading were the proposed strategies.
On the NLT Top-line chart, you see multiple indications for price move potentials,
which came to their target with a high likelihood. However, you also see an
expanded NLT Purples Zone where decision-making from weekly charts was not
advisable.
WWW.TRADERSWORLD.COM July, August. September 2023
60
Stock Market Development 2020 to 2023
A narrow indicator-based view makes the sideways price move of the stock
market more visible, while we now see a possibility for an upside breakout.
Learning from the market and picking the right strategy is essential. The same
counts for day traders: when trading short-term, you must be aware of important
news events and combine them with the overall market view. We post critical
news events on our Instagram channel.
WWW.TRADERSWORLD.COM July, August. September 2023
61
4. Emotional Intelligence
Emotional intelligence plays a crucial role in trading success. Top traders deeply
understand their emotions and how they can influence decision-making. As a
result, they can manage stress, remain calm during market turbulence, and
avoid making impulsive decisions driven by fear or greed. Emotional intelligence
lets traders stay objective and rational, leading to more informed and consistent
trading outcomes. Trading can be a challenging endeavor, with both wins and
losses along the way. Successful traders possess resilience and mental fortitude
to bounce back from setbacks. They view losses as learning opportunities and do
not let temporary setbacks discourage them, stay committed to their strategies,
learn from their mistakes, and keep pushing forward despite obstacles. Financial
markets are dynamic and constantly evolving, and successful traders quickly
adapt, stay flexible and open-minded, and are willing to adjust their approaches
based on changing market conditions. They embrace new technologies,
incorporate new trading tools, and remain adaptable in their methods to stay
ahead of the curve.
5. Conclusion
Trading with high-probability indicators and strategies is a prudent approach for
achieving consistent profitability in the financial markets. These tools provide
traders with objective insights, improved risk management, and greater
confidence in their decision-making. In addition, by focusing on setups with a
statistically higher likelihood of success, traders can enhance their trading
outcomes and increase their chances of long-term success. However, it's
important to remember that no strategy can guarantee 100% accuracy, and
prudent risk management and continuous learning remain essential elements of
a successful trading journey.
Becoming a successful trader requires skills, attitude, and relentless dedication.
Discipline, patience, risk management, continuous learning, and emotional
intelligence are vital attributes shared by the most accomplished traders. While
technical analysis and market knowledge are essential, cultivating these qualities
is equally important to navigate the complexities of financial markets. By
embodying these skills and adopting the right mindset, aspiring traders can
position themselves for long-term success in the highly competitive world of
trading.
You best learn from experience, and we are happy to show you what our systems
and strategies can do in a live session.
contact@NeverLossTrading.com Subj. Demo (WTM #89)
NeverLossTrading is a trading education and software company that aims to help
traders improve their performance and profitability in the financial markets by:
x
Personalized Coaching: in one-on-one sessions, you learn customized
trading strategies that fit your unique needs and goals. This personalized
approach can help traders better understand the markets and make more
informed trading decisions.
WWW.TRADERSWORLD.COM July, August. September 2023
62
x
Trading Software: NeverLossTrading offers proprietary software that
provides real-time market analysis and trading signals. Our indicators are
designed to help traders automate their trading decisions and execute
trades with greater accuracy and efficiency.
x
Comprehensive Training: We provide extensive training and education
materials to help traders learn the fundamentals of trading and develop
the skills and knowledge necessary to succeed in the markets.
To succeed in trading, you best work with an experienced coach. Our #1
competitive advantage is the support and customer service we offer. Veteran
traders have been through more ups and downs than you can imagine. So,
experienced pros have probably experienced whatever you're going through.
Regardless of the market's direction, some strategies work best, and we want
you to have the skillset and tools to go with the market flow in bull markets,
bear markets, and times of directional ambiguity.
If you are ready to make a difference in your trading: We are happy to share our
experiences and help you build your trading business. Trading is not a typical
career, and you best learn from those who are long-term in this business to cope
with the rollercoaster of the financial markets. We are here to help and provide
feedback on what you might be doing right or wrong. Strive for improved trading
results, and we will determine which of our systems suits you best. The markets
changed, and if you do not change your trading strategies with them, it can be a
very costly undertaking. The markets changed, and it can be expensive if you do
not change your trading strategies with them. However, you can make a
difference with the right skills and tools!
Hence, take trading seriously, build the skills, and acquire the tools needed.
Trading success has a structure you can create and follow.
Thomas Barmann (inventor and founder of NeverLossTrading)
www.NeverLossTrading.com
Disclaimer, Terms and Conditions, Privacy | Customer Support
WWW.TRADERSWORLD.COM July, August. September 2023
63
hƐŝŶŐƩƌĂĐƚŽƌƐƚŽWƌĞĚŝĐƚWƌŝĐĞDŽǀĞŵĞŶƚ
LJ^ƵŶŶLJ:͘,ĂƌƌŝƐ
/ŶƚŚĞĞŐŝŶŶŝŶŐ
KŶĞŽĨƚŚĞĮƌƐƚƚŚŝŶŐƐLJŽƵůĞĂƌŶĂƐĂŶĞǁƚƌĂĚĞƌŝƐŚŽǁƚŽĚƌĂǁŚŽƌŝnjŽŶƚĂůůŝŶĞƐ͘^ƵƉƉŽƌƚĂŶĚZĞƐŝƐƚĂŶĐĞ͘
^ƵƉƉŽƌƚďĞĐŽŵĞƐZĞƐŝƐƚĂŶĐĞĂŶĚZĞƐŝƐƚĂŶĐĞďĞĐŽŵĞƐ^ƵƉƉŽƌƚ͘dŚĂƚ͛ƐƉƌŽďĂďůLJƚŚĞĮƌƐƚdĞĐŚŶŝĐĂůŶĂůLJƐŝƐ
/ĞǀĞƌůĞĂƌŶĞĚ͘
ĐĐŽƌĚŝŶŐƚŽ/ŶǀĞƐƚŽƉĞĚŝĂ͗
x
x
x
x
dĞĐŚŶŝĐĂůĂŶĂůLJƐƚƐƵƐĞƐƵƉƉŽƌƚĂŶĚƌĞƐŝƐƚĂŶĐĞůĞǀĞůƐƚŽŝĚĞŶƚŝĨLJƉƌŝĐĞƉŽŝŶƚƐŽŶĂĐŚĂƌƚǁŚĞƌĞ
ƚŚĞƉƌŽďĂďŝůŝƚŝĞƐĨĂǀŽƌĂƉĂƵƐĞŽƌƌĞǀĞƌƐĂůŽĨĂƉƌĞǀĂŝůŝŶŐƚƌĞŶĚ͘
^ƵƉƉŽƌƚŽĐĐƵƌƐǁŚĞƌĞĂĚŽǁŶƚƌĞŶĚŝƐĞdžƉĞĐƚĞĚƚŽƉĂƵƐĞĚƵĞƚŽĂĐŽŶĐĞŶƚƌĂƚŝŽŶŽĨĚĞŵĂŶĚ͘
ZĞƐŝƐƚĂŶĐĞŽĐĐƵƌƐǁŚĞƌĞĂŶƵƉƚƌĞŶĚŝƐĞdžƉĞĐƚĞĚƚŽƉĂƵƐĞƚĞŵƉŽƌĂƌŝůLJ͕ĚƵĞƚŽĂĐŽŶĐĞŶƚƌĂƚŝŽŶ
ŽĨƐƵƉƉůLJ͘
DĂƌŬĞƚƉƐLJĐŚŽůŽŐLJƉůĂLJƐĂŵĂũŽƌƌŽůĞĂƐƚƌĂĚĞƌƐĂŶĚŝŶǀĞƐƚŽƌƐƌĞŵĞŵďĞƌƚŚĞƉĂƐƚĂŶĚƌĞĂĐƚƚŽ
ĐŚĂŶŐŝŶŐĐŽŶĚŝƚŝŽŶƐƚŽĂŶƚŝĐŝƉĂƚĞĨƵƚƵƌĞŵĂƌŬĞƚŵŽǀĞŵĞŶƚ͘
dŚĞLJŐŽŽŶƚŽĂĚĚ͗
x
^ƵƉƉŽƌƚĂŶĚƌĞƐŝƐƚĂŶĐĞĂƌĞĂƐĐĂŶďĞŝĚĞŶƚŝĨŝĞĚŽŶĐŚĂƌƚƐƵƐŝŶŐƚƌĞŶĚůŝŶĞƐĂŶĚŵŽǀŝŶŐĂǀĞƌĂŐĞƐ͘
dŚĞŶ͕ƐŝŶĐĞDŽǀŝŶŐǀĞƌĂŐĞƐƉƌŽǀŝĚĞƐƵƉƉŽƌƚĂŶĚƌĞƐŝƐƚĂŶĐĞ͕ƐŽƚŚĞŶŵƵƐƚĐŚĂƌƚĨŽƌŵĂƚŝŽŶƐƐƵĐŚĂƐ
WĞŶŶĂŶƚƐ͕dƌŝĂŶŐůĞƐ͕&ůĂŐƐ͕,ĞĂĚΘ^ŚŽƵůĚĞƌƐĞƚĐ͘/D,Kϭ͘
/ŶŽƚŚĞƌǁŽƌĚƐ͕ĞĂĐŚŽĨƚŚĞƐĞĨŽƌŵĂƚŝŽŶƐ͞ĂƚƚƌĂĐƚƐ͟ƉƌŝĐĞƚŽŝƚ͕ǁŚĞƚŚĞƌĨƌŽŵĂďŽǀĞŽƌďĞůŽǁ͘/ĐĂůů
ƚŚĞƐĞƉĂƚƚĞƌŶƐ;ŝŶĐůƵĚŝŶŐĂůůŬŝŶĚƐŽĨƐƵƉƉŽƌƚĂŶĚƌĞƐŝƐƚĂŶĐĞ͕ĂŶĚƚĞĐŚŶŝĐĂůŝŶĚŝĐĂƚŽƌƐͿƚƚƌĂĐƚŽƌƐ͘WƌŝĐĞ
ŝƐĂƚƚƌĂĐƚĞĚƚŽĐĞƌƚĂŝŶĂƌĞĂƐŽŶĐŚĂƌƚƐďLJƐƵƉƉůLJĂŶĚĚĞŵĂŶĚĂŶĚďLJďƵLJĞƌƐĂŶĚƐĞůůĞƌƐƚĞƐƚŝŶŐƚŚĞƐĞ
ĂƌĞĂƐƚŽƐĞĞǁŚĞƚŚĞƌƚŚĞLJŚŽůĚ͘
KŶŽŝŶŝŶŐƚŚĞdĞƌŵ
^ƵŶŶLJ,ĂƌƌŝƐĐŽŝŶĞĚƚŚŝƐƚĞƌŵƚŽƌĞĨĞƌƚŽƚŚĞŵĂƌŬĞƚΖƐƚĞŶĚĞŶĐLJƚŽƌĞǀĞƌƚƚŽƚŚĞŵĞĂŶ͘ŶƩƌĂĐƚŽƌĐĂŶ
ďĞĂůŝŶĞŽĨƐƵƉƉŽƌƚŽƌƌĞƐŝƐƚĂŶĐĞ͕ĂŵŽǀŝŶŐĂǀĞƌĂŐĞ͕ŽƌĂƚƌĞŶĚůŝŶĞ͘dŚĞŵĂƌŬĞƚƐƚĞŶĚƚŽƌĞƚƵƌŶƚŽƚŚĞ
ƩƌĂĐƚŽƌƐ͘ŶƩƌĂĐƚŽƌŝƐŽŌĞŶĂŚŽƌŝnjŽŶƚĂůůŝŶĞŽƌĂƚƌĞŶĚůŝŶĞĚƌĂǁŶ͕ŶŽƚŽŶŚŝŐŚƐĂŶĚůŽǁƐ͕ďƵƚĂƚƚŚĞ
ƉƌĞƉŽŶĚĞƌĂŶĐĞŽĨƉƌŝĐĞƐ͘ƩƌĂĐƚŽƌƐĂƌĞĚƌĂǁŶĂƌŽƵŶĚŚĞĂǀLJŵĂƌŬĞƚĂĐƟǀŝƚLJ͕ŶŽƚŽŶĞdžƚƌĞŵĂ͘
&ŽƌŝŶƐƚĂŶĐĞ͕ŝŶ&ŝŐƵƌĞϭLJŽƵĐĂŶƐĞĞƚŚĂƚ/͛ǀĞĚƌĂǁŶĂŚŽƌŝnjŽŶƚĂůůŝŶĞĂĐƌŽƐƐƚŚĞƉůĂĐĞƐǁŚĞƌĞƉƌŝĐĞ
ŚĞƐŝƚĂƚĞƐĂŶĚƚƵƌŶƐĂƌŽƵŶĚ͘EŽ͕/ŚĂǀĞŶ͛ƚŵĂƌŬĞĚĂůůƚŚĞƚƌƵĞŚŝŐŚƐĂŶĚůŽǁƐ͘/͞ďůƵƌŵLJĞLJĞƐ͟ĂŶĚĐŚŽƐĞ
ƚŚĞĂƌĞĂƐǁŚĞƌĞƚŚĞƉƌĞƉŽŶĚĞƌĂŶĐĞŽĨƉƌŝĐĞƐƌĞǀĞƌƐĞĚŝƌĞĐƟŽŶ͘tŚĞŶ/ĚƌĞǁƚŚŝƐŚŽƌŝnjŽŶƚĂůůŝŶĞ͕/ǁĂƐ
WWW.TRADERSWORLD.COM July, August. September 2023
64
ŽŶůLJůŽŽŬŝŶŐĂƚƚŚĞƉƌŝĐĞƐŽŶƚŚĞůĞŌƐŝĚĞŽĨƚŚĞĐŚĂƌƚ͕ĂŶĚůŽĂŶĚďĞŚŽůĚƚŚĞLJĞĐŚŽĞĚŽŶƚŚĞƌŝŐŚƚƐŝĚĞŽĨ
ƚŚĞĐŚĂƌƚ͘
ƐǁŝƚŚƚƌĂĚŝƟŽŶĂůƐƵƉƉŽƌƚĂŶĚƌĞƐŝƐƚĂŶĐĞ͕ƐƵƉƉŽƌƚďĞĐŽŵĞƐƌĞƐŝƐƚĂŶĐĞĂŶĚƌĞƐŝƐƚĂŶĐĞďĞĐŽŵĞƐƐƵƉƉŽƌƚ͘
&/'hZ
ϭͶ^ŝŶŐůĞƚƚƌĂĐƚŽƌĐƌŽƐƐWƌŝĐĞƐ
tŚĂƚĂďŽƵƚƚƚƌĂĐƚŽƌƐŽĨĂĚŝĨĨĞƌĞŶƚĨůĂǀŽƌ͍,ŽǁĂďŽƵƚ&ŝďŽŶĂĐĐŝZĞƚƌĂĐĞŵĞŶƚĂŶĚ
džƚĞŶƐŝŽŶůŝŶĞƐ͍ KŶ
ƚŚĞĐŚĂƌƚŝŶ&ŝŐƵƌĞϮ/ŚĂǀĞĚƌĂǁŶƚŚĞ&ŝď>ŝŶĞƐĨƌŽŵƚŚĞƚŽƉŽŶϬϭͬϬϰͬϮϮĚŽǁŶƚŽƚŚĞďŽƚƚŽŵŽŶ
ϬϵͬϯϬͬϮϮ͘tŝƚŚdƌĂĚĞ^ƚĂƚŝŽŶ;ǁŚŝĐŚ/ƵƐĞƌĞŐƵůĂƌůLJĨŽƌŵLJŽǁŶƚƌĂĚŝŶŐͿƚŚĞƌĞƚƌĂĐĞŵĞŶƚƐĂƌĞ
ĂƵƚŽŵĂƚŝĐĂůůLJĚƌĂǁŶĂƚϮϯ͘ϲй͕ϯϴ͘Ϯй͕ϱϬй͕ϲϭ͘ϴй͕ϳϲ͘ϰйĂŶĚŽĨĐŽƵƌƐĞƚŚĞƚŽƉĂŶĚďŽƚƚŽŵĂƚϬйĂŶĚ
ϭϬϬй͘
dŚĞƐĞůŝŶĞƐĂƌĞƐƵďũĞĐƚŽĨĂŶŽƚŚĞƌĂƌƚŝĐůĞ;ƐĞĞdtηϴϮ͞WƌĂĐƚŝĐĂů&ŝďŽŶĂĐĐŝ͟ͿǁŚĞƌĞ/ŐŝǀĞƚŚĞďĂƐŝĐƐŽĨ
ĐĂůĐƵůĂƚŝŽŶĂŶĚďĂƐŝĐƵƐĞŽĨ&ŝďŽŶĂĐĐŝĐŽŶĐĞƉƚƐ͘ƵƚƐƵĨĨŝĐĞŝƚƚŽƐĂLJƚŚĂƚƚŚĞƐĞŶƵŵďĞƌƐĂŶĚƚŚĞŝƌƌĂƚŝŽƐ
ĂƉƉĞĂƌ͕ŶŽƚŽŶůLJŝŶŶĂƚƵƌĞ͕ďƵƚŝŶƚŚĞĨƵƚƵƌĞƐĂŶĚĞƋƵŝƚLJŵĂƌŬĞƚƐĂƐǁĞůů͘
tŚĞŶ/ǁĂƐϮϬLJĞĂƌƐŽůĚĂŶĚŝŶŐƌĂĚƵĂƚĞƐĐŚŽŽůŝŶŵĂƚŚĞŵĂƚŝĐƐŵLJĨŝƌƐƚƚŚĞƐŝƐĂĚǀŝƐŽƌǁĂŶƚĞĚŵĞƚŽ
ĨŽĐƵƐŽŶ&ŝďŽŶĂĐĐŝŶƵŵďĞƌƐĂŶĚ/ƐĂŝĚŶŽƚŚĂŶŬƐ͕ƚŚĂƚ/ĚŝĚŶ͛ƚƐĞĞĂƉƌĂĐƚŝĐĂůĂƉƉůŝĐĂƚŝŽŶĨŽƌƚŚĞŵ͘dŚĞŶ
ŚĞƐƵŐŐĞƐƚĞĚƚŽŵĞƚŚĂƚƚŚĞLJŚĂĚĂƉƉůŝĐĂƚŝŽŶŝŶƚŚĞƐƚŽĐŬŵĂƌŬĞƚ͘/ŬŶŽǁŝŶŐůLJƐĂŝĚƚŚĂƚ/ǁŽƵůĚŶĞǀĞƌ
ďĞŝŶƚĞƌĞƐƚĞĚŝŶƚŚĞƐƚŽĐŬŵĂƌŬĞƚ͘&ĂŵŽƵƐůĂƐƚǁŽƌĚƐ͘EŽǁ/ƐƉĞŶĚŵLJůŝĨĞƚƌĂĚŝŶŐĂŶĚŝŶǀĞƐƚŝŶŐ͊
EŽƚŝĐĞŝŶ&ŝŐƵƌĞϮŚŽǁƉƌŝĐĞƐŐŽƌŝŐŚƚƚŽƚŚĞ&ŝďůŝŶĞƐĂŶĚƌĞƚƌĞĂƚ͘dŚŝƐĂŐĂŝŶŝƐƚŚĞƉƌĞƉŽŶĚĞƌĂŶĐĞŽĨ
ƉƌŝĐĞƐĂŶĚƚŚƵƐƋƵĂůŝĨŝĞƐĂƐĂŶƚƚƌĂĐƚŽƌ͘EŽƚŝĐĞƚŚĂƚ/ĂŵůŽŽŬŝŶŐĨŽƌĂƌĞĂƐǁŚĞƌĞƉƌŝĐĞĐŽŵĞƐďĂĐŬƚŽ
ŽǀĞƌĂŶĚĂŐĂŝŶ͘^ĞĞďĞůŽǁŚŽǁƉƌŝĐĞĐŽŶƚŝŶƵĞƐƚŽŵŽǀĞĂǁĂLJĨƌŽŵĂŶĚďĂĐŬƚŽƚŚĞƚƚƌĂĐƚŽƌƐ͘
WWW.TRADERSWORLD.COM July, August. September 2023
65
&/'hZ
ϮͶ&ŝďŽŶĂĐĐŝZĞƚƌĂĐĞŵĞŶƚƐĂŶĚƚƚƌĂĐƚŽƌƐ
dƌĞŶĚůŝŶĞƐĂƐƚƚƌĂĐƚŽƌƐ
>Ğƚ͛ƐŶŽǁůŽŽŬĂƚĂŶŽƚŚĞƌƚLJƉĞŽĨƚƚƌĂĐƚŽƌ͕ƚƌĞŶĚůŝŶĞƐ͘
/Ŷ&ŝŐƵƌĞϯŶŽƚŝĐĞƚŚĂƚƚŚĞƚƌĞŶĚůŝŶĞ/͛ǀĞĚƌĂǁŶĂĐƌŽƐƐƚŚƌĞĞůŽĐĂůŚŝŐŚƐŽŶϬϭͬϬϱͬϮϮ͕ϬϰͬϮϭͬϮϮĂŶĚ
ϬϴͬϭϳͬϮϮŐĞŶĞƌĂƚĞĂƚƌĞŶĚůŝŶĞǁŚŝĐŚŝƐĂŐĂŝŶŚŝƚ͕ĂƐƐƵƉƉŽƌƚƚŚŝƐƚŝŵĞ͕ŽŶϭϮͬϭϵͬϮϮĂŶĚϬϯͬϭϲͬϮϯ͊
dŚĂƚ͛ƐǁŚLJ/ĐĂůůƚŚĞŵƚƚƌĂĐƚŽƌƐ͘
All Back issues of Traders World magazine
on 3 DVDs mailed to you first class mail.
Issues 1 - 89.
$49.95
3 DVDs
Free shipping
click to order
WWW.TRADERSWORLD.COM July, August. September 2023
66
&/'hZ
ϯͶdƌĞŶĚůŝŶĞƐĂƐƚƚƌĂĐƚŽƌƐ
DŽǀŝŶŐǀĞƌĂŐĞƐĂƐƚƚƌĂĐƚŽƌƐ
tŚĂƚĂďŽƵƚZĞǀĞƌƐŝŽŶƚŽƚŚĞDĞĂŶĂŶĚDŽǀŝŶŐǀĞƌĂŐĞƐ͍>ŽŽŬŝŶŐĂƚ/ŶǀĞƐƚŽƉĞĚŝĂĂŐĂŝŶ͗
x
DĞĂŶƌĞǀĞƌƐŝŽŶ͕ŽƌƌĞǀĞƌƐŝŽŶƚŽƚŚĞŵĞĂŶ͕ŝƐĂƚŚĞŽƌLJƵƐĞĚŝŶĨŝŶĂŶĐĞƚŚĂƚƐƵŐŐĞƐƚƐ
ƚŚĂƚĂƐƐĞƚƉƌŝĐĞǀŽůĂƚŝůŝƚLJĂŶĚŚŝƐƚŽƌŝĐĂůƌĞƚƵƌŶƐĞǀĞŶƚƵĂůůLJǁŝůůƌĞǀĞƌƚƚŽƚŚĞůŽŶŐͲƌƵŶŵĞĂŶŽƌ
ĂǀĞƌĂŐĞůĞǀĞůŽĨƚŚĞĞŶƚŝƌĞĚĂƚĂƐĞƚ͘
DŽǀŝŶŐǀĞƌĂŐĞƐĂƌĞƐŝŵƉůLJƚŚĞĂĚĚŝƚŝŽŶŽĨEŶƵŵďĞƌŽĨƉƌŝĐĞƐĚŝǀŝĚĞĚďLJEƚŽƉƌŽĚƵĐĞĂƐĞƋƵĞŶĐĞŽĨ
ǀĂůƵĞƐƚŚĂƚĂƉƉƌŽdžŝŵĂƚĞƚŚĞŚŝƐƚŽƌŝĐĂůǀĂůƵĞƐ͘dƌĂĚŝƚŝŽŶĂůƚŚŝŶŬŝŶŐƚĞůůƐƵƐƚŚĂƚĐƌŽƐƐĞƐŽĨƚǁŽŵŽǀŝŶŐ
ĂǀĞƌĂŐĞƐƐƵŐŐĞƐƚŐŽŽĚƚŝŵĞƐƚŽďƵLJŽƌƐĞůů͘dŚĞŽƚŚĞƌǁĂLJŽĨůŽŽŬŝŶŐĂƚŵŽǀŝŶŐĂǀĞƌĂŐĞƐŝƐƚŽƚƌĂĚĞ
ƉƌŝĐĞŵŽǀĞƐĂďŽǀĞŽƌďĞůŽǁƚŚĞĂǀĞƌĂŐĞ͘
&ŝŐƵƌĞϰƐŚŽǁƐƵƐĂ^ŝŵƉůĞDŽǀŝŶŐǀĞƌĂŐĞ;^DͿŽŶƚŚĞƐĂŵĞƉƌŝĐĞĐŚĂƌƚǁĞŚĂǀĞďĞĞŶĞdžĂŵŝŶŝŶŐ͘
EŽƚĞƚŚĂƚĂƐƉƌŝĐĞŵŽǀĞƐĂďŽǀĞƚŚĞ^DĂƚƚŚĞďŽƚƚŽŵŽĨĂŵŽǀĞƚŚĞƌĞŝƐƚLJƉŝĐĂůůLJĂĐŽŶƐĞƋƵĞŶƚŝĂů
ŵŽǀĞƚŽƚŚĞƵƉƐŝĚĞ͖ůŝŬĞǁŝƐĞ͕ĂƐƉƌŝĐĞĂƚƚŚĞƚŽƉŽĨĂŵŽǀĞŵŽǀĞƐďĞůŽǁƚŚĞ^DƉƌŝĐĞƚĞŶĚƐƚŽŵŽǀĞ
ĚŽǁŶ͘
ĞĐĂƵƐĞƉƌŝĐĞƚĞŶĚƐƚŽŵŽǀĞƚŽƚŚĞĂǀĞƌĂŐĞĂŶĚĂǁĂLJĂŐĂŝŶ͕/ĂůƐŽĐĂůůƚŚĞƐĞƚƚƌĂĐƚŽƌƐ͘
WWW.TRADERSWORLD.COM July, August. September 2023
67
ͮ
Ő
&/'hZ
ϰͶ^ŝŵƉůĞDŽǀŝŶŐǀĞƌĂŐĞŝƐůƐŽĂŶƚƚƌĂĐƚŽƌ
^ƵŵŵĂƌLJ
EŽǁƚŚĂƚLJŽƵƵŶĚĞƌƐƚĂŶĚƚŚĞĐŽŶĐĞƉƚŽĨƚƚƌĂĐƚŽƌƐ͕LJŽƵǁŝůůƐĞĞŽƚŚĞƌĨŽƌŵĂƚŝŽŶƐƚŚĂƚƋƵĂůŝĨLJ͘ŶLJ
ĨŽƌŵĂƚŝŽŶƚŽǁŚŝĐŚƉƌŝĐĞƚĞŶĚƐƚŽƌĞƚƵƌŶĐĂŶƌŝŐŚƚůLJĐĂůůĞĚĂŶƚƚƌĂĐƚŽƌ͘
KĨĐŽƵƌƐĞ͕ŵLJ^ƵŶŶLJĂŶĚƐΡŝŶĚŝĐĂƚŽƌĂůƐŽĂĐƚƐĂƐĂŶƚƚƌĂĐƚŽƌ͘WƌŝĐĞƐŵŽǀĞƚŽƚŚĞhƉƉĞƌKƵƚĞƌĂŶĚ
;hKͿĂŶĚďĂĐŬĚŽǁŶƚŽƚŚĞ>ŽǁĞƌKƵƚĞƌĂŶĚ;>KͿ͘
/Ŷ&ŝŐƵƌĞϱLJŽƵĐĂŶƐĞĞƚŚĂƚƉƌŝĐĞƉƌŝŵĂƌŝůLJƌƵŶƐĨƌŽŵƚŚĞƚŽƉďĂŶĚƚŽƚŚĞďŽƚƚŽŵďĂŶĚĂŶĚďĂĐŬĂŐĂŝŶ͘
dŚĞƌĞŝƐĂŶĞdžĐĞƉƚŝŽŶǁŚĞŶƚŚĞD;LJŶĂŵŝĐDŽǀŝŶŐǀĞƌĂŐĞͿŝƐ͞ĨůĂƚ͟ŽƌŵŽǀŝŶŐƉƌŝŵĂƌŝůLJƐŝĚĞǁĂLJƐ
ƚŚĂƚƐĂLJƐƚŚĂƚƉƌŝĐĞŝƐůŝŬĞůLJƚŽƐƚĂŐŶĂƚĞĂƚƚŚĞDĂŶĚĐŚƵƌŶƚĞŵƉŽƌĂƌŝůLJ͘
/ŚĂǀĞƵƐĞĚĚĂŝůLJĐŚĂƌƚƐŽĨƚŚĞŽǁĨŽƌƚŚĞƐĞĞdžĂŵƉůĞƐĨŽƌƐŝŵƉůŝĐŝƚLJĂŶĚĐŽŵƉĂƌŝƐŽŶ͘dŚĞƐĞĐŽŶĐĞƉƚƐ
ǁŽƌŬŽŶĂŶLJƐLJŵďŽů͕ŝŶĂŶLJƚŝŵĞĨƌĂŵĞ͘ƚƚƌĂĐƚŽƌƐǁŽƌŬŝŶƚŚĞŵĂůů͘
/ĨLJŽƵŚĂǀĞĂŶLJƋƵĞƐƚŝŽŶƐŽƌĐŽŵŵĞŶƚƐ͕ƉůĞĂƐĞŐŝǀĞŵĞĂĐĂůůŽƌƐŚŽŽƚŵĞĂŶĞŵĂŝů͘/͛ŵŚĂƉƉLJƚŽĐŚĂƚ
ǁŝƚŚLJŽƵ͘
WWW.TRADERSWORLD.COM July, August. September 2023
68
ͮ
Ő
&/'hZ
ϱͶ^ƵŶŶLJĂŶĚƐĂƐƚƚƌĂĐƚŽƌƐ
ͲͲͲͲͲ
ƌ͘^ƵŶŶLJ:͘,ĂƌƌŝƐŝƐĂĨƵůůͲƚŝŵĞƚƌĂĚĞƌ;ϰϮнLJĞĂƌƐͿ͕ĨŝŶĂŶĐŝĂůĞŶŐŝŶĞĞƌĂŶĚƉƌŽŐƌĂŵŵĞƌ͘^ŚĞŝƐƚŚĞ
ĂƵƚŚŽƌŽĨŵĂŶLJŬƐŽŶƚƌĂĚŝŶŐĂŶĚŵĂƌŬĞƚĂŶĂůLJƐŝƐ͕ŝŶĐůƵĚŝŶŐ͞dƌĂĚŝŶŐϭϬϭͶ,ŽǁƚŽdƌĂĚĞ>ŝŬĞĂ
WƌŽ͕͟͞dƌĂĚŝŶŐϭϬϮͶ'ĞƚƚŝŶŐŽǁŶƚŽƵƐŝŶĞƐƐ͕͟͞
ůĞĐƚƌŽŶŝĐĂLJdƌĂĚŝŶŐϭϬϭ͕͟͞'ĞƚƚŝŶŐ^ƚĂƌƚĞĚŝŶ
dƌĂĚŝŶŐ͕͟͞dƌĂĚĞ^ƚĂƚŝŽŶDĂĚĞ
ĂƐLJ͕͊͟ĂŶĚƚŚĞŶĞǁ͞dŚĞĞĨŝŶŝƚŝǀĞ'ƵŝĚĞƚŽdƌĂĚĞ^ƚĂƚŝŽŶ͛Ɛ
ĂƐLJ>ĂŶŐƵĂŐĞΘKK
>WƌŽŐƌĂŵŵŝŶŐ͘͟&ŽƌƋƵĞƐƚŝŽŶƐŽƌĐŽŵŵĞŶƚƐŐŽƚŽǁǁǁ͘ŵŽŶĞLJŵĞŶƚŽƌ͘ĐŽŵŽƌ
ŐŝǀĞŵĞĂĐĂůůĂƚϭͲϳϲϬͲϵϬϴͲϯϬϳϬ͘
All Back issues of Traders World magazine
on 3 DVDs mailed to you first class mail.
Issues 1 - 89.
$49.95
3 DVDs
Free shipping
click to order
WWW.TRADERSWORLD.COM July, August. September 2023
69
ĚĂƉƚŽƌ&Ăŝů͗ƵŝůĚŝŶŐƚŚĞ
DŝŶĚƐĞƚĨŽƌ^ƵĐĐĞƐƐŝŶdƌĂĚŝŶŐ
LJZĂŶĚĞ,ŽǁĞůů
tŚĂƚ'ŽĞƐtƌŽŶŐtŚĞŶƚŚĞDŽŶĞLJ/ƐZĞĂů͍
^ƵĐĐĞƐƐŝŶĞǀŽůƵƟŽŶĂŶĚƚƌĂĚŝŶŐĂƌĞǀĞƌLJƐŝŵŝůĂƌ͘/ŶĞǀŽůƵƟŽŶĂƌLJƚŚĞŽƌLJ͕ŝƚŝƐŶŽƚƚŚĞďŝŐŐĞƐƚ͕
ƐƚƌŽŶŐĞƐƚ͕ƐŵĂƌƚĞƐƚ͕ĂŶĚͬŽƌƚŽƵŐŚĞƐƚƚŚĂƚĮŶĚƐƵĐĐĞƐƐŝŶŵĞĞƟŶŐƚŚĞĐŚĂůůĞŶŐĞƐŽĨůŝǀŝŶŐ͘
ZĂƚŚĞƌ͕ŝƚŝƐƚŚĞŵŽƐƚĂĚĂƉƟǀĞ;ŽƉĞŶͿƚŽŶĞĐĞƐƐĂƌLJĐŚĂŶŐĞ͘dƌĂĚĞƌƐŶĞĞĚƚŽƚĂŬĞƚŚŝƐĂdžŝŽŵƚŽ
ŚĞĂƌƚ͘tŚLJ͍ĞĐĂƵƐĞŝƚŝƐŚŝŐŚůLJƵŶůŝŬĞůLJƚŚĂƚƚŚĞŵŝŶĚƚŚĂƚLJŽƵďƌŽƵŐŚƚƚŽƚƌĂĚŝŶŐŝƐŐŽŝŶŐƚŽ
ďĞƚŚĞŵŝŶĚƚŚĂƚĐƌĞĂƚĞƐƐƵĐĐĞƐƐŝŶƚƌĂĚŝŶŐ;ƚŚĞƌƵůĞƐĨŽƌƐƵĐĐĞƐƐŝŶƚƌĂĚŝŶŐĂƌĞǀĞƌLJĚŝīĞƌĞŶƚ
ƚŚĂƚĨŽƌĞǀĞƌLJĚĂLJůŝĨĞͿ͘dŽďĞƐƵĐĐĞƐƐĨƵůŝŶƚƌĂĚŝŶŐ͕LJŽƵĂƌĞŐŽŝŶŐƚŽŚĂǀĞƚŽĂĚĂƉƚLJŽƵƌ
ƵŶĚĞƌƐƚĂŶĚŝŶŐŽĨĨĂŝůƵƌĞ͕ǁŝŶŶŝŶŐ͕ĂŶĚůŽƐŝŶŐ͘dŚĞƌƵůĞƐĨŽƌƐƵĐĐĞƐƐĂƌĞǀĞƌLJĚŝīĞƌĞŶƚŝŶƚƌĂĚŝŶŐ
ƚŚĂŶŝŶLJŽƵƌĞǀĞƌLJĚĂLJůŝĨĞ͘
/ŶĞǀŽůƵƟŽŶ͕ǁŚĞŶĂŶĂĚĂƉƟǀĞĐƌĞĂƚƵƌĞ;ůŝŬĞĂƚƌĂĚĞƌͿĨĂŝůƐĂĐŚĂůůĞŶŐŝŶŐĞǀĞŶƚ;ƚĂŬĞƐĂůŽƐƐͿ͕
ƚŚĂƚĨĂŝůƵƌĞŝƐĂĐĂůůƚŽƚŚĞĂĐƟŽŶŽĨĂĚĂƉƚĂƟŽŶʹŶŽƚƐŚĂŵĞ͕ĂŶŐĞƌ͕ŽƌĨĞĂƌ͘dŚĞŽƌŐĂŶŝƐŵ;ƚŚĞ
ƚƌĂĚĞƌͿŝŶƐƟŶĐƚƵĂůůLJďĞŐŝŶƐƚŽŝŶǀĞŶƚĂŶĞǁǁĂLJŽĨĚĞĂůŝŶŐǁŝƚŚƚŚĞĐŚĂůůĞŶŐĞʹŽƌƚŚĞLJƉĞƌŝƐŚ͘
ZĂƚŚĞƌƚŚĂŶďĞĐŽŵŝŶŐŵŽƌĞƌŝŐŝĚŝŶŝƚƐƌĞƐƉŽŶƐĞƚŽĨĂŝůƵƌĞ͕ŝƚĞǀŽůǀĞƐĂŶĞǁǁĂLJŽĨ
ƵŶĚĞƌƐƚĂŶĚŝŶŐƚŚĞƌĞƉĞĂƟŶŐƉƌŽďůĞŵĂƟĐƉĂƩĞƌŶ͕ƐŽŝƚĐĂŶǁŽƌŬǁŝƚŚƚŚĞƐŝƚƵĂƟŽŶĚŝīĞƌĞŶƚůLJʹ
ƚŚĞƌĞďLJŝŶĐƌĞĂƐŝŶŐŝƚƐĐŚĂŶĐĞƐŽĨƐƵƌǀŝǀĂů͘dŚŝƐĞŶŚĂŶĐĞĚƐŬŝůůŽĨĂĚĂƉƚĂƟŽŶďĞĐŽŵĞƐŚŝƐĞĚŐĞ
ŝŶĚĞĂůŝŶŐǁŝƚŚĂĐŽŶƐƚĂŶƚůLJĐŚĂŶŐŝŶŐĞŶǀŝƌŽŶŵĞŶƚǁŚĞƌĞƚŚĞƌĞĂƌĞƉůĞŶƚLJŽĨƌŝƐŬƐƚŽŶĞŐŽƟĂƚĞ͘
zŽƵŚĂǀĞĂďƌĂŝŶďƵŝůƚďLJĞǀŽůƵƟŽŶƚŽǁŝŶ;ƐƵƌǀŝǀĞĂŶŽƚŚĞƌĚĂLJͿďLJĐŽŶƚƌŽůůŝŶŐŽƵƚĐŽŵĞ͘ŶĚ
ŶŽƚƚŽůŽƐĞďĞĐĂƵƐĞƚŚĂƚŵĞĂŶƚLJŽƵǁĞƌĞƐŽŵĞďŽĚLJĞůƐĞ͛ƐůƵŶĐŚ͘/ŶĨĂĐƚ͕ƚŚŝƐŝŶƐƟŶĐƚƵĂů
ĂǀĞƌƐŝŽŶƚŽůŽƐŝŶŐŝƐƐŽƐƚƌŽŶŐƚŚĂƚƚŚĞƚƌĂĚĞƌǁŝůůŵĞƚĂƉŚŽƌŝĐĂůůLJĮŐŚƚĨŽƌŚŝƐͬŚĞƌůŝĨĞǁŚĞŶƚŚĞ
ƚƌĂĚĞŐŽĞƐĂŐĂŝŶƐƚƚŚĞŵ͘dŽƚŚĞĞŵŽƟŽŶĂůďƌĂŝŶ͕LJŽƵĂƌĞďĞŝŶŐĂƩĂĐŬĞĚďLJĂĚĂŶŐĞƌŽƵƐ
ƉƌĞĚĂƚŽƌĂŶĚLJŽƵĚŽŚĂǀĞĮŐŚƚůŝŬĞLJŽƵƌůŝĨĞĚĞƉĞŶĚĞĚŽŶŝƚ͘dŚŝƐŝƐƐƵƌǀŝǀĂůŝŶƐƟŶĐƚ͘/ƚǁĂƐĂŶ
ĂĚĂƉƚĂƟŽŶƚŚĂƚŚĞůƉĞĚŚƵŵĂŶŬŝŶĚǁŝŶƚŚĞƐƚƌƵŐŐůĞĨŽƌƐƵƌǀŝǀĂůĨŽƌƚŚĂƚƟŵĞĂŶĚƉůĂĐĞƐŽůŽŶŐ
ĂŐŽ͘ŶĚŶŽǁƚŚĂƚƐĂŵĞĂĚĂƉƚĂƟŽŶƉƌŽĚƵĐĞƐĨĂŝůƵƌĞŝŶƚŚĞǀĞƌLJƐƚƌĂŶŐĞǁŽƌůĚŽĨƚƌĂĚŝŶŐ͘/ƚŝƐĂ
ǀĞƌLJĚŝīĞƌĞŶƚũƵŶŐůĞ͕ǁŝƚŚĚŝīĞƌĞŶƚƐƵƌǀŝǀĂůƌƵůĞƐ͕ƚŚĂŶƚŚĞǁŽƌůĚǁŚĞƌĞƚŚĞŽƌŝŐŝŶĂůĂĚĂƉƚĂƟŽŶ
ǁĂƐŚĞůƉĨƵů͘
/ŶƚŚŝƐŶĞǁǁŽƌůĚ͕ůŽƐŝŶŐŝƐŶŽůŽŶŐĞƌĂďŽƵƚĂƚŚƌĞĂƚƚŽLJŽƵƌĞdžŝƐƚĞŶĐĞ͕ĂƐŝƚǁĂƐƚŚĞŶ͘>ŽƐŝŶŐ
ŶŽǁŝƐĂďŽƵƚǁŽƌŬŝŶŐŝŶǁŽƌůĚƐŽĨƉƌŽďĂďŝůŝƚLJĂŶĚƵŶĐĞƌƚĂŝŶƚLJƚŚĂƚǁĂƐŝŵƉŽƐƐŝďůĞĨŽƌŽƵƌ
ĐĂǀĞŵĂŶĂŶĐĞƐƚŽƌƐƚŽĐŽŵƉƌĞŚĞŶĚ͘dŽƚŚĞŵ͕ƚŚĞLJŚĂĚƚŽďĞůŝĞǀĞƚŚĂƚƚŚĞLJĐŽƵůĚ͕ŝŶĨĂĐƚ͕
ĐŽŶƚƌŽůŽƵƚĐŽŵĞ͘dŚĂƚĨĂůůĂĐLJďĞĐĂŵĞƐƵĐŚĂŶĞīĞĐƟǀĞǁĂLJ;ƚŚŽƵŐŚĚĞůƵƐŝŽŶĂůͿĨŽƌƚŚĞŝƌ
ƐƵƌǀŝǀĂů͕ŝƚďĞĐĂŵĞůŽĐŬĞĚŝŶƚŽŚƵŵĂŶŐĞŶĞƟĐƐ͘tĞƐƚƌŝǀĞƚŽǁŝŶĂŐĂŝŶƐƚĂůůŽĚĚƐŝŶĂďĞůŝĞĨƚŚĂƚ
ǁĞĂƌĞŐŽŝŶŐƚŽǁŝŶ͘
ǀĞƌLJŶĞǁĐƌŽƉŽĨƚƌĂĚĞƌƐĐŽŵĞƐƚŽƚŚĞĂƌĞŶĂǁŝƚŚĂďĞůŝĞĨƚŚĂƚƚŚĞLJĂƌĞ
ŐŽŝŶŐƚŽǁŝŶďLJĂĐƋƵŝƌŝŶŐŬŶŽǁůĞĚŐĞŽĨƚƌĂĚŝŶŐ͕ƚƌLJŝŶŐŚĂƌĚ͕ĂŶĚŶĞǀĞƌŐŝǀŝŶŐƵƉ͘ŶĚŝŶƚŚĞ
WWW.TRADERSWORLD.COM July, August. September 2023
70
ǁŽƌůĚŽĨŽƵƌĐĂǀĞŵĂŶĂŶĐĞƐƚŽƌƐ͕ƚŚŝƐŝŶƐƟůůĞĚďĞůŝĞĨĐƌĞĂƚĞĚƐƵƌǀŝǀĂůƐƵĐĐĞƐƐ͘dŚĞŶƚƌĂĚĞƌƐďƌŝŶŐ
ƚŚŝƐĂƌƟĨĂĐƚĨƌŽŵĂŶŽƚŚĞƌƟŵĞĂŶĚƉůĂĐĞŝŶƚŽƚƌĂĚŝŶŐ͕ĂŶĚƚŚĞLJĮŶĚƚŚĞǁŽƌůĚŽĨƚƌĂĚŝŶŐŚĂƐ
ǀĞƌLJĚŝīĞƌĞŶƚƌƵůĞƐĨŽƌƐƵĐĐĞƐƐƚŚĂŶĐĂǀĞŵĂŶ͛ƐĂŶĚLJŽƵƌĞǀĞƌLJĚĂLJǁŽƌůĚ͘
zĞƚ͕LJŽƵĂƌĞůŽĐŬĞĚŝŶƚŽĂŵŝŶĚƐĞƚƚŚĂƚŚĂƐLJŽƵďĞůŝĞǀŝŶŐLJŽƵĐĂŶǁŝŶŽŶĂŶŝŶƐƟŶĐƚƵĂůůĞǀĞů͘
DŽƌĞƚŚĂŶƚŚĂƚ͕LJŽƵďƌŝŶŐƚŚĞŶŽƟŽŶƚŚĂƚLJŽƵŚĂƚĞůŽƐŝŶŐƚŽĂŶĞŶĚĞĂǀŽƌƚŚĂƚůŽƐŝŶŐŝƐĂŶĂƚƵƌĂů
ƉĂƌƚŽĨƚŚĞŐĂŵĞ͘zŽƵŬĞĞƉůŽƐŝŶŐŵŽŶĞLJŽƌůĞĂǀŝŶŐŝƚŽŶƚŚĞƚĂďůĞĞǀĞŶƚŚŽƵŐŚLJŽƵĞdžƉĞƌŝĞŶĐĞ
ĨĂŝůƵƌĞ͘/ƚŝƐƚŚŝƐďůŽĐŬĂŐĞƚŚĂƚŝƐƚŚĞƉƌŽďůĞŵ͘&ĂŝůƵƌĞ͕ŝŶĞǀŽůƵƟŽŶ͕ŝƐĂĐĂůůĨŽƌĂĚĂƉƚĂƟŽŶ͘ŶĚ͕
ŝŶƚƌĂĚŝŶŐ͕ǁĞŚĂǀĞƚŽĐŽŵĞĨĂĐĞͲƚŽͲĨĂĐĞǁŝƚŚĂŶĐŝĞŶƚ͕ŝŶƐƟŶĐƚƵĂůĚƌŝǀĞƐĨŽƌƐƵƌǀŝǀĂůƚŚĂƚƌƵŶ
ĐŽƵŶƚĞƌƚŽƚŚĞĞŵŽƟŽŶĂůĂŶĚƉƐLJĐŚŽůŽŐŝĐĂůƐŬŝůůƐŶĞĞĚĞĚĨŽƌƐƵĐĐĞƐƐ͘dŚĞŐŽŽĚŶĞǁƐŝƐƚŚĂƚĂƐ
ŚƵŵĂŶƐ͕ǁĞĐĂŶĂĐƚƵĂůůLJƚĂŬĞĐŽŶƚƌŽůŽĨƚŚĞĂĚĂƉƚĂƟŽŶƉƌŽĐĞƐƐʹŽŶĐĞǁĞƌĞĂůŝnjĞƚŚĂƚǁĞŚĂǀĞ
ƚŽĂĚĂƉƚƚŽƚŚŝƐŶĞǁǁŽƌůĚƚŚĂƚŝƐƐŽǀĞƌLJĚŝīĞƌĞŶƚƚŚĂƚƚŚĞŽŶĞǁĞĂƌĞĐƵƌƌĞŶƚůLJƐƵŝƚĞĚĨŽƌ͘
&ŝƌƐƚYƵĞƐƟŽŶ͗tŚĂƚƌĞƚŚĞZƵůĞƐĨŽƌ^ƵĐĐĞƐƐ,ĞƌĞ͍
ĂƌůLJŚƵŵĂŶƐǁĞƌĞďƵŝůƚƚŽĐŽŶƚƌŽůƚŚĞĞŶǀŝƌŽŶŵĞŶƚ;ĐŽŶƚƌŽůŽƵƚĐŽŵĞͿ͘tŝŶŶŝŶŐǁĂƐ
ĞǀĞƌLJƚŚŝŶŐĨŽƌƐƵƌǀŝǀĂů͘tŝŶŶŝŶŐƉƌŽĚƵĐĞĚĂƐĂĨĞǁŽƌůĚǁŚĞƌĞƚŚĞƉĞƌƐŽŶǁĂƐŝŶĐŚĂƌŐĞ͘dŚŝƐ
ƐƵƌǀŝǀĂůƐƚƌĂƚĞŐLJƉƌŽǀĞĚƐŽƐƵĐĐĞƐƐĨƵůƚŚĂƚŝƚǁĂƐŝŶĐŽƌƉŽƌĂƚĞĚŝŶƚŽƚŚĞŚƵŵĂŶŐĞŶŽŵĞĂŶĚ
ƚƌĂŶƐĨĞƌƌĞĚŝŶƚŽĨƵƚƵƌĞŐĞŶĞƌĂƟŽŶƐĨŽƌƉƌŽƐƉĞƌŝƚLJ͘dŚĞƚƌĂŶƐĨĞƌŽĨƚŚŝƐĞŵďŽĚŝĞĚŝŶƐƟŶĐƚ
ĐŽŶƟŶƵĞĚƵŶƟůŽŶĞĚĂLJ͕ĂǀĞƌLJƐƵĐĐĞƐƐĨƵůƉĞƌƐŽŶŝŶƚŚĞŽƌĚŝŶĂƌLJǁŽƌůĚĚĞĐŝĚĞƐƚŽƐƚĂƌƚƚƌĂĚŝŶŐ͘
ŶĚƐƵĚĚĞŶůLJƚŚĞƚƌĂĚĞƌĚŝƐĐŽǀĞƌƐƚŚĂƚĂŵŝŶĚƐĞƚŽĨǁŝŶŶŝŶŐ;ƐŽƵƐĞĨƵůŝŶƚŚĞŽƌĚŝŶĂƌLJǁŽƌůĚͿŝƐ
ĚĂŶŐĞƌŽƵƐŝŶƚŚĞƚƌĂĚŝŶŐǁŽƌůĚ͘KƵƚĐŽŵĞĐĂŶŶŽƚďĞĐŽŶƚƌŽůůĞĚŶŽŵĂƩĞƌŚŽǁŵƵĐŚǁŝůůĂŶĚ
ŬŶŽǁůĞĚŐĞLJŽƵŚĂǀĞ͘dŚĞƚƌĂĚŝŶŐǁŽƌůĚŝƐďƵŝůƚƵƉŽŶƵŶĐĞƌƚĂŝŶƚLJĂŶĚƉƌŽďĂďŝůŝƚLJ͘tŝŶŶŝŶŐ;ŝŶ
ƚŚĞƚƌĂĚŝƟŽŶĂůƐĞŶƐĞͿŝƐƉƌŽĚƵĐĞĚďLJĨŽƌĐĞŽĨǁŝůůŽƌƉŽǁĞƌ͘tŝŶŶŝŶŐŝŶƚƌĂĚŝŶŐŝƐƉƌŽĚƵĐĞĚďLJ
ďƌŝŶŐŝŶŐĂĚŝƐĐŝƉůŝŶĞĚĂŶĚƉĂƟĞŶƚŵŝŶĚƐĞƚƚŽǁŽƌŬƚŚĞƉƌŽďĂďŝůŝƚLJǁŽƌůĚŽĨƚƌĂĚŝŶŐ͘dŚŝƐŝƐƚŚĞ
ĂŶƟƚŚĞƐŝƐŽĨǁŝŶŶŝŶŐďLJĐŽŶƚƌŽůůŝŶŐŽƵƚĐŽŵĞǁŝƚŚǁŚŝĐŚŚƵŵĂŶƐĐŽŵĞĞƋƵŝƉƉĞĚ͘
dŚĞƐĞĐŽŶĚƌƵůĞŝƐĂďŽƵƚůŽƐŝŶŐ͘KƵƌĞĂƌůLJŚƵŵĂŶĂŶĐĞƐƚŽƌƐůĞĂƌŶĞĚƚŽŚĂƚĞůŽƐŝŶŐ͘>ŽƐŝŶŐ
ŵĞĂŶƚĚĞĂƚŚ͘/ƚŵĞĂŶƚƚŚĂƚLJŽƵďĞĐĂŵĞƐŽŵĞďŽĚLJĞůƐĞ͛ƐŵĞĂů͘ůůƚŚĞůŝŽŶƐ͕ƟŐĞƌƐ͕ĂŶĚďĞĂƌƐ
ĂƌĞŐŽŶĞŶŽǁ;ĂůŵŽƐƚͿ͕ďƵƚƚŚĞŝŶƐƟŶĐƚŽĨĮŐŚƟŶŐůŽƐŝŶŐƚŽƚŚĞĚĞĂƚŚŝƐƌŽŽƚĞĚŝŶƵƐĂƐĂ
ƐƵƌǀŝǀĂůƐƚƌĂƚĞŐLJ͘zĞƚ͕ŝŶƚŚĞƉƌŽďĂďŝůŝƚLJͲďĂƐĞĚǁŽƌůĚŽĨƚƌĂĚŝŶŐ͕ůŽƐŝŶŐŝƐĂŶŽƌŵĂůƉĂƌƚŽĨƚŚĞ
ŐĂŵĞ͘ŶĚ͕ƚŽďĞĐŽŵĞĂƐƵĐĐĞƐƐĨƵůƚƌĂĚĞƌ͕LJŽƵŵƵƐƚĂůƐŽďĞĐŽŵĞĂǀĞƌLJŐŽŽĚůŽƐĞƌ͘zŽƵŵƵƐƚ
ŬŶŽǁǁŚĞŶƚŽĐƵƚLJŽƵƌůŽƐƐĞƐ͘tŚĞŶLJŽƵƐĞĞĂƚƌĂĚĞŐŽĂŐĂŝŶƐƚLJŽƵĂŶĚLJŽƵŐŽŽŶƟůƚ͕ƚŚŝƐŝƐ
ǁŚĂƚŝƐŚĂƉƉĞŶŝŶŐ͘tŚĞŶLJŽƵĂƌĞƚƌLJŝŶŐƚŽƌŝƐŬĐĂƉŝƚĂůŽŶĂǀĂůŝĚƐĞƚͲƵƉ͕ďƵƚŬĞĞƉǁĂŶƟŶŐŵŽƌĞ
ĐŽŶĮƌŵĂƟŽŶ͕LJŽƵĂƌĞĞdžƉĞƌŝĞŶĐŝŶŐLJŽƵƌ/ŶŶĞƌĂǀĞŵĞŶĨĞĂƌŝŶŐĨŽƌŚŝƐůŝĨĞŝĨLJŽƵĞŶƚĞƌƚŚĂƚ
ƚƌĂĚĞ͘
^Ž͕,ŽǁŽzŽƵĚĂƉƚ͍
&ŝƌƐƚ͕ĂĐŬŶŽǁůĞĚŐĞƚŚĂƚĨŽƌĐĞŽĨǁŝůůŽƌĚĞŶŝĂůŝƐŶŽƚŐŽŝŶŐƚŽŵĂŐŝĐĂůůLJĞƌĂƐĞǁŚĂƚĞǀŽůƵƟŽŶĂƌLJ
ŐĞŶĞƟĐƐŚĂƐďƵŝůƚŝŶƚŽLJŽƵ͘dŚĞŵŽƌĞLJŽƵƚƌLJƚŽĨŽƌĐĞLJŽƵƌǁŝůůĂŐĂŝŶƐƚLJŽƵƌƐƵƌǀŝǀĂůŝŶƐƟŶĐƚƐďLJ
ďƌƵƚĞĨŽƌĐĞ͕LJŽƵĂƌĞŽŶůLJƚŽĚŝŐƚŚĞƉƌŽďůĞŵĚĞĞƉĞƌ͘zŽƵĂůƌĞĂĚLJŚĂǀĞĂƐŝŐŶŝĮĐĂŶƚƉƌŽďůĞŵƚŽ
ĚĞĂůǁŝƚŚʹLJŽƵĚŽŶ͛ƚŶĞĞĚƚŽŵĂŬĞŝƚǁŽƌƐĞ͘dŚĞƐĞĐŽŶĚƚŚŝŶŐƚŽĚŽŝƐƚŽůĞĂƌŶŚŽǁƚŽĐĂůŵ
WWW.TRADERSWORLD.COM July, August. September 2023
71
ĚŽǁŶƚŚĞƌĞĂĐƟǀĞĞŵŽƟŽŶĂůƉĂƩĞƌŶƚŚĂƚŬĞĞƉƐŚŝũĂĐŬŝŶŐLJŽƵǁŚĞŶLJŽƵĂƌĞƵŶĚĞƌƉƌĞƐƐƵƌĞ͘/
ƚĞĂĐŚĂĨŽƌŵŽĨďƌĞĂƚŚŝŶŐƚŚĂƚŚĂƐďĞĞŶĂƌŽƵŶĚĨŽƌĂďŽƵƚϰϱϬϬLJĞĂƌƐ͘ĞĐĂƵƐĞďŽƚŚďƌĞĂƚŚŝŶŐ
ĂŶĚŵƵƐĐůĞƚĞŶƐŝŽŶĂƌĞĞůĞŵĞŶƚƐŽĨƌĞĂĐƟǀĞĞŵŽƟŽŶĂůƐƵƌǀŝǀĂůƉĂƩĞƌŶƐ͕LJŽƵƌůĞĂƌŶŝŶŐŚŽǁƚŽ
ďƌĞĂƚŚĞĚŝĂƉŚƌĂŐŵĂƟĐĂůůLJĂŶĚĐŽŶƐĐŝŽƵƐůLJƌĞĚƵĐĞŵƵƐĐůĞƚĞŶƐŝŽŶǁŝůůĐĂůŵƚŚĞĞŵŽƟŽŶĚŽǁŶ
ƐŽƚŚĂƚŝƚŶĞǀĞƌŐĞƚƐƚŽƚŚĞƚŚƌĞƐŚŽůĚŽĨŚŝũĂĐŬŝŶŐLJŽƵ͘dŚĂƚ͛ƐĂƐƚĂƌƚ͘
dŚŝƌĚ͕ĐŽŵĞƐƚŚĞŚĞĂǀLJůŝŌŝŶŐ͘tŚĞŶLJŽƵĂƌĞůŽŽŬŝŶŐĂƚLJŽƵƌWͬ>ƐƚĂƚĞŵĞŶƚ͕LJŽƵĂƌĞƐĞĞŝŶŐƚŚĞ
ŝŵƉĂĐƚƚŚĂƚLJŽƵƌĚĞĞƉĞŵŽƟŽŶĂůďĞůŝĞĨƐƚŚĂƚĚƌŝǀĞLJŽƵƌƉĞƌĨŽƌŵĂŶĐĞƐ͘dŚĞƐĞĂƌĞŶŽƚƚŚĞ
ďĞůŝĞĨƐLJŽƵƐĂLJLJŽƵŚĂǀĞ͘dŚĞƐĞĂƌĞƚŚĞďĞůŝĞĨƐƚŚĂƚĂƌĞƌĞǀĞĂůĞĚŝŶLJŽƵƌƉĞƌĨŽƌŵĂŶĐĞƐƵŶĚĞƌ
ƉƌĞƐƐƵƌĞ͘dŚŝƐŝƐǁŚĞƌĞĂĚĂƉƚĂƟŽŶŶĞĞĚƐƚŽŚĂƉƉĞŶ͘ƐůŽŶŐĂƐLJŽƵƌƐĞŶƐĞŽĨŵĂƩĞƌŝŶŐ͕LJŽƵƌ
ǁŽƌƚŚ͕LJŽƵƌĂĚĞƋƵĂĐLJ͕ĂŶĚLJŽƵƌůŽǀĂďůĞŶĞƐƐĂƌĞďĂƐĞĚŽŶǁŝŶŶŝŶŐĂŶĚůŽƐŝŶŐ͕ƚŚĞŶLJŽƵǁŝůůŚĂǀĞ
ƉƌŽďůĞŵƐƚƌĂĚŝŶŐďĞĐĂƵƐĞLJŽƵƌǀĂůƵĞĂƐĂŚƵŵĂŶďĞŝŶŐŝƐƟĞĚƚŽƐŽŵĞƚŚŝŶŐLJŽƵĐĂŶŶŽƚĐŽŶƚƌŽů
ŝŶƚƌĂĚŝŶŐʹǁŝŶŶŝŶŐĂŶĚůŽƐŝŶŐ͘ƐĂŚƵŵĂŶďĞŝŶŐLJŽƵĐĂŶĐŚĂŶŐĞƚŚŝƐ͘zŽƵƌŝŶŚĞƌĞŶƚǁŽƌƚŚ
ĂŶĚLJŽƵƌƉĞƌĨŽƌŵĂŶĐĞƐĂƌĞĐŽŵƉůĞƚĞůLJƐĞƉĂƌĂƚĞ͘
/ŶƚŚĞƵƉĐŽŵŝŶŐ'ƌŽƵƉŽƵƌƐĞ͕LJŽƵǁŝůůůĞĂƌŶƚŚĞǀĞƌLJƐŬŝůůƐŶĞĞĚĞĚƚŽĂĚĂƉƚLJŽƵƌŽůĚďƌĂŝŶLJŽƵ
ŝŶŚĞƌŝƚĞĚĨƌŽŵŚŝƐƚŽƌLJĂŶĚĨƌŽŵLJŽƵƌĨĂŵŝůLJŽĨŽƌŝŐŝŶƚŽƚŚĞƉƌŽďĂďŝůŝƚLJͲďĂƐĞĚŵŝŶĚŶĞĞĚĞĚĨŽƌ
ƐƵĐĐĞƐƐŝŶƚƌĂĚŝŶŐ͘DŽƐƚƚƌĂĚĞƌƐŚĂǀĞƚŽƚĂŬĞƐŽŵĞǀĞƌLJŚĂƌĚŚŝƚƐĨŽƌƚŚĞŵƚŽƌĞĂůŝnjĞƚŚĂƚƚŚĞLJ
ŚĂǀĞƚŽďƵŝůĚĂƉĞƌĨŽƌŵĂŶĐĞŵŝŶĚĨŽƌƚŚĞƌŝŐŽƌƐŽĨƚƌĂĚŝŶŐ͘/ƚƐŝŵƉůLJŝƐŶŽƚƚŚĞďƌĂŝŶͬŵŝŶĚƚŚĂƚ
LJŽƵďƌŽƵŐŚƚƚŽƚŚĞŐĂŵĞ͘ĂůůƚŚŝƐƚŚĞdŽŽůƐŽĨĚĂƉƚĂƟŽŶ͘dŚĞƉŽƚĞŶƟĂůŝƐƚŚĞƌĞ͘ŶĚŝƚŝƐ
ƟŵĞƚŽƉŝĐŬƵƉƚŚĞƚŽŽůƐŽĨĂĚĂƉƚĂƟŽŶĂŶĚĐƌĞĂƚĞƚŚĞŵŝŶĚďƵŝůƚĨŽƌƚŚĞƵŶĐĞƌƚĂŝŶƚLJŽĨ
ƉƌŽďĂďŝůŝƚLJŝŶƚƌĂĚŝŶŐ͘dŚŝƐŝƐǁŚLJƚŚĞďƌĂŝŶLJŽƵďƌŽƵŐŚƚƚŽƚƌĂĚŝŶŐŝƐŶŽƚŐŽŝŶŐƚŽƉƌŽĚƵĐĞĂ
ƐƵĐĐĞƐƐĨƵůƚƌĂĚŝŶŐŵŝŶĚ͘
All Back issues of Traders World magazine
on 3 DVDs mailed to you first class mail.
Issues 1 - 89.
$49.95
3 DVDs
Free shipping
click to order
WWW.TRADERSWORLD.COM July, August. September 2023
72
&ŝďŽŶĂĐĐŝ^ĞĐƌĞƚƐ
An Exploration into the Roots and Results of the Fibonacci Growth Sequence.
By Robbins World Cup Champion Trader Rob Mitchell
In the beginning was the Word.
And the word was with(in) God,
And the word was God.
John 1:1
The Fibonacci series was said to be created or invented by Leonardo of Pisa, though he has otherwise been called
Leonardo Fibonacci. He was attempting to find a formula associated with the growth of breeding rabbit
populations. Thus, the series was intended to be a growth sequence. In trading, most initially come in contact with
this concept when it is expressed as price retracements. Retracements, of course are not growth sequences. In this
article, I hope to cover a good number of things about this numeric sequence that might be new and interesting;
any of which could be applied to trading. If you are not familiar with Fibonacci retracements or extensions, take a
look at your trading package or search it on the internet; it is something you will likely want to be familiar with as a
trader.
First and foremost, the Fibonacci sequence, as it goes, will successively approximate and approach the Golden
Mean, also known as Phi. This is known as an ͚irrational transcendent͛ number as it continues forever without any
particular repeating to the right of the decimal place. That is approximately 1.61803398874989484820... If you
ĚŝǀŝĚĞƚŚŝƐŶƵŵďĞƌŝŶƚŽϭ͕LJŽƵ͛ůůŐĞƚƚŚĞƐĂŵĞŶƵŵďĞƌƐƵďƚƌĂĐƚĞĚĨƌŽŵϭ͕ŽƌϬ͘61803398874989484820... So it
mirrors itself in this way and is best retained in ratio form to keep its full integrity because the ratio shows, or is
the result of its relation to other manifest things. Put another way, understanding it with respect to tangible things
takes it from being just a number or quantity to having qualities. This article is about such qualities.
The Fib series is made by starting with 0 and 1 and adding the prior number so you get 0+1=1, +1 =2, +1=3, +2=5,
+3=8 etc. This gives you the numeric series, 1, 2, 3, 5, 8, 13 etc. If you take the ratios of these numbers and begin
with 1 & 2, so your first ratio is equal to 0.5. Then next is 2/3 or 0.6667, then 3/5 or 0.6, then 5/8 or 0.625. Now
take note of how this series of ratios progresses by alternating above and below 0.61803398874989484820. The
first one, 0.5 is less, then the second on is 0.6667 which is more, and so they alternate above and below as they get
closer and closer to Phi making a convergent sequence. This graphically forms a declining zig-zag pattern about
Phi. So, during the early parts of the sequence, there are retracements that then become progressively smaller
with each alternation. You can also do this the other way by dividing the other way. This would give you 2 instead
of 0.5, then 1.5 and then 1.6667 etc. converging on Phi. By the time you go out about 39 iterations in a
spreadsheet, you will no longer get closer. The numbers will go to parity. This will occur at about 14 digits of
resolution.
WWW.TRADERSWORLD.COM July, August. September 2023
73
The Fibonacci sequence is one way to get to Phi. There are many others. For example, take two equal squares and
put them together and make a rectangle. Then draw a line from corner to corner the long way through the
rectangle. This line will result in a ratio to the side of the square that is the Square Root of 5 (remember this 5 as it
will come up again in association with Phi). If you take the second square away, you will bisect one side of the first
square. This will give you the graphic below (from https://www.mathsisfun.com/):
If you then sweep the diagonal line and extend it oƵƚŽĨƚŚĞƐƋƵĂƌĞ͕LJŽƵ͛ůůŐĞƚƚǁŽƐĞŐŵĞŶƚƐĂůŽŶŐƚŚĞďŽƚƚŽŵ͘dŚĞ
sum of these will make Phi (The golden Ratio) which is ½ + sqrt5/2, or 0.5+1.118033988. Note, I began the article
with the idea of ratios. This is why maintaining the ratios is important as only through the ratios can you maintain
the full integrity / quality of the number.
In the beginning of the article we referenced the first saying in the book of John. It is my opinion, this prelude
could also be looked at as an assertion of the Golden Ratio in its three parts (a function of Logos or The Word) as:
1) the entire Golden Mean as a unity or One, 2) One itself which is itself a sacred number representing the whole /
completion and the inverse itself (i.e. 0.61803398874989484820); The Three make one (whole), like the trinity.
Then the whole world is vibrated into existence by The Word through Gematria. Additionally, many scholars have
written about the associations between the writings of John and those of Plato. The Golden Ratio or Phi, is also
ĂƐƐŽĐŝĂƚĞĚǁŝƚŚWůĂƚŽ͛Ɛ͚WůĂƚŽŶŝĐ^ŽůŝĚƐ͛͘tŚŝĐŚĂƌĞĂn interesting area of learning on their own.
WWW.TRADERSWORLD.COM July, August. September 2023
74
In this modern age we are just now beginning to grasp the significance of each thing in the physical world having a
vibratory footprint. Some say thŝŶŐƐůŝŬĞ͕͞
ǀĞƌLJƚŚŝŶŐŝƐĞŶĞƌŐLJ͘͟&ƵƌƚŚĞƌƚŚŽƵŐŚ͕ĞǀĞƌLJƚŚŝŶŐŚĂƐĂƵŶŝƋƵĞƉĂƚƚĞƌŶ
of energy that is unique like a thumbprint or pattern. For traders, many shapes or patterns repeat themselves on
charts over and over in ways that are not random. To know more on this general area of knowledge, look up
Chladni patterns or plates, Lissajous curves or research a bit on Cymatics. I write this article for traders as my
decades of market research was indeed made successful due to just such unique repeating patterns in the market
that are fulfilled, again and again.
Another really cool way to get to the Golden Mean is through the five pointed star, pentagram and or Pentagon.
Note the 5 in the above equations. The pentagon is the way of getting at this magical number by the 5 itself and
the diagonals to the pentagon that make triangles inside it are in a ratio of 1:Phi to the pentagonal sides. If you
draw all the diagonals, you will get a five pointed star. We may also take from this that this growth related sacred
number, that 5 is also related to growth; something I use in trading all the time. Another cool thing about the
pentagram is that the retrograde cycle of Venus forms a pentagram exactly every 8 years, 5 points are made in 8,
which are both Fibonacci numbers. These kinds of things are why I write about this amazing number (Phi) and how
you derive it, as all kinds of things in nature follow this magical pattern. I think this is why traders have ultimately
adopted it. Take a look at this YouTube video showing the Venus retro cycle. It is really quite beautiful!
https://www.youtube.com/watch?v=qWwOrUjFOFY
The Math is Fun link above also shows some other really cool ways to get to Phi like, the Sin of 54 degrees *2,
which is also another sacred number that comes up in many areas sacred geometry relationships. For an example,
see below.
Other cool planetary ratios related to Fibonacci are: Mercury to Venus 5:2, Jupiter to Saturn. 5:2, Neptune to
Pluto 3:2, Uranus to Neptune 2:1 and others.
Fibonacci has to do with growth and as such it is related to life and as such it is related to heat and as such it is
related to time itself. /ĨLJŽƵĞdžƉůŽƌĞƚŚĞĞƋƵĂƚŝŽŶƐŽĨƚŚĞƌŵŽĚLJŶĂŵŝĐƐ͕LJŽƵ͛ůůĨŝŶĚĂůůheat is related to time ʹ See
Carlo Rovelli, The Order of Time. As such, I will go a step further and submit that Fibonacci has a memory of itself.
I would further submit that markets also have such memory and this is why patterns repeat over and over again in
all kinds of scales and dimensions ǁŝƚŚǀĞƌLJŚŝŐŚƉƌŽďĂďŝůŝƚŝĞƐĂƐǁĞĚŽǁŝƚŚDĂƌŬĞƚDĂƉƉŝŶŐ;ƐĞĞƉĂƐƚdƌĂĚĞƌ͛Ɛ
World articles or the trading room).
>Ğƚ͛ƐƚĂŬĞĂůŽŽŬĂƚĂŶĞdžĂŵƉůĞŽĨƚŚĞ&ŝďŽŶĂĐĐŝƐĞƌŝĞƐŚĂǀŝŶŐĂŵĞŵŽƌLJŽĨŝƚƐ self that is related to the numbers 7,
10 & 11. As a side note, the number 7 is associated with the middle. For example, 1*2*3*4*5*6*7=5040 (note
this is related to the 54 we mentioned a minute ago). Then 7*8*9=504. So the number 7 is harmonically related in
this relationship by the ratio of 10:1. To get the Fibonacci memory I am referring to, take any 10 Fibonacci
th
numbers in sequence and sum them. Then grab the 7 largest one of the 10 and multiply it by 11 and you will get
the sum of the 10. In this way, the Fibonacci series knows its own whole (sum) in any dimension forward or
th
backwards by 11 times the 7 element. Example:
th
5 + 8 + 13 + 21 + 34 + 55 + 89 + 144 + 233 + 377 = 979 = 11 * 89 (the 7 element is highlighted in yellow).
>Ğƚ͛ƐĚŽĂŶŽƚŚĞƌũƵƐƚƚŽĐŚĞĐŬ͗
55 + 89 + 144 + 233 + 377 + 610 + 987 + 1597 + 2584 + 4181 = 10,857 = 11 * 987
I would encourage you to explore (all) these concepts further.
WWW.TRADERSWORLD.COM July, August. September 2023
75
Another really cool way of deriving the Fibonacci series is ǀŝĂWĂƐĐĂů͛ƐƚƌŝĂŶŐůĞ;ůŝŶŬďĞůŽǁ͙ƐƵƉĞƌĐŽŽů). The
diagonals of it make the Fib sequence. Note also how this is related to the exponents for the number 11 that we
have already covered: https://www.mathsisfun.com/pascals-triangle.html
A key part of our exploration in this article is the prevalence of the Golden Mean or Phi, but also that it is related to
many other things or shapes in our physical world, namely the Platonic solids mentioned briefly above. If we were
to sum up all these concepts, some take aways would be: Fibonacci numbers are related to shapes in the physical
world and particularly so to life or things that can replicate themselves. It has a memory of itself in multiple
dimensions. It is or leads to a sacred number that also relates to other sacred numbers. It is related to heat, growth
and time.
A cool example from the physical world is Chlorophyll. The chlorophyll molecule has a certain shape based on a
bunch of 5s that surround a core of six sided shapes. When you look at chlorophyll, like when you are looking at
leaves on a tree on a summer day, you see the colors green. The shape that makes the colors is invisible as it is too
small to be seen without a microscope, but it appears as green. So this shape vibrates green. Or absorbs other
colors, leaving green. The unseen part makes the seen part happen (color), and it is a machine that enables plants
to absorb energy from light in time.
How might we take these ideas to make it more useful in our trading than just Fibonacci retracements or
extensions? We might like to consider that the extensions are an example of the Word we discussed earlier. It is
creation and/or replication of patterns that repeat in various permutations in time. It may be better related to
sequences in time that are expansive or accelerated than ones that are contractive (so not just price, but time as
well). Another area of benefit is looking at memory or self awareness we discussed in the Fibonacci patterning
that could be predictive. Another is observing raw numbers coming up that are (or that can be) related to these
numbers that I call juicy numbers; numbers that the market cannot resist tagging during a session.
Another amazing tendency I have seen is for the market to set its retracemenƚƐƐƵĐŚƚŚĂƚŝƚŵĂŬĞƐĞdžƚĞŶƐŝŽŶƐ͚Ĩŝƚ͛
looking back. When this happens you are actually looking at the charts in a different way than you might ordinarily
expect or think, and that is to take a forward point in time or space on your charts and retroject them backwards
to a point or level before they happen. In other words, you are looking at a future event that is being determined
by a yet further out future event, similar to the way we could project the sum of the 10 Fibonacci consecutive
th
th
elements (future) from the 7 element (present) by the 11 (future) factor. I know this sounds strange but once
you see it, you cannot un-see it. This happens in our trading room often and is an area of fascination to me in
trading that we see play out. Put another way, once you experience seeing the market from the future backwards,
it has significant impact on how you think about many of the things we have discussed in this article as well as
other patterns.
Based on some of these concepts, you may find some of the ideas we covered may map on to your charts in time
and price in really cool ways both on a relative basis, an absolute basis as well as forward and backwards in time.
This topic is pretty vast, so even minimal or basic coverage is difficult to do in such a short space and time as this
article.
If you like the kind of thinking behind this article, consider becoming part of my trading room where we explore
everything in trading from the most basic concepts to the highly advanced daily, live in real time. Additionally, if
you like the concepts we explored in this article consider expanding your trading consciousness more by using all
the resources below.
WWW.TRADERSWORLD.COM July, August. September 2023
76
An Investing Strategy Silently
Making Motivated People
Wealthy
LJŚƌŝƐsĞƌŵĞƵůĞŶ
Let me start with a short story of my experience and why I can't give you the uncompromised
retirement you dream of, I can't protect your wealth, and I can't protect your lifestyle unless you
genuinely want a better life for yourself.
Many years ago, I purchased a course on how to become an online millionaire. It cost me
thousands of dollars, and I rounded up all my friends. I told them about it, and they all joined me,
and we took the course together as I wanted to be rich with all my best buddies.
The sobering thing was near the end of the course. This guy had a section talking about energy
suckers. This coach went on to describe the average person and their lack of drive/grit to want to
become successful, live a full life of fun, and give back to the world and help others. He
continued talking about how millions of people buy courses like this every month, watch them,
and never complete the step-by-step processes to become successful. That is exactly what I
experienced with almost everyone. Out of 9 people who joined me in taking the course, only one
other person took action and turned their idea and passion into a monthly income, and the rest of
them faded away into the sunset…
My point here is that I spent a lot of time and effort trying to keep everyone motivated to live a
better life, and it was exhausting and sucked the life out of me. I quickly experienced what the
coach was talking about when he told us to stop helping energy suckers and focus on helping
ourselves and those who can carry their weight and don't need to be motivated to be successful.
So, shifting gears back to investing…
Over the last few years, I have shifted away from trying to satisfy short-term aggressive traders
demanding big returns, lots of trades, and who crave the adrenaline rush of being in fast-moving
stocks, to individuals who appreciate consistent above-average growth without the rollercoaster
ride and value strategies that require little to no time or experience to use and protects their
capital from big losses.
Aha, Moments!
Have you ever had one of those lightning bolt moments in your life? The one where a particular
word, phrase, experience, or event changes the foundation of your very being going forward?
Something where your current understanding of how something works is cracked open, and new
information and possibilities pour in?
WWW.TRADERSWORLD.COM July, August. September 2023
77
I had one of these not too long ago. It had to do with the style of investing that I believe in and
practice daily. You've likely all heard of the financial industry's traditional Buy-And-Hold,
Diversification, 60/40 Portfolio, and Dividend-Based strategies, yes?
Although aspects of each of these can sometimes be beneficial, the strategies, in their entirety,
never made sense to me.
Why hold onto an asset that is tanking in value, taking all your recent gains with it?
x
x
x
x
Because it'll eventually climb back up to previous highs? Sure, that's possible...if you
have enough time to wait for that ambiguous 'someday' to arrive.
Because holding a little of a whole lot of assets will ultimately create a balanced
portfolio? Okay, that could work if the deadweight assets were trimmed off.
Because holding more bonds than stocks as you get older decreases portfolio volatility
and limits losses? Ummm, not when the bottom drops out of the bond markets when
interest rates rise.
Because dividends ensure you are always paid something for your investments? I can't
argue that. But if your assets drop more in value than you get paid in dividends, your
account balance is still decreasing, which defeats the point.
Some say that most of these pitfalls can be avoided by having a good financial professional
manage your account. I say this is absolutely true...if you have found someone who is fiducially
bound to their clients, they are a technical analyst, they actively manage positions and risk, and
they don't believe in the buy-and-hold strategy because of its dangers. Suppose your financial
professional does not have these skills and beliefs. In that case, there is a high likelihood that
your account is suffering from AUM, aka paying a high-cost fee to have your Assets UNDER
Managed.
Though we would like to believe otherwise, many financial professionals become extremely
successful by doing the least amount of work possible. If you think about it, should rebalancing a
portfolio each year really cost 1-2% of your life saving? To put some numbers into this example,
say you have $1,000,000 in your portfolio, and it is rebalanced twice a year with the AUM
(traditionally - Assets Under Management) fees at 2%. That is a cost of $20,000. Your account
must earn at least that much in a year just to break even, never mind actually increase in value.
Lightning Bolt #1 – Buy & Hold Investing Is Dangerous
Back to my lightning bolt moment - one of the earliest lessons I had after I began trading and
investing was that just because I loved an asset does not mean it loved me back. It did not care
that I spent hours researching and learning all I could. It did not care that I was 100% convinced
that its next move was up and to the right. It did not care that I had poured my entire account
balance into supporting my belief. When that asset tanked, it took me down with it...hard. And it
was the best thing that happened to me - though I certainly didn't think so then.
Fortunately, I learned this lesson fairly early in my career. I opted to leave the investment alone
because there was not much left to lose. Instead of turning a 'paper loss' into a 'realized loss,' I
WWW.TRADERSWORLD.COM July, August. September 2023
78
decided to let it be and, in the process of doing so, learned another valuable lesson. I had youth
on my side. I had time for the investment to hit rock bottom, stabilize, and then begin its decadelong climb back to previous highs. By the time it did, I was a much savvier investor and had
moved far away from the buy-and-hold strategy to build wealth faster and sustain my wealth and
lifestyle.
So lightning bolt number one – was to be sure I don't hold onto assets falling in value and delay
growth and my retirement for no reason other than laziness and/or lack of education from
whoever is managing our money. There are many false beliefs in the financial industry in what
we are told by so-called professionals, and this article about missing the biggest stock market
rally days is an eye-opener.
Lightning Bolt #2 – Market Trends and Cycles
For decades now, I have not believed in owning assets that were decreasing in value. Now, when
I say this, I don't mean the small intraday movements of stocks, bonds, or commodities. Instead,
I am referring to larger multi-month price trends. When an asset has enjoyed a nice run-up and
has begun to reverse its trend, I do not believe in holding those positions and watching my
wealth fall with them. Why on earth would I do that? I would rather swallow my pride and sell
the asset, even at a small loss, than take a big loss that is life-changing just because we, as
investors, have been falsely told that the buy-and-hold strategy is the best long-term strategy
which is not true. By doing this, I have protected my capital so that I can reinvest it another day like when the market bottoms and starts a new rally. Then, I can buy back into the asset with the
money that, had I stayed in, would have been lost. You can download my market trend and
cycle infographic here.
The struggle I was having was relaying this information to people in a clean and concise way.
What I mean by that is, when you hear the term Buy-And-Hold, you know exactly what that
means without being told. And the same thing goes with Dividends or Diversification strategies,
and we know what they are. In another article, I go into more detail about just how poor of an
investing strategy diversification is for anyone 45+ years of age in this article.
These strategy names have been mainstays of the financial industry longer than most of us have
been alive and, thus, rarely need to be defined. But this is not what I do. I needed to create a term
that myself and others could identify and understand for the style of investing that can protect
investors capital, and grow it faster, which I believe in and have been doing for over 20 years.
So, my team and I put our heads together and wordsmithed our way to an answer – Asset
Revesting!
Finally, A Name To A Face - Asset Revesting
So, what is Asset Revesting exactly? Allow me to break it down to its simplest definition. An
'Asset' is anything a person would purchase that they believe will hold its value or increase in
value. Examples include precious metals, real estate, stocks, bonds, ETFs, vintage cars, stamps,
bitcoin, etc.
WWW.TRADERSWORLD.COM July, August. September 2023
79
Revesting is a combination of a couple of words. It is 'Divesting' yourself of an asset that is
falling in value and 'Reinvesting' the money into something on the rise. Hence, Asset Revesting.
A style of investment that is straight-up common sense.
Asset Revesting:
· Exclusively holds assets rising in value.
· Sells assets that are decreasing in value.
· Sets risk management rules to protect capital.
· Deploys position management to limit losses and lock in profits.
· Will hold cash as a position when all other assets are falling.
Have you been doing this all along? If so, you may just be an asset 'Revester' and didn't know it.
As 'Asset Revesting' is a newly coined term, the people currently managing their investments in
the aforementioned ways are already 'Revester's.' It turns out I've been one for decades!
Should You Consider Becoming An Asset Revester?
My answer to this is simple. Becoming an asset revester means you will be ahead of the game
throughout most of the journey to retirement. Instead of watching your portfolio buckle under the
weight of unexpected selloffs, you will be out of your positions and safely in cash. It's also
possible to profit from falling prices, which is how we as investors can supercharge returns.
I am not one to blow sunshine where there shouldn't be any. Do we have trades that don't work
out – you bet, but do all of our trades have profit targets and protective stops in place to manage
risk, ALWAYS!
The reality is that there is always some inherent risk when it comes to trading and investing, and
you need to both prepare for and expect that. A position needs room to breathe, but that doesn't
mean we give it a mile when an inch will do just fine.
2022 was a hard one for many retired people. The bond market, traditionally a safe hedge-type
play against the stock market, collapsed, taking countless retirees with it, forcing them to cut
back on spending and downgrade their lifestyle. For my part, hearing the stories of so many
people (family, friends, subscribers, strangers) who had followed the advice from their financial
professional, or relied on the historical performance of their portfolio (forgetting that they were
in a different phase of life than they were in the last big market reset in 2008), just made me
cringe, and want to help as many investors possible from happening again.
I narrowed my focus on soon-to-be or already-retired folks who simply cannot afford to
weather another multi-year recession using the diversified buy-and-hold strategy. These people
are my parents. They are my wife's parents. They are my neighbors. They are members of my
Technical Traders community. They are strangers whose stories I have heard. My mission is to
help as many investors as possible avoid and even profit from the next major financial reset in
stocks, bonds, commodities, and even real estate. This is the worst possible time for the majority
of investors to lose another 20-50% of their wealth and then have to wait 5-15 years for their
accounts to recover.
WWW.TRADERSWORLD.COM July, August. September 2023
80
Now, I share my asset revesting signals to follow, and I even encourage you to have them
autotrading in your brokerage account at no additional cost.
Imagine if you could have rotated your capital into the best asset at any given time during covid.
Rotating out of stocks, into bonds, then waiting in cash until stocks bottomed, and then reentered the stock market for big gains and no losses?
Imagine if you could save $5000, $20,000, or even $50,000 a year in advisor fees while having
your retirement account value protected and growing in all market conditions, and have this done
for a small flat fee? This is what investors in over 130 countries are doing with some or all of
their investment capital and are enjoying the journey with me.
It works with account sizes of $50,000 or more, and you trade the signals in your self-directed
brokerage account or have the broker autotrade the signals for you with the simple annual
newsletter subscription fee.
If you have any questions feel free to contact me, I'm here to help!
Chris Vermeulen
www.TheTechnicalTraders.com
WWW.TRADERSWORLD.COM July, August. September 2023
81
W.D.GANNS SQUARING OF TIME AND PRICE
By D.K.Burton
Many people fail as they start studying astrology first, you need to learn all the steps
before you study astronomy, and he didn’t use astrology anyway. First is to study
Gann’s book “How to make profits in commodities”. You need to read the first 64
pages 10 times, once every 10 days. If you have never traded you probably aren’t
ready to for about 18 months later. There many levels to Gann, the highest level,
which is astronomy requires full time study and you can’t have a job to do that.
First you need to draw up monthly Gann charts, Gann chart are contracts May to
May, December to December which you can do through CSI data.
Once you set up December Gann cotton contracts you push the yearly tab, then
table and it gives you the exact date of the high and low prices.
Where you don’t have data go to Gann’s book and you find the cash price of cotton
high was 189 on 23rd August 1864, you can square that high in Months and it was
close to some major trend changes. Of course you can see August 1927, which in
TTTTTA was where he predicted a major high for 8th September 1927 which was the
last high before the depression low in 1932.
WWW.TRADERSWORLD.COM July, August. September 2023
82
1943 was the last low before it peaked in 1951 February 1959 was the last high for a
few years. 1974 was a major low that wasn’t taken out until 1986.1990 was the last
high before a major fall. 2006 was the low for a few years and 2022 was a low before
the market had a strong rally.
If you go to my program you can get the historical data cheaper
www.wdganntrader.com
This data I have been using for 40 years. These high low dates for yearly, quarterly,
monthly and weekly also help with over balancing TIME. Easy to get all the
anniversary dates Gann talks about. As example if you wanted to look up his 13 year
cycle for 2023 you would look up 2010, low was February in 2023 it was March. High
was in November, but look at all the other cycles in his book back to 1828 on page
190. Like 144 years was a high in 1879 in December.
You must look at the overbalancing of TIME and PRICE and the 2-day swing chart
after monthly and weekly charts have been studied.
David has been using Gann methods on markets and weather since 1983
Website www.wdganntrader.com
Weather/Gann telegram t.me/inigo432/
WWW.TRADERSWORLD.COM July, August. September 2023
83
Decoding Investment Strategies with Heikin-Ashi: An In-Depth Manual
by Dr. Keith Wade
Navigating the intricate realm of stock market investment often appears as a formidable
endeavor, more so for newcomers. The task necessitates a dedicated engagement with
meticulous investigation, sharp analytical skills, and a deep grasp of an array of
technical indicators. Among these, Heikin-Ashi, a tool to visualize market trends, has
been progressively earning recognition within the field of stock trading.
Understanding Heikin-Ashi
Originating from the Japanese language, Heikin-Ashi translates to “average bar.” This
tool is a specialized variant of the universally used candlestick chart, which is frequently
employed to discern market movements and potential trading avenues. The
distinguishing factor of Heikin-Ashi charts is the unique formula they employ to
determine the metrics of each candle’s opening, closing, peak, and trough prices.
This distinctive Heikin-Ashi formula integrates the previous candle’s closing, opening,
peak, and trough prices. As a result, the calculations for each candle’s opening and
closing prices originate from the mean value of the preceding candle’s opening and
closing prices. Similarly, the peak and trough prices are determined based on the mean
value of the previous candle’s peak and trough prices.
Leveraging Heikin-Ashi for Stock Market Investments
Heikin-Ashi charts serve as powerful aids for spotting market trends and potential
trading ventures. Their inherent strength lies in unveiling trends that traditional
candlestick charts might fail to highlight.
Recognizing Trends
To identify trends using Heikin-Ashi charts, the key lies in scrutinizing the color of the
candles. During a phase of upward market trend or bullish trend, the candles glow in
green, while a downward or bearish trend showcases red candles. A shift in the market
trend is denoted by the alternation of green and red candles.
Spotting Trading Opportunities
Heikin-Ashi charts prove reliable in identifying potential trading windows. A common
approach is to anticipate a shift in market trends and then initiate a trade in harmony
with the new trend. For instance, a string of red candles turning green might indicate a
lucrative buying prospect.
A supplementary approach involves the concurrent utilization of Heikin-Ashi charts with
other technical indicators such as moving averages or the Relative Strength Index
WWW.TRADERSWORLD.COM July, August. September 2023
84
(RSI). An amalgamation of diverse indicators could heighten the probability of
uncovering fruitful trading opportunities.
Advantages of Adopting Heikin-Ashi
Heikin-Ashi charts offer a host of benefits to the discerning investor:
x
x
x
x
x
Their interpretations are simple and intuitive.
They are adept at unearthing trends that may remain hidden in standard
candlestick charts.
They work in synergy with other technical indicators.
They present a clear image of the current market sentiment.
Below is an illustrative example of implementing Heikin-Ashi alongside custom
indicators. The intention here is to sustain profitable trades as long as feasible.
When the HA dot shifts to red, it’s the cue to exit the trade.
WWW.TRADERSWORLD.COM July, August. September 2023
85
A Glimpse into Trading Psychology
Heikin-Ashi emerges as an impactful tool in aiding investors to identify market
movements and trading opportunities. By using Heikin-Ashi charts in harmony with
other technical indicators, investors can potentially elevate their chances of executing
profitable trades. However, it is essential to bear in mind that no indicator offers infallible
results. Investors should always engage in in-depth research and thorough analysis
before finalizing any investment decisions.
For further information, visit www.seasonaltraderpro.com.
To access Dr. K’s HA for TOS, click here: STP HA (Heikin Ashi) – Advanced Trend for
TOS – Seasonal Trader Pro
All Back issues of Traders World magazine
on 3 DVDs mailed to you first class mail.
Issues 1 - 89.
$49.95
3 DVDs
Free shipping
click to order
WWW.TRADERSWORLD.COM July, August. September 2023
86
WWW.TRADERSWORLD.COM July, August. September 2023
87
WWW.TRADERSWORLD.COM July, August. September 2023
88
WWW.TRADERSWORLD.COM July, August. September 2023
89
WWW.TRADERSWORLD.COM July, August. September 2023
90
WWW.TRADERSWORLD.COM July, August. September 2023
91
WWW.TRADERSWORLD.COM July, August. September 2023
92
WWW.TRADERSWORLD.COM July, August. September 2023
93
WWW.TRADERSWORLD.COM July, August. September 2023
94
WWW.TRADERSWORLD.COM July, August. September 2023
95
WWW.TRADERSWORLD.COM July, August. September 2023
96
WWW.TRADERSWORLD.COM July, August. September 2023
97
Using Simulation Mode to Build Your Successful Strategic Plan
Most traders will develop fear due to a history of losses. To help you
overcome your fear, trade in simulation mode to help you build your
confidence in your approach to trading. As you trade in simulation mode,
develop a set of notes that will function as the beginning of your Strategic
Plan. Trade in simulation mode until you have mastered the use of the
trading platform you have chosen. As you trade in simulation mode,
practice developing the discipline needed to execute your plan.
We are happy to help you with your trading. We have been helping
traders all over the world for the last 20 years. We provide our
members with unlimited support and training to always be there if
you have a question.
Please let us know if you need any help in developing your
approach to profitable trading. Send an email to
support@navitrader.com to attend our LIVE MARKET ROOM
Sessions for FREE!
GO TO: https://www.navitrader.com/FreeVideos/FreeSessions.html to get
FREE TRADER SESSIONS and FREE TRADER VIDEOS
If you have any questions on the material in this publication, please send
an e-mail to Steve Wheeler
support@navitrader.com
www.navitrader.com
800-987-6269
dŚĞŝŶĨŽƌŵĂƚŝŽŶǁŝƚŚŝŶƚŚŝƐĂƌƚŝĐůĞĂƐǁĞůůĂƐĂůůĐŚĂƌƚƐƐŚŽǁŶĂƌĞĨŽƌĞĚƵĐĂƚŝŽŶĂůƉƵƌƉŽƐĞƐŽŶůLJĂŶĚŶŽƚĂ
ƌĞĐŽŵŵĞŶĚĂƚŝŽŶƚŽďƵLJŽƌƐĞůůĂŶLJĨƵƚƵƌĞƐĐŽŶƚƌĂĐƚ͘Z/^<tZE/E'^͗dƌĂĚŝŶŐƐƚŽĐŬƐ͕ŽƉƚŝŽŶƐ͕ĨƵƚƵƌĞƐ͕ĂŶĚĨŽƌĞŝŐŶ
ĞdžĐŚĂŶŐĞĐĂƌƌŝĞƐĂŚŝŐŚůĞǀĞůŽĨƌŝƐŬĂŶĚŵĂLJŶŽƚďĞƐƵŝƚĂďůĞĨŽƌĂůůŝŶǀĞƐƚŽƌƐ͘ĞĨŽƌĞĚĞĐŝĚŝŶŐƚŽƚƌĂĚĞ͕LJŽƵƐŚŽƵůĚ
ĐĂƌĞĨƵůůLJĐŽŶƐŝĚĞƌLJŽƵƌŵŽŶĞƚĂƌLJŽďũĞĐƚŝǀĞƐ͕ůĞǀĞůŽĨĞdžƉĞƌŝĞŶĐĞ͕ĂŶĚƌŝƐŬƚŽůĞƌĂŶĐĞ͘dŚĞƉŽƐƐŝďŝůŝƚLJĞdžŝƐƚƐƚŚĂƚLJŽƵĐŽƵůĚ
ƐƵƐƚĂŝŶĂůŽƐƐŽĨƐŽŵĞŽƌĂůůŽĨLJŽƵƌĚĞƉŽƐŝƚĞĚĨƵŶĚƐĂŶĚƚŚĞƌĞĨŽƌĞLJŽƵƐŚŽƵůĚŶŽƚƐƉĞĐƵůĂƚĞǁŝƚŚĐĂƉŝƚĂůƚŚĂƚLJŽƵĐĂŶŶŽƚ
ĂĨĨŽƌĚƚŽůŽƐĞ͘zŽƵƐŚŽƵůĚďĞĂǁĂƌĞŽĨĂůůƚŚĞƌŝƐŬƐĂƐƐŽĐŝĂƚĞĚǁŝƚŚƚƌĂĚŝŶŐĂŶĚƐĞĞŬĂĚǀŝĐĞĨƌŽŵĂŶŝŶĚĞƉĞŶĚĞŶƚĂĚǀŝƐŽƌŝĨ
LJŽƵŚĂǀĞĂŶLJĚŽƵďƚƐ͘Ύ,zWKd,
d/>W
Z&KZDE
Z
^h>d^,s
DEz/E,
Z
Ed>/D/dd/KE^͕^KD
K&t,/,
Z
^Z/
>Kt͘EKZ
WZ
^
Edd/KE/^
/E'D
d,dEzKhEdt/>>KZ/^>/<
>zdK,/
s
WZK&/d^KZ>K^^
^^/D/>ZdKd,K^
^,KtE͘/E&d͕d,
Z
Z
&Z
Yh
Ed>z^,ZW/&&
Z
E
^
dt
E
,zWKd,
d/>W
Z&KZDE
Z
^h>d^Ed,
dh>Z
^h>d^^h^
Yh
Ed>z,/
s
zEzWZd/h>Z
dZ/E'WZK'ZD͘WĂƐƚƌĞƚƵƌŶƐĂƌĞŶŽƚŝŶĚŝĐĂƚŝǀĞŽĨĨƵƚƵƌĞƌĞƐƵůƚƐ͘EĂǀŝdƌĂĚĞƌ͕/ŶĐ͘ĂŶĚEĂǀŝdƌĂĚĞƌ͘ĐŽŵƉƌŽǀŝĚĞ
ƉƌŽŐƌĂŵƐĂŶĚƐĞƌǀŝĐĞƐƚŚĂƚĂƌĞĨŽƌĞĚƵĐĂƚŝŽŶĂůƉƵƌƉŽƐĞƐĂŶĚŶŽƚŝŶƚĞŶĚĞĚƚŽďĞĂƌĞĐŽŵŵĞŶĚĂƚŝŽŶƚŽďƵLJŽƌƐĞůůĂŶLJ
ĨƵƚƵƌĞƐ͕ĨŽƌĞŝŐŶĞdžĐŚĂŶŐĞ͕ƐƚŽĐŬƐ͕
d&ƐĂŶĚͬŽƌŽƉƚŝŽŶƐŵĂƌŬĞƚƚƌĂĚĞƐ͘WĂƐƚƉĞƌĨŽƌŵĂŶĐĞĚŽĞƐŶŽƚŐƵĂƌĂŶƚĞĞŽƌŝŵƉůLJĂŶLJ
ĨƵƚƵƌĞƐƵĐĐĞƐƐ͘EŝŶũĂdƌĂĚĞƌΠŝƐĂƌĞŐŝƐƚĞƌĞĚƚƌĂĚĞŵĂƌŬŽĨEŝŶũĂdƌĂĚĞƌ'ƌŽƵƉ͕>>͘EŽEŝŶũĂdƌĂĚĞƌĐŽŵƉĂŶLJŚĂƐĂŶLJ
ĂĨĨŝůŝĂƚŝŽŶǁŝƚŚƚŚĞŽǁŶĞƌ͕ĚĞǀĞůŽƉĞƌ͕ŽƌƉƌŽǀŝĚĞƌŽĨƚŚĞƉƌŽĚƵĐƚƐŽƌƐĞƌǀŝĐĞƐĚĞƐĐƌŝďĞĚŚĞƌĞŝŶ͕ŽƌĂŶLJŝŶƚĞƌĞƐƚ͕ŽǁŶĞƌƐŚŝƉ
ŽƌŽƚŚĞƌǁŝƐĞ͕ŝŶĂŶLJƐƵĐŚƉƌŽĚƵĐƚŽƌƐĞƌǀŝĐĞ͕ŽƌĞŶĚŽƌƐĞƐ͕ƌĞĐŽŵŵĞŶĚƐŽƌĂƉƉƌŽǀĞƐĂŶLJƐƵĐŚƉƌŽĚƵĐƚŽƌƐĞƌǀŝĐĞ͘
WWW.TRADERSWORLD.COM July, August. September 2023
98
7KH.LFNHU6LJQDO±
2QHRIWKH0RVW3RZHUIXO&DQGOHVWLFN5HYHUVDO6LJQDOV
By Stephen W. Bigalow
What are the most potent candlestick signals? This is the question many investors ask
when just learning about candlestick analysis. There are approximately 50 or 60
candlestick signals. But there are only 12 major signals of relevance, six longs, and six
shorts. The ‘12 Major Signals’ produce the strongest reversal indications. They are also
the signals that occur the most often. This is a significant factor to remember. Once you
learn the 12 Major Signals, you will start gaining control of your investment
perspectives. The remaining 50 – 60 candlestick signals do not occur often enough to
spend a lot of mental time and energy trying to learn what their results produce. The
Japanese rice traders identified the graphics that illustrate when trend reversals are
occurring. Where do most people buy? They buy exuberantly at the top! Where do most
people sell? They panic sell at the bottom.
One of the most powerful candlestick reversal signals is the Kicker Signal. It produces a
dramatic change in a price trend, illustrating a very strong reversal of investor
sentiment. The sentiment has been kicked in the opposite direction. The candlestick
investor gains a considerable advantage by recognizing the Kicker Signal. There is a
very high probability of expected results when visually recognizing the signal.
There are three variations of the Kicker Signal. The Kicker Signal itself, the Trend Kicker
signal, and the Flutter Kicker signal. They illustrate strong price move expectations both
bullish and bearish.
Assume the majority of all investment decisions are based upon fundamental
reasoning/research. Candlestick signals and patterns are developed based upon
fundamentally influenced decision-making, the accumulative result of buying and selling
during specific time frames. Candlestick analysis also utilizes technical analysis tools to
confirm ‘why’ buying and selling are occurring at particular levels. Witnessing a
candlestick ‘buy’ signal at a significant support level, such as a moving average or trend
line, reveals where investment decisions are activated. Witnessing a candlestick sell
signal at a resistance level dramatically improves the probability that the sellers are
taking control.
Obviously, bullish candlestick stock prices will likely perform better when the market
indexes are in an uptrend. Bearish stock prices will perform better when the market
indexes show a downtrend. Candlestick analysis significantly improves an investor’s
ability to assess the direction of the general market indexes. Simple candlestick
scanning techniques will identify which sectors show the most significant strength
coinciding with the general market movements. The same simple scanning techniques
WWW.TRADERSWORLD.COM July, August. September 2023
99
can then determine which individual stock charts show the strongest signals and
patterns in those sectors.
The Japanese rice traders utilized a straightforward logic. Witnessing a candlestick buy
signal in the oversold area produced a high probability that an uptrend was starting.
Witnessing a candlestick sell signal in the overbought area was producing a high
probability that a downtrend was beginning. Witnessing a candlestick buy signal in the
overbought area was not relevant. Witnessing a candlestick sell signal in the oversold
area was not relevant.
However, witnessing a Kicker Signal demonstrates such a powerful change in investor
sentiment that it does not matter where the signal occurs during a price trend. The
strength of the signal reveals a movement in the direction of the signal.
The bullish Kicker Signal is visually recognized. The price gaps up at or above the
previous day’s open and moves in the opposite direction of the previous day’s bearish
direction. The bearish Kicker Signal gaps down at or below the previous day’s bullish
candle and moves in the opposite direction.
WWW.TRADERSWORLD.COM July, August. September 2023
100
The strength of a Kicker Signal is more evidenced-based by the length of the candle
bodies. The bigger the body, the stronger the demonstration of a dramatic change in
investor sentiment. This information becomes a decisive factor for day traders and
swing traders to get into high-probability/high-profit positions.
WWW.TRADERSWORLD.COM July, August. September 2023
101
The initial alert of a Kicker Signal developing is the gap up above the previous day’s
open. As illustrated in the MRNA chart, the strength of the reversal signal was the gap
up, the magnitude of the bullish candle, and a close above the T line. The indicators
utilized by candlestick analysis make the trading decision reasonably simple. The
position is maintained until there is a candlestick sell signal and a close back below the
T line.
As with any candlestick reversal signal, the more confirming indicators applied from the
visual analysis, the higher the probability that a reversal/new price trend has occurred.
WWW.TRADERSWORLD.COM July, August. September 2023
102
The CALX chart reveals a Kicker Signal off the 50-day moving average, gapping up
above the previous day’s open and above the T-line and breaking out through the
perceived down-trending resistance level. The visual analysis incorporates multiple
indications that this is where there has been a dramatic change in investor sentiment.
This analysis is essential for most investors’ psyche. What is the biggest fear of a big
price move? Boy, do I want to be chasing? When witnessing a candlestick signal, the
Kicker Signal eliminates the ‘chasing’ fear factor. The strength of a Kicker Signal allows
the candlestick investor to establish positions in the early stage of a price move.
Knowing what is to be expected after witnessing the signal allows for establishing a
potentially high-profit trade in the very initial stage of the substantial price move.
The bearish Kicker Signal produces strong visual evidence of a major change. The
strength of the downtrend will continue until witnessing a strong bullish reversal signal.
WWW.TRADERSWORLD.COM July, August. September 2023
103
7KH7UHQG.LFNHUVLJQDO
The Trend Kicker Signal acts as a very strong trend continuation indicator. It is a Kicker
Signal that occurs during an existing trend. The trend usually has been started with a
pattern confirmation. But like most price trends, they do not move in the same direction
every day/time frame. Witnessing a bearish trading day during an uptrend is not
necessarily a bearish reversal signal; merely profit-taking is not an uncommon
occurrence. The trend kicker signal provides good evidence that the trend will likely
continue with a high degree of strength and probability. As demonstrated in a Kicker
Signal, a Trend Kicker Signal allows for immediate entry with the expectation that the
trend will likely continue and with reasonable force.
WWW.TRADERSWORLD.COM July, August. September 2023
104
The AI chart reveals a price move starting, coming out of a fry pan bottom pattern. The
bearish candle, after the price broke out through the 200-day moving average, might
have implied some consolidation. However, the next day when the price gapped up
above the previous day’s open and traded positively created a bullish Trend Kicker
Signal, indicating there was still going to be a much more bullish upside to the trend.
7KH)OXWWHU.LFNHU6LJQDO
The Flutter Kicker Signal is a derivative of the Kicker Signal. But it has one major
advantage! It produces highly high probability entry trades for day traders and swing
traders. It is created when a bearish candle is followed by a gap up at or above the
opening of the bearish candle. This produces an alert not usually seen by most other
investors. But the gap-up trading produces a Doji-type day. This may not indicate a
strong bullish potential, but this is where the Doji rule kicks in. The Doji rule merely
states that a price will usually move in the direction of how they open the following time
WWW.TRADERSWORLD.COM July, August. September 2023
105
frame after a Doji. A positive open immediately indicates the price will continue to move
positive, likely to form a strong bullish candle after the Doji.
The flutter is the Doji in between a bearish candle and a gap-up indecisive day followed
by a bullish candle. If you took the Doji, the flutter, off the chart, you now have a Kicker
Signal. The major advantage is that candlestick investors can be prepared immediately
on the positive open of the third day.
The gap up after the bearish candle in the ARA chart becomes the ³DOHUW” that investor
sentiment has changed. A high probability trade entry is utilizing the Doji rule, buying on
positive trading after the Doji. For the day trader, as well as the swing trader, this is an
extremely high probability trade entry. A bearish Flutter Kicker Signal produces a solid
force to the downside.
7KH6WUHQJWKRI&DQGOHVWLFN6LJQDOV
As an investor, whether a day trader, swing trader or a long-term investor, applying the
commonsense expected results of candlestick signals and patterns dramatically
WWW.TRADERSWORLD.COM July, August. September 2023
106
improves the ability to evaluate trend movement much more accurately. Candlestick
signals and patterns are not conjecture. They indicate the ‘actual’ decisions occurring
between the bulls and the bears.
The logic is simple! Candlestick analysis is the graphic depiction of everybody buying
and selling during a specific time frame. It is not delegated to any particular trading
market or entity. It is a graphic depiction of human nature. Anything that involves
investor fear and greed, which is all trading entities, market indexes, ETFs, stocks,
commodities, currencies, and tulip bulbs, can be evaluated with much greater accuracy
using candlestick analysis.
The chart signals and patterns work on all time frames. They are effective for the shortterm trader/day trader utilizing a one-minute, five-minute, and ten-minute chart analysis
combinations. Long-term hold periods would utilize the daily, weekly, and monthly chart
evaluations. The Japanese rice traders not only identified high probability price reversal
signals, they also explained what investor sentiment was doing to create the reversal
signals and patterns. This combination allows investors to analyze price movements
with the same insights as an investor with 50 years of investment experience.
You can turn your investment perspectives around 180°. Witnessing a candlestick buy
signal in the oversold condition reveals where the smart money is buying. Witnessing a
candlestick sell signal in the overbought condition reveals where the smart money is
selling. Candlestick charts allow you to participate with the ‘smart money’. Doing what
the charts reveal takes the emotions out of your trading.
Candlestick charts reveal some very powerful truisms. The chart graphics are based
upon the most consistent investment indicator in the world – human nature. Another
Wall Street investment truism is that if something does not work, it does not stay around
very long. Candlestick analysis has been in existence for hundreds of years. Japanese
rice traders have identified signals and patterns that produce high-probability results
based on investor sentiment. All an investor needs to do is learn how to use candlestick
signals and patterns correctly. They work!
6WHSKHQ : %LJDORZ RZQHU DQG RSHUDWRU RI ZZZFDQGOHVWLFNIRUXPFRP +LV \HDUV RI
LQYHVWPHQWWUDGLQJZLWKDKHDY\HPSKDVLVRQFDQGOHVWLFNDQDO\VLVSURYLGHVDOHDUQLQJIRUXPRI
FDQGOHVWLFN DQDO\VLV +H FRQVXOWV IRU PRQH\ PDQDJHUV DQG KHGJH IXQG PDQDJHUV WR LPSURYH
PDUNHWDQGSRVLWLRQLQJWLPLQJ6WRFNEURNHU
.LGGHU3HDERG\&RZHQ2SSHQKHLPHU &RPSDQ\
+H KROGV D EXVLQHVV DQG HFRQRPLFV GHJUHH IURP &RUQHOO 8QLYHUVLW\ 3XEOLVKHG
³3URILWDEOH
&DQGOHVWLFN7UDGLQJ´³+LJK3URILW&DQGOHVWLFN3DWWHUQV´DQG³&DQGOHVWLFN3URILWV(OLPLQDWLQJ
(PRWLRQV´
WWW.TRADERSWORLD.COM July, August. September 2023
107
Ğ>ŽƌĞĂŶdŝŵĞdƌĂĚŝŶŐ
dŚĞĨƵƚƵƌĞŝƐŬŶŽǁŶ
ZŝĐŬsĞƌƐƚĞĞŐͲϭϴƚŚŽĨ:ƵŶĞϮϬϮϯ
>ĂƐƚƋƵĂƌƚĞƌŚĂƐǁŝƚŶĞƐƐĞĚĂůŽƚŽĨŶĞŐĂƚŝǀŝƚLJĂŶĚĚŽǁŶǁĂƌĚƉƌĞƐƐƵƌĞŽŶƐƚŽĐŬŝŶĚŝĐĞƐ͘/ŶƐƉŝƚĞŽĨƚŚĞŵĂŶLJŶĞŐĂƚŝǀĞ
ŶĞǁƐĂŶĚƚƌĞŶĚƐ͕ƚŚĞŵĂƌŬĞƚƐĚŝĚŶŽƚĐŽŶƚŝŶƵĞƐƉŝƌĂůŝŶŐĚŽǁŶ͘DĂŐŝĐĂůůLJƚŚĞƌĞŚĂƐĂůǁĂLJƐďĞĞŶŵĂƐƐŝǀĞƐƵƉƉŽƌƚŽŶ
ƉƌĞǀŝŽƵƐůŽǁƐĂŶĚƐŽĨĂƌ͕ƚŚĞŵĂƌŬĞƚƐŶŽƌĚĞďƚŝƐĂůůŽǁĞĚƚŽŝŵƉůŽĚĞ͘dŚĞh^ĚĞďƚĐĞŝůŝŶŐŚĂƐďĞĞŶĂďŽůŝƐŚĞĚĂŶĚ
ŵĂŶLJƚƌŝůůŝŽŶƐŽĨĚŽůůĂƌƐǁŝůůďĞŝŶũĞĐƚĞĚŝŶƚŚĞŵĂƌŬĞƚƐŝŶƚŚĞĨƵƚƵƌĞ͘Ɛ
&KZ&Z
ͲƚĞůůĨƌŝĞŶĚƐΘƚƌĂĚĞƌƐ
ĂůǁĂLJƐ͕ŵĂŬŝŶŐƚŚĞŽƵƚĐŽŵĞǁŽƌƐĞŝŶƚŚĞĞŶĚ͕ũƵƐƚůŝŬĞƚŚĞ'ĞƌŵĂŶ
^W
/>/^KhEdƚŽŽƌĚĞƌ
ŚLJƉĞƌŝŶĨůĂƚŝŽŶŝŶƚŚĞϭϵϮϬ͛Ɛ͘tŽƌůĚǁŝĚĞĞĐŽŶŽŵLJǁŝůůĐŽŶƚŝŶƵĞŝƚƐůŽŶŐĞƌ
zŽƵƚƵďĞĐŚĂŶŶĞůŚĂƐďĞĞŶ
ƚĞƌŵĚŽǁŶƚƌĞŶĚĂŶĚƚŚĞĨŝŐŚƚĨŽƌĚĞŵŽĐƌĂĐLJͬĨƌĞĞĚŽŵŚĂƐďĞŐƵŶ͕ũƵƐƚ
ůĂƵŶĐŚĞĚĨŽƌĞ>ŽƌĞĂŶdŝŵĞ
ůŝŬĞŝŶƚŚĞϭϵϰϬ͛ƐĂŶĚϭϳϳϱ;ŵĞƌŝĐĂŶƌĞǀŽůƵƚŝŽŶͿ
dƌĂĚŝŶŐ͘ŚĞĐŬƚŚĞĞdžĐĞůůĞŶƚ
dZ
Z^͗/ŶƚŚŝƐŝƐƐƵĞǁĞǁŝůůƐŚŽǁLJŽƵŚŽǁƵŶĐĂŶŶLJĂŶĚƉƌĞĐŝƐĞ
Ğ>ŽƌĞĂŶdŝŵĞdƌĂĚŝŶŐ;ddͿĨŽƌĞĐĂƐƚƐƚŚĞĨƵƚƵƌĞƚƌĞŶĚ
^
>^KKhZdZ/E'^z^d
DĂŶĚƌĞƐƵůƚƐ͘
WKZd&K>/KDE'
Z^͗ǁŽƵůĚLJŽƵůŝŬĞĂƐŝŐŶŝĨŝĐĂŶƚŽƵƚƉĞƌĨŽƌŵĂŶĐĞ
ĂŐĂŝŶƐƚLJŽƵƌƐƚŽĐŬŵĂƌŬĞƚďĞŶĐŚŵĂƌŬ͍ĐƚŝǀĞŵĂŶĂŐĞƌƐĐĂŶƵƐĞdd͘
ĚĚŝƚŝŽŶĂůůLJLJŽƵĐĂŶƵƐĞĞ>ŽƌĞĂŶ>ŽŶŐƚĞƌŵdŝŵĞWĂƚƚĞƌŶƐ͘
&ŝƌƐƚůLJǁĞǁŝůůĚŝƐĐƵƐƐƚŚĞƚƌĂĚĞƌ͛ƐƐĞĐƚŝŽŶ͘
ƚƌĂĐŬƌĞĐŽƌĚĨƌŽŵƚŚĞƐƚĂƌƚĂƚ
ƉƌŝůϭϯƚŚ͘ůůǀŝĚĞŽƐŚĂǀĞďĞĞŶ
ƌĞůĞĂƐĞĚǁĞĞŬƐŽƌĚĂLJƐďĞĨŽƌĞ
ƚŚĞƚƌĞŶĚŵĂŶŝĨĞƐƚĞĚŝƚƐĞůĨŝŶ
^Wy͘
d,
^Wy&K>>Kt^d,
/Z
d/KEK&dd͊ĐŚĂŶŶĞů
ŚƚƚƉƐ͗ͬͬƐƚƵĚŝŽ͘LJŽƵƚƵďĞ͘ĐŽŵͬĐŚĂ
ŶŶĞůͬhϭϭEdžů^ĐƐϳKϯYd'ϳƐϳƋ
/Y
ĐůŝĐŬůŝŶŬƚŽƐĞĞǀŝĚĞŽƐ
Time Trading for TRADERS
KƵƌƉƌŽƉƌŝĞƚĂƌLJdŝŵĞŝŶĚŝĐĂƚŽƌƐĐĂůĐƵůĂƚĞĚŝŶŽƵƌƐŽĨƚǁĂƌĞĂŶĚŶŽǁŚĞƌĞĞůƐĞĂǀĂŝůĂďůĞ͕,ĂǀĞďĞĞŶĐĂůĐƵůĂƚĞĚEKd
KE>zĨŽƌŚŝƐƚŽƌLJhd>^KĨŽƌƚŚĞĨƵƚƵƌĞ͘WƌĞĚŝĐƚŝŽŶůĂƐƚƉĂŐĞ͘
/ŵƉŽƐƐŝďůĞ͍>ŽŽŬĂƚŽƵƌzŽƵƚƵďĞĐŚĂŶŶĞů͕ǁŚĞƌĞǁĞƉŽƐƚĞĚĨƌŽŵƉƌŝůϳ͕ϮϬϮϯŝŵƉŽƌƚĂŶƚ &hdhZ
hWĂŶĚKtE
ƚƌĞŶĚƐʹƵƐŝŶŐĞ>ŽƌĞĂŶdŝŵĞŝŶĚŝĐĂƚŽƌƐͲĨŽƌƚŚĞŵŽŶƚŚŽĨƉƌŝůĂŶĚďĞLJŽŶĚ͕ƉŝŶƉŽŝŶƚĞĚƚŽƚŚĞĚĂLJŽĨƚŚĞůŽǁĂŶĚ
ƚŚĞŚŝŐŚŽĨƚŚĞŵĂƌŬĞƚƐ͘
ŚĞĐŬƚŚĞǀŝĚĞŽ͛Ɛ͕ƚŚĞƌĞůĞĂƐĞĚĂƚĞƐĂŶĚLJŽƵǁŝůůƐĞĞŝƚĐĂŶďĞĨŽƌĞĐĂƐƚĞĚ͕ǁŝƚŚŽƵƚŶĞĞĚŝŶŐĂŶLJƉƌŝĐĞĚĂƚĂ͘
tĞĐĂŶĂůƐŽŵŽƌĞŽƌůĞƐƐĚĞƚĞƌŵŝŶĞƚŚĞƐƚƌĞŶŐƚŚŽĨĂĨƵƚƵƌĞƚƌĞŶĚ͕ďƵƚŶŽƚƚŚĞƉƌŝĐĞƚĂƌŐĞƚ͘dŚŝƐŝƐƋƵŝƚĞŽďǀŝŽƵƐ͕
ŝŵĂŐŝŶĞǁĞǁŽƵůĚƚĞůůLJŽƵƐƚƌŽŶŐĞƌĚŽǁŶƚƌĞŶĚƐŽĨƚŚĞŵŽŶƚŚKĐƚŽďĞƌϮϬϮϯ͕ƚŚĞƌĞĂƌĞŶŽƚE
KEůŝŐŚƚƐĨůĂƐŚŝŶŐŝŶ
ŽƵƌƐŽĨƚǁĂƌĞǁŝƚŚƉƌŝĐĞŝŶĨŽƌŵĂƚŝŽŶ͘
tŚĂƚǁĞĐĂŶĂƐƐĞƐƐƚŚŽƵŐŚŝƐŝŶǁŚĂƚƚŝŵĞƉĞƌŝŽĚŝŶƚŚĞĨƵƚƵƌĞďŝŐŐĞƌďƵůůĂŶĚďĞĂƌŵĂƌŬĞƚƐĂƌĞůŝŬĞůLJƚŽĚĞǀĞůŽƉ͘
dƌĂĚŝŶŐƐLJƐƚĞŵƵƐŝŶŐdd͕^Wy
^ĨƵƚƵƌĞ͕ϳϵйŚŝƚƌĂƚŝŽ͕ϮϱŬƌĞƚƵƌŶŝŶϮŵŽŶƚŚƐƵƐŝŶŐĂůůƐŝŐŶĂůƐĂƐŝŶŽƵƌKt,/d^͕
ŽƌĚĞƌŽŶŽƵƌǁĞďƐŝƚĞ͘tŚĞŶƚŚĞdŝŵĞŝŶĚŝĐĂƚŽƌŵĂŬĞƐĂƐŝŐŶŝĨŝĐĂŶƚŵŽǀĞ͕ƚŚĞĐŚĂƌƚĂƌĞĂǁŝůůƐŚŽǁ'Z
EKZZ
͘
/ŶƚŚĞĐŚĂƌƚĂďŽǀĞLJŽƵƐĞĞKt,/d^͕ĂůůŽƵƌƐŝŐŶĂůƐ͕ƌĞĚĂƌƌŽǁсƐŚŽƌƚ͕ŐƌĞĞŶĂƌƌŽǁсůŽŶŐ͕ďůĂĐŬĂƌƌŽǁсĞdžŝƚůŽŶŐŽƌƐŚŽƌƚ͘
WWW.TRADERSWORLD.COM July, August. September 2023
108
/ŶƐŚŽƌƚ͕ŽƵƌƐŽĨƚǁĂƌĞĐĂůĐƵůĂƚĞƐĂůůĂůƚĞƌŶĂƚŝŶŐƵƉĂŶĚĚŽǁŶƚƌĞŶĚƐĂŶĚǁŚĞŶƚŚĞƐĞǁŝůůŚĂƉƉĞŶ͕ŽŶǁŚŝĐŚĚĂƚĞĂŶĚ
ǁŚĂƚƚŝŵĞ͘zŽƵƐĞĞƚŚĞZ
ĂŶĚ'Z
EnjŽŶĞƐŝŶƚŚĞĐŚĂƌƚ͘;ŐƌĞLJŝƐŶĞƵƚƌĂůͿ/ŶZ
njŽŶĞƐƚŚĞƚƌĞŶĚŝƐĚŽǁŶ͕ŝŶ
'Z
EƚƌĞŶĚŝƐƵƉ͘
KŶĞƚŚŝŶŐŝƐĐƌLJƐƚĂůĐůĞĂƌ͕ŵŽƐƚůLJǁŚĞƌĞƚŚĞŝŶĚŝĐĂƚŽƌŐŽĞƐĨƌŽŵƚŽƉƚŽůŽǁ͕ƚŚĞŵĂƌŬĞƚƐĂůƐŽƌĞĂĐŚƚŚĞŝƌůŽǁƐ͘&ƌŽŵ
ƚŚĞƌĞ͕ǁŚĞŶŝƚŝƐĂŶŝŵƉŽƌƚĂŶƚůŽǁ͕ĨŽůůŽǁĞĚďLJĂƐƚƌŽŶŐŚŝŐŚ͕ƚŚĞŵĂƌŬĞƚƐƌĞǀĞƌƐĞƐƚƌŽŶŐůLJ͕ƐŽŶŽƚŽŶůLJƚŚĞƐŚŽƌƚŝƐ
ƉƌŽĨŝƚĂďůĞ͕ďƵƚĂůƐŽƚŚĞůŽŶŐƚŚĞƌĞĂĨƚĞƌ͊;ƉůĞĂƐĞŶŽƚĞĂŚŝŐŚŽƌůŽǁŝŶǁĞĞŬĞŶĚƐĞǀĂƉŽƌĂƚĞƐͿ
ĂƚĐŚŝŶŐƚŚĞƚƌĞŶĚƐŝŶƚŝŵĞƚŽŵĂŬĞĂƉƌŽĨŝƚƵƐĞƐĂŶĞŶƚƌLJƐƚƌĂƚĞŐLJĂŶĚĨŽƌƚŚĞĞdžŝƚĂƐŝŵƉůĞƚƌĂŝůŝŶŐƐƚŽƉŝƐƵƐĞĚŽĨϮϱ
ƉŽŝŶƚƐ͘/ŶĂĚĚŝƚŝŽŶǁŚĞŶƚŚĞĐŽůŽƌĐŚĂŶŐĞƐĨƌŽŵƌĞĚƚŽŐƌĞĞŶĐŽƵůĚďĞĂŶĞdžŝƚƚŽĨŽƌĂƐŚŽƌƚƉŽƐŝƚŝŽŶ͕ďƵƚǁĞĚŝĚŶŽƚ
ĂƉƉůLJƚŚŝƐLJĞƚ͘
&ŽƌLJŽƵƌĐŽŶǀĞŶŝĞŶĐĞǁĞůŝƐƚŽƵƌƉƌĞĚŝĐƚŝŽŶƐŝŶzŽƵƚƵďĞǀŝĚĞŽƐďĞůŽǁŝŶĐŚƌŽŶŽůŽŐŝĐĂůŽƌĚĞƌ͕ƉůĞĂƐĞĨŽůůŽǁƵƐŽŶƚŚĞ
ĐŚĂŶŶĞůĂŶĚůŝŬĞŽƵƌǁŽƌŬĨŽƌŵŽƌĞƉƌĞĚŝĐƚŝŽŶƐĂŶĚŝŶĨŽ͕^ƉƌĞĂĚŝƚƚŽĂůůLJŽƵƌĨƌŝĞŶĚƐ͕ŝƚŝƐĨŽƌĨƌĞĞĂŶĚŽŶĞŽĨĂŬŝŶĚ͘
ĐŚĂŶŶĞůůŝŶŬ
ŚƚƚƉƐ͗ͬͬƐƚƵĚŝŽ͘LJŽƵƚƵďĞ͘ĐŽŵͬĐŚĂŶŶĞůͬhϭϭEdžů^ĐƐϳKϯYd'ϳƐϳƋ/Y
sŝĚĞŽƐ
ŚƚƚƉƐ͗ͬͬLJŽƵƚƵ͘ďĞͬůƋy</
//:ǁƐ
ŚƚƚƉƐ͗ͬͬLJŽƵƚƵ͘ďĞͬs&ͺϮŐƌǁϲϴ/
ŚƚƚƉƐ͗ͬͬLJŽƵƚƵ͘ďĞͬĚŐs^ďŐŬ:ĐǁƐ
ŚƚƚƉƐ͗ͬͬLJŽƵƚƵ͘ďĞͬ^ůϴ:ŝϭŵϲϭŽ
ŚƚƚƉƐ͗ͬͬLJŽƵƚƵ͘ďĞͬϯŶLJĂϭĚϬyŬ
ŚƚƚƉƐ͗ͬͬLJŽƵƚƵ͘ďĞͬĂKzƵϱY:ŝϬ
ƐĐƌĞĞŶƐŚŽƚƐĨƌŽŵzŽƵƚƵďĞ͕ǁŚĞƌĞLJŽƵĐĂŶƐĞĞƚŚĞƉƌĞǀŝŽƵƐƉƌĞĚŝĐƚŝŽŶƐŽĨƚŽƉƐĂŶĚďŽƚƚŽŵƐ͘
WůĞĂƐĞǀĞƌŝĨLJƚŚĞzŽƵƚƵďĞĐŚĂŶŶĞůƚŽƐĞĞĨŽƌĞĐĂƐƚƐŽĨƚƌĞŶĚƐŝŶƚŚĞĨƵƚƵƌĞĂƌĞƉŽƐƐŝďůĞ͘
dŽŽƌĚĞƌĞ>ŽƌĞĂŶdŝŵĞdƌĂĚŝŶŐLJŽƵĐĂŶŐŽƚŽƚŚĞǁĞďƐŝƚĞ͘ŚƚƚƉƐ͗ͬͬĂƋƵŝůĂĞƐŝŐŶĂů͘ĐŽŵͬƐŚŽƉͬ
dƌĂĚĞƌƐǁŽƌůĚƌĞĂĚĞƌƐĂƌĞĞŶƚŝƚůĞĚƚŽĂƐƉĞĐŝĂůĚŝƐĐŽƵŶƚŽĨϱϬйƵŶƚŝůϭϱƚŚŽĨ:ƵůLJ͊
tŚĞŶŽƌĚĞƌŝŶŐƵƐĞƚŚĞĐŽƵƉŽŶdtϱϬddƚŽƌĞĐĞŝǀĞƚŚĞĚŝƐĐŽƵŶƚ͘
Portfolio managers
KƚŚĞƌd/D
ƌĞƐĞĂƌĐŚĂŶĚůŽŶŐƚĞƌŵdŝŵĞŝŶĚŝĐĂƚŽƌĐĂŶŐŝǀĞLJŽƵĂĚŝĨĨĞƌĞŶƚĂŶŐůĞŽƌǀĂŶƚĂŐĞƉŽŝŶƚǁŚĞŶƐƚƵĚLJŝŶŐƚŚĞ
ŵĂƌŬĞƚƐŽŶƐĞƋƵĞŶƚůLJŝƚƉƌŽǀŝĚĞƐŶĞǁƉĞƌƐƉĞĐƚŝǀĞŽŶƚŚĞŵĂƌŬĞƚƐĂŶĚƐŽĐŝĞƚLJĂƐĂǁŚŽůĞ͘/ƚŝƐũƵƐƚĂŵĂƚƚĞƌŽĨ
ŐĞƚƚŝŶŐĨĂŵŝůŝĂƌǁŝƚŚŽƵƌŝŶĨŽƌŵĂƚŝŽŶĂŶĚLJŽƵǁŝůůƐĞĞŝƚĨŽƌLJŽƵƌƐĞůĨ͘dŚĞŵĂŝŶƉƵƌƉŽƐĞŝƐƚŽŝŶĐƌĞĂƐĞLJŽƵƌ
ŽƵƚƉĞƌĨŽƌŵĂŶĐĞǁŚŝůĞĂƚƚŚĞƐĂŵĞƚŝŵĞŵĂŶĂŐŝŶŐLJŽƵƌƌŝƐŬ͘>Ğƚ͛ƐŵĂŬĞĂůŝƐƚŽĨĂĚĚĞĚǀĂůƵĞ͗
WWW.TRADERSWORLD.COM July, August. September 2023
109
ϭ͘ ŬŶŽǁŝŶŐǁŚĞŶƚŚĞƐƚŽĐŬŵĂƌŬĞƚƐĂƌĞĂƚƌŝƐŬƚŽĞŶƚĞƌĂďĞĂƌŵĂƌŬĞƚŽƌĂůĞƐƐĞƌĐŽƌƌĞĐƚŝŽŶƵƉƚŽϭϬй
ƐĞĞƉƌĞǀŝŽƵƐĂƌƚŝĐůĞĨŽƌĂŵŽƌĞĚĞƚĂŝůĞĚĚĞƐĐƌŝƉƚŝŽŶĂŶĚĞdžĐĞůůĞŶƚƉĞƌĨŽƌŵĂŶĐĞŽĨƚŚŝƐdŝŵĞƉĂƚƚĞƌŶͲϯǁĂǀĞƐdŽƉ
ĨŽƌĞdžĂŵƉůĞƚŚŝƐdŝŵĞǁĂǀĞƉĂƚƚĞƌŶ͕ǁŚŝĐŚƉƌĞĚŝĐƚƐĂďƵůůŵĂƌŬĞƚ͘zŽƵƌ
ŽƵƚƉĞƌĨŽƌŵĂŶĐĞǁŝůůďĞǀĞƌLJƐŝŐŶŝĨŝĐĂŶƚ͕ĚĞƉĞŶĚŝŶŐŽŶŚŽǁŵƵĐŚLJŽƵ
ŽǀĞƌǁĞŝŐŚƚŽƌƵŶĚĞƌǁĞŝŐŚƚĚĞƉŽƌƚĨŽůŝŽĂŐĂŝŶƐƚƚŚĞďĞŶĐŚŵĂƌŬ͘dŚĞďĞĂƵƚLJ
ŽĨƚŚŝƐƉĂƚƚĞƌŶŝƐ͕ƚŚĂƚŝƐǁŝůůďĞƉƌĞĐĞĚĞĚďLJĂůĂƌŐĞďĞĂƌŵĂƌŬĞƚ;ͲϮϱйŽƌ
ŵŽƌĞͿ͕ŶĞdžƚĐŽŵĞƐĂƐƚƌŽŶŐďƵůůŵĂƌŬĞƚĂŶĚĂĨƚĞƌƚŚĞϮ ŶĚŽƌϯƌĚƚŝŵĞǁĂǀĞ
ƵƉ;ƚŽƉͿ͕ĂŐĂŝŶĂďĞĂƌŵĂƌŬĞƚ͘
EŽǁĂďĞĂƌŽƌďƵůůd/D
ƉĂƚƚĞƌŶŝƐĂƚǁŽƌŬǁŚŝĐŚŚĂƐŶŽƚLJĞƚďĞĞŶ
ĐŽŵƉůĞƚĞĚ͕ǁŝƚŚŝŶĞǀĞŶƐŵĂůůĞƌƵƉƐĂŶĚĚŽǁŶƐ͘ĐƚƵĂůůLJƚŚĞƌĞĂƌĞƐĞǀĞƌĂů
ǀĂƌŝĂƚŝŽŶƐŽĨĞĂƌͬďƵůůdŝŵĞƉĂƚƚĞƌŶƐŝŶƚŚĞůŽŶŐƚĞƌŵdŝŵĞWĂƚƚĞƌŶ
;ŝŶĚŝĐĂƚŽƌƐͿ͕ǁŚŝĐŚĂƌĞĚŽĐƵŵĞŶƚĞĚƚŽƌĞƉĞĂƚĨƌŽŵƚŚĞLJĞĂƌϭϲϬϬ͘
ƐĚĞƐĐƌŝďĞĚŝŶŽƚŚĞƌĂƌƚŝĐůĞƐ͕ŽƵƌƐŽĨƚǁĂƌĞĐĂŶĂƵƚŽŵĂƚŝĐĂůůLJĚĞƚĞƌŵŝŶĞ
ĐŽƌƌĞůĂƚŝŽŶǁŝƚŚŽƚŚĞƌdŝŵĞƉĂƚƚĞƌŶƐŝŶŚŝƐƚŽƌLJƵƐŝŶŐĂŶĞdžƚĞŶĚĞĚ
ĂƵƚŽŵĂƚŝĐƐĞĂƌĐŚĨĞĂƚƵƌĞ͘
dŝŵĞŝƐ
^d/Ez
ǁĞŚĂǀĞĐĂůĐƵůĂƚĞĚƚŚĞĞŶĞƌŐLJ
ŽĨƚŚĞ&hdhZ
͕ǁŚŝĐŚƚŝŵĞ
ƉĂƚƚĞƌŶƐǁĞĐŽŵƉĂƌĞƚŽƚŝŵĞ
ƉĂƚƚĞƌŶƐŝŶŚŝƐƚŽƌLJ͘/Ĩŝƚ
ŵĂƚĐŚĞƐĞǀĞŶƚƐŝŶ,ŝƐƚŽƌLJǁŝůů
ƌĞƉĞĂƚEKtdŚĞďŝŐƉĂƚƚĞƌŶŝƐ
ŝƐƚŚĞ'
K&Z
sK>hd/KE͊
dŚĞƐŵĂůůĞƌƚŝŵĞƉĂƚƚĞƌŶ͕Ă
ƐŵĂůůĞƌďĞĂƌŵĂƌŬĞƚƉĂƚƚĞƌŶ͘
ĞůŽǁLJŽƵƐĞĞƚŚĞ>KE'd
ZDĞ>ŽƌĞĂŶdŝŵĞWĂƚƚĞƌŶĨŽƌϮϬϮϮͲϮϬϮϰ͕ĂƐŵĂůůĞƌƚŝŵĞƉĂƚƚĞƌŶǁŝƚŚŝŶƚŚĞůĂƌŐĞƌ
'
ŽĨZ
sK>hd/KEƉĂƚƚĞƌŶ͘
^ĐƌĞĞŶƐŚŽƚŽĨƚŚĞ>ŽŶŐƚĞƌŵdŝŵĞŝŶĚŝĐĂƚŽƌƐ͕ŐƌĞĞŶůŝŶĞĂŶĚƌĞĚůŝŶĞƵŶƚŝůϮϬϮϰ͕ĂǀĞƌLJŝŵƉŽƌƚĂŶƚƚŝŵĞƉĞƌŝŽĚ͘
dŝŵĞŝŶĚŝĐĂƚŽƌƐĂƌĞ>
/E'ĂŶĚƐŚŽǁƵŶĐŚĂƌƚĞĚƚĞƌƌŝƚŽƌLJ͘
/ĨLJŽƵǁŽƵůĚůŝŬĞƚŽŬŶŽǁƚŚĞŝŶƚĞƌƉƌĞƚĂƚŝŽŶŽĨƚŚĞdŝŵĞŝŶĚŝĐĂƚŽƌƐĂŶĚǁŚĂƚƚŚĞLJƚĞůůĂďŽƵƚƚŚĞĨƵƚƵƌĞ͕ũƵƐƚŽƌĚĞƌ
ŚƚƚƉƐ͗ͬͬĂƋƵŝůĂĞƐŝŐŶĂů͘ĐŽŵͬƉƌŽĚƵĐƚͬďƵůůͲŽƌͲďĞĂƌͲŵĂƌŬĞƚͲŶŽǁͲŝŶͲƉůĂLJͬĂŶĚƵƐĞĐŽƵƉŽŶĨŽƌĚŝƐĐŽƵŶƚ
Ϯ͘ ŬŶŽǁŝŶŐǁŚĞŶĂďƵůůŵĂƌŬĞƚ;ŽƌďĞĂƌŵĂƌŬĞƚͿŝƐĂƌŽƵŶĚƚŚĞĐŽƌŶĞƌ͘KďǀŝŽƵƐůLJŝƚǁŝůůŚĞůƉLJŽƵĂĨƚĞƌĂďĞĂƌ
ŵĂƌŬĞƚƐŚŽŽŬƚŚĞŵĂƌŬĞƚƐ͘
dŚĞůĂƐƚďŝŐŐĞƌďƵůůŵĂƌŬĞƚĞŶĚĞĚŝŶϮϬϮϮ͕ĨƌŽŵƚŚĞďŽƚƚŽŵŽĨϮϬϮϬ͘KŶůLJƚŚĞŚĂƉƉLJĨĞǁĨŽƌĞƐĂǁƚŚŝƐŝŶ
ǀŝĞǁŽĨƚŚĞĚŝĨĨŝĐƵůƚƚŝŵĞƐĂŶĚĞĐŽŶŽŵLJƐŝŶĐĞϮϬϮϬ͘Ğ>ŽƌĞĂŶĚŝĚŬŶŽǁŝƚ͕ŐŝǀŝŶŐLJŽƵƚŚĞĐŽŶĨŝĚĞŶĐĞƚŽĂĐƚ
ĂĐĐŽƌĚŝŶŐůLJ͕ĞǀĞŶũƵƐƚĂůŝƚƚůĞƉĞƌĐĞŶƚĂŐĞŝƐĂƐƚƌŽŶŐƉĞƌĨŽƌŵĂŶĐĞ͘ƉĂƌƚĨƌŽŵƚŚĞŵĂƌŬĞƚƌĞƚƵƌŶ͕ŝƚŚĂĚƐŽŵĞ
ƉŽƐŝƚŝǀĞĞĨĨĞĐƚƐŝŶƐŽĐŝĞƚLJƚŽŽ͘
tŝůůƚŚĞŶĞdžƚϮLJĞĂƌďĞĂďƵůůŽƌĂďĞĂƌ͍zŽƵƌĞĂůůLJŶĞĞĚƚŽŬŶŽǁƚŚĞƉƌŽďĂďŝůŝƚŝĞƐ͘
ĞĂƌŵĂƌŬĞƚƐŽĨĨĞƌƉŽƌƚĨŽůŝŽŵĂŶĂŐĞƌƐƚŚĞďĞƐƚĐŚĂŶĐĞƚŽŽƵƚƉĞƌĨŽƌŵŵĂƌŬĞƚƐďLJĐŚĂŶŐŝŶŐĂůůŽĐĂƚŝŽŶ͕
ƉƌŽǀŝĚĞĚLJŽƵŬŶŽǁt,
EƚŚĞLJĂƌĞŵŽƐƚůŝŬĞůLJƚŽŚĂƉƉĞŶ͘
WWW.TRADERSWORLD.COM July, August. September 2023
110
ϯ͘ ZĞĚƵĐŝŶŐĞdžƉŽƐƵƌĞĂŶĚŵĂŶĂŐŝŶŐƌŝƐŬǁŚĞŶŵĂƌŬĞƚƐĞŝƚŚĞƌŐŽƐŝĚĞǁĂLJƐŽƌƐŚĂƌƉůLJĚŽǁŶ͕ǁŚĞŶƐŽĐŝĞƚLJĂŶĚ
ĞĐŽŶŽŵLJǁŝůůĞdžƉĞƌŝĞŶĐŝŶŐĐŚĂůůĞŶŐŝŶŐƚŝŵĞƐ͕ůŝŬĞŶŽǁ͕ŝŶƚŚĞĂŐĞŽĨƌĞǀŽůƵƚŝŽŶ͘dŚĞĂŐĞŽĨƌĞǀŽůƵƚŝŽŶŝƐĂŶ
ĞdžƚƌĞŵĞƉĞƌŝŽĚŝŶƚŝŵĞĨŽƌƐŽĐŝĞƚLJ͕ĞĐŽŶŽŵLJ͕ƉŽůŝƚŝĐƐ͕ĨƌĞĞĚŽŵĂŶĚƉŽǁĞƌ͘^ŽƉƌĞƉĂƌĞĨŽƌŝƚ͘
zŽƵĐŽƵůĚĐŽŶƐŝĚĞƌƚŽŽƌĚĞƌƚŚĞƵƌƌĞŶƚ>KE'd
ZDd/D
Wdd
ZE͕ƵůůŽƌͬĂŶĚďĞĂƌŽƌĂůůĨŽƌƚŚĞŶĞdžƚĐŽƵƉůĞŽĨ
LJĞĂƌƐ͘;ĐŽƵƉŽŶǁŝůůĂƉƉůLJͿ
ŚƚƚƉƐ͗ͬͬĂƋƵŝůĂĞƐŝŐŶĂů͘ĐŽŵͬƉƌŽĚƵĐƚͬŶĞdžƚͲďĞĂƌͲŵĂƌŬĞƚͲĚĞůŽƌĞĂŶͬE
yd
ZDZ<
d
ŚƚƚƉƐ͗ͬͬĂƋƵŝůĂĞƐŝŐŶĂů͘ĐŽŵͬƉƌŽĚƵĐƚͬŶĞdžƚͲďƵůůͲŵĂƌŬĞƚͲĚĞůŽƌĞĂŶͬE
ydh>>DZ<
d
ŚƚƚƉƐ͗ͬͬĂƋƵŝůĂĞƐŝŐŶĂů͘ĐŽŵͬƉƌŽĚƵĐƚͬĂůůͲŶĞdžƚͲϭϬͲďƵůůͲďĞĂƌͲŵĂƌŬĞƚƐͲĚĞůŽƌĞĂŶͬE
ydϭϬh>>KZ
ZDZ<
d^
Prediction
dŽĐŽŶĐůƵĚĞǁĞǁŝůůŐŝǀĞLJŽƵƉƌĞĚŝĐƚŝŽŶƐĨŽƌƚŚĞĨƵƚƵƌĞ;ůŽŽŬĨŽƌdƌĂĚĞƌƐǁŽƌůĚƚŝƚůĞŽŶzŽƵƚƵďĞͿ͕ǁŚĞŶdƌĂĚĞƌƐǁŽƌůĚ
ŝƐƐƵĞηϴϵǁŝůůŚĂǀĞďĞĞŶƉƵďůŝƐŚĞĚ͘
ƐƉƌĞǀŝŽƵƐůLJƐĂŝĚ͕ǁĞĐĂŶŐŝǀĞLJŽƵƚŚĞĚŝƌĞĐƚŝŽŶŽĨƚŚĞƚƌĞŶĚ͕ƵƉŽƌĚŽǁŶĂŶĚǁŚĞŶ;ŽŶĚĂƚĞͲdŝŵĞͿĂZĞǀĞƌƐĂůͲƚŽƉŽƌ
ďŽƚƚŽŵͲŝƐŵŽƐƚůŝŬĞůLJƚŽŽĐĐƵƌ͘'ŽǁŝƚŚƚŚĞĨůŽǁƵƐŝŶŐŽƵƌd/D
ŝŶĚŝĐĂƚŽƌƐĂŶĚLJŽƵǁŝůůŵĂŬĞĂƉƌŽĨŝƚ͘
:ƵƐƚƐŽŵĞĞdžĂŵƉůĞƐ͕ĨŝƌƐƚƐĐƌĞĞŶƐŚŽƚŝƐďĞŐŝŶŶŝŶŐũƵůLJ͕ĞdžƉĞĐƚĞĚďŽƚƚŽŵŽŶϲƚŚ͘dŚĞŶƵŐƵƐƚϭϴƚŚĂƚŽƉ͕ĂƐǁĞůůĂƐ
ƵŐƵƐƚϮϴƚŚ͘^ĞĞzŽƵƚƵďĞĨŽƌŵŽƌĞŽƌĞǀĞŶďĞƚƚĞƌ͕ŽƌĚĞƌKt,/d^ŶŽǁĨŽƌϲŵŽŶƚŚƐƚŽŚĂǀĞŝƚĂůů
ŚƚƚƉƐ͗ͬͬĂƋƵŝůĂĞƐŝŐŶĂů͘ĐŽŵͬƉƌŽĚƵĐƚͬĚŽǁͲŚŝƚƐͲϲͲŵŽŶƚŚƐͬ
ŵĂŝů͗ŝŶĨŽΛĂƋƵŝůĂĞƐŝŐŶĂů͘ĐŽŵũƵƐƚĂƐŬLJŽƵƌƋƵĞƐƚŝŽŶƐŽƌũŽŝŶŽƵƌŵĂŝůŝŶŐůŝƐƚ͘KƌĚĞƌŝŶŐŝƐƐƵĞƐ͍WůĞĂƐĞůĞƚƵƐŬŶŽǁ
WWW.TRADERSWORLD.COM July, August. September 2023
111
WWW.TRADERSWORLD.COM July, August. September 2023
112
Amazon Kindle Books
ASSET REVESTING: HOW TO EXCLUSIVELY HOLD ASSETS RISING
IN VALUE, PROFIT DURING BEAR MARKETS, AND CONTINUE
BUILDING WEALTH IN RETIREMENT Hardcover $19.99
ASSET REVESTING is a ground-breaking book that reveals a revolutionary
LQYHVWPHQWVW\OHWKHRXWGDWHG¿QDQFLDOLQGXVWU\GRHVQRWZDQW\RXWRGLVFRYHU
7KHDXWKRUDVHDVRQHG¿QDQFLDOH[SHUWVKRZVKRZXVLQJDQDVVHWKLHUDUFK\
DQGGHSOR\LQJERWKULVNDQGSRVLWLRQPDQDJHPHQWUHGH¿QHVKRZWREXLOG
ZHDOWK$VVHW5HYHVWLQJVROYHVVHYHUDO¿QDQFLDOLQGXVWU\SUREOHPVPRVWSHRSOH
don’t even know they have.
7KLVERRNVKRZVDGLϑHUHQWZD\WRLQYHVW,WVKHGVQHZOLJKWRQWKHLQYHVWLQJZRUOG VKLGGHQ
realities, risks, and unknown opportunities. It is a must-read for all investors, especially those
XVLQJDGLYHUVL¿HGEX\DQGKROGSRUWIROLR7KHFRQWHQWZLOODOWHU\RXUWKLQNLQJDQGLPSURYH\RXU
outlook on investing and life.
,)<28 5($1,19(6725<28352%$%/<+$9(7+5((&+$//(1*(6
<RXZDQWKLJKHUUHWXUQVZLWKOHVVVWUHVVDQGORZHUULVN
<RXZDQWWRUHDFK\RXU¿QDQFLDOJRDOVIDVWHU
<RXDUHZRUULHG\RXZLOOUXQRXWRIPRQH\LQUHWLUHPHQW
ASSET REVESTING CAN SOLVE ALL THREE OF THE CHALLENGES ABOVE:
,QFUHDVHUHWXUQVE\KROGLQJRQO\DVVHWVULVLQJ
$FKLHYH\RXU¿QDQFLDOJRDOVLQ\HDUVYVGHFDGHV
%HFRPHZHDOWKLHUYVSRRUHULQUHWLUHPHQW
7KLVRYHUYLHZRI$VVHW5HYHVWLQJLVWKH¿UVWVWHSWRZDUGWRWDO¿QDQFLDOIUHHGRP,W VLPSRUWDQWWR
QRWHWKDW\RXZRQ W¿QGWHFKQLFDODQDO\VLVRUGHWDLOHGVWHSE\VWHSVWUDWHJLHVKHUH,QVWHDG\RX
will learn what needs to be changed and how to harness this investing style, either on your own
RUZLWKWKHDXWKRU VKHOS7KLVVWUDWHJ\LVPRVWHϒFLHQWZLWKLQYHVWPHQWDFFRXQWVLQWKH.
0UDQJH
7KHERRN VDSSURDFKWHQGVWRLUNPRVW¿QDQFLDOLQGXVWU\SURIHVVLRQDOVDQGLVQRWIRUVKRUWWHUP
aggressive traders. These folks, though curious to learn, will dislike any method that breaks free
IURPWKH QRUP DQGWKUHDWHQVWKHLUIRXQGDWLRQ7KH\PD\HYHQDWWHPSWWRGLVFUHGLWWKHERRN V
FRQWHQWWRFDOPWKHZDWHUV%XWGRQ WEHIRROHGEHFDXVHLQGRLQJVRWKHLUSXVKEDFNVXSSRUWV
WKHIDFWWKDW$VVHW5HYHVWLQJKDVPHULWDQGFDQEHJLQWKHSURFHVVRIFKDQJHWKDWWKH¿QDQFLDO
industry (and potentially your savings) desperately needs.
WWW.TRADERSWORLD.COM July, August. September 2023
113
Gann Masters Course by Larry Jacobs $14.95
https://amzn.to/3yrF5fF
As you know, W.D. Gann was a legendary trader. Some say he amassed a
fortune in the the markets. He wrote several important books on trading as well
as a commodity trading course and a stock market trading course. He charged
WRIRUWKHWUDGLQJFRXUVHVZKLFKLQFOXGHGPRQWKVRISHUVRQDO
instruction by phone. The Gann Masters Trading Course to help traders.
Patterns and Ellipses by Larry Jacobs $9.99
https://amzn.to/3yqAWZ9
This book concerns itself with a highly technical subject, the subject of technical
DQDO\VLVRIWKH¿QDQFLDOPDUNHW7KLVERRNVSHFL¿FDOO\GHDOVZLWKHOOLSVHVDQG
pattern formations used for trading the markets. It also covers many other
WHFKQLFDODQDO\VLVWRROVWKDWFDQEHXVHGHϑHFWLYHO\E\WKHWUDGHU
Gann’s Master Charts Unveiled by Larry Jacobs $14.95
https://amzn.to/3uzOgJC
We know that Gann used the Pythagorean Square because he was found
carrying it with him into the trading pit all the time. This square was hidden in
the palm of his hand. How did he use this square? Why did he not discuss the
use of this square in his courses? There is only one page covering the Square of
Nine in all of his books and courses. Was this square his most valuable tool? These and all
the other squares Gann used will be discussed in detail in this book with many illustns and
examples to prove how they work.
Gann Trade Real Time by Larry Jacobs $14.99
https://amzn.to/3yNRPhT When you opened this book you took the one
step that will help you learn how to be successful at the most desirable, but
hardest profession in the world. That profession is real time trading. This book is
not going to give you an instant secret to day trading. It is going to give you the
basics so that you might start the path to understanding how the markets work
both short term and long term. You need to know and fully understand the markets and
develop successful trading strategies to become successful at this endeavor.
Finding Your Trading Method $3.99
https://amzn.to/3NU5HeL
Finding your trading method is the main problem you need to solve if you
ZDQWWREHFRPHDVXFFHVVIXOWUDGHU<RXPD\EHDVNLQJ\RXUVHOIFDQ,¿QG
P\RZQWUDGLQJPHWKRGWKDWZLOOUHÀHFWP\RZQSHUVRQDOLW\WRZDUGWUDGLQJ"
For example, do you have the patience to sit in front of a computer and trade
all day? Do you prefer to swing trade from 3-5 days or do you like to hold
SRVLWLRQVIRUZHHNVDQGHYHQPRQWKV"(YHU\WUDGHULVGLϑHUHQW<RXQHHGWR
¿QG\RXURZQWUDGLQJPHWKRG
WWW.TRADERSWORLD.COM July, August. September 2023
114
)LQGLQJRXW\RXUWUDGLQJPHWKRGLVH[WUHPHO\LPSRUWDQWWRSURGXFHDSUR¿WDEOHEHQFKPDUN
WKDWFDQEHUHSOLFDWHGLQ\RXUOLYHDFFRXQW3HUKDSVWKHEHVWZD\WR¿QGDVXFFHVVIXO
trading method is to listen to many expert traders to understand what they have done
to be successful. The best way to do that is to listen to the Traders World Online Expos
presentations. This book duplicates what these experts have said in their presentations,
ZKLFKH[SODLQVZKDWWKH\KDYHGRQHWR¿QGWKHLURZQWUDGLQJPHWKRG
,I\RXKDYHDWUDGLQJPHWKRGWKDWJLYHV\RXDSUHGLFWDEOHSUR¿WWKHQWKDWW\SHRIREMHFWLYLW\
contributes to your trading edge. The problem with most traders is that being inconsistent
ZLOOQHYHUDOORZWKHPWRKDYHDQHGJH$IWHU\RX¿QG\RXUWUDGLQJPHWKRGWKDW\RXIHHO
comfortable with, you must have the following:
An overall plan to:
1) Set your rule set and plan and then stick with it in all of your trading.
2) To give you a trading plan for every day.
The trade plan then should:
1) Have an exact entry price
2) Have a stop price
3) Have a way to add positions
7HOO\RXZKHUHWRWDNHSUR¿WV
+DYHDZD\WRSURWHFW\RXUSUR¿WV
By reviewing all the methods given in this book by the expert traders, it will give, you the
SUHOLPLQDU\VWHSVWKDW\RXQHHGWR¿QG\RXUIRRWLQJLQ¿QGLQJ\RXURZQWUDGLQJPHWKRG
Reading this book and by seeing the actual recorded presentations on the Traders World
Online Expo site can act as a reference tool for selecting your method of trading, investment
strategies and tactics.
,WWRRNPDQ\RIWKHVHH[SHUWWUDGHUVLQWKLVERRN±\HDUVWR¿QDOO\FRPHXSDQG¿QG
WKHDQVZHUVWR¿QGWKHLUWUDGLQJPHWKRGWRPDNHFRQVLVWHQWSUR¿W)LQGLQJ\RXUWUDGLQJ
method could be then much easier when you read this book and incorporate the techniques
WKDWEHVW¿W\RXUSHUVRQDOLW\DQGVW\OHIURPWKHVHWUDGHUV7KLVERRNZLOOHQDEOH\RXWRWKDW
fastest way to do that.
6RLI\RXZDQWKHOSWR¿QG\RXURZQWUDGLQJPHWKRGWREHVXFFHVVIXOLQWKHPDUNHWVWKHQ
buy and read this book.
WWW.TRADERSWORLD.COM July, August. September 2023
115
Learn the Secrets of Successful Trading $4.99
https://amzn.to/3ONIhsR
/HDUQVSHFL¿FWUDGLQJVWUDWHJLHVWRLPSURYH\RXUWUDGLQJOHDUQWUDGLQJLGHDV
DQGWDFWLFVWREHPRUHSUR¿WDEOHEHWWHURSWLPL]H\RXUWUDGLQJV\VWHP¿QG
WKHIDWDOÀDZVLQ\RXUWUDGLQJXQGHUVWDQGDQGXVH(OOLRWW:DYHWRVWUHQJWKHQ
\RXUWUDGLQJSRVLWLRQXVLQJFRUUHFWVL]LQJWRWUDGHPRUHSUR¿WDEOH
XQGHUVWDQG0HUFXU\F\FOHVLQWUDGLQJWKH6 3JHWFRQVLVWHQWO\SUR¿WDEOH
WUDGHVHWXSVUHGXFHULVNDQGLQFUHDVHSUR¿WVXVLQJYROXPHGHWHFWDQG
trade the hidden market cycles, short term trading by taking the money
and running, develop your mind for trading, overcoming Fear in Trading, trade with the
smart money following volume, understand and use the Ultimate Oscillator, use high power
trading with geometry, get better entries, understand the three legs to trading, use technical
analysis with NinjaTrader 7, use a breakout system with cycles for greater returns with less
ULVNXVH7XUQ6LJQDOIRUEHWWHUHQWULHVDQGH[LWVWUDGHZLWKDQHGJHXVHRSWLRQVSUR¿WDEO\
learn to trade online, map supply and demand on charts, quantify and execute portfolio
rotation for auto trading.
Written by Many Expert Traders
7KHERRNZDVZULWWHQE\DODUJHJURXSRIH[SHUWWUDGHUVZLWKKLJKTXDOL¿FDWLRQVPRVW
RIZKRWUDGHSURIHVVLRQDOO\DQGRURϑHUWUDGLQJVHUYLFHVDQGH[SHQVLYHFRXUVHVWRWKHLU
clients. Some of them charge thousands of dollars per day for personal trading! These
expert traders give generally 45-minute presentations covering the same topics given in
this book at the Traders World Online Expo #12. By combining their talents in this book,
WKH\LQWURGXFHDQHZGLPHQVLRQWR¿QGLQJDSUR¿WDEOHWUDGLQJHGJHLQWKHPDUNHW<RXFDQ
XVHLGHDVDQGWHFKQLTXHVRIWKLVJURXSRIH[SHUWVWROHYHUDJH\RXUDELOLW\WR¿QGDQHGJHWR
successfully trade. Using a group of experts in this manner to insure your trading success is
unprecedented.
<RX¶OOQHYHU¿QGDERRNOLNHWKLVDQ\ZKHUH7KLVXQLTXHWUDGLQJERRNZLOOKHOS\RXXQFRYHU
the underlying reasons for your lack of consistency in trading and will help you overcome
poor habits that cost you money in trading. It will help you to expose the myths of the
market one by one teaching you the right way to trade and to understand the realities of
risk and to be comfortable with trading with market. The book is priceless!
Parallels to the Traders World Online Expo 12
WWW.TRADERSWORLD.COM July, August. September 2023
116
Guide to Successful Online Trading - Secrets from the Pros
$9.65
https://amzn.to/3Pb4Uav
7KLV LV RQH RI WKH ¿QHVW WUDGLQJ ERRNV \RX¶OO HYHU VHH DERXW WUDGLQJ 7KH
reason is that it comes from a group of expert pro traders with multiple years
of experience.
7UDGLQJDV\RXNQRZLVH[WUHPHO\GLϒFXOW,WLVHVWLPDWHGWKDW
RIWUDGHUV
lose money in the markets. To help you overcome this statistic, the pro traders in this book
give you their ideas on trading with some of the best trading methods ever developed through
their long time experience. By reading about these trading methods and implementing them
LQWKHPDUNHWV\RXZLOOWKHQKDYHDFKDQFHWRWKHQMRLQWKHUDQNVRIWKHRIWKHVXFFHVVIXO
traders.
The traders in this book have through experience the right attitude and employ a combination
of technical analysis principles and strategies to be successful. You can develop these also.
Trading is one of the best ways to make money. Apply the trading methods in this book and
treat it as a business. The purpose of this book is to help you be successful in trading.
From this book you will get all the strategies, Indicators and trading methods that you need
WRPDNHELJSUR¿WVLQWKHPDUNHWV
This book gives you:
1) Audio/Visual Links to presentations from pro traders
2) The best strategies that the professional traders are using now
7KHEURDGSHUVSHFWLYH\RXQHHGLQWRGD\¶VGLϒFXOWPDUNHWV
7KH([DFWWRROVWKDW\RXQHHGWRPDNHSUR¿WDEOHWUDGLQJGHFLVLRQV
7KH¿QHVWWUDGLQJHGXFDWLRQ
WWW.TRADERSWORLD.COM July, August. September 2023
117
Takumaru Forex Trading $4.99
https://amzn.to/3anhe8I
This book contains an interview in Chapter 1 with Takumaru Sakakibara,
ZKR¿QLVKHGLQQGSODFHLQWKH:RUOG&XS&KDPSLRQVKLSRI)RUH[
7UDGLQJ ZLWK D QHW SUR¿W ³7DNXPDUX¶V ODUJHVW GUDZGRZQ
(cumulative peak-to-valley percentage decline in month-end net
HTXLW\ GXULQJ WKH OLIH RI WKH DFFRXQW ZDV IURP WR
10-31-15.”
³3OHDVHUHPHPEHUWKDWSDVWSHUIRUPDQFHLVQRWQHFHVVDULO\LQGLFDWLYH
of future results.”
³3OHDVHUHPHPEHUWKDW)RUH[WUDGLQJLQYROYHVVXEVWDQWLDOULVNRIORVVDQGSDVWSHUIRUPDQFH
is not necessarily indicative of future results.”
In the rest of the book I will explain to you some of the trading ideas Takumaru said he used
in the championship. You can then actually see and understand how his ideas work.
,DPQRWJRLQJWRWHOO\RXH[DFWO\KRZ7DNXPDUXXVHGWKHLGHDVWRPDNHKLVUHWXUQRI
RQDLQYHVWPHQW7KDWLQIRUPDWLRQLVQRWSXEOLFDQGEHORQJVRQO\WR7DNXPDUX
I will tell you which indicators he used and help you understand how these indicators work.
WWW.TRADERSWORLD.COM July, August. September 2023
118