/


Текст
General Discussion
General Discussion of Phase Diagrams
I. GLOSSARY
(1) Alkemade (Van Rijn van Alkemade) Theo-
rem: The direction of falling temperature on the
boundary curve of two intersecting primary phase areas
is always away from the Alkemade line (see (2)). If
the Alkemade line intersects the boundary curve, the
point of intersection represents a temperature maximum
on the boundary curve. If the Alkemade line does not
intersect the boundary curve, then the maximum on the
boundary curve is represented by that end which if
prolonged would intersect the Alkemade line.
(2) Alkemade Line: In a ternary phase dia-
gram a straight line connecting the composition points
of two primary phases whose areas are adjacent and the
intersection of which forms a boundary curve.
(3) Boundary Line (Curve): The intersection
of adjoining liquidus surfaces in a ternary phase dia-
gram. The area enclosed by a series of boundary
lines is termed a primary phase area.
(4) Components (of a System): The smallest
number of independently variable chemical constituents
necessary and sufficient to express the composition of
each phase present in any state of equilibrium.
Zero and negative quantities of the components are
permissible in expressing the composition of a phase.
(5) Composition (or Compatibility) Tetrahedron:
In the phase diagram of a condensed quaternary sys-
tem, the four triangular planes connecting the composi-
tions of four solid phases which can coexist in equi-
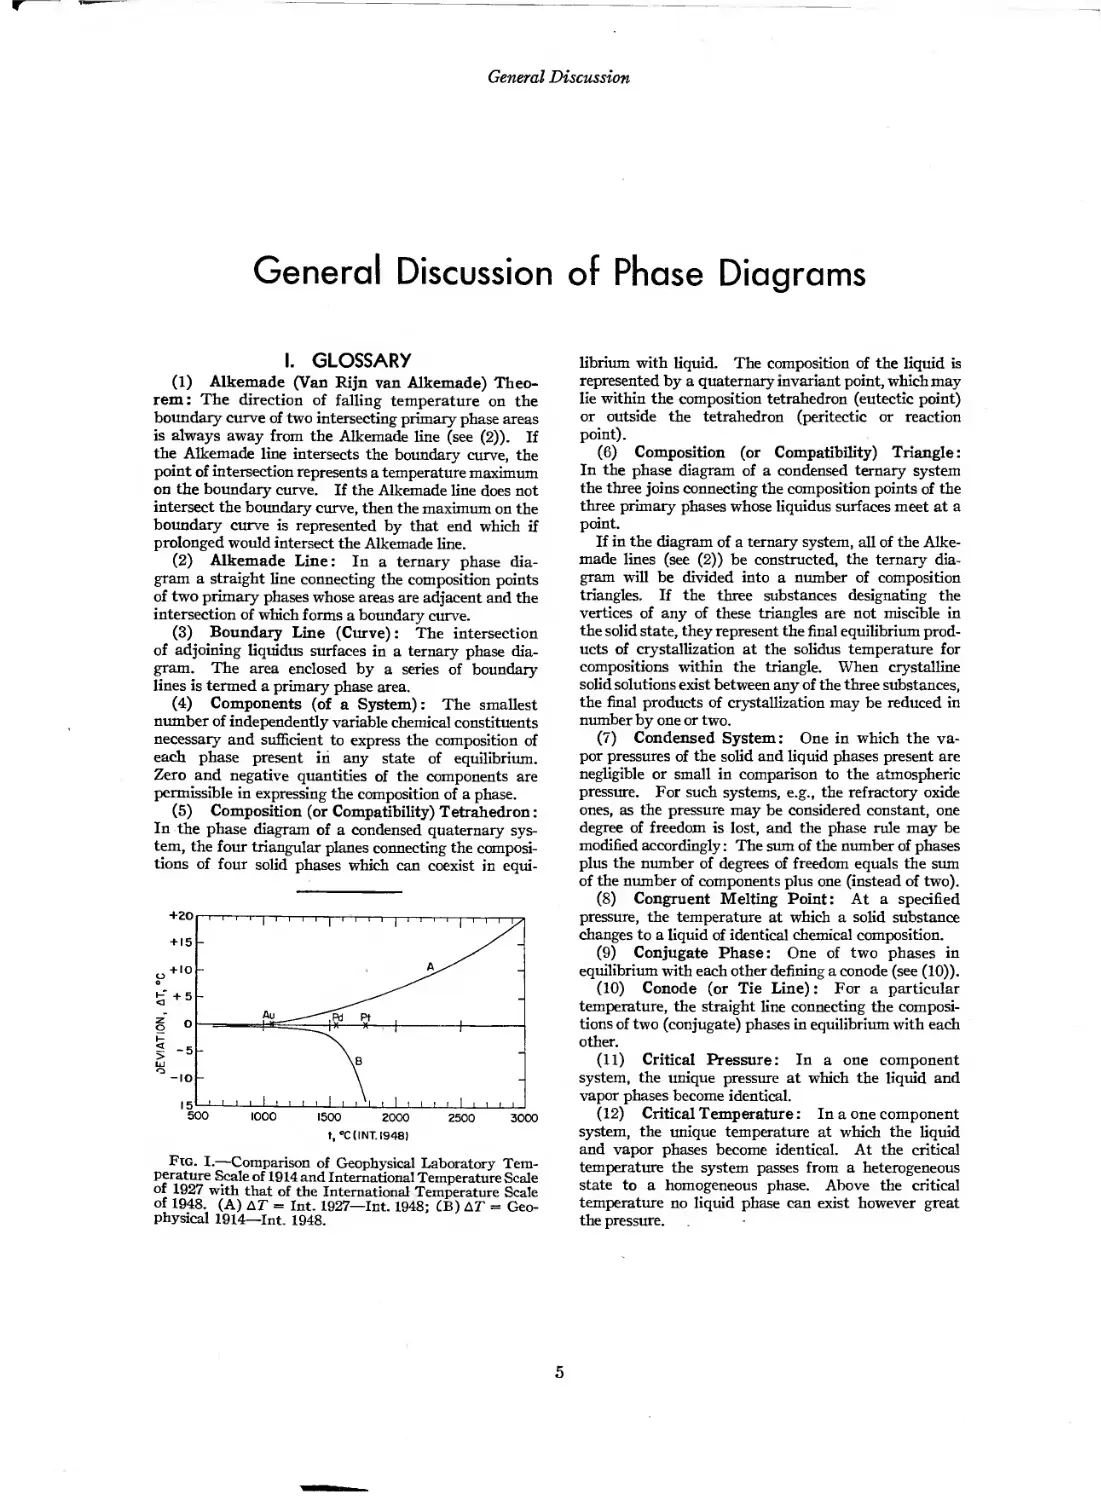
₽№• I.—Comparison of Geophysical Laboratory Tem-
perature Scale of 1914 and International Temperature Scale
of 1927 with that of the International Temperature Scale
of 1948. (А) AT = Int. 1927—Int. 1948; CB) AT = Geo-
physical 1914—Int. 1948.
librium with liquid. The composition of the liquid is
represented by a quaternary invariant point, which may
lie within the composition tetrahedron (eutectic point)
or outside the tetrahedron (peritectic or reaction
point).
(6) Composition (or Compatibility) Triangle:
In the phase diagram of a condensed ternary system
the three joins connecting the composition points of the
three primary phases whose liquidus surfaces meet at a
point.
If in the diagram of a ternary system, all of the Alke-
made lines (see (2)) be constructed, the ternary dia-
gram will be divided into a number of composition
triangles. If the three substances designating the
vertices of any of these triangles are not miscible in
the solid state, they represent the final equilibrium prod-
ucts of crystallization at the solidus temperature for
compositions within the triangle. When crystalline
solid solutions exist between any of the three substances,
the final products of crystallization may be reduced in
number by one or two.
(7) Condensed System: One in which the va-
por pressures of the solid and liquid phases present are
negligible or small in comparison to the atmospheric
pressure. For such systems, e.g., the refractory oxide
ones, as the pressure may be considered constant, one
degree of freedom is lost, and the phase rule may be
modified accordingly: The sum of the number of phases
plus the number of degrees of freedom equals the sum
of the number of components plus one (instead of two).
(8) Congruent Melting Point: At a specified
pressure, the temperature at which a solid substance
changes to a liquid of identical chemical composition.
(9) Conjugate Phase: One of two phases in
equilibrium with each other defining a conode (see (10)).
(10) Conode (or Tie Line): For a particular
temperature, the straight line connecting the composi-
tions of two (conjugate) phases in equilibrium with each
other.
(11) Critical Pressure: In a one component
system, the unique pressure at which the liquid and
vapor phases become identical.
(12) Critical Temperature: In a one component
system, the unique temperature at which the liquid
and vapor phases become identical. At the critical
temperature the system passes from a heterogeneous
state to a homogeneous phase. Above the critical
temperature no liquid phase can exist however great
the pressure.
5
Experimental Methods
at ordinary temperatures for determination of their
physical characteristics.
Another dynamic method, especially useful in study-
ing oxidation and reduction reactions, volatility effects,
or hydration and carbonation phenomena, depends on
sensitive weight recording measurements during heat-
ing and cooling of a specimen. Equipment has been
designed which simultaneously records weight changes
and differential heat effects as a function of tempera-
ture.23
Definitive phase equilibria studies in oxide systems
involving changes in oxidation state require careful
control of partial pressures of the gas phase, in particular
oxygen. When considering partial pressures, the con-
densed statement of the phase rule no longer applies,
and the pressure variable introduces another degree of
freedom in the system. Considerable progress has
been made in the development of techniques for con-
trolling partial pressures at high temperature and in
the experimental determination and representation of
phase diagrams, as for example, the iron-containing
systems.24
In studies involving non-quenchable transformations
it is necessary to identify phases at temperature. Two
methods which have been successfully employed for
this purpose are high-temperature X-ray diffractom-
etry25 and high-temperature microscopy.26 Additional
advantages of these methods, when applicable, are that
rapid surveys, with small amounts of sample, can be
made over a wide temperature range.
With increasing emphasis on refractory systems,
methods are receiving attention for achieving, control-
ling, and measuring temperatures above 1700°C, about
the maximum obtainable with the conventional
platinum-rhodium (80%: 20%) quench furnace. The
strip furnace27 provides an easy means of attaining
high temperatures. It usually consists of a narrow,
T-shaped, short strip of refractory metal (e.g., Pt-
40% Rh, or Ir), which acts both as a sample holder and
heating element. For phase studies up to 2400°C., an
induction furnace,28 having an iridium-crucible sus-
ceptor, also has been used successfully. Both methods
have their limitations, and it cannot be emphasized too
strongly that the accuracy of temperature measure-
ments with an optical pyrometer depends in the final
analysis on the’ degree of realization of blackbody condi-
tions.29 .
The diagrams presented refer only to systems which
are in equilibrium for the temperatures specified.
They give no information as to the velocity of reactions,
but they do define the relative amounts of crystalline
and liquid phases present at any temperature and com-
23 See F. A. Mauer under “Methods and Techniques,
(A) General” of Selected Bibliography.
24 See A. Muan under “Theory” in Selected Bibliography.
26 Ernest M. Levin and Floyd A. Mauer, “Improved
Sample Holder for X-Ray Diffractometer Furnace,” J.
Am. Ceram. Soc., 46 [1], 59-60(1963). This paper cites
other references on the subejct.
26 See F. Ordway, also J. H. Welch, under “Methods and
Techniques, (A) General” of Selected Bibliography.
27 H. S. Roberts and G. W. Morey, "Micro Furnace for
Temperatures above 1000°C,” Rev. Sci. Inst., 1, 576-579
(1930).
position provided the time has been sufficient for equi-
librium to be attained. Most ceramic and related
processes are incomplete chemical reactions and the re-
sults obtained are dependent upon time as well as tem-
perature. In applying equilibrium diagrams to manu-
facturing processes, consideration must be given to this
difference between the ideal and the practical condi-
tions.
For example, the composition of a porcelain body com-
posed of X% of flint, F% of clay (containing alumina,
silica, and water only) and Z% of potash feldspar can
be represented in the system KjO-AljOj-SiOs (Fig.
407) if the batch materials are pure and the body had
been fired to a sufficiently high temperature to elimi-
nate water. The composition of the porcelain in
terms of the components is as follows:
SiO2 = X + 0.541 Y + 0.6472Z
A12O, = 0.459 Y + 0.184Z
K2O = 0.169Z
It is most improbable, however, that the phases as
determined from the equilibrium diagram would be
equivalent, quantitatively or qualitatively, to the con-
stituents observed microscopically in the commercially
manufactured porcelain of this composition. The high
viscosity of the melted feldspar, the low rate of solution
of the quartz, and the slow diffusion of the partially
mixed and partially melted batch materials would
hinder the attainment of equilibrium and of homoge-
neity so that the constituents would not only differ from
the equilibrium phases but the composition (in terms of
constituents) would vary widely from place to place in
the body.
In the application of equilibrium diagrams to actual
processes care must be taken that the actual and ideal
are comparable. The presence of an impurity even in
small amounts introduces an additional component
which in many instances alters the solubility and melt-
ing relations so profoundly that no adequate inter-
pretation on the basis of the simpler diagram is possible.
Although the phase diagram gives no information as
to rates of reaction, it is often possible to infer from such
diagrams what the products of reaction may be under
certain conditions of disequilibrium and arrested reac-
tion. The calculations of Lea and Parker30 and of
Dahl31 on the phases existing in the system, CaO-
AljOs-FejOj-SiC^, under certain conditions of arrested
reaction have enabled the cement chemist to estimate
phases present in cement clinkers under plant condi-
tions of partial disequilibrium.
28(a) S. J. Schneider, “Phase Equilibria in Systems In-
volving the Rare Earth Oxides. Part III. The Eu2Os-
Iii2Оз System,” J. Research Nafl. Bur. Standards, 65A [5],
429-434 (1961).
, (b) S. J. Schneider and J. L. Waring, “Phase Equilib-
rium Relations in the Sc2O3-Ga2O3 System,” J. Research
Natl. Bur. Standards, 67A, [1], 19-25(1962).
29 Samuel J. Schneider, "Compilation of the Melting
Points of the Metal Oxides,” National Bureau of Standards
Monograph 68, Oct. 10, 1963. 31 pp.
30 See section on “Interpretation" in Selected Bibliog-
raphy, Part V.
31 See section on “Mathematical Treatment” in Se-
lected Bibliography, Part V.
31
Definitions
(13) Degrees of Freedom (or Variance): “The
number of intensive variables which can be altered in-
dependently and arbitrarily without bringing about the
disappearance of a phase or the formation of a new one
is called the number of degrees of freedom of a system.”4 *
Intensive variables are those which are independent of
mass, such as pressure, temperature, and composition.
The number of degrees of freedom of a system may
also be defined as the “number of variable factors,
temperature, pressure, and concentration of the com-
ponents, which must be arbitrarily fixed in order that
the condition of the system may be perfectly defined.”6
A system is termed invariant, mono-variant, bi-
variant, tri-variant, and so on, according to whether it
possesses, respectively, 0, 1, 2, 3, etc., degrees of free-
dom.
(14) Devitrification: The formation of crystalline
material from glass.
(15) Enantiotropic Forms: Polymorphic forms
(see (43)) which possess an inversion point at which
they are in reversible equilibrium, that is, they are
interconvertible; for example, a- and j3-2CaO-SiO2
and a- and j3-quartz. In such cases the vapor-pres-
sure curves intersect below the melting point of the
highest temperature polymorphic form.
(16) Equilibrium: From the theoretical, thermo-
dynamic standpoint, the conditions for equilibrium
can be exactly and precisely defined; because for any
reversible process, no useful energy passes from or into
the system.
From the practical, experimental standpoint, how-
ever, the actual attainment of an equilibrium state with-
in a system may be very difficult to assess. Three
criteria have been used variously either singly or to-
gether: (1) The time criterion, based on the constancy
of phase properties with the passage of time; (2) the
approach from two directions criterion, yielding under
the same conditions phases of identical properties, e.g.,
from undersaturation and supersaturation, or from rais-
ing and lowering the temperature to the same value;
and (3) the attainment by different procedures criter-
ion, producing phases having the same properties when
the same conditions, with respect to the variants, are
reached.
None of these criteria are entirely adequate for ex-
cluding metastable relationships. In silicate systems,
in particular, metastable equilibrium is common and
may persist for long periods of time and at high tem-
peratures. In the final analysis, interpretation and
judgment by the investigator are of prime importance.
(17) Eutectic: A eutectic represents an in-
variant (unique temperature, pressure, composition)
point for a system at which the phase reaction on the
addition or removal of heat results in an increase or
decrease, respectively, of the proportion of liquid to
4 F. H. MacDougall, “Thermodynamics and Chem-
istry,” John Wiley and Sons, New York, 1939.
6 See Alexander Findlay, A. N. Campbell, and N. O.
Smith, under “Theory” in “Selected Bibliography,” Part
V.
solid phases, without change of temperature. At a
eutectic temperature the composition of the liquid phase
in equilibrium with the solid phases can always be ex-
pressed in terms of positive quantities of the solid
phases.
The eutectic composition is that combination of com-
ponents in a simple system having the lowest melting
temperature of any ratio of the components and is
located at the intersection of the two solubility curves
in a binary system and of the three solubility surfaces
in a ternary system.
(18) Eutectoid: An invariant point (see (24))
composed solely of crystalline phases, at which the
phase reaction on change of heat content at constant
temperature results in a change in proportions of the
solid phases exactly analogous to that at a eutectic
point (see (17)), in which one of the phases is liquid.
(19) Glass: In ceramic phase equilibria studies
glass refers to supercooled liquid.
(20) Heterogeneous Equilibrium: A system is
heterogeneous and is in heterogeneous equilibrium when
it consists of two or more homogeneous portions
(phases) in equilibrium with each other. In the usual
consideration of the phase rule, changes in equilibrium
due to electrical, magnetic, capillary, and gravitational
forces are not considered; but only those changes due
to temperature, pressure, and concentration.
(21) Homogeneous Equilibrium: A system is
homogeneous and is in homogeneous equilibrium when
it consists of one phase and all processes or reactions
occurring within it are in reversible equilibrium. A
homogeneous phase need not consist of one atomic or
molecular species, e.g., in the single phase system so-
dium chloride solution, Na+, Cl-, H3O4, OH", H2O,
and associated molecules may all be present but the
reactions involving them are at equilibrium.
(22) Incongruent Melting Point: At a speci-
fied pressure the temperature at which one solid phase
transforms into another solid phase plus a liquid phase
both of different chemical compositions than the orig-
inal substance.
(23) Indifferent Point: In a two or more com-
ponent system the special conditions where two phases
become identical in composition and the system loses
one degree of freedom. Typical cases include the maxi-
mum or minimum in a solid solution series and the melt-
ing point of a congruently melting compound.
(24) Invariant Point: The particular condi-
tions within a system, in terms of pressure, temperature,
and composition, for which the system possesses no
degrees of freedom (see (13)) constitute the invariant
points.
Stated differently, at an invariant point, no inde-
pendent changes in the state of the system can be made.
(25) Inversion Point: The temperature at
which one polymorphic form of a substance (see (43))
changes into another under invariant conditions.
(26) Isobar: The locus of all points of constant
pressure.
(27) Isofract: For compositions within a ter-
nary system the locus of all glasses of constant index of
refraction.
6
Definitions
(28) Isopleth: A line in a phase diagram of
constant composition.
(29) Isoplethal Study: The method of con-
sidering the changes occurring in a system in which the
composition variable is held constant and the tempera-
ture varied.
(30) Isotherm: In a ternary system the locus
of all points on the liquidus of constant temperature.
(31) Isothermal Study: The method of con-
sidering the changes occurring in a system in which the
temperature variable is held constant and the composi-
tion (or pressure) is varied.
(32) Join: The region of a phase diagram rep-
resenting all mixtures that can be formed from a given
number of selected compositions. A join may be binary
(straight line), ternary (plane), etc., depending on the
number of selected compositions, which need not be
compounds. Each selected composition, however,
must be incapable of formation from the others.
(33) Le Chatelier’s Theorem: If a system in
equilibrium is disturbed, a reaction tends to take place
which opposes the effect of the disturbance, i.e., one
by which the eSect is partially annulled. The theorem
of Le Chatelier is an important augment to the phase
rule for it enables one to predict qualitatively the effect
’ of external changes on the equilibrium of a system.
(34) Lever Rule (or Center of Gravity Principle):
When a particular composition separates into only two
phases, the given composition and that of the two phases
are colinear; furthermore, the amounts of the two
separated phases are inversely proportional to their
distances from the given composition. Thus, in the
adjacent figure, A and В represent the compositions of
two phases formed from composition C: Amt. of A X
length AC = Amt. of В X length BC or А /В = BC/AC
-x-----X---------X-
A С В
(35) Liquidus: The locus of temperature-com-
position points representing the maximum solubility
(saturation) of a solid phase in the liquid phase. In a
binary system, it is a line; and in a ternary system, it is
a surface, usually curved. At temperatures above the
liquidus, the system is completely liquid, and a point
on the liquidus represents equilibrium between liquid
and, in general, one crystalline phase (the primary one).
(36) Metastable Phase: A phase exists meta-
stably in a system if it would not be present at final
(thermodynamic) equilibrium, under unchanged con-
ditions, and if the system is not approaching thermo-
dynamic equilibrium at an observable rate.
(37) Monotropic Forms: In certain instances
of polymorphism (see (43)), the vapor-pressure curves
of the two forms do not meet below the melting point.
They, therefore, lack a stable inversion point, and the
form with the higher vapor pressure is metastable with
respect to the other at all temperatures below the melt-
ing point. Such forms are called monotropic and are
not interconvertible.
(38) Peritectic Point: An invariant point (see
(24)) at which the composition of the liquid phase in
equilibrium with the solid phases cannot be expressed
in terms of positive quantities of the solid phases.
Whereas the composition of a eutectic point always lies
between or within the composition limits of the solid
phases in equilibrium with liquid, the composition of a
peritectic point always lies outside the composition
limits.
At a peritectic point the intersecting univariant
curves do not produce a minimum point on the liquidus
curve as for a eutectic.
(39) Peritectoid: An invariant point (see (24))
composed entirely of crystalline phases, at which the
phase reactions on change of heat content at constant
temperature are exactly analogous to those at a peri-
tectic point (see (38)), in which one of the phases is
liquid.
(40) Phase: Any portion, including the whole,
of a system which is physically homogeneous within
itself and bounded by a surface so that it is mechani-
cally separable from any other portions. A separable
portion need not form a continuous body, as for ex-
ample, one liquid dispersed in another.
A system composed of one phase is a homogeneous
system; a system composed of more than one phase is
heterogeneous; and in order for the phase rule to apply,
each phase must be in homogeneous as well as hetero-
geneous equilibrium.
(41) Phase Rule: For a system in equilibrium,
the sum of the number of phases plus the number of
degrees of freedom must equal the sum of the number of
components plus two, or P + F = C + 2.
(42) Piercing Point: In a quaternary system,
the intersection of a univariant curve with a ternary
joint (see (32)) at a point other than a ternary invariant
point. The univariant curve represents the composi-
tions of liquids that can exist in equilibrium with three
particular solid phases. The composition of these solid
phases usually all lie in the plane of the ternary join
if the intersection is a ternary invariant point, but they
cannot all lie in that plane if the intersection is a pierc-
ing point.
(43) Polymorphism: The property possessed
by some substances of existing in more than one crystal
form, all forms being of the same chemical composition
but differing in crystalline structure and physical prop-
erties, and yielding identical liquid or gaseous phases on
melting or evaporating.
(44) Primary Phase: The only crystalline phase
which can exist in equilibrium with liquid of a given
composition. The primary phase is the first crystalline
phase to appear on cooling a composition from the liquid
state; or conversely, it is the last crystalline phase,to
disappear on heating a composition to melting (see, also.
Boundary Line (3) and Liquidus (35)).
(45) Primary Phase Region: The locus of all
compositions in a phase diagram having a common pri-
mary phase.
(46) Pseudo System: It is frequently conve-
nient or necessary to refer to portions of a binary or
ternary, etc., system which are not (true) subsystems
(see (49)). In such instances the term pseudo binary,
or pseudo ternary, etc., is used.
7
Phase Rule
For example, in Fig. XIV, 3CaO • Al2O3-2CaO • SiO2
is a pseudo binary system and Al2O3-CaO- Al;>O3-2SiO2-
3Al2O3-2SiO2 is a pseudo ternary system. A ternary
system must consist of components and be bounded
by three binary systems. In the pseudo ternary system
cited, one of the boundary lines, 3Al2O3-2SiO2-CaO-
Al2O3-2SiO2, is only a pseudo binary system, as no
combination of CaO-Al2O3-2SiO2 and 3Al2O3-2SiO2 can
yield A12O3 which appears as a primary phase.
(47) Solid Solution: A single crystalline phase
which may be varied in composition within finite limits
without the appearance of an additional phase.
(48) Solidus: The locus of temperature-com-
position points in a system at temperatures above which
solid and liquid are in equilibrium and below which
the system is completely solid. In binary diagrams
without solid solutions, it is a straight line, representing
constant temperature, and with solid solutions, it is a
curved line or combination of curved and straight lines.
Likewise, in ternary systems, the solidus is represented
by a flat plane or a curved surface, respectively.
(49) Subsystem: Any portion of a binary, ter-
nary, etc. system which can be treated as an independ-
ent binary or ternary, etc. system. The selected sub-
stances designating the subsystem must be components
for the subsystem (see (4)). In the CaO-Al2O3 binary
system (Fig. 231), the lime-alumina compounds with
congruently melting points form binary systems with
each other, for example, the CaO-2Al2O3-CaO-Al2O3
and the CaO-CaO-А1гО3 systems; and in the ternary
system CaO-Al2O3-SiO2 (Fig. XIV), the binary joins,
such as CaO-SiO2-CaO-Al2O3-2SiO2 are true binary
systems, and the three congruently melting compounds,
CaO-SiO2, CaO-А1гО3-2ЯО2, and 2CaO-Al2O3-SiO2,
whose common boundary lines meet in a eutectic, con-
stitute a true ternary system.
(50) System: Any portion of the material uni-
verse which can be isolated completely and arbitrarily
from the rest for consideration of the changes which
may occur within it under varying conditions.
The term system is used in two senses: the general
and the specific. In the general sense, one specifies a
system by naming the chosen components, for example,
the binary system CaO-Al203, or the ternary system
КгО-В2О3-Н2О. In the specific sense, one may desig-
nate restricted portions of a “general” system for
study or discourse. Thus one may refer to an in-
variant system or bi-variant system, etc. in which the
restriction is based on the degrees of freedom (see (13)).
One may also refer to a one phase (homogeneous)
system (for example, system water vapor) or to a two
phase (heterogeneous) system (for example, system
calcium disilicate-liquid), etc., in which case the restric-
tion is based on the number of phases present. Finally,
one may refer to a system in which the restriction is
based on chemical composition, for example, the system
20 per cent Li2O-SiO2-80 percent LhO-BjOs. The use
of the term system to designate a particular chemical
composition is not necessary and should be avoided.
If the definition of system be kept in mind, the varied
use of the word need not be confusing and can easily
be interpreted in context.
(51) Tie Line: See Conode (10).
(52) Variance: See Degrees of Freedom (13).
II. THE PHASE RULE
(1) Statement
The basis of all work on equilibrium diagrams is, of
course, the phase rule of Willard Gibbs.6 Its use has
been greatly facilitated by the interpretations of Rooze-
boom,7 8 Schreinemakers,3 and others. Extensive ex-
planations are to be found in textbooks on physical
chemistry or books devoted exclusively to the phase
rule (see V. Selected Bibliography, (1)).
The diagram known variously as phase diagram,
equilibrium diagram, etc., is essentially a graphical
expression of the phase rule. Equation (1) gives the
usual mathematical form of the phase rule.
P + F = C + 2 (1)
C = number of components of system.
P = number of phases present at equilibrium.
F = degrees of freedom (variance) of system.
The terms used in equation (1) as well as others nec-
essary to an understanding and application of the phase
rule are defined in the Glossary.
(2) Limitations
The phase rule applies only to equilibrium states of a
system, which require both homogeneous equilibrium
within each phase and heterogeneous equilibrium be-
tween co-existing phases. The phase rule does not
depend on the nature of the components or on the nature
and amounts of the phases present, but only on their
numbers; nor does it give information concerning
rates of reactions.
A system in equilibrium always obeys the phase
rule, but conformance, in itself, is not a sufficient test
for equilibrium, because of the possible existence of
nonequilibrium phases and conditions. Non-confor-
mance with the phase rule, however, is proof that equi
librium conditions do not exist.
The phase rule provides the basis for the classifica-
tion, according to number of components, of the di-
verse cases of chemical equilibrium. If the number of
components be known, which is usually the case for a
specified system, the sum of the number of phases and
the number of degrees of freedom is fixed at C plus 2.
The number of components plus two also represents
the maximum number of phases that can coexist at
equilibrium, as the degrees of freedom (F) can never be
less than 0 (at invariant conditions).
6 (a) J. W. Gibbs, “Equilibrium of Heterogeneous Sub-
stances," Trans. Conn. Acad. Set., 3, 108-248, 343-524
(1874-78).
(6) J. W. Gibbs, The Collected Works of J. Willard
Gibbs, Vol. I, pp. 54-371. Longmans, Green and Co.,
New York, 1928.
7 H. W. B. Roozeboom, Die heterogenen Gleichgewichte,
’6 vols. F. Vieweg Co. Sohn, Braunschweig, 1911.
8 F. A. H. Schreinemakers, “Mischkristalle in Systemen-
dreier Stoffe,” Z. physik. Chem., 50 [2] 169-99: 51 [5] 547-
76; 52 [5] 513-50(1905).
8
One- and Two-Component Systems
III. INTERPRETATION OF DIAGRAMS
(1) One-Component Systems
The independent variables in a one-component sys-
tem are limited to temperature and pressure because
the composition is fixed. It follows from the phase rule
that the system is bivariant if one phase is present,
univariant if two phases are present and invariant if
three are present. A diagram of a one-component
system in which the independent variables, temperature
and pressure, are the abscissa and ordinate, respectively,
is shown in Fig. II. The following facts are observed:
(1) Curve F-A (univariant) is the sublimation curve
for modification A.
(2) Curve A-В (univariant) is the sublimation curve
for modification B.
(3) Curve B-C (univariant) is the vapor pressure
curve for the liquid.
(4) Curve А-D (univariant) is the transition curve
for modifications A and В and represents the change of
the transition point with pressure.
(5) Curve B-E (univariant) is the melting curve for
modification В and represents the change of the melting
point with pressure.
(6) Point A (invariant) is the transition point for
the two crystalline modifications. It is called a triple
point since it is the point at which three phases (two
solids and vapor) are in equilibrium.
(7) Point В is the triple point (invariant) for the
equilibrium between ciystalline modification B, liquid,
and vapor.
(8) The system is bivariant in all parts not on these
lines or their intersections.
In dealing with refractory substances it is at present
impossible, with a few exceptions, to measure directly
the vapor pressure of the solid and liquid phases. It is
possible, however, to construct diagrams for refractory
substances showing qualitatively the vapor pressure for
the different phases if the temperature-stability rela-
tions are known because the unstable phase always has
a higher vapor pressure than the stable phase even
Fig. II.—Phase relations in a one-
component system.
though the vapor pressure is infinitesimally small.
(2) Two-Component Systems
Two-component systems have three independent
variables, namely, temperature, pressure, and composi-
tion. In systems of importance in ceramics where the
vapor pressure remains very low for large variations in
temperature, the pressure variable and the vapor phase
may be eliminated from consideration.
Systems with the pressure variable eliminated are
called condensed systems. The reduced phase rule by
which such systems may be represented is shown in
equation (2) in which p refers only to solid and liquid
phases.
P + F = C + 1 (2)
In binary systems under these conditions three coex-
isting phases produce an invariant condition, two a
univariant condition, and one a bivariant condition.
In representing condensed binary systems it is cus-
tomary to make the ordinate the temperature scale and
the abscissa the composition scale. In Fig. Ill, the
intersection of the ordinate with the abscissa at To rep-
resents 100 percent Si (and 0 percent S2); the inter-
section at represents 100 percent S? (and 0 percent
Si). The scale as labeled, reading from left to right,
refers to percentage of S2 present; the percentage of Sj
represented by any point equals 100 — S2. The com-
position variable is usually given in weight percent or
mole percent, according to convenience; occasionally in
weight fraction or mole fraction.
(A) Binary Systems Without Solid Solutions
(a) No Compounds Present
In Fig. Ill is shown a simple type of condensed binary
system with (1) no intermediate compounds, (2) com-
plete solubility in the liquid state, and (3) no solubility
(i.e., no solid solution) between the solid phases. The
point, G> is an invariant point of the eutectic type where
two solid phases (components Si and S2) and liquid
(of composition 40% S2, 60% Si) are in equilibrium. A
change in either variable will cause one or more phases
to disappear. The curves F-C\ and G-Ci determine the
position .of univariant equilibrium. The coexistence
of both phases (one solid and one liquid) can be main-
tained with change of one variable if a compensatory
change is made in the other, the proportion of the two
phases changing accordingly. The univariant bound-
ary defines the quantitative relations of the variables.
In Fig. Ill, the vertical boundaries represent one-
component systems. The solid phases, Si and S2,
representing these components have sharp melting
points at the temperatures F and G, respectively.
Elsewhere, the F-Ci and G-Ci (liquidus) curves separate
the one phase (liquid) region from the areas where both
solid and liquid are present.
The difference between a one-phase region and a re-
gion representing two or more phases in equilibrium is a
basic concept in the interpretation of phase diagrams.
9
Mechanics of Crystallization
Fig. III.—Two-component system without intermediate
compounds or solid solutions.
Every location within a one phase region, such as in
the field designated Liquid in Fig. Ill, represents an
actual state of the system, in terms of temperature
and concentration variables. Locations within a two-
phase region, however, do not represent actual states,
but merely correspond to the overall chemical composi-
tion of two phases in equilibrium with each other, for
example, points in the fields designated Liquid + Si,
Liquid + Si, and Si + Si, in Fig. III. The two-phase
areas are, in effect, gaps or voids in which no single
homogeneous phase can exist. To construct isobaric
diagrams, it is necessary and sufficient to know the one-
phase-region boundaries.9
Mechanics of Crystallization: Changes in the system
illustrated in Fig. Ill may be followed by varying
either temperature or composition. On heating, a
mass of composition Ci will show sharp melting at the
temperature 7\. This is the lowest temperature in this
system at which liquid is in equilibrium with solids (the
eutectic temperature). Conversely, a homogeneous
liquid of this composition will crystallize completely at
this same temperature, on cooling, provided equilibrium
conditions are maintained. Since neither of the vari-
ables, temperature or composition, can be changed
without the complete disappearance of one or more
phases, the point Ci is an invariant point.
A liquid of composition A on cooling under equi-
librium conditions from a temperature above Tj will be-
have quite differently. The substance will remain a
homogeneous liquicl until temperature Tt is reached,
when the first infinitesimal amount of the solid with
composition Si will crystallize. Upon further cooling,
Si will continue to crystallize while the composition of
the liquid follows curve C-Ci.
9 See J. S. Marsh, under “Theory” in Selected Bibli-
ography, Part V.
At any temperature the composition of the liquid
coexisting with the solid is represented by the point of
intersection of the horizontal line corresponding to that
temperature with the liquidus curve. The relative
amounts of solid and liquid coexisting are represented
by the relative lengths of the temperature horizontal
from the composition of the initial material to intersec-
tion with the liquidus and with the vertical, Si-F, re-
spectively. Thus, composition A at the temperature
Т2 will consist of a solid of composition Si and a liquid of
Ci in the ratio of line lengths В2-Сг/Аг-В2.
With further cooling, solid Si will continue to crystal-
lize until the temperature of the eutectic, Ci, is reached.
The material will remain, because of the heat of crystal-
lization, at that temperature until completely crystal-
lized into a mixture of solids Si and Si. The ratio of
the amounts of the two solid substances can be found
by the same lever rule Si/S2 = A-S2/A-S1.
If the two solids, Si and S2 (Fig. Ill), are mixed in
such proportion as represented by point A and are
heated, no reaction will take place until the temperature
Ti, of the intersection of the isopleth and the solidus is
reached. At this temperature a liquid of composition
Ci which contains both Si and S2 is formed. The quan-
tity of liquid Ci formed at Tt is measured by the line
A1-B1 and the ratio of solid to liquid is В1-С1/Л1-В1.
At temperature T2 the ratio of solid to liquid is B2-C2/-
Л2-В2, and the composition of the liquid is given at C2,
the intersection of the tie line A2-Ci with the liquidus
F-Ci. As the temperature is raised, the amount of
solid decreases and the liquid increases, the liquid be-
coming richer in Si. At dT below Tt, only a very small
amount of solid remains and the composition of the
liquid has changed from Ci to C. At Tt, the solid is
completely melted and the liquid is of composition A.
The relative amounts of liquid and solid Si present at
various temperatures from Ti to 76 for the substance of
composition A are shown in Fig. IV. This figure serves
fairly well to illustrate the use of the lever rule. The
compositions, Si and S2, and the composition corre-
sponding to Ci are special cases to which curves of the
type of Fig. IV do not apply since melting of these com-
positions takes place at definite temperatures and not
over temperature intervals.
The above statements regarding the crystallization
of melts are true only if the rate of cooling is sufficiently
slow to allow equilibrium to be attained at every in-
stant. A rapid rate of cooling will lead to quite dif-
ferent results.
The liquidus boundary curve shows the effect of
soluble impurities on the melting point of pure com-
pounds. This effect can be shown by an isothermal
study of the solid, Si. If a charge of Si (Fig. Ill) is held
constant at temperature-7'7 and a small amount of S2 is
added, a small amount of liquid of composition L will be
formed. As the amount of S2 is increased, the amount
of liquid L increases. When sufficient flux, S2, has been
added to bring the total composition to L, the solid
phase, Si, disappears and the charge becomes entirely
liquid. Therefore, a small amount of soluble impurity
lowers the melting temperature from F to 7?.
10
Binary Systems with Solid Solutions
100 90 80 70 60 50 40 30 20 10 0
Per cent of total melt which is in solid state
Fig. IV.—Variation in amounts of liquid and
solid phase, 5i, upon heating composition A of Fig.
Ill from the temperature To to To + AT along
the isopleth A-C; AT and dx are infinitesimal in-
crements in temperature and amount of solid
phase. Si, respectively.
Further additions of 52 completely dissolve and the
composition of the liquid varies until point M is reached
when the solid phase, S2, no longer dissolves, that is,
the liquid is saturated with 52. Further additions of
S2 do not dissolve and the relative amount of liquid de-
creases; the mass approaches a complete solid as the
total composition approaches 52.
Since the curve F-C, represents solutions saturated
with Si, and the curve G-Cb solutions saturated with
52, the intersection Ci (eutectic) must represent a solu-
tion saturated with both solids. The curves are, thus,
solubility curves or freezing point curves.
(6) Compounds Present
Three types of binary diagrams with compounds, are
shown in Fig. V. Figure У(Л) shows a compound, 5i52,
which decomposes at Ti into the solids, 5i and 52.
Figure V(B) shows a compound, 5i52, with an incongru-
ent melting point; that is, it decomposes at T2 into a
solid, 52, and liquid, C, neither of which has the com-
position of the original compound. Figure V(C) shows
a compound, 5j52, which melts congruently, that is,
the liquid resulting from the melting of 5352 is of
the same composition as the solid, 5i52.
The system represented in Fig. V(Q may conven-
iently be divided into two systems or .subsystems, one
containing 5i and 5i52 as its components, the other 5j52
and 52. Both mav be studied in the same manner as
Fig. III.
(B) Binary Systems with Solid Solutions
(a) Mechanics of Crystallization
Figure VI represents the case of simple solid solution
where the melting point of A is depressed by В and that
of В is raised by A. The composition X at the tempera-
ture, Xo, will consist entirely of liquid. If this melt is
allowed to cool along the isopleth to the temperature,
Ti. a solid of composition 55i crystallizes out of the solu-
Fig. V.—Two-component systems with compounds pres-
ent. (Л), the compound, 5i52, decomposes at a tempera-
ture below the eutectic temperature; (B), the com-
pound, 5i52, decomposes at a temperature above that of
the eutectic; (C), the compound, SiS2, is stable at its
melting point.
Fig. VI.—Complete solid solution with-
out maximum or minimum in a binary sys-
tem. Line I-L1-L2-L3-2 represents the com-
position of the liquid phase and is called the
liquidus curve. Line 1-551-55г-55з-2 repre-
sents the composition of the solid phase and
is called the solidus curve. The tie lines,
SSi-Li, SS2-L2, and SS3-L3, show the conju-
gate relation of liquid and solid phase for
the three temperatures Ti, T2, T3.
tion. It is apparent that the solid is richer in A than
is the liquid L. At temperature T2 the liquid has a
composition of L2 and the solid solution a composition
of S52; and the ratio of solid to liquid is L2-X/SS2-X.
As the temperature falls from to T3 the isopleth
crosses the tie lines joining compositions of solids from
S5i to 55s with the compositions of liquid from Li to
L3. For the system to maintain equilibrium in cooling,
each and every crystal of solid solution must change
in composition continuously throughout its mass.
There is a constant interchange of material between
solid and liquid phases and a constant change in com-
position in all parts of the solid as cooling progresses.
The solid is thus increasing in concentration of В
along 55i-553 while the liquid is increasing in concentra-
tion of В along L1-L3. Simultaneously the amount of
solid is increasing and the amount of liquid decreasing,
the total composition of the system, of course, remain-
ing constant. The last drop of liquid has the compo-
sition £3 and the total solid the composition 553.
Fractional crystallization can be obtained between
Ti and T3 by removing the solid phase at any tempera-
ture between Ti and T3.
11
Binary Systems with Immiscible Liquids
(b) Types of Systems
Figures VI, VII and VIII show types of solid-solution
diagrams. In the case of binary solid solutions with a
maximum or minimum (Fig. VII), the maximum or
minimum point on the curve is not an invariant point,
as can be seen from the following argument. In a
two-component, condensed system (pressure constant),
P + F = C + 1 and F = 3 — P. In order for the
system to be invariant (F = 0), three phases must exist
in equilibrium. Such a condition, however, can never
exist in a solid-solution series as shown in Fig. VII,
because there are never more than two phases present,
i.e., solid solution and liquid solution. The system can
at no point become invariant, and the equilibrium
curves must be continuous, in contrast to a “true”
invariant point (eutectic or peritectic) which is a point
of discontinuity on the curve.
Such points designating maxima and minima, in-
cluding the melting points of congruently melting com-
pounds, at which two phases become identical in com-
position are known as indifferent points.6
Figure VIII shows two cases where two solid solutions
are present. In Fig. VIII (Л) at point c there are two
Fig. VII.—Binary systems
with a single solid solution. (Л),
system with a maximum melting
point at C, which is not a com-
pound; (В), system with a min-
imum melting point at G. which is
not a eutectic.
Handbuch der Metallphysik.
Edited by Georg Masing. Vol.
II, Die heterogenen Gleichge-
wichte, by Rudolf Vogel, p. 241.
Akademische Verlagsgesellschaft,
Berlin, 1937.
Composition B A Composition 6
Fig. VIII.—Solid solutions showing conjugate relation-
ships. The two solid solutions, 5i and S2, have a conjugate
relation to each other in area a-b-X-y. The solid solutions
in areas L-a-c and m-b-c have a conjugate relation to the
corresponding liquid phases present in these areas.
solid solutions of compositions a and b and a liquid of
composition c. This number of phases (3) present in a
condensed two-component system makes the point c
an invariant point which satisfies the definition of a
eutectic. In Fig. VIII(B) at point c there are two solid
solutions of compositions a and b and a liquid solution
of composition c. Point c in Fig. VIII(B) is also an in-
variant point, but it differs from that in VIII (X) be
cause there is solid in equilibrium with liquid both above
and below the temperature of the invariant point. The
relationship is therefore called peritectic in distinction
from eutectic.
Marsh9 has pointed out that complete insolubility
in the solid state, as indicated on many hypothetical
and actual binary diagrams, is highly improbable. It
will be observed that this compilation shows many bi-
nary diagrams of the silicates and refractory oxides in
which there is no indication of solid solubility, that is,
no solid solution. In many cases solubility is so slight
that evidences of it cannot be obtained or the scale of the
diagram is insufficient to show it. In too many in-
stances, however, the relations in the solid state have
not been sufficiently explored. Data of this kind are
important to the ceramic engineer and technologist as
well as to the petrologist, and are becoming more prom-
inent in literature.
(Q Binary Systems with Immiscible Liquids
In some systems two liquid solutions can exist in
equilibrium as shown by the area a-b-c in Fig. IX. The
extremities of the “tie line” Li-L2 represent the com-
positions of the two solutions which are in equilibrium _
at the temperature T2. The point c at temperature
is a triple point which, in a two-component system, is
an invariant point since there are two liquid phases and
one solid, A, present. The work of Greig has shown
that there are often similar conditions present in
certain SiO2-rich regions of silicate systems.
Fig. IX.—Conjugate liquid phases. The broken lines in
area a-b-c show the conjugate relationship of the two
liquid phases for the two temperatures, T2 and 7s.
12
Complex Binary Systems
(D) Binary Systems of a Complex Nature
An example of a hypothetical binary diagram of con-
siderable complexity is given in Fig. X to illustrate how
the courses of crystallization under equilibrium condi-
tions can be visualized. The two components are A and
B. Component A, within the temperature range of the
diagram, occurs in 5 enantiotropic forms: liquid, ai,
аг, a3, and аз. Component В exists in only two forms
within this temperature range, liquid and ft. There is
one intermediate compound, 7, which does not exist at
the liquidus. In a part of the composition range two
liquids, Li and L5, coexist. The components, by defi-
nition, melt congruently to form liquids of their own
composition.
(a) Crystallization Paths
Three vertical lines of constant composition (iso-
pleths), C, D, and E will be considered.
(i) Crystallization along isopleth C: At tempera-
tures above point k on the isopleth C, the substance is a
homogeneous liquid. When the temperature drops to
point k, separation into two liquids results, the two
liquids changing in composition and in relative amounts
as the temperature is lowered from k to n. At the tem-
perature represented by point m, for example, the com-
positions of the two liquids correspond to the intersec-
tions of the horizontal line (tie line) through point m
with the boundaries of the field (points d and e) and the
relative amounts of the two liquids, L\ and £2, are pro-
Fig. X.—Hypothetical binary diagram to illustrate possible phase changes.
13
Three-Component Systems
portional to the lengths m-e and d-m, respectively.
At the temperature of point n, crystallization of the
phase, ait a solid solution, occurs. The coexisting solid
and liquid have the compositions of the left and right
extremities, SSi and L3, respectively, of the horizontal
line through n. Further temperature drop results only
in changes in compositions and in relative amounts of
these two phases represented by horizontal lines through
the composition at the proper temperature level until
point о is reached, at which time the compositions of
solid and liquid are h and a, respectively. At the
temperature of point o, the cooling is arrested until all
of the liquid of composition a has crystallized to a mix-
ture of the solid solutions, at and a2, at having the
composition of point h, and a2 having the composition
of the point г.10
Further cooling through the region from о to p re-
sults in reaction of the two phases, at and a2, the quan-
titative relations between compositions and amounts
being found as before by passing horizontals through
the temperature levels of the reaction to the intersec-
tions with the phase-region boundaries. Solid at
changes in composition from h to p' and a2 from i to p.
At the temperature of point p, continued reaction be-
tween solids ai and a2 results in the complete disap-
pearance of ai. ccrpttpttjo
Solid solution a2 of composition p persists, unchanged
in composition, until the temperature of point q is
reached. At this point, there is a partial decomposi-
tion of phase a2 to form a3 of composition qt (a eutec-
toid decomposition). These two phases co-exist, con-
tinually changing in relative amounts and in composi-
tions, until point r is reached when another eutec-
toid decomposition takes place. Solid a2 completely
disappears, and the new solid solution, y, of compo-
sition r2 forms. At point s, аз is in turn replaced by
and the two phases at and у exist together until the
lowest temperature shown in the diagram is reached.
(ii) Crystallization along isopleth D: A mass of
composition D cooled from above the temperature where
it exists as a homogeneous liquid undergoes qualitatively
the same changes as did sample C until the temperature
represented by point v is reached. Here reaction be
tween the solid at and liquid L takes place, resulting in
the re-solution of cq and precipitation of a2. The phases
a2 and L coexist, changing in composition with de-
creasing temperature until the last bit of liquid disap-
pears at the point n>. From iv to .v only the solid phase
a3 is present. At x phase у precipitates from a2, but
a2 persists through only a very short cooling range when
it reacts with (is resorbed by) phase y, and у persists
alone throughout the remaining cooling range shown in
the diagram.
The phase у is a solid solution of an intermediate
10 Crystallization of any solid solution in equilibrium
with a liquid solution or with another solid solution under
changing temperature conditions requires that continual
reaction takes place not only between the materials crys-
tallizing at that instant but with all the solids already
crystallized. The difficulty of the attainment of equi-
librium under such conditions is obvious.
compound of the composition AxBy which can take
either A or В into its structure in greater than stoichio-
metric proportions. The compound AXB„ cannot be
considered a component of a subsidiary system since it
does not melt to a homogeneous liquid but instead in-
verts to the solid solution a2 on heating.
(in) Crystallization along isopleth E: Cooling of com-
position E results in the crystallization of solid solution
of composition /1 at the temperature of point /.
Changes in composition of the coexistent solid and
liquid phases take place until thejtemnerature of the
eutectic, Co, is reached. Then an arrestin'the cooling
takes place until reaction has caused the complete dis-
appearance of liquid by the crystallization of phases
аг and Pt in the proportion indicated by the lever prin-
ciple about point g. Further reactions on cooling are
not sufficiently different from previous descriptions to
require comment.
(3) Three-Component Systems
There are four independent variables in a ternary
system, namely, pressure, temperature, and two con-
centration variables since a ternary solution requires a
statement of its composition with respect to two com-
ponents before its total composition is fixed. Five co-
existing phases (a quintuple point) produce an invariant
system, four give an univariant system, three, a bivari-
ant, etc. A complete graphical representation of the
ternary system is a very difficult matter. If, however,
the vapor pressure is so low as to be negligible, the ter-
nary systems may be treated as condensed systems as
was the case with binary systems, the phase rule again
expressed as P + F = C + 1.
The compositions can then be represented by trian-
gular coordinates. This method is illustrated in Fig.
XI. In this figure, each side of the equilateral triangle
is divided into 100 parts, each tenth division being inter-
sected by lines parallel to each of the other two sides.
A point at the apex, C, is composed wholly of compo-
nent C. A point on the base line A-В is composed
entirely of components A and В with none of C. The
relative distance of a point, such as x, from each of the
three apices may be expressed in percentage and it thus
may represent a percentage composition of a ternary
mixture or solution in terms of components А, В, C.
Point X, for example, represents a composition of 45%
A, 20% B, and 35% C, whereas у represents 15% A,
15% B, and 70% C.
By the appropriate construction the coordinates of a
point in a triangular diagram can also be read off of any
one of the sides. In Fig. XI if the lines XE and XF be
constructed parallel to the sides BC and AB, respec-
tively, the length CE represents the percentage of A
(45) in composition X, the length AF the percentage of
C (35), and the length FE the percentage of В (20).
By a similar construction the composition of X, in
terms of A, B, and C can be read off on the sides В C and
AB. The two end segments of each line represent the
proportional amounts (in terms of the whole line) of the
substances designated at the opposite ends; the middle
segment represents the proportion of the third sub-
stance, not located on the line.
14
Typical Simple Ternary Systems
Fig. XI.—Representation of composition in a ternary sys-
tem by means of triangular coordinates.
This method of expressing a composition in terms of
three others by the appropriate construction, so as to
designate the three proportions as segments of a line is
not limited to equilateral triangles but is applicable,
also, to scalene triangles. For example, point X in
Fig. XI can be expressed in terms of A, B, and D on the
line BD, The percentage of В = DG X 100/DB — 20;
the percentage of D = НВ X 100/DB = 52; and the
percentage of A = GH X 100/DB = 28. By rotating
the line XE until it were parallel to BD, the proportions
of A, D, and В in X could be determined, similarly, on
the sides AD and AB.
As will be shown later, when dealing with subsystems
or when tracing the course of crystallization of a liquid,
it frequently becomes necessary to express an overall
composition in terms of three others which do not form
an equilateral triangle.
A triangular composition diagram also has the ad-
vantage that a series of additions of a third component
to a mixture in any ratio of the other two components
may be represented by a straight line from the apex of
the third component. In Fig. XI for instance, additions
of component В to a mixture of 33% A, 67% C (point D)
all lie on the line D-B.
Temperatures can be represented by lengths perpen-
dicular to the plane of the composition triangle and
therefore cannot be shown directly on a two-dimensional
surface, but the temperatures on one of the thermal
surfaces (usually the liquidus surface) may be indi-
cated for uniform temperature intervals by isotherms
as are elevation contours on topographic maps. The
actual solid diagram has an appearance like that of
Fig. XII.
The liquidus surface is then a series of intersecting
curved surfaces representing the primary phase fields of
compounds in the system. A primary phase^eld of a
congruently melting ternary compound is a domed sur-
face, the highest elevation of which represents the melt-
Fig. XII.—Perspective drawing of a space model of a
ternary system with a simple eutectic and no ternary
compound.
Modified from R. Vogel, Die heterogenen Gleichgewichte,
in G. Masing, Handbuch der Metallphysik, Vol. II, Fig.
266, p. 370, 1937.
ing point of the compound. Its field intersects that of
an adjacent congruently melting compound in a sloping
valley or boundary line. In the case of an incon-
gruently melting compound the intersection of the
primary phase field of the first with that of the second
solid is a sloping terrace and not a valley.
(A) Ternary Systems Without Solid Solutions
(a) Typical Cases
In Fig. XIII, six typical cases of ternary systems are
shown. Figure XIII(A) shows a system without either
binary or ternary compounds present. The field 1-4-2-
C represents the field of stability of component C in
equilibrium with solution. Solid C is the primary
phase for this area and is the last solid to disappear
when any composition within this area is heated. It
is also the first solid phase to appear when liquids
represented by points in this area are cooled. Points
1, 2, and 3 are binary eutectics, while point 4 is a ter-
nary eutectic. Lines 1-4, 2-4, and 3-4 are known as
boundary curves, each of which represents a condition
15
1'ypical Simple Ternary Systems
Fig. XIII.—Six typical cases of three-component systems; A and В show hypothetical isotherms. Arrows indi-
cate the direction of falling temperatures.
G. A. Rankin and F. E. Wright, Am. J. Sci., 4th Ser., 39, 18 (1915).
of 3-phase equilibrium among two solid phases and liq-
uid. The two solid phases at equilibrium along 1-4 are
A and C, along 2-4 are C and B, and along 3-4 are A
and B. Point 4 is a quadruple point in a condensed
system at which solids A, and В, C are in equilibrium
with solution.
In diagrams (5), (C), (D), and (£) of Fig. XIII an
intermediate binary compound, AB, is present. The
straight line which joins this compound to the third
component, C, of the ternary system is called an Alke-
made line. Alkemade lines divide ternary systems
into composition triangles. The final phases produced
by equilibrium crystallization within one of these tri-
angles are indicated by the apices of the triangle. For
example, in diagrams of Figs. XIII(jB), (C), (£>), and
(E), the final phases within the triangle A-AB-C are
crystalline A, AB, and C. In XIII (F), where a ternary
compound is present with the binary compound, con-
jugation lines form four subsidiary triangles.
Figure XIII(B) shows a ternary system where the bi-
nary compound AB is stable at its melting point. Ac-
cording to the theorem of Alkemade11 * * * is if the line C-X
crosses the line 5-6, the point of intersection will be a
maximum on the boundary 5-6 and the points 5 and 6
will be eutectics and each composition triangle will be-
have as a true ternary system. However, if C-X does
not cross 5-6 but intersects 1-5 and 4-5 (as in Fig. XIII-
(C)), then only 6 will be the eutectic. In the case of
Fig. XIII(jB), the line C-X forms a true binary system
with components C and AB. It divides the ternary
system A-B-C into two ternary systems, each of which
may be treated individually. In Fig. XIII(C), however
the line C-X crosses the primary phase field of another
compound, the composition of which does not lie on this
line, and therefore the line does not describe a binary
system.
In Fig. XIII(£>) the composition of the binary com-
pound, AB, lies outside the field 4-5-6-3 because it has
an incongruent melting point. In the binary system
A-В it dissociates at a temperature corresponding to
point 4 into solid A and liquid. In the ternary system
A-B-C the compound AB is the primary phase in field
3-4-5-6 and is stable in this field.
In Fig. XIII(E), AB dissociates into solids A and В in
the binary system A-В. In the ternary system com-
pound AB has a stable field 4-5-6.
11 “A theorem by Van Rijn Van Alkemade serves as a
very effective guide in regard to temperature changes in
the interior of the triangle. If the two points in the tri-
angle which correspond to the composition of two solid
phases be connected by a line, the temperature at which
these same two phases can be in equilibrium with solutions
and vapor rises as the boundary curve approaches this line,
becoming a maximum at the intersection though the
boundary curve often ceases to be stable before this point
is reached.” (W.D. Bancroft, “The Phase Rule,” J. Phys.
Chem., 1, 149 (1897))
16
Crystallization Paths
In Fig. XIII(F), the system has a binary compound
AB and a ternary compound, ABC, each of which has a
congruent melting point as their respective compositions
are within or on the boundaries of the fields in which
they are the primary phases.
These simple cases are also applicable to such com-
plex systems as the one shown in Fig. XIV.
(b) Crystallization Paths12
(i) Simple systems: Geer12(a> states that “the crys-
tallization curve denotes the locus of points which
represent the compositions of the solutions formed on
cooling any given solution from any given temperature
to the temperature (quintuple point in case of ternary
systems) at which it becomes solid, under the assump-
tion that no phase is removed during the cooling.”
The relations of solid phases to liquid phases of any sys-
tem that does not have solid solutions are known when
the liquidus of the system is determined for all com-
positions. The liquidus is the temperature at which
the first solid (primary phase) appears on cooling under
equilibrium conditions. A knowledge of the crystal-
lization curve or the melting curve (the reverse of the
crystallization curve) for any particular melt is very
valuable in the study of the firing of ceramic bodies. A
few types of crystallization curves will be described us-
ing the diagrams and terms given by Andersen.12(b>
In Fig. XV, point m is the ternary eutectic and all
crystallization curves of this system are terminated at
this point. If a liquid of composition a is chosen and
allowed to cool, the system remains liquid until the
liquidus is reached, at which temperature the solid, A,
begins to crystallize. The course of the crystallization
curve from this point to boundary m-k follows a straight
line drawn through A and a. This is true for all crys-
tallization curves where solid solutions are not present.
As the liquid changes in composition from a to b, solid
A crystallizes. At b, a second phase appears and the
crystallization curve follows boundary k-m with phases
A and C crystallizing together. At point m, the tem-
perature remains constant with solid phases A, B, and
C crystallizing together until all liquid has disappeared.
The final product will be a mixture of large crystals of
A and C, and small crystals (eutectic mixture) of
A, B, and C.
The composition of the solids crystallizing at any
instant along b-tn is given at the point where the tangent
to the crystallization curve intersects that side of the
composition triangle representing the two solid phases
coexisting. For example, at b, it is indicated by the
intersection of the tangent to the curve m-b-k at the
point b with the line A-C at point b”. The ratio
of A to C is given by the lever b"-C/b"-A. The mean
composition of the two solid phases that have crystal- 12
12 (a) W. C. Geer, “Crystallization in Three-Component
Systems," J. Phys. Chem., 8,257-87 (1904).
(&) Olaf Andersen, “System Anorthite-Forsterite-
Silica,” Am. J. Sei., 4th Ser., 39, 407 (1915).
(c) N. L. Bowen, “Ternary System, Diopside-Forster-
ite-Silica,” ibid., 38, 207-64 (1914).
Fig. XIV.—Three-component system, Al2Oa-CaO-SiO2,
showing (1) boundary curves as solid lines, (2) composition
lines (Alkemade lines) as dashed lines. The final product
of crystallization (on slow cooling) of ternary solutions
of this system always consists of three solid phases whose
fields of stability are adjacent. The same three solid
phases will be the final product of crystallization from any
solution whose composition lies within the triangle (com-
position triangle) formed by lines joining the compositions
of these three phases. Note: In compound designations,
C = CaO, A — AI2O3, S — SiO2.
G. A. Rankin and F. E. Wright, Am. J. Sei., 4th Ser.,
39, 52 (1915). (See Fig. 630 for revised and redrawn
diagram.)
Fig. XV.—Course of crystallization in a
simple ternary system
O. Anderson, Am. J. Sci., 4th Ser., 39,
427 (1915).
lized between points b and m is represented by the
intersection of a line drawn through nt and b and the
side of the composition triangle at b'. In this case it is
a mixture of A and C in the proportion b'-C/b'-A. The
mean composition of the total solid which separates out
between a and m (before В begins to crystallize) is de-
termined by drawing a line through m and a to the side
of the composition triangle at a'.
17
Mechanics of Crystallization-Ternary Systems
During eutectic crystallization at m, the composition
of the total solids changes from a' to a, reaching the lat-
ter point as the last drop of liquid disappears.
The method of calculating the amounts of solid sepa-
rating between various temperatures by the use of the
lever rule as shown in the preceding paragraphs is the
same as described in the case of the binary system.
For example, in cooling a melt of original composition
a from the liquidus temperature to point b, the ratio of
the amount of solid A crystallized to the total amount of
the system is equal to a-b/A-b whereas the ratio of the
amount of liquid of composition b remaining at b is
equal to a-A/A-b. Similarly, the relative amount of
solid of mean composition a' crystallized between a and
m (before В has begun to crystallize) is equal to a-tn/-
a'-m and the relative amount of liquid of eutectic com-
position is equal toa-a'/a'-m.
The case of a ternary system with a binary compound
stable at its melting point is discussed in connection
with Fig. XIII(jB). The crystallization in each sub-
system would be treated in the same manner as the
above case.
(ii) System with ternary peritectic: In Fig. XVI the
ternary eutectic point m and the peritectic point, o, lie
on the same side of the conjugation line, C-AB, and the
binary eutectic points, h and j, lie on opposite sides.
The field of A {A-j-o-k} extends across the conjugation
line, C-AB, hence the system C-AB is not a true binary
system. The temperature along line o-m decreases
according to the theorem of Alkemade toward m, and о
is not a eutectic but a peritectic.
In cooling a melt of composition a, solid phase A
crystallizes out along a-b. From b to o, A and AB
crystallize together and as the total composition of the
solid separated between a and о is given at a', there
must be liquid left when о is reached.
__The point a is within the composition triangle A-
AB-C, and the final products of crystallization must be
these three phases. It is evident from the diagram that
the three phases which are in equilibrium at о are A,
AB, and C. Therefore, the final solidification of com-
position a must take place at о and not at m since a lies
in the composition triangle whose solid phase areas meet
at o. During the final solidification at o, solid phases
C and /I jB crystallize while some of the phase, A, is re-
sorbed or dissolved.
The melt, c, on the conjugation line C-AB crystal-
lizes as follows: Along c-Ъ, A separates; along b-o, A
and AB separate together; at о, C and AB separate and
A completely dissolves, the final products of crystal-
lization being only ЛВ and C. Crystallization at in-
variant points frequently involves more than physical
processes and may involve chemical reactions as well.
At o, for example, with melt c the following chemical
reaction must occur: A (solid) + В (in liquid) = AB
(solid).
The melt, d, on the left of the conjugation line in the
composition triangle B-AB-C, crystallizes as follows:
Along d-e, A separates; along e-o, C and A crystallize
together; at o, A dissolves and AB is formed (tempera-
ture remains constant until all of A disappears); along
o-m, AB and C crystallize together. At m, the final
products of crystallization are AB, B, and C, which is
to be expected because the point d lies in the composi-
tion triangle B-AB-C. The mean composition of the
solid separating between d and о is represented by d*.
At the moment at which all of A has disappeared at о
and before crystallization begins to proceed along o-m,
the mean composition of the solid has changed from d'
to d" and is composed of C and ЛВ. Along o-m, the
mean composition of the solid changes from d" to d"'
and during the final crystallization at m from d'" to d.
(iii) Systems with both binary and ternary peritectics:
In Fig. XVII, the quadruple points, h and j, and the
quintuple points, о and m, lie on the same side of the Al-
kemade line, C-AB. A meltof composition e crystallizes
as follows: Along e-b, A separates; at b, the compound A В
begins to crystallize and A to redissolve (the intersection
Fig. XVI.—Ternary system with a binary
compound which does not form a binary
system with the- third component.
O. Andersen, Am. J. Sci., 4th Ser., 39,
431(1915). •
Fig. XVII.—Ternary system containing
a binary compound unstable at its melting
point.
0. Andersen, Am. J. Sci., 4th Ser . 39.
433(1915).
18
Simple Ternary Crystallization—Summary
of the tangent to line j-b-o intersects an extension of line
A-AB). This process continues until о is reached because
all lines drawn through points on the curve b-o and point
e intersect the line A-AB. Final crystallization takes
place when the composition of the liquid and the tem-
perature of the system reaches o. In this case, A does
not completely dissolve and the final products are A,
AB, and C. If the tangent to line j-o intersected the
line A-AB and not its prolongation, the solid A would
tend to increase in amount along j-o.
A melt of composition a which lies in the other com-
position triangle will crystallize as follows: From a to
b, A separates; between b and c, AB separates and A
dissolves (is resorbed), and at point c all of A has disap-
peared (the mean composition of total solid separated
between a and c is represented by AB). The point of
mean composition moves from A to /jB along line A-AB
as the temperature falls from b to c. From c, the crys-
tallization curve leaves the boundary j-o and continues
across the field to d while AB is separating. From d to
tn, В and AB separate together, and at m, AB, B, and
C crystallize together. All melts in the field j-o-A В
pass through the field h-m-o-j. The line j-o in this case
is called an alteration curve and is indicated by double
arrows.
(iiii) Recurrent Crystallization: Figure XVIII illus-
trates a case of recurrent crystallization. At point c. in
the crystallization of a melt of composition a, the phase
A disappears and the crystallization curve follows the
straight line to point d, at which A begins to separate
again. Along d-о, A continues to crystallize and AB
is slowly resorbed (the tangent to d-о intersects the ex-
tension of AB-A). At point o, A dissolves with simul
taneous separation of C and AB, the temperature re-
maining constant until A is completely dissolved.
Along o-m, C and AB separate together and the final
products of crystallization at m аге B, AB, and C, as
the original point lies within the composition triangle
B-AB-C.
Fig. XVIII.—Recurrent crystallization
in a ternary system.
O. Andersen, Am. J. Sci., 4th Ser.. 39,
435 (1915).
A melt e crystallizes as follows: Along e-b, A sepa-
rates; between b and p, AB crystallizes and A is par-
tially resorbed; from p to d, the tangent to the crystal-
lization curve, i.e., the tie line, intersects line A-AB and
not an extension of it, therefore, A and AB separate to-
gether; from d to o, the tangent intersects an extension
of AB-A, hence A crystallizes again and AB is partially
resorbed; at o, A is once more partially redissolved
while AB and C crystallize out, and the final products of
crystallization are A, ЛД and C.
(c) Summary Relating to Crystallization13
(1) When a liquid is cooled, the first phase to appear
is the primary phase for that part of the system in which
the composition of the melt is represented.
(2) The crystallization curve follows to the nearest
boundary the extension of the straight line connecting
the composition of the original liquid with that of the
primary phase of that field. The composition of the
liquid within the primary fields is represented by points
on the crystallization curve. This curve is the inter-
section of a plane (passed perpendicular to the base
triangle and passing through the compositions of orig-
inal melt and the primary phase) with the liquidus sur-
face.
(3) At the boundary line a new phase appears which
is the primary phase of the adjacent field. The two
phases separate together along this boundary as the
temperature is lowered.
(4) Two conditions may appear that would alter
the crystallization along the boundary. In one case the
first phase will increase as is the case where the tangent
to the boundary curve intersects the line connecting
the compositions of the two phases separating or it will
decrease (be resorbed) if this tangent intersects the pro-
longation of this line. In the other case the crystal-
lization curve will leave the boundary curve when the
first phase has become completely resorbed leaving
only the second solid phase. This may be inferred from
a study of the mean composition of the solid separating
between successive points on the crystallization curve.
(5) The crystallization curve always ends at the
invariant point which represents equilibrium of liquid
with the three solid phases of the three components
within whose composition triangle the composition of
the original liquid was found.
(6) The mean composition of the solid which is
crystallizing at any point on a boundary line is shown
by the intersection of the tangent at that point with
the line joining the composition of the two solid phases
which are crystallizing at the given point.
(7) The mean composition of the total solid which
has crystallized to any point on the crystallization curve
is found by extending the line connecting the given point
with the original liquid composition to the line connect-
ing the compositions of the phases that have been sep-
arating.
13 See G. A. Rankin and F. E. Wright, pp. 51-69, under
“Methods and Techniques, General,” of Selected Bibli-
ography, Part V. See also Andersen, reference 12(5).
19
Alternate Method for Determining Composition
(8) The mean composition of the solid that has
separated between two points on a boundary is found at
the intersection of a line passing through these two
points with the line connecting the compositions of the
two solid phases separating along this boundary.
(d) Alternate Method for Determining Phase Com-
position
An alternate method for determining phase composi-
tion during the course of crystallization is based on the
construction of similar triangles and has the advantage
that the proportions of three phases in equilibrium with
each other can be represented as segments of a straight
line. The method has a further advantage in that it is
simple and easily remembered, which is important to
those who have only occasional recourse to the use of
phase diagrams.
The method will be demonstrated for a system having
a binary compound with a ternary field but without a
binary field. Figure XIII(E) is such a ternary system,
and the binary system containing a compound without
a binary7 field is shown in Fig. V(4). In Fig. XIII(E),
the binary compound AB decomposes into the com-
ponents A and В below the eutectic (point 3); how-
ever, with addition of the third component, C, the liqui-
dus values in the ternary system have been lowered to
the point where the compound AB possesses a small
primary field. Point 6 (Fig. XIII(E)) represents the
POINT PHASE COMPOSITION, WT. FRACTION
A В c A В LIO
°1 f?-a, В -f?
в - a. B-Qj
°2 AB-P, P;~B AB-B k-S
AB-B
e(Max H) AB-P3 P4-B P3-P4 AB-B
AB-B AB-B
e (Min.H) AB-P5 p5-p6 Ре’ B
AB-B AB-B AB-B
Fig. XIX.-—Composition of phase assemblages for a
simple crystallization path in a system having a binary
compound with a ternary field but without a binary field.
unique temperature and composition at which ternary
liquid can exist in equilibrium with substances A, B,
and AB. Point 6 is also the highest temperature at
which AB can exist in equilibrium with a ternary solu-
tion.
The phase composition during the course of crystalli-
zation of the melt Pi of Fig. XIX will now be considered.
In Fig. XIX the path followed by the liquid during the
process of crystallization is shown by the hatched line.
From Pi to Oi solid В crystallizes; B, Pi, and Oi are
colinear, and the amounts of liquid and В at any point
along the path Pi to at can be determined by the “Lever
Rule,” as described earlier. At point o(, compound
AB starts to crystallize and the composition of the
liquid moves along the path at to e. At any point along
the path, e.g., at a2, three phases are in equilibrium,
namely, B, AB, and liquid of composition a2. These
three phases, moreover, must be equivalent in composi-
tion to the original melt, Pt. Consequently, if the line
Pi pi be constructed parallel to the line ar AB, and the
line Pt-Pi parallel to a^-B, the proportions of the three
phases are found along the line AB-B, as (AB-pM-
(AB-B) of B, (PrB)/(AB-B) of AB, and (pi-pi)/-
(AB-B) of liquid Oz.
At point e, at maximum heat content, that is, before
any C has started to crystallize, the proportions of B,
AB, and liquid e, can be determined by constructing
the line P\-p3 parallel to e-AB and the line Pi-pt parallel
to e-B. The phase composition is then given along the
line AB-B as (АВ-^)/(ЛБ-В) of В, (j>rB),I(АВ-E) of
AB, and (prpt)/(AB-B) of liquid e.
As Pi lies within the compatibility triangle formed by
AB, C, and B, crystallization is completed at e which
point represents the equilibrium between the three
named phases. At point e, at minimum heat content,
that is, when the last trace of liquid has crystallized,
the proportions of AB, C, and В may be found by the
appropriate construction of triangle prPiPr, similar to
triangle AB-C-B. The phase composition is then
given as (АВ-рз)/(АВ-В) of В, (pt-B)/(AB-B) of AB,
and (ps-ptd/CAB-B') of C.
The increase in amount of В during crystallization
along the path from a to e can be seen both qualitatively
and quantitatively by comparing the lengths of the
segments AB-pi, AB-p3, and АВ-р-я. By a similar
comparison-of the segments pz-B, pi-B, and pi,-В the
changes in amount of solid AB can be followed. The
segments рз-ps, prpr„ and pt-pt represent the amounts
of solids В, C, and AB, respectively, formed from the
eutectic liquid e during the change from maximum to
minimum heat content at constant temperature.
The phase composition at the various selected points
along the path of crystallization is given in the table
associated with Fig. XIX.
The course of crystallization of the melt P2, Fig. XX
will next be considered. From P2 to bi, solid A crystal-
lizes, and A, Pi, and bi are colinear. Along the path
bi to b2, compound AB crystallizes, and the two solid
20
1 ernary Solid Solution Systems
phases A and AB are in equilibrium with liquid of
varying composition as represented along the line
bi-b2. Determination of the amounts of the three
phases present at any point along the crystallization
path is similar to that for the melt Pi. At point b2 the
side brAB of the triangle A-brAB is coincident with the
side Pi-AB of the similar triangle li-P2-AB. Thus,
along the path bi to b2, solid A has been completely
resorbed, as the segment of line representing the amount
of A has been reduced to zero. It is evident that crys-
tallization along the A, AB, boundary cannot proceed
beyond b2 (toward n), for then P2 would lie outside the
triangle formed by the equilibrium phases A, AB, and
liquid, and no positive combination of these phases
could give the composition P2. At b2, therefore, the
crystallization path cuts across the AB field as AB con-
tinues to crystallize, and AB, P2, b2, and b3 are colinear.
At b2 solid C starts to crystallize and the melt proceeds
along the path 63 to e. At any point along the path,
bt, e.g., C, AB, and liquid of composition are in equi-
librium. If the triangle Iz-Prlz be constructed similar
to triangle AB-bi-C, then (AB-l2)/(AB-C) = fraction of
C, (l3-C)/(AB-C) = fraction of AB, and (Мз)/(АВ-С)
= fraction of liquid. As P2 lies within the crystalliza-
tion triangle AB-B-C, crystallization will be completed
at e, as for melt Pi (Fig. XIX), and the proportion of
phases present at maximum and minimum heat content
can be determined as has been illustrated. The table
associated with Fig. XX gives the phase composition at
the various points considered.
(e) Summary of Alternate Method
This alternate method for determining phase com-
position can be summarized as follows: The composi-
tion of three phases (usually but not necessarily, two
solids and a liquid) in equilibrium at any point along
the crystallization path are connected together with
straight lines to form a triangle. If the composition
of the original melt does not fall within this triangle,
an inconsistency exists for it is not now possible to
describe the original melt in terms of positive quantities
of the separated phases. Using the composition of the
original melt for one vertex and any convenient side of
the phase triangle for a base, another triangle is con-
structed similar geometrically to the phase triangle.
The side of the phase triangle selected as a base will
then be divided into three segments proportional to the
amounts of the three phases.
(B) Ternary Systems with Solid Solutions
In ternary systems it is necessary to locate boundary
curves, isotherms, and the compositions of the phases
crystallizing in order to determine the course of crystal-
lization within the system. In systems without solid
solutions where the phases are invariable in composi-
tion, the crystallization curve within the primary phase
field of a compound follows the extension of the straight
line connecting the composition of the mixture and the
primary phase until the line intersects a boundary curve.
In ternary systems containing solid solutions, however,
the crystallization curve within the primary phase field
of the solid solution is no longer a straight line because
the composition of the primary phase continually
changes as crystallization proceeds. In determining
the crystallization curve in a ternary system containing
solid solution, it is necessary to know the position of
the boundary curves, the isotherms, and the tie lines12(C)
for numerous points on the isotherms.14
(a) The Solid Solution Diagram
A simple case of solid solution in ternary systems as
discussed by Bowen is shown in Figs. XXI(Л) and (B).
In the binary system A-В of Fig. XXI(Л), the tie lines,
l'-5z and similar ones parallel to the base, give the com-
position of the solid phase in equilibrium with the liquid
phase at. the corresponding temperature. The line
5-4-6 (Fig. XXI(B)) is the isotherm for the temperature
Ti, and line 5'-4'-6z is the isotherm for the temperature
T2.______
14 The tie lines have been referred to by some writers,
particularly Schreinemakers,8 as solid-phase indicating
lines because they indicate the composition of the solid
phase in equilibrium with a definite liquid phase. The tie
lines must be determined experimentally; they cannot
be constructed. In special cases where the extremities of
the tie lines or solid-phase indicating lines are on the
boundary lines of the three-phase system, they are desig-
nated as three-phase boundaries
POINT PHASE COMPOSITION, WT. FRACTION
A В c AB LIO.
b| P2-b, a-p2
A -Ь, A-b,
b2 A-l, 1, -AB
A-AB A-AB
ьг Alternate P2 - Ь2 AB-fJ
AB-b2 AB-b2
bs P2-b3 AB-f=
AB-b3 AB-b3
b4 ab-I2 AB-C l3-c
AB-C AB-C
Fig. XX.—Composition of phase assemblages for a
crystallization path showing resorption of (A) in a system
having a binary compound with a ternary-field but without
a binary field.
21
Mechanics of Crystallization
Fig. XXI.—(A) Melting surface of a three-component system in which one of the
binary systems, A-B, has solid solutions present. In the ternary system these binary
solid solutions exist as the primary phase to boundary E1-E2.
Modified from N. L. Bowen, Am. J. Sci., 4th Ser., 38, 221 (1914).
(B) Sections produced by planes passed parallel to base triangle at the temperatures,
Tt (solid lines) and Zj (dotted lines), and tie lines at these temperatures.
(C) Series of three-phase boundaries (tie lines) at temperatures from Ei to Es; solid-
solution tie lines are broken and single-crystal, C, tie lines are solid; tie lines 3-4-C and
3'-4'-C taken from Fig. XXIB.
The phases present at Tt (Fig. XXI(B)) are as follows:
(1) Area 5-4-6, all liquid.
(2) Area A-5-4-3, liquid plus solid solution; com-
position of liquids on line 4-5 and solid solutions on
line 3-A.
(3) Area 6-4-C, liquid and solid C; composition of
liquid on 4-6.
(4) Area 3-4-C, liquid 4, solid solution 3, and solid C.
(5) Area 3-C-B, solid C and solid solution; com-
positions of solid solutions on line 3-B.
The phases present at Тг (Fig. XX 1(B)) are as
follows:
(1) Area A-o'A'-6', all liquid.
(2) Area 5'-4'-3', liquid plus solid solution; com-
positions of liquids on line 4'-5', compositions of solid
solutions on line 3z-5'.
(3) Area 6'-4'-C, liquid and solid C; compositions
of liquids on line 4'-6'.
(4) Area З'Л'-С, liquid 4', solid solutions 3', and
solid C.
(5) Area З'-С-В, solid C and solid solution; com-
positions of solid solutions on line 3'-B.
Point 4 represents the composition of liquid in
equilibrium at temperature T\ with two solid phases,
namely, solid solution 3 and solid C. Point 4' repre-
sents the composition of the liquid in equilibrium at
temperature T\ with the two solid phases, C and solid
solution 3'. Both 4 and 4' lie on the boundary, £i-£2,
of Fig. XXI (Л). The extremities of lines 3-4 and 3'-4'
lie on boundaries (lines E2-Ei and A-B) of the ternary
system. These tie lines are two of the infinite number
of possible three-phase boundaries, some of which are
shown in Fig. XXI(C). Line 7-8 is the simple type of
tie line showing the composition of solid solution 7 in
equilibrium with liquid 8 at temperature 7).
Melts represented by a composition in area z-y-C on
crystallizing follow a radial line from C with phase C
separating until boundary z-y is reached at which point
of intersection a solid solution begins to separate; the
composition of the solid solution is represented by the
other extremity of the three-phase boundary at that
temperature. For example, a melt whose composition
lies on the line C-4 will reach the boundary curve at 4
and the composition of the first solid solution to appear
is given at point 3. As the temperature drops the liquid
changes in composition along y-z toward у while at the
same time the solid solution is changing along В-A to-
ward A and the solid C remains unchanged in composi-
tion. All solutions do not reach у before complete
solidification takes place, as the original composition of
the melt determines the final solidification temperature.
(b) Mechanics of Crystallization
(i) No compounds present: To aid discussion of
crystallization paths in ternary systems with solid solu-
tions, a hypothetical diagram is given in Fig. XXII.
This diagram is the two-dimensional drawing of Fig.
XXI (Л) on which the following are shown: (1) iso-
therms, Tt, T2, T3, etc. (not related to designations in
Fig. XXI), (2) representative tie lines for each of the
isotherms in the solid-solution area B-Ei-E^-A, and
(3) representative crystallization paths (d-e, a-k-3, k-m,
and /-4). It is to be emphasized again that in solid
solution systems, the crystallization paths are curved
lines. The compositions of the solid phase and the
liquid existing in equilibrium with it for any respective
temperature are joined by a tie line. For example, the
solid in equilibrium with the liquid 1 on the isotherm
is shown at 1' and the solid in equilibrium with a
liquid of composition 2 on isotherm is shown at 2'.
As an example of crystallization, the composition a
on isotherm T6 is selected. The crystallization curve
for this point is a-k-3. Upon cooling this melt, the first
solid appears at temperature T6 and is represented at
the other extremity of the tie line passing through point
a at temperature T6. This tie line is shown as a dot-
dash line and the composition of the solid solution is a'.
As the temperature is lowered the trace of the composi-
tions of the liquid phase follows the crystallization curve
from a to 3 and thence the boundary line from 3 to c.
22
Mechanics of Crystallization
Fig. XXII.—Course of crystallization in a ternary system where one of the binary systems is a complete solid solution
series.
The compositions of the solid solutions in equilibrium
with the liquids during crystallization from a to 3 are
represented by the series of tie lines connecting points
on the crystallization curve with the corresponding
solid solutions; all of these tie lines pass through a, for
example, a-a', k-a-k', and 3-a-3'. But, during cooling
from 3 to c, the tie lines do not pass through a; instead
they pass to the right of a.15
u In any system, the summation of the phases present
equals the composition of the mass being studied. During
cooling of composition a from a to 3, the sum of the liquid
plus the solid solution always must equal a; hence, the line
(i.e., tie line) connecting the compositions of the two coex-
isting phases must pass through a. During cooling from 3
to c, a third phase (solid C) is present, therefore, the com-
plete composition is expressed by a triangle rather than a
straight line. For example, at temperature p which is be-
tween 3 and c, the two solid phases, C and solid solution o,
and liquid p coexist; hence, the composition a is repre-
sented by corners of the triangle C-o-p, and the tie line o-p
does not pass through a.
The crystallization will end when the temperature of
tie line c-c' has been reached; this tie line being the one
which passes through the point where the extension of
line C-a intersects the boundary line, A-B; that is, line
C-a-c' connects the compositions of the two final solid
phases. The line c-c' is the tie line (three-phase
boundary line) for temperature c and the triangle c'-c-C
is of the same type as 3-4-C in Fig. XXI(B).
During the cooling period from 3 to c, crystalline C
and solid solution are precipitated together, the solid
solution changing in composition from 3' to c', and the
liquid from 3 to c. The final products of crystallization
are, therefore, crystalline C and the solid solution of
composition c', with the ratio of C to solid solution being
given by the lever reaction c'-af C-a.
The above example shows that in solid solution sys-
tems the end point of the crystallization is not deter-
mined by a eutectic but stops at a point determined by
the join passing through the composition of the original
melt.
23
Determination of Three-Phase Boundaries
Fig. XXIV.—Ternary system containing a binary com-
pound unstable at its melting point which forms a series of
solid solutions with the third component
N. L. Bowen, Am. J. Sci., 4th Ser., 38, 225 (1914); see
also N. L. Bowen, "The Evolution of Igneous Rocks,”
Princeton University Press.
Fig. XXIII.—Ternary system containing a binary com-
pound stable at its melting point which forms a complete
series of solid solutions with the third component.
N. L. Bowen, Л«1. J. Sci., 4th Ser., 38, 223 (1914).
A further example is given for the crystallization of
composition / whose crystallization path is /-4-g. The
first solid to appear upon cooling a melt of this composi-
tion is given at/', and the solid at the intersection of the
crystallization curve with the boundary line Ei-E2 is
given at 4'. At the intersection with the boundary line
at 4, phase C begins to crystallize along with the solid
solution and the two coexist from 4 to g. The final
products of crystallization are solid solution g' and C.
A melt of composition h crystallizes as follows: at
temperature T4, crystalline C precipitates and continues
to do so from h to b; at b solid solution i appears and the
two solid phases continue together to c at which tem-
perature crystallization ceases. The final solid is com-
posed of the two solids, C and solid solution c' in the
proportions c'-h/C-h.
Every composition in the solid solution area, B Ei-
E?-A, has a crystallization path different from every
other. For example, composition k lies on the crystal-
lization path of composition a, but its crystallization
path is along k-m and not k-3.
(ii) Congruent melting binary compound: Figure
XXIII illustrates a case where thecompound, AB, forms
a complete series of solid solutions with the component
C. This case can be considered as two ternary systems
of the type represented in Fig. XXI(Л), namely, sys-
tems C-AB-A and C-AB-B.
(iii) Incongruent melting binary compound: In the
case where the compound, AB, is unstable at its melting
point (Fig. XXIV) the system cannot be treated in the
same manner as the last case. Mixtures along C-K be-
have as true binary mixtures, but from К to AB, the
crystallization is ternary. There are two possibilities in
this region of the ternary system as are shown in Fig.
XXIV at (a) and (&), that is, there may be a simple
solid solution or a solid solution with a minimum. Mix-
tures in the region К to L behave on melting as true
binary mixtures until the temperature of the isotherm
passing through К is reached, at which point solid A
begins to separate from the solid solution. Mixtures
between L and AB melt at temperatures above that of
point К with the separation of pure A. The broken
Fig XXV —Determination of the posi-
tion of the three-phase boundary, FC.
Modified from N. L. Bowen, Am. J. Sci.,
4th Ser., 40, 171 (1916).
lines in Fig. XXIV are the three-phase boundaries for
this type of system. The diopside-forsterite-silica
system (Fig. 608) is of the type just described.
(c) Determining Three-Phase Boundaries
In determining the position of the three-phase
boundaries shown on Fig. XXI(C), it is necessary to de-
termine the physical properties of the solid solutions
present. In Fig. XXV, the lines D F and F-E are the
isotherms for another system, A-B-C, at temperature T
(similar to lines 4'-5/ and 4,-6/ of Fig. XXI(B)). The
phases present in the areas are as follows:
(1) Area D-F-E-A, all liquid.
(2) Area E-F-G, liquid and solid solution; composi-
tions of liquids on line E-F, and composition of solid
solutions on line K-G (solid solution G is in equilibrium
with liquid F at this temperature).
(3) Area C-D-F, liquid plus solid C; composition of
liquids on line D-F.
(4) Area C-F-G, liquid F, solid solution G, and solid
C.
24
Multicomponent Systems
(5) Area B-G-C, solid solution plus solid C; com-
position of solid solutions online B-G.
In order to be able to predict the phases present at
any specific temperature, such as T, it is necessary to
know the position of the line, F-G. If the isotherms
are known, this line can be fixed by determining only
point G, the composition of the solid solution at that
temperature, because point F is already known. This
composition may be determined by optical methods pro-
vided the optical properties, especially the refractive
indices, of the complete series of solid solutions in the
binary system are known. X-Ray diffraction methods
may be similarly used provided the diffraction constants
of the binary solid solutions are known. Lines C-F and
C-G also bound the three-phase field C-F-G, and they are
merely straight lines radiating from C.
A three-phase boundary may also be determined by
starting with a mixture of known composition and (1)
determining the temperature at which the three-phase
area is entered by cooling the melt from a higher tem-
perature to a lower temperature or (2) determining the
temperature of beginning of melting by starting with a
mixture of solid C (Fig. XXV) and a solid solution of
known composition lying between A and B.
(4) Multicomponent Systems
(A) General
The phase rule, of course, does not limit the number
of components that may compose a system, but as the
number of components increases, the complexity of the
system mounts. Furthermore, for systems of more
than three components a simple, convenient graphical
representation of equilibrium relations is no longer
possible.
The complete phase diagram of a condensed binary
system may be represented on a plane surface as the
two available dimensions of a plane suffice to permit the
plotting of the two independent variables of composition
and temperature.
A condensed ternary system is visualized usually as a
triangular prism, in which the variables of composition
(two independent and one dependent) are represented
on an equilateral triangular base, and the independent
variable of temperature on an axis vertical to the tri-
angular variable of temperature on an axis vertical to
the triangular base (Fig. XII). Three binary systems
constitute the boundaries, or outside faces, of the tri-
angular prism. From the binary invariant points
(eutectics and peritectics) univariant curves, possessing
one degree of freedom, penetrate the interior of the
triangular prism. These univariant curves are formed
by the intersection of two divariant primary phase sur-
faces, and along the univariant curves two solid phases
are in equilibrium with liquids whose compositions lie
on the boundary curves. The junction of three uni-
variant curves forms a ternary invariant point corre-
sponding to the single composition and temperature of a
liquid in equilibrium with three solid phases.
In practice, the ternary system is drawn as a plane
equilateral triangle, the base of a prism, upon which
liquidus temperatures of the primary phase fields are
projected as contours (isotherms). In such a represen-
tation, the unique liquidus temperature for every com-
position, a dependent variable, has been chosen as a
specialized condition for projection on the composition
plane. Fortunately, the physical nature of systems is
such that by proper interpretation of the ternary
“map,” equilibrium relations at any other temperature
within the melting range are easily obtainable, pro-
vided that solid solutions are not present. If, however,
solid solutions exist within the system, the compositions
of two coexisting phases must be indicated for every
composition and temperature within the solid solution
region, namely, that of the liquid solution and that of
the coexisting solid solution. For the case of solid
solutions, therefore, representation of equilibrium rela-
tions on a plane surface may be extremely complicated.
The complete graphical representation of a condensed
quaternary system, or one showing the relationships
between temperature and all possible mixtures of four
components, requires four dimensional space. All
possible mixtures of four components, however, may be
depicted by a regular tetrahedron, each apex of which
represents 100% of one component. The tetrahedron
is subdivided into various primary phase volumes,
which are separated, in general, by curved surfaces.
Each primary phase volume represents the composition
of all quaternary liquids that can exist in equilibrium
with one particular solid phase. Boundaries between
two primary phase volumes are quaternary divariant
curved surfaces, in which lie the compositions of all
quaternary liquids that can exist in equilibrium with
two particular solid phases. The intersections of
three divariant curved surfaces, the common boundaries
of three intersecting primary phase volumes, form
univariant curved lines, on which lie the compositions of
quaternary liquids that can exist in equilibrium with
three particular solid phases. Finally, quaternary
invariant points,16 each representing the composition
of the liquid in equilibrium with four particular solids,
are formed by the intersection of four univariant curves,
each of which has been formed by three divariant sur-
faces, each of which, in turn, is the common boundary
of two adjoining primary phase volumes. Six curved
surfaces intersect at a quaternary invariant point.
Four ternary systems limit the quaternary system,
and they are represented by the four equilateral tri-
angles forming the faces of the tetrahedron. The
quaternary univariant curves end (or originate) in
the ternary invariant points; the quaternary divariant
surfaces end (or originate) in the ternary univariant
curved lines.
In a condensed ternary system, forming binary and/-
or ternary compounds, Alkemade lines (joins connect-
ing the composition points of primary phases whose
fields are adjacent) divide the equilateral triangle into
smaller triangles. The substances indicated at the
three vertices of these smaller triangles designate the
final products of crystallization at the solidus for all
16 An invariant point may be a eutectic point, an inver-
sion point, or a reaction point, depending upon the nature
of the solid phases and the temperature distribution along
the univariant lines which meet at the point.
25
Multicomponent Systems
compositions within the triangular field. If a univari-
ant boundary curve intersects its Alkemade line, it
always does so at a maximum temperature on the boun-
dary curve. If the boundary curve does not intersect
the Alkemade line, then the maximum on the boundary
curve is that end which if prolonged would intersect
the Alkemade line.
A condensed quaternary system, similarly, may be
divided into smaller tetrahedra by triangular planes
connecting the compositions of all primary phases
having adjoining liquidus regions. The final products
of crystallization at the solidus for all compositions with-
in each tetrahedron are designated by the four phases
forming the apices of the tetrahedron. Analogous to
the case for ternary systems, the intersection of a qua-
ternary univariant curve with its composition plane
always represents a temperature maximum on the uni-
variant curve; or the maximum temperature on the
univariant curve is that end which if extended would
intersect the appropriate composition plane.
Inasmuch as no independent axis is available for the
temperature variable in a condensed quaternary system
represented by a compositional tetrahedron, isotherms
are depicted as a series of intersecting curved surfaces
through the various primary phase volumes. They
cannot be represented in a simple manner on a plane
diagram. An isothermal section may be represented as
a tetrahedron, but mapping difficulties are still inherent
in this approach. The above discussion has been based
on fixed compositions of the crystallizing phases and
excludes solid solution, which further complicates the
determination and the mapping of the equilibrium
relations.
A five component condensed system illustrates the in-
creasing difficulties involved in studying multicompo-
nent systems composed of more than four components,
because for such cases the independent variables of
composition can no longer be represented on a single
model. Ten basic binary systems form the simplest
boundary systems. These ten binary systems, in
groups of three, form the boundaries for ten different
ternary systems, which, in turn, in groups of four,
form the boundaries for the five quaternary systems.
Finally, the five quaternary systems define a region in
five-dimensional space in which lie the primary phase
regions and invariant points. Five-dimensional space
can neither be portrayed or even visualized, and it
becomes necessary to resort to mathematical concepts.17
Figure XXVI shows in tabular form the inter-
relations of sub-regions both within a given system
and between boundary systems and is designed to clar-
ify some of the relations already discussed, as well as to
indicate those in more complicated systems. The
figure gives (numbers in the squares) the number of
solid phases in equilibrium with liquid for regions hav-
17 See Mathematical Treatment in Selected Bibliog-
raphy.
ing different numbers of degrees of freedom, in 2, 3, 4, 5,
or n component systems. The number of solid phases
is derived simply from the phase rule formula, P = C +
1 — F, bearing in mind that the number of solid phases
is P-1, inasmuch as a liquid phase has been specified as
being present in all cases. The sub-regions designated
as 0 solid phases are, of course, regions corresponding
to the presence of liquid alone.
In the geometrical representation of degrees of free-
dom, an invariant condition, zero degrees of freedom,
is always represented by a point, whether it be located
in a 2, 3, 4, or n dimensional system. A univariant
condition, one degree of freedom, is always depicted
by a curve, which may, also, lie in a system having any
number of dimensions. Similarly, a divariant condi-
tion, with two degrees of freedom, may be represented
on a surface; and a tri variant condition, with three
degrees of freedom, within a volume. Variance of
greater than three degrees of freedom cannot be repre-
sented physically on a single model.
The number in parentheses at the base and to the
left of each vertical arrow in Fig. XXVI indicates the
number of regions designated below the arrow that in-
tersect to form the region of next lower variance,
indicated above the arrow. For example, in a quinary
system the intersection of two, nonrepresentable, four-
dimensional primary-phase regions forms a trivariant
region wherein lie compositions for which two particular
solid phases are in equilibrium with quinary liquids.
Three of these trivariant regions intersect in a divariant
surface in which three particular solid phases are in
equilibrium with quinary liquids. Four divariant sur-
faces intersect in a univariant boundary curve, along
which four solid phases are in equilibrium with quinary
liquids. Finally, five univariant curves meet in an
invariant point, corresponding to the composition and
temperature of liquid in equilibrium with five solid
phases.
Figure XXVI also shows the relations between re-
gions in a system and its boundary systems, as indi-
cated by the diagonal arrows. Thus, a curve in a quat-
ernary system may end (or originate) in a ternary in-
variant point of the boundary system; a volume in a
quinary system may end (or originate) in quaternary
divariant surfaces, which, in turn, may end (or origi-
nate) in univariant curves of ternary boundary systems,
etc. It should be noted at this point, however, that
regions do not necessarily originate or terminate in
boundary systems. As an example, a quaternary uni-
variant curve may connect two quaternary invariant
points, in which case, also, the three intersecting divari-
ant surfaces (and volumes) do not contact boundary
systems along the univariant curve in question.
From inspection in Fig. XXVI of the numbers (in
parentheses) beside each vertical arrow, indicating the
relation between two different subregions within a
system, it may be observed that the values are pre-
scribed by the mathematical law of combination.
Each value is the number of sets of j2 solid phases (in
the region below the arrow) that can be formed from
si solid phases (in the region above the arrow). The
26
Multicomponent Systems
Fig. XXVI.—The interrelationships of sub-regions of multicomponent con-
densed systems.
The number of regions of Fa degrees of freedom that can be common to a
region of lesser degrees of freedom, Fj, is given by the mathematical law of
combination:
C — 51'
B‘”’ ft!(ft - ft)!’
where Cft.ft is the number of sets of ft solid phases that can be selected from ft
solid phases, where ft and ft are the number of solid phases, respectively, for
the two regions.
general formula, which can be found in most algebra
texts, is given as:
C,i, s2 = ft !/ft!(ft — ft)! (1)
where С,1.й is the number of sets or combinations
of s2 objects that can be chosen from ft objects. As an
illustration, suppose the problem is to calculate for a
quinary system the number of intersecting divariant
surfaces (regions corresponding to equilibrium between
three solids and a liquid) that form a univariant curve
(regions corresponding to equilibrium between four
solids and a liquid). Substituting in equation (1):
r _ r _ 4!
Csl.« - C4.3 - 3!(4_3)! - 4
The four combinations of three solids chosen from four
solids, designated А, Б, C, D are ABC, ABD, A CD,
BCD.
The combination formula can be further applied to
obtain additional information not given in the figure.
For example, in a quinary system how many trivariant
regions participate in forming a univariant curve? It
cannot be reasoned that because three trivariant re-
gions intersect to form a surface, and four surfaces to
form a univariant curve that, therefore, 4 X 3 or 12
regions meet at a univariant line, for trivariant regions
may be common to more than one of the surfaces in-
volved. Mathematically, the problem is to calculate
the number of pairs of solid phases that can be chosen
from four. Substituting in equation (1):
4!
Ct‘2 = 21(4 - 2)! = 6
Half of the trivariant regions must be common to two
surfaces.
Considering the complexity of even the simplest pos-
sible types of multicomponent systems, it is not sur-
prising that the complete equilibrium relations for even
a single quaternary system have never been established.
Nevertheless, portions of multicomponent systems,
especially those of geological and industrial importance,
are being studied, and an ever increasing body of data is
being accumulated in the literature. It suffices for the
purposes of this Compilation to indicate some of the
27
Heterogenous Equilibria—Experimental Methods
system NajO-CaO-AlsOs-SiOs (Fig.840) were determined
by Joseph Spivak. This method is especially conven-
ient when studying complicated solid solution regions
where tie lines between solid solutions and liquid solu-
tions are to be indicated, as shown, for example, in
Fig. 684. The method of isothermal sections is most
useful for showing sub-liquidus relations in refractory
oxide systems whose liquidus temperatures can not be
determined with available equipment. For example,
Fig. 581 shows the 1750°C isotherm for the system
BeO-CeOs-ZrCh. Sub-solidus compatibility tetra-
hedra have been determined in the system CaO-MgO-
SnOj-TiOz (Figs. 939 and 940). In other words, for a
given composition in this system, it is possible to state
the final products of crystallization, although crystal-
lization paths cannot be followed.
(ii) Compositional Restraint. A quaternary system
can be represented by a series of ternary diagrams in
which one of the composition variables is held at a
constant but different value in each diagram. Thus,
Lea and Parker (Figs. 943-947) determined equi-
libria relations in the system CaO-5CaO-3Al2O3-
2СаО-8Ю2-4СаО А.12Оз Ре2Оз, of particular interest
in cement technology, by studying planes through the
base (СаО-5СаО-ЗА12Оз-2СаО-8Ю2) of the tetra-
hedron at 0, 2, 5, 10, and 20 percent Fe2O3, or 0, 6.1,
15.2, 30.4, and 60.8 percent, respectively, of 4CaO-
АКОз РегОз- Figure 943 is a perspective diagram of
the system showing primary phase volumes and tem-
peratures of some of the invariant points, derived
from the data on the study of the sections together
with the phase diagrams of the faces of the tetrahedron
(Fig. 944).
A five component system could be studied by a simi-
lar technique, although it would be a long and tedious
process. Three chosen components would form the
apices of a series of ternary diagrams in a two dimen-
sional array. The percentage of a fourth component
would vary in the horizontal series, while the percentage
of the fifth component would be held constant. In each
vertical series the fourth component would remain con-
stant while the fifth increased from row to row.
A five component system might be represented, also,
as a series of tetrahedra in which the percentage of the
fifth component varied systematically in the diagrams.
It should be noted that each tetrahedron would cor-
respond to a constant percentage of the fifth compo-
nent andithat the position of a point within a given tetra-
hedron would give only the ratio of percentages of the
first four components. A primary phase region in any
particular tetrahedron would identify the one phase
which crystallized first from a liquid whose composition
lay within the boundaries of that region.
(c) Other Specializing Conditions
In a study of the quaternary system CaO-MgO-
ЗСаО-БЮг-бСаО-ЗААгОз (Fig. 891), McMurdie and
Insley determined the divariant surface representing
the compositions of all liquids that can exist in equi-
librium with MgO and one other solid phase (the lower
level of the primary phase volume of MgO). By
making the MgO component a dependent variable by
considering only the MgO content of the limiting sur-
face, it becomes possible to project this surface, as
contours of constant MgO content, onto the ternary
base of the tetrahedron (Fig. 892); and the representa-
tion is greatly enhanced.
An interesting restricting condition was applied by
Swayze in a study of a portion of the quinary system
CaO-MgO-Al2O3-Fe2O3-SiO2, namely, the system CaO-
5CaO-3A12O3-2CaO Fe2O3-2CaO SiO2 modified by 5%
MgO (Fig. 991). This figure requires careful inter-
pretation. The addition of 5% MgO served to satu-
rate the liquids at or near complete melting; to quote
Swayze: ". . . , a small amount of periclase has been
observed in the MgO-saturated glasses formed by
complete or nearly complete melting of the compositions
studied.” Periclase, therefore, is the primary phase for
the whole tetrahedron of compositions. The volumes
labeled in the figure are the secondary phases, and the
temperature values refer, not to liquidus temperatures,
but to temperatures at which the secondary phases start
to crystallize. The convenient and essential restricting
condition in this case is not the 5% MgO content, per se,
but that only the boundaries between the MgO primary
phase region and the secondary crystallizing phases be
considered. The 5% MgO designated in the figure as
"Edge 95% tetrahedron” is of little significance, ex-
cept to indicate the estimated maximum solubility
of MgO in the compositions studied. Any higher
percentage of MgO in the mixtures would give the same
diagram.
In the graphic representation of multicomponent
systems, no one method can be considered superior to
another. To a large extent a chosen method will de-
pend upon such factors as the exact region to be studied,
the type of information sought, and the detail desired,
as well as upon the actual data obtained. Any scheme
of representation is acceptable which shows the data
with the greatest clarity. It is of utmost importance,
however, that the specializing or restricting conditions
adopted be explicitly and carefully stated, both in the
text and in the legends of the figures. As more and
more phase diagrams of binary and ternary systems are
made available, an increasing emphasis will be placed
on the study of quaternary, quinary, and higher sys-
tems. It seems reasonable to suppose that mathe-
matical expression of the relationships among many
variables must accordingly assume greater importance
in the future as an indispensable complement to the
graphical representation of these complex relationships.
IV. EXPERIMENTAL METHODS FOR HIGH-
TEMPERATURE HETEROGENOUS
EQUILIBRIUM
Several methods of phase equilibrium determination
are possible. All19 have their definite fields of usefulness
and several methods may be needed in different parts of
the same system.
19 Deformation of Seger or similar ceramic cones is not a
method by which phase equilibrium can be determined.
The temperature at which a cone deforms depends on a
number of factors: amount and viscosity of liquid formed,
and rigidity and strength of the cone at the particular
temperature, etc.
29
Graphic Representation
more common methods which are used to represent
graphically such data. The methods, in general,
depend on the judicious choice of specializing conditions
and restrictions, employing the principles already set
forth for binary and ternary systems.
(B) Graphic Representation
(c) Joins
One approach to the study of multicomponent systems
is to determine the phase relations of pertinent joins
within the system. The selected joins, either binary,
ternary, quaternary, etc., may be found to be true
subsystems or most likely pseudo-subsystems.
In the five-component system K2O-CaO-MgO-
Al2O3-SiO2, Bowen and Schairer have found the im-
portant join K20-Al203-4Si02 (Leucite)-CaO MgO •
2SiO2 (Diopside) (Fig. 974) to be a binary subsystem.
All phases appearing in the system can be expressed
in terms of the end-members, and the course of crystal-
lization of any liquid can be traced to completion.
In the system Na2O-CaO-MgO-Al2O3-SiO2, however,
Bowen has shown that the equally important join
CaO-MgO-2SiO2 (Diopside)-Na20-Al203-2Si02 (Ne-
phelite) (Fig. 978) is pseudo-binary. All of the phases
appearing in the system cannot be expressed in terms
of the end-members; and all areas representing more
than two phases in equilibrium are non-binary.
Courses of crystallization can be partially traced for
the binary portions of the liquidus curve, but invariant
points, showing final products of crystallization, lie
outside the plane of the figure.
Similarly, in the quaternary system CaO-MgO-
Al4Os-SiO2 the join MgO-Al2O3-2CaO -Si0r-2Ca0 -
Al2O»-Si02 (Fig. 919) is a ternary system. Within the
same quaternary system, the join CaO • MgO • 2SiC>2-
2MgO SiO2-CaO-Al2O3-2SiO2 (Fig. 909) is not a
ternary system because of the appearance of spinel
(MgO-Al2O3), whose composition lies outside the join.
Courses of crystallization which do not enter the spinel
field can be traced.
Equilibrium relations in a single ternary join of a
quaternary system can only provide limited informa-
tion about the quaternary system. The study of
several selected joins, of course, gives additional in-
formation.. Such a procedure was used by Greene
and Bogue in studying four composition planes
(joins) in the system Na2O-CaO-Al2O3-SiO2 (Figs. 828
and 829). If, however, the significant portions of a
system be divided by joins into lesser tetrahedra, and
the equilibrium relations for the four ternary joins
forming each tetrahedron be determined, then consider-
able information about the quaternary relations may
be derived. The principle of this method is illustrated
in Fig. 894 which shows relations in the quaternary
join 2MgO-SiO2 (Forsterite)-Ca0-Mg0-2Si02 (Diop-
side)-CaO-Al2O5-2SiO2 (Anorthite)-Si02 (Silica), part
of the quaternary system CaO-MgO-A12O3-SiO2.
Univariant curves, along which three crystalline phases
and liquid are in equilibrium, intersect the ternary
joins at points. Such points may be of two general
types: ternary invariant points, either eutectic or
peritectic, if ternary relations obtain; or "piercing
points,” according to the nomenclature of J. F.
Schairer,18 * if ternary relations do not apply. The
sketch in Fig. 894 is conveniently simple from the stand-
point that no quaternary invariant points are present.
The univariant curves all originate and end in the points
in the faces of the tetrahedron (see lower part of figure
and explanation).
A more complicated example is shown in Fig. 873, for
the quaternary join FeO-CaO- ЗгОг-ЗСаО • SiO2-2CaO •
A12O3-SiO2 in the quaternary system CaO-FeO-A12O3-
SiO2. The data of primary interest regarding quater-
nary equilibrium relations are the compositions and
temperatures at the invariant points. These can be
estimated from the compositions and temperatures of
the invariant points and “piercing points” on the faces
of the tetrahedron and from the direction of temperature
drop along the quaternary univariant curves originat-
ing from these points. The maximum temperature on
a univariant curve, as discussed earlier, is at its inter-
section (or a projected intersection) with the appropri-
ate composition triangle. Therefore, with one ex-
ception the temperature decreases along a univariant
curve as it proceeds from a ternary invariant point in
the face of a join to a quaternary invariant point. In
the one exception, however, the temperature may rise if
within the tetrahedron solid solutions exist between one
or more substances not present at the ternary invariant
point and the three solid phases present along the uni-
variant curve. The temperature may rise or fall along
a univariant curve penetrating the interior of a tetra-
hedron from a piercing point. A piercing point by
definition is not an invariant point and can only lie
in a join other than the one defined by the compositions
of the three solid phases in equilibrium with liquids
represented by the univariant line. The diagram
in the lower part of Fig. 873 indicates schematically,
after the method of Schairer,18 the relationships be-
tween uni variant curves and invariant points existing
in the system. It should be emphasized that the dia-
gram does not depict spatial relations of the univariant
curves within the tetrahedron and that the lengths of
the univariant curves (shown as straight lines) are
arbitrary and without significance. Additional ac-
curacy in locating the compositions and temperatures of
the invariant points may be seemed by the study of
selected quaternary mixtures.
(fc) Sections
Another general approach which has been used in the
study of multicomponent systems is the section method.
Sections may be isothermal, in which case temperature
is constant, or they may be planes through a system
at constant percentages of one or more of the compo-
nents.
(i) Isothermal: The phase relations at four differ-
ent temperatures in a quaternary section NajO-SiOr-
CaO-SiO2-Na2O-Al203-2Si02-Ca0-Al2O3-2SiO2 of the
18 J. F. Schairer, “The System CaO-FeO-Al2O$-SiO2:
I, Results of Quenching Experiments on Five Joins,” J.
Am. Ceram. Soc.. 25,241-73 (1942).
28
Experimental Methods
Methods of determination may be divided into two
general classes: the static and the dynamic. Static
methods are those in which the temperature of the
sample is held constant until equilibrium is attained. The
fractionation method and the quenching method are two
examples. The dynamic methods are those in which
phase changes causing heat effects are indicated by an
arrest in temperature change within the sample during
uniform heating or cooling.
In systems where equilibrium is reached quickly,
such as systems of metallic components, the dynamic
methods are the most satisfactory. In systems where
equilibrium is sluggish, because of high viscosity in the
liquids or of low “crystallization potential” of the solids,
the dynamic methods are unusable and it is necessary
to resort to the static methods.
The most useful of the static methods is the quench-
ing method since it permits the use of small samples.
This procedure was developed for use in the silicate sys-
tems at the Geophysical Laboratory and the apparatus
is described in several publications.20 A small sample
of homogeneous character having a known composition
within the system under consideration is enclosed in a
suitable container (usually an envelope of platinum foil
or other chemically inert, high-melting metal) and
heated at the desired temperature until equilibrium is
established. The sample is then rapidly quenched
from that temperature by dropping it instantaneously
into a liquid at low temperature and the equilibrium
conditions prevailing at the high temperature are
“frozen.” In other words, solid phases present at the
high temperature are retained, perhaps metastably, at
ordinary temperatures; phases which are liquids at
high temperatures exist as glasses at low temperatures.
Phases are identified by microscopic means or by crystal
diffraction methods. The quenching method is appli-
cable only to systems where changes are sufficiently
sluggish to prevent transitions during quenching. The
method has the great advantage that phases solid at
the equilibrium temperature may be identified at room
temperatures by their physical and optical properties.
If it is found that the sample contains more than one
crystalline phase, a sample of the same composition is
heated to a higher temperature, quenched and exam-
ined. If this quenched charge contains only one crys-
talline phase, which in this case is called the primary
phase for that part of the system, the process is re-
peated until a temperature is found at which the pri-
mary phase disappears and leaves only liquid (glass at
room temperature). This temperature and composi-
tion locate a point on the melting curve of the system
investigated. Another static method of determining
equilibrium diagrams is by fractionation in which the
phases are separated mechanically at the equilibrium
temperature and individually analyzed. In ternary
systems containing solid solutions, Bowen21 has shown
how the results obtained under conditions of perfect
fractionation, where the solids already crystallized have
no opportunity of reacting with the liquid, can be used
to determine the phase relations under conditions of
perfect equilibrium. While the fractionation method is
very useful in phase studies in aqueous systems or
systems at ordinary temperatures, it presents great
difficulties in nonaqueous systems at high temperatures
where liquids are often of high viscosity and where
it is difficult to prevent the erosion of filtering agencies
such as screens.
However, even such difficulties have been partially
overcome by the use of a high-temperature centrifuge
developed by Newkirk.22 With this equipment a
charge is centrifuged within the furnace, after having
been heated at a desired temperature sufficiently long
for equilibrium conditions to prevai’ Liquid is sepa-
rated from solid by forced filtration . 'ough a platinum
sponge filter contained in the small platinum sample
holder. The liquid can then be analyzed chemically
by micro methods. Applying this method to a multi-
component system, it is possible to determine the path
of crystallization of a particular composition from liqui-
dus to invariant point, without prior knowledge of the
location of invariant points or primary phase boundaries.
Heating and cooling curves are the usual dynamic
methods of determining phase diagrams. In these,
time-temperature determinations for each sample
tested are plotted. Every temperature arrest indicates
a phase change, that is, the final disappearance or the
first appearance of a phase during temperature change.
The length of time of the arrest is an indication of the
relative amount of the phase changed at that tempera-
ture.
A refinement of the time-temperature method called
differential thermal analysis (DTA) is more sensitive to
phase changes, as measured by the heat effects. In
DTA the experimental sample and a standard inert
sample, usually Al2Os powder, are heated simulta-
neously according to a prescribed schedule, generally
about 10°C. per minute. Thermocouples inserted
into both samples are so connected that measurements
can be made of both the actual temperature and the
differential temperature (in mv.) between the standard
and the experimental samples. As long as no phase
change occurs, the differential in temperature remains
relatively constant, but a temperature arrest or ac-
celeration within the experimental sample, indicating a
phase change, is reflected by a sharp change in differ-
ential.
Heating and cooling methods are suited to the study
of systems which reach equilibrium rapidly and where
the heat effect of transitions is large. Even in such
systems, however, they have the disadvantage that the
phases stable at high temperatures cannot be retained
20 (ffi) H. S. Roberts, “Automatic Control of Labora-
atory Furnaces by Wheatstone Bridge Method,” J. Wash.
Acad. Sci., 11,401(1921).
(b) G. W. Morey, “Comparison of Heating Curves
and Quenching Methods of Melting-Point Determina-
tions,” ibid., 13, 325-29 (1923).
21 N. L. Bowen, “Certain Singular Points on Crystalli-
zation Curves of Solid Solutions,” Proc. Nat. Acad. Sci.,
27,301-309(1941).
22 See R. H., Bogue, under “Silicate Chemistry” in
Selected Bibliography, Part V.
30