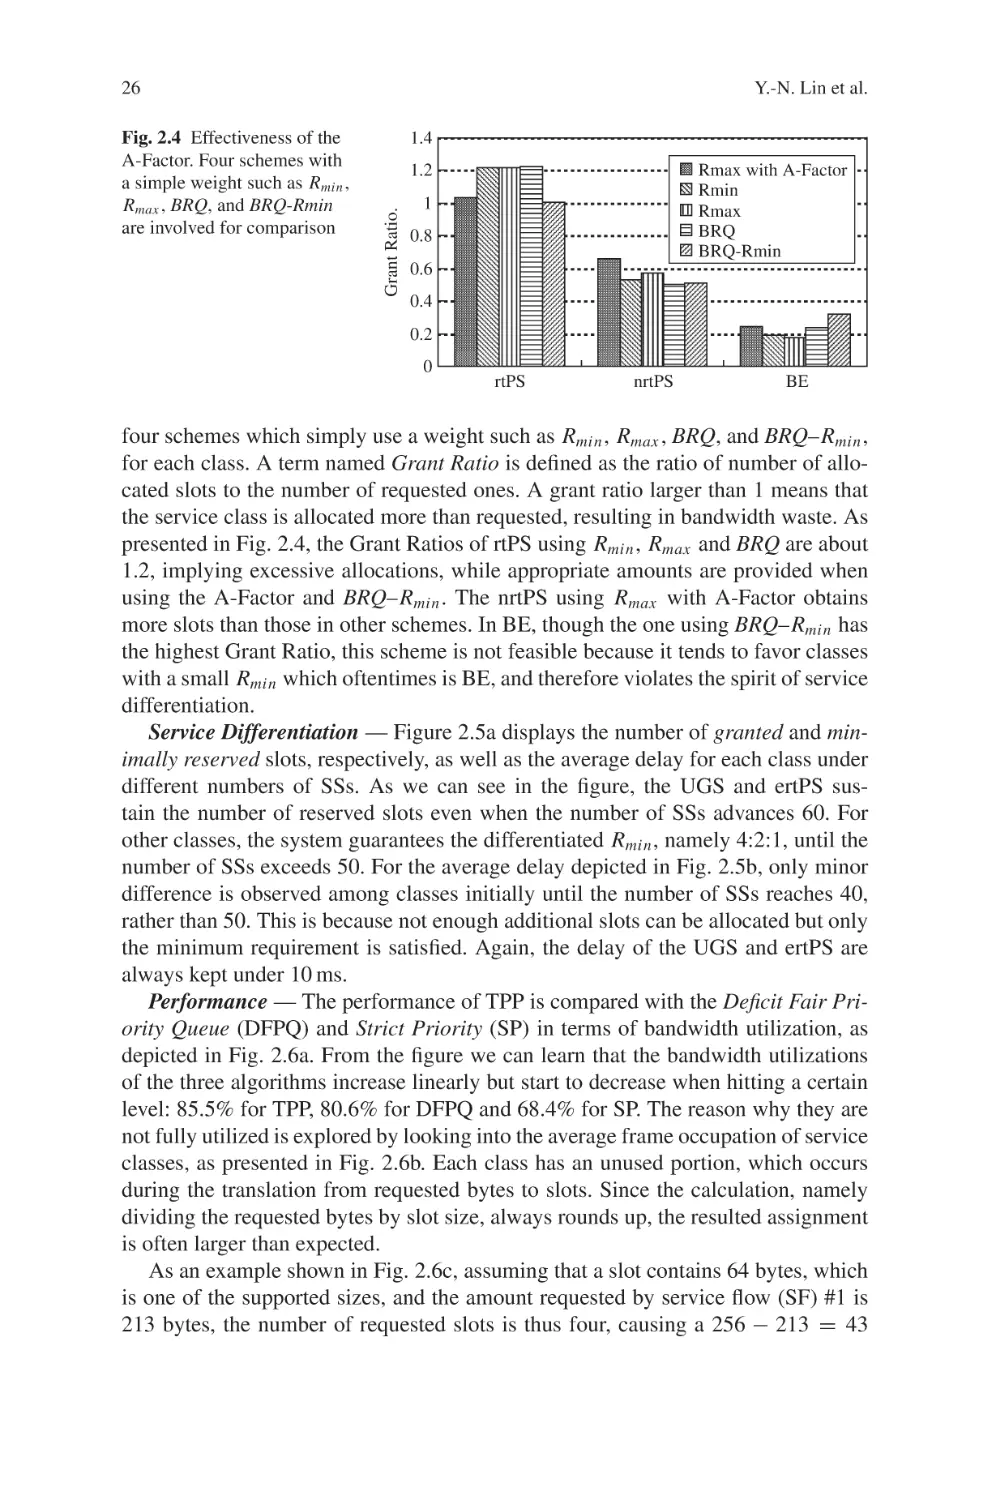
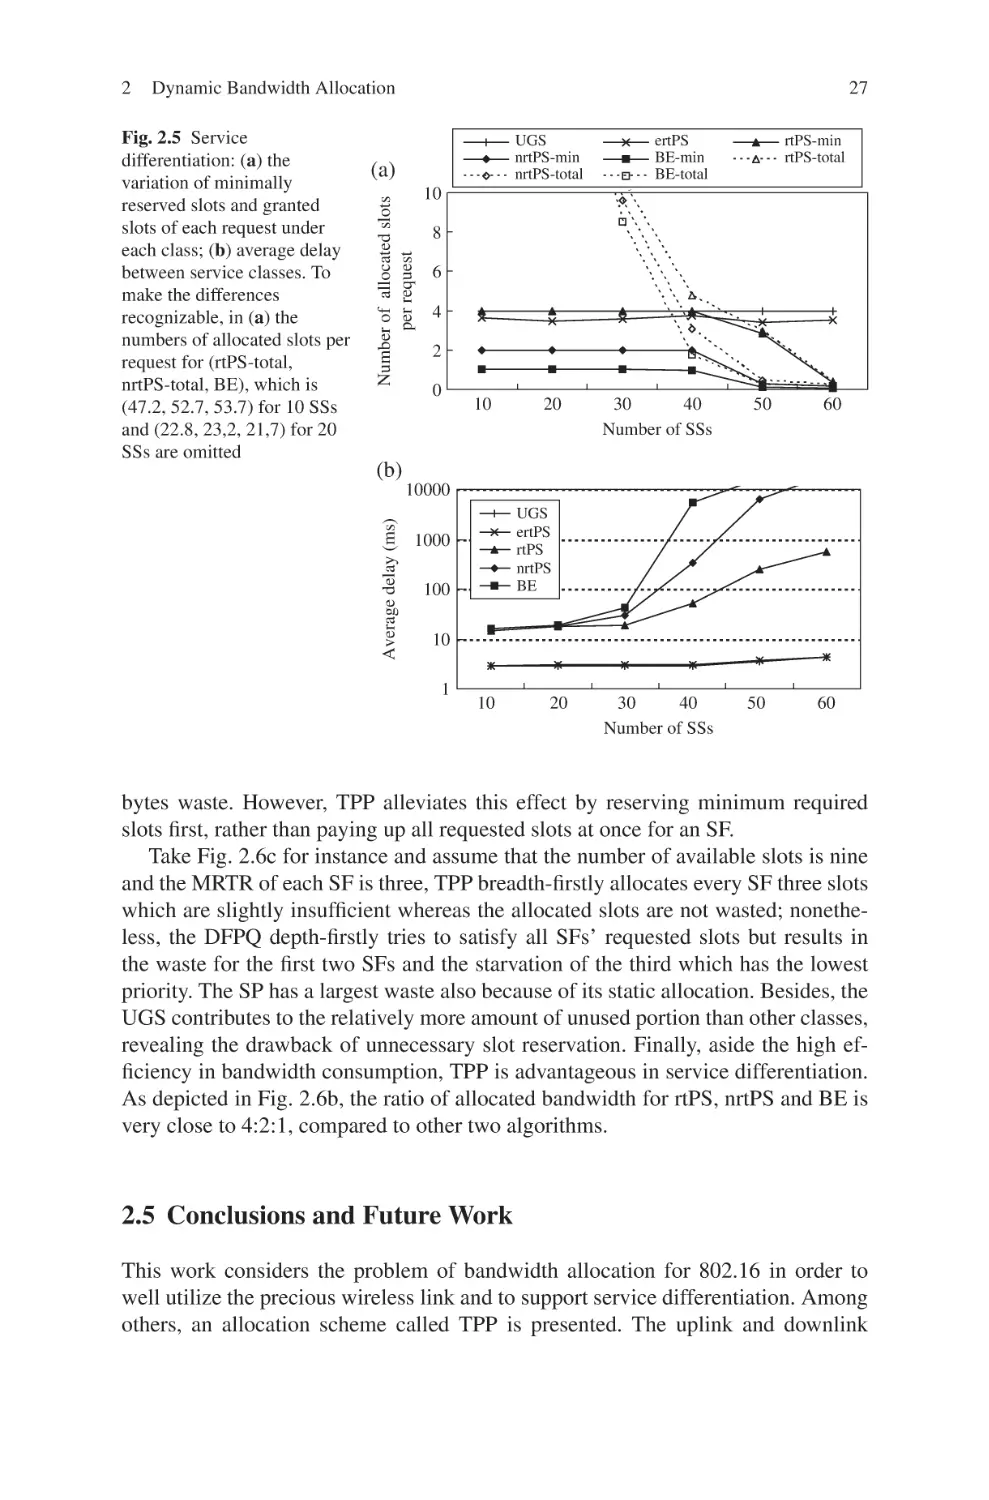
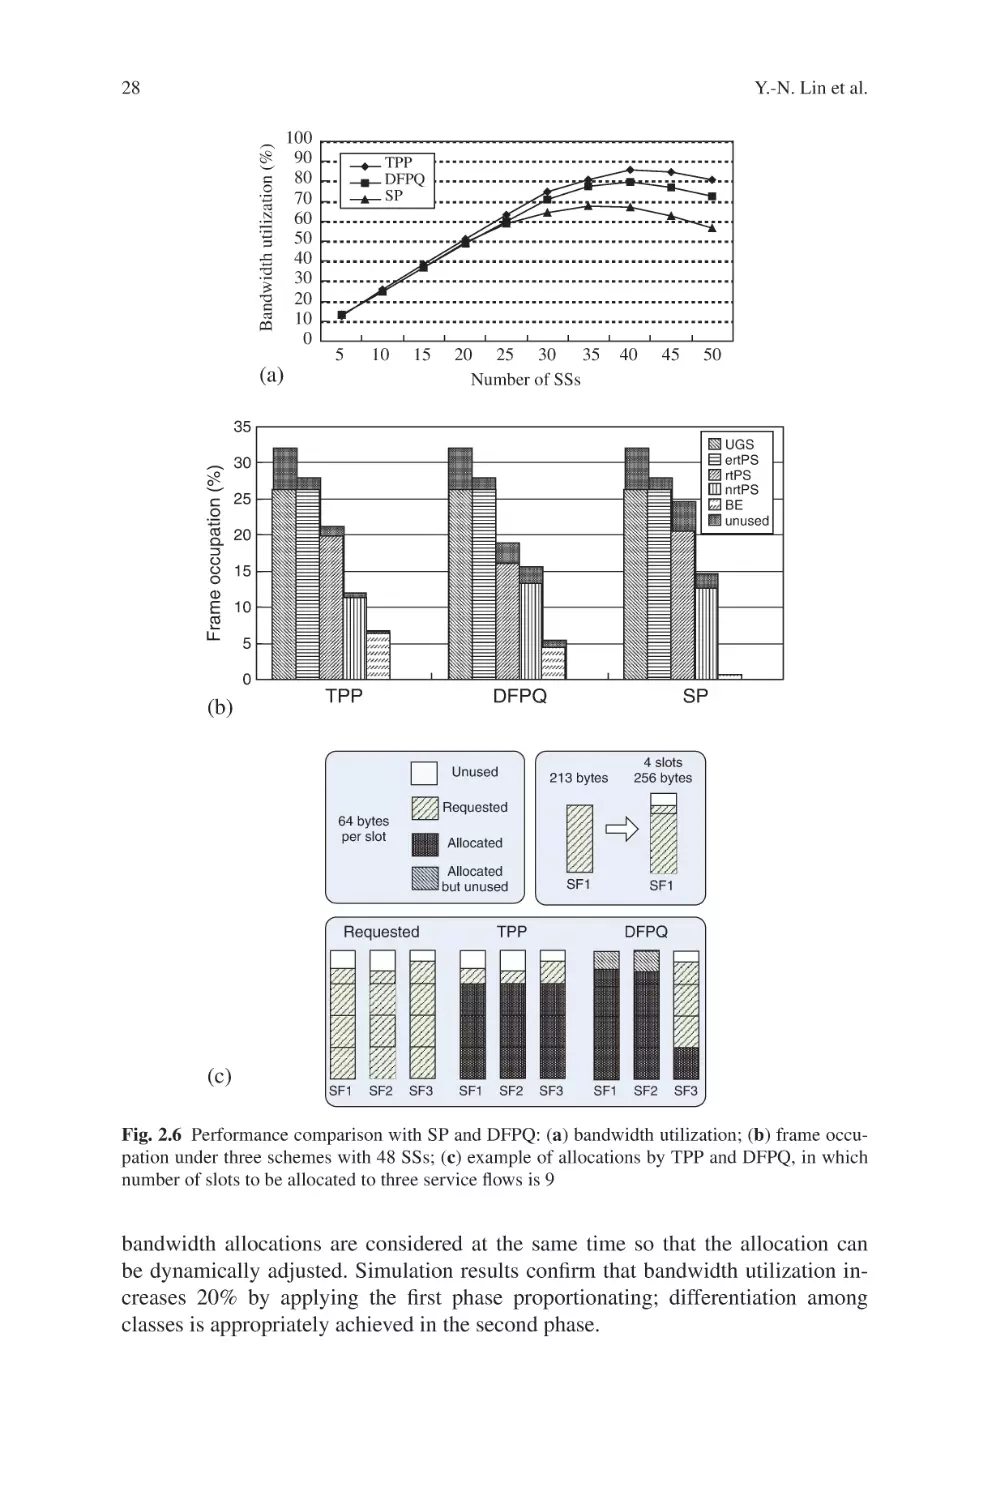
/


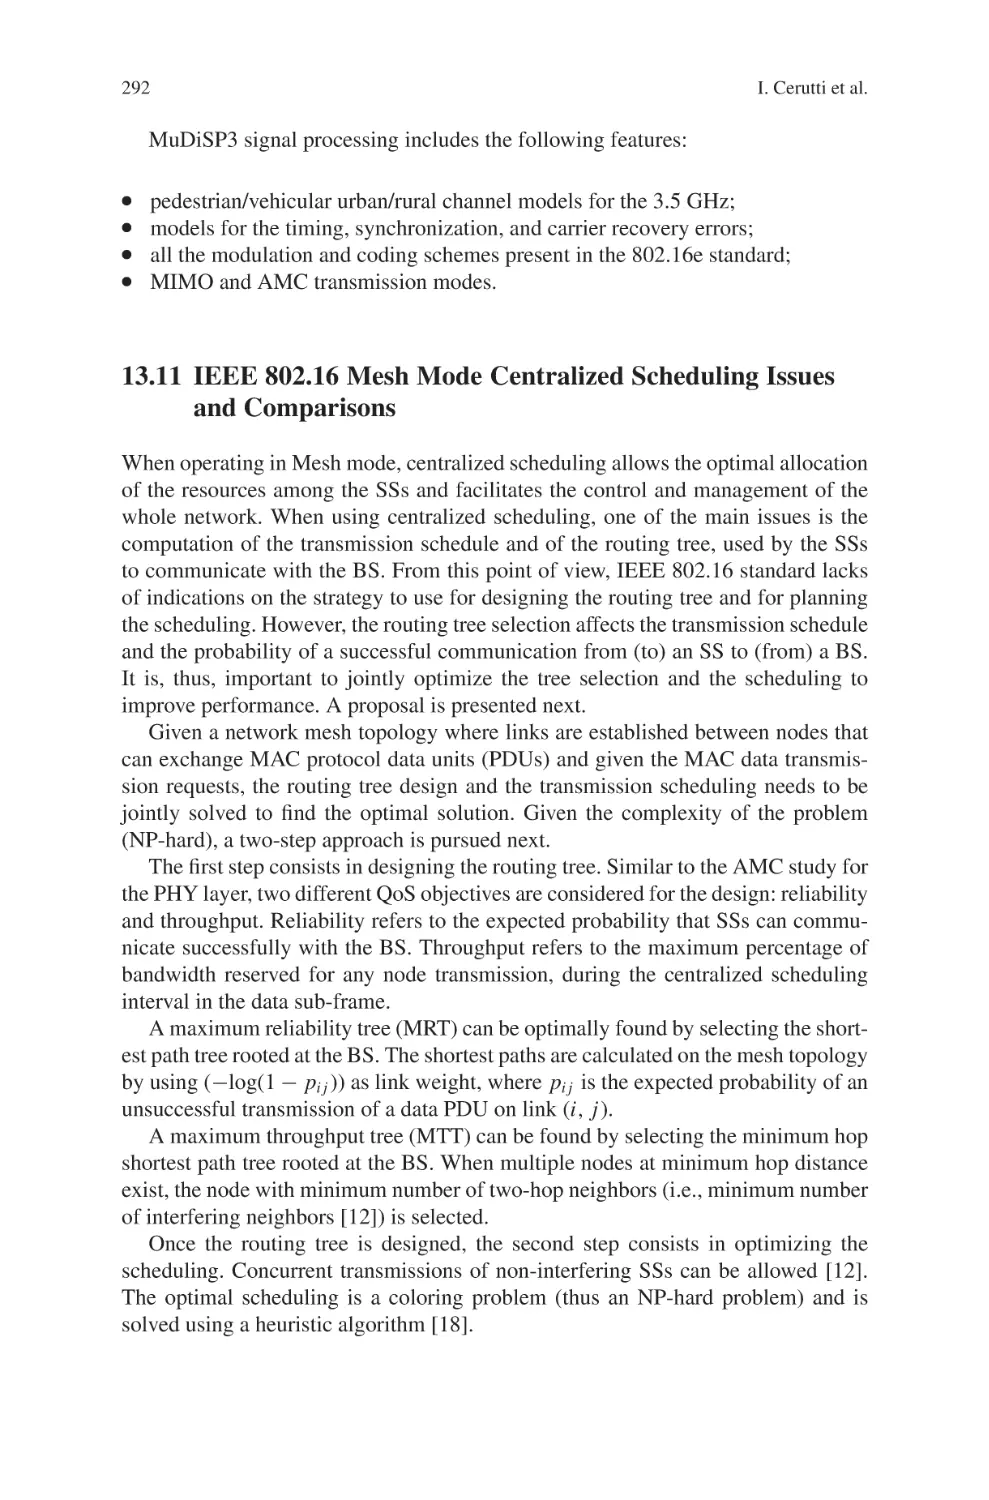
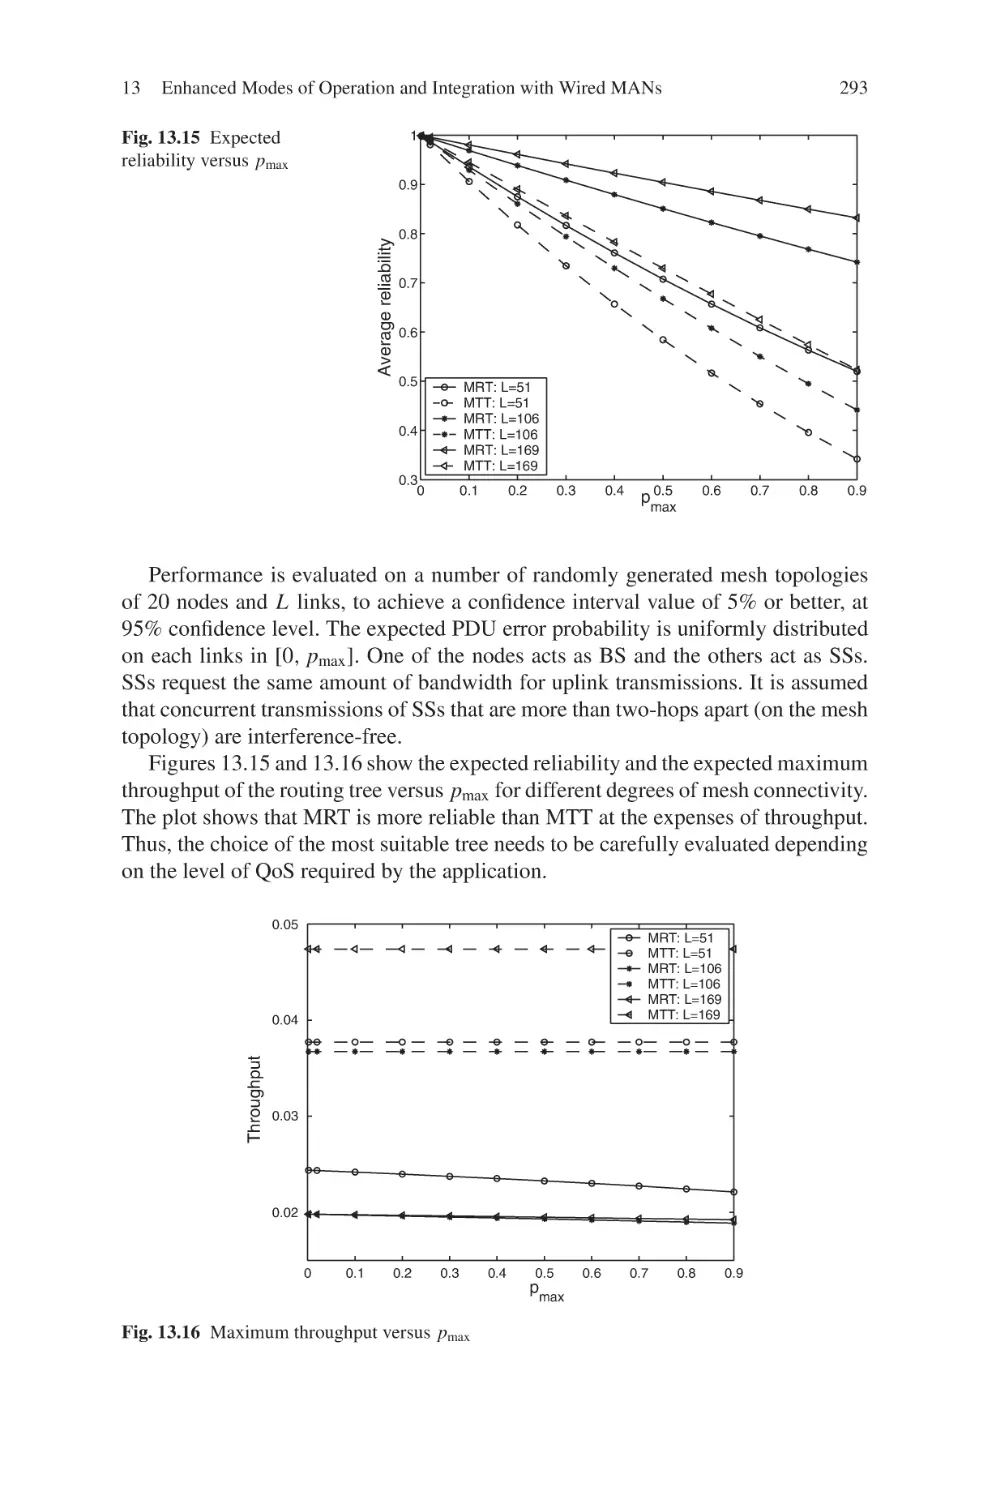
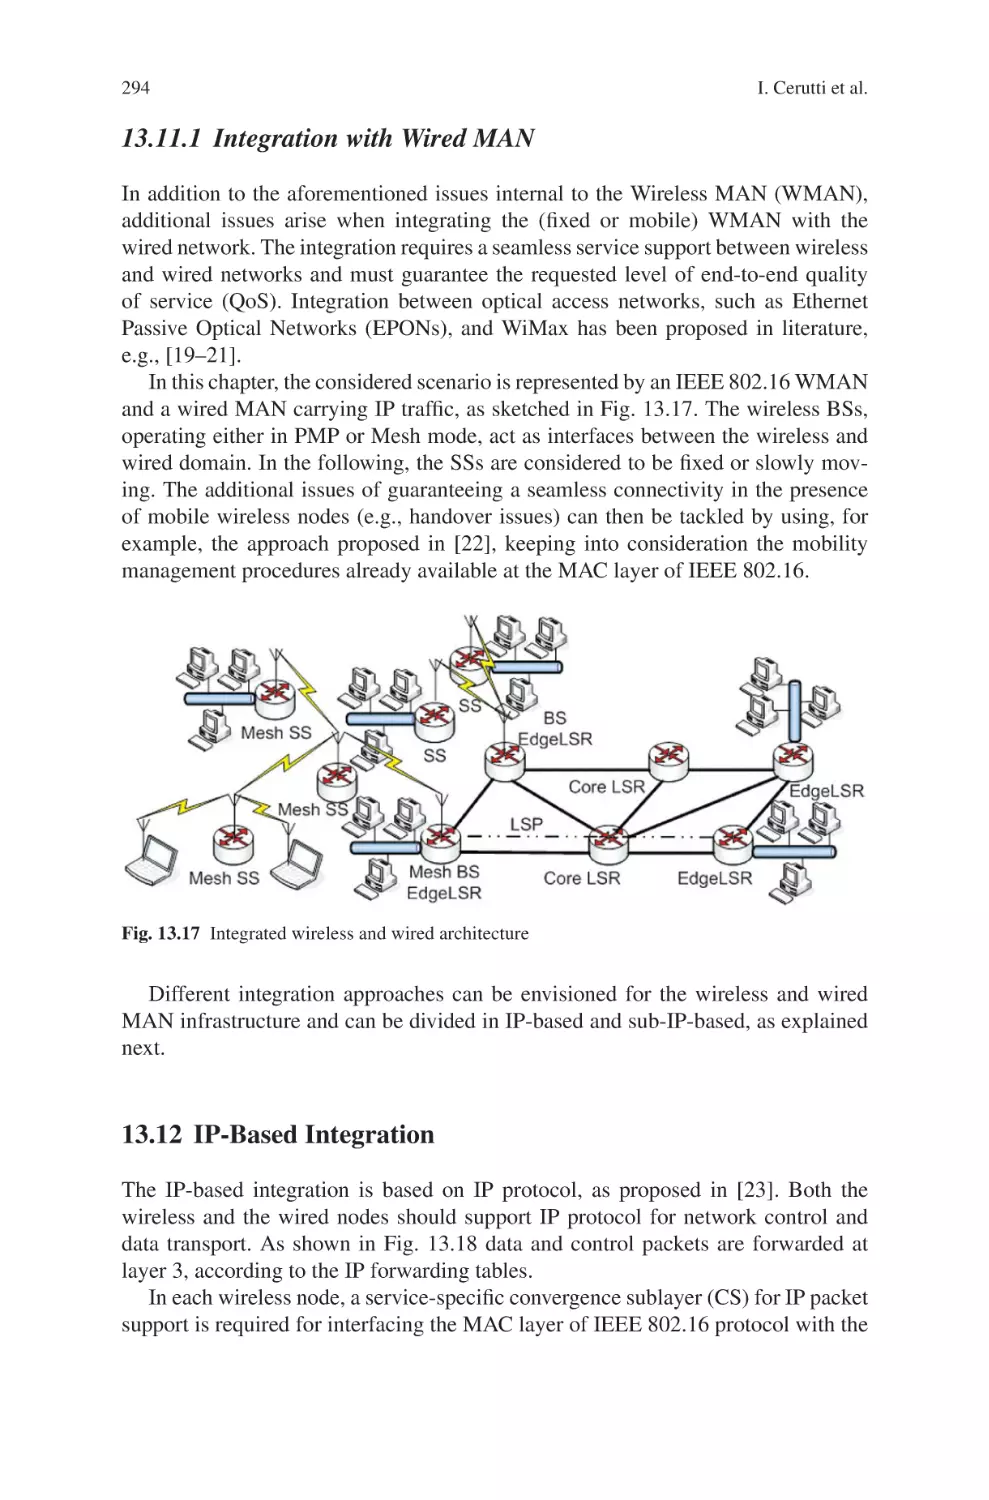
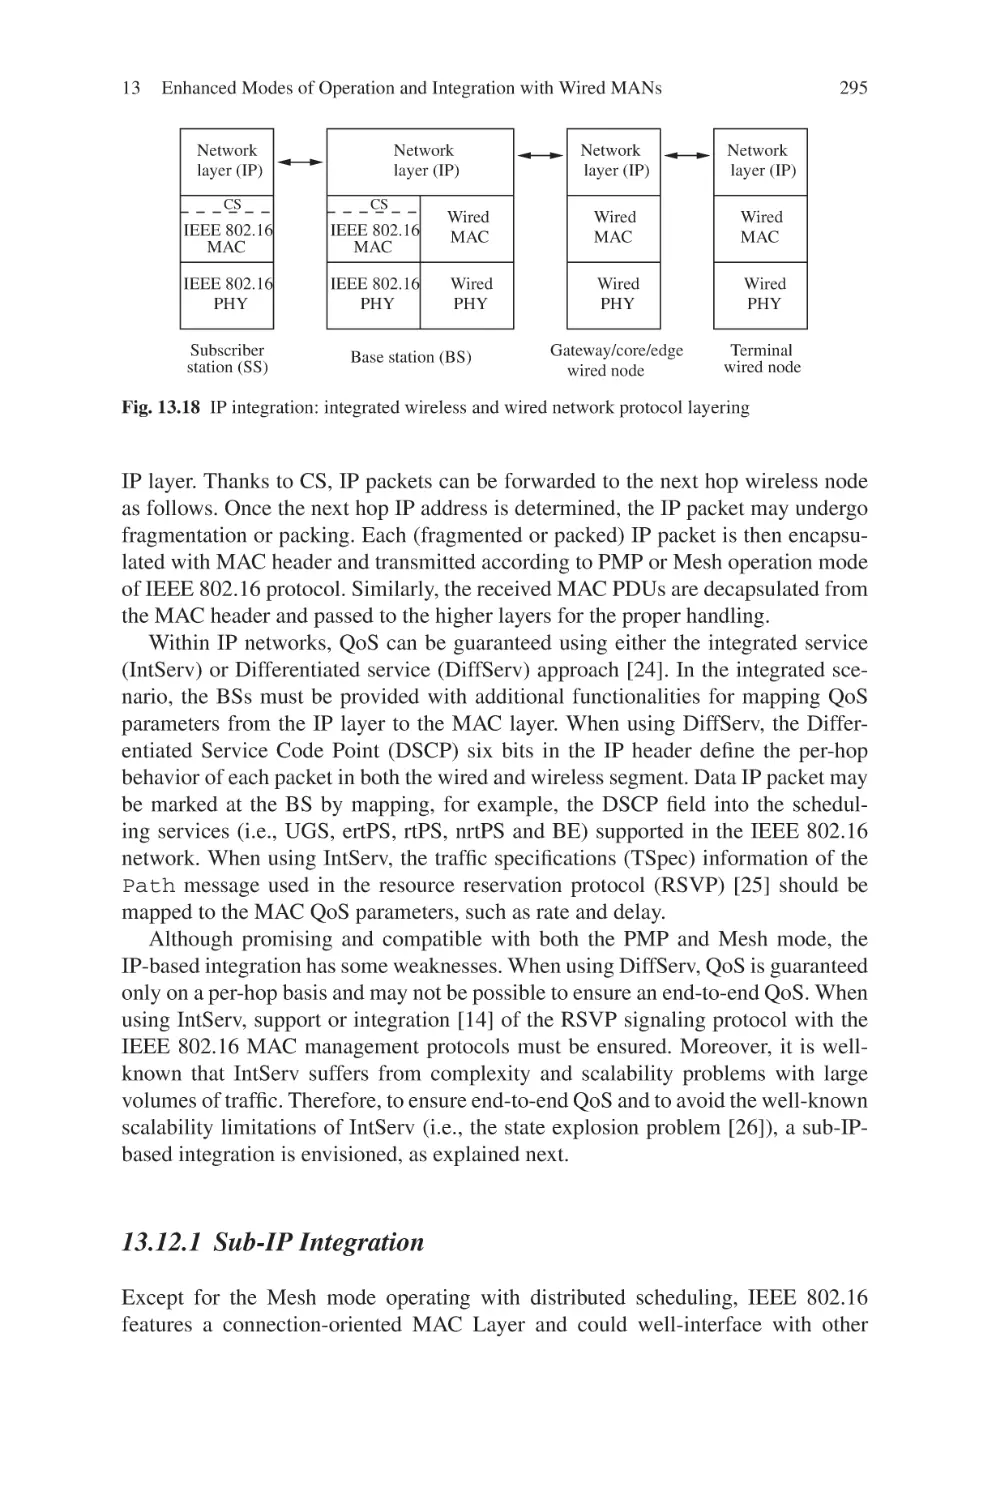


Текст
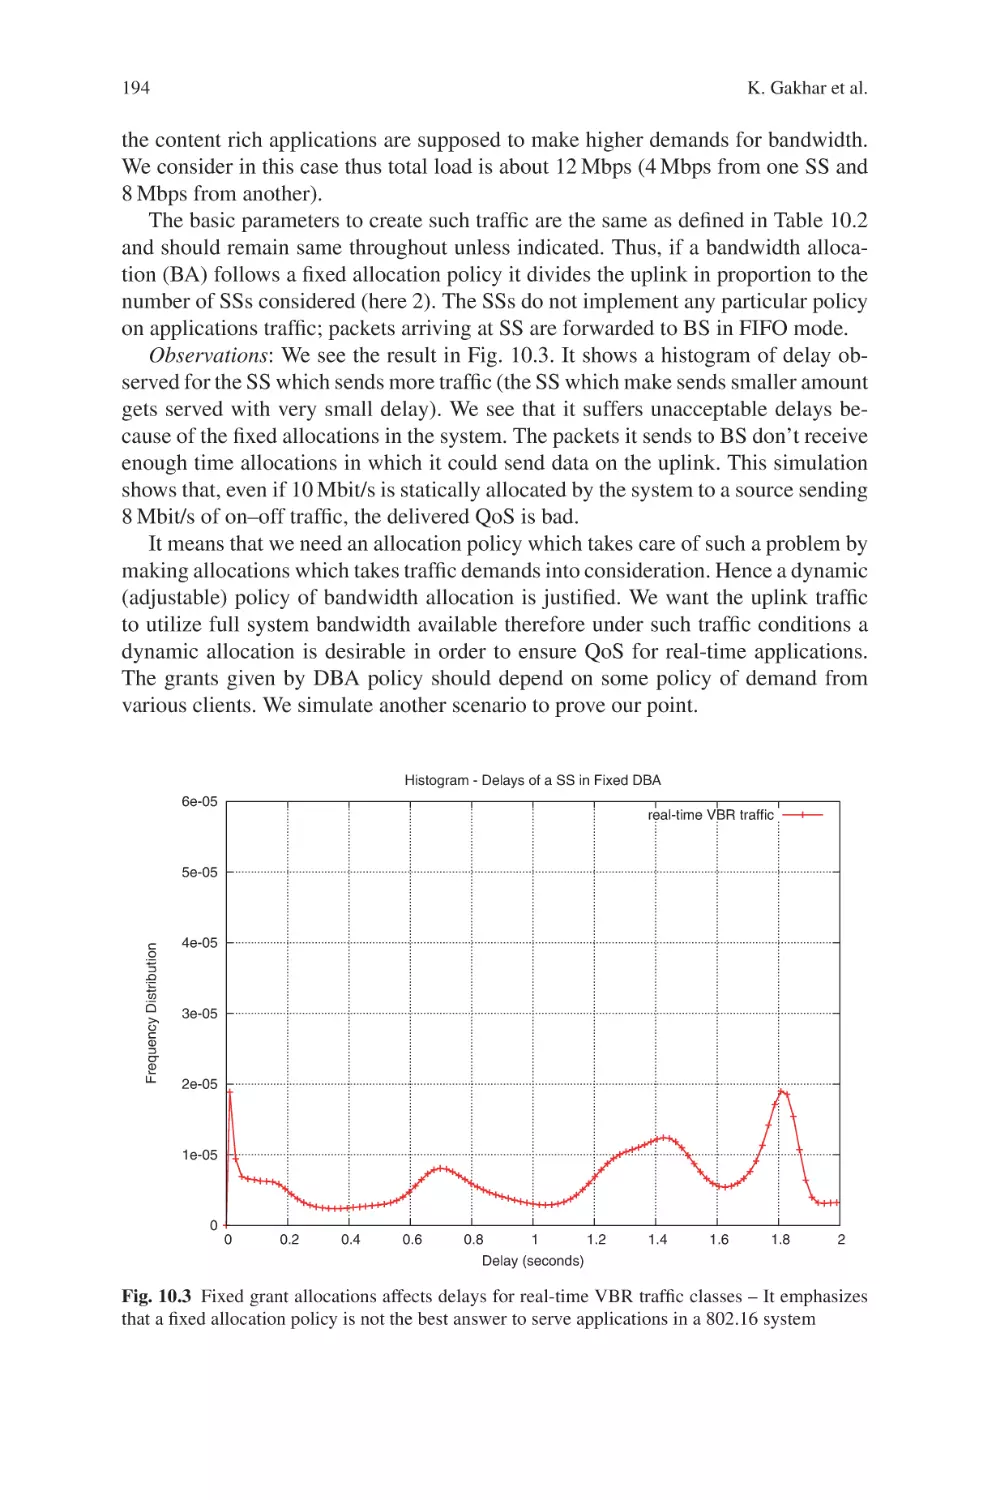
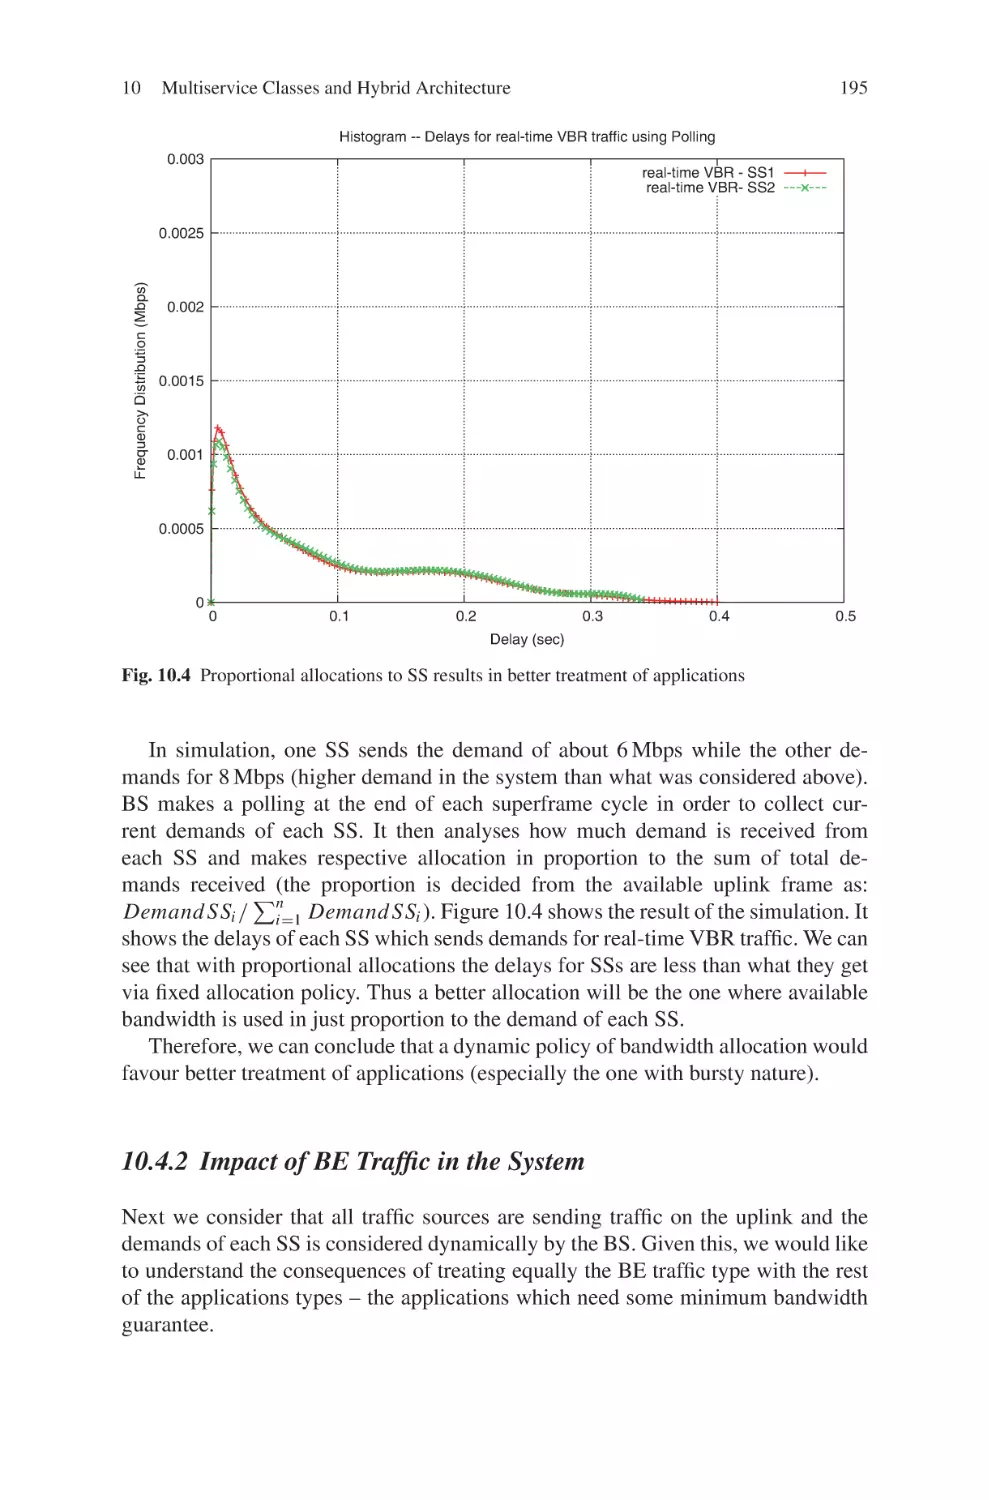
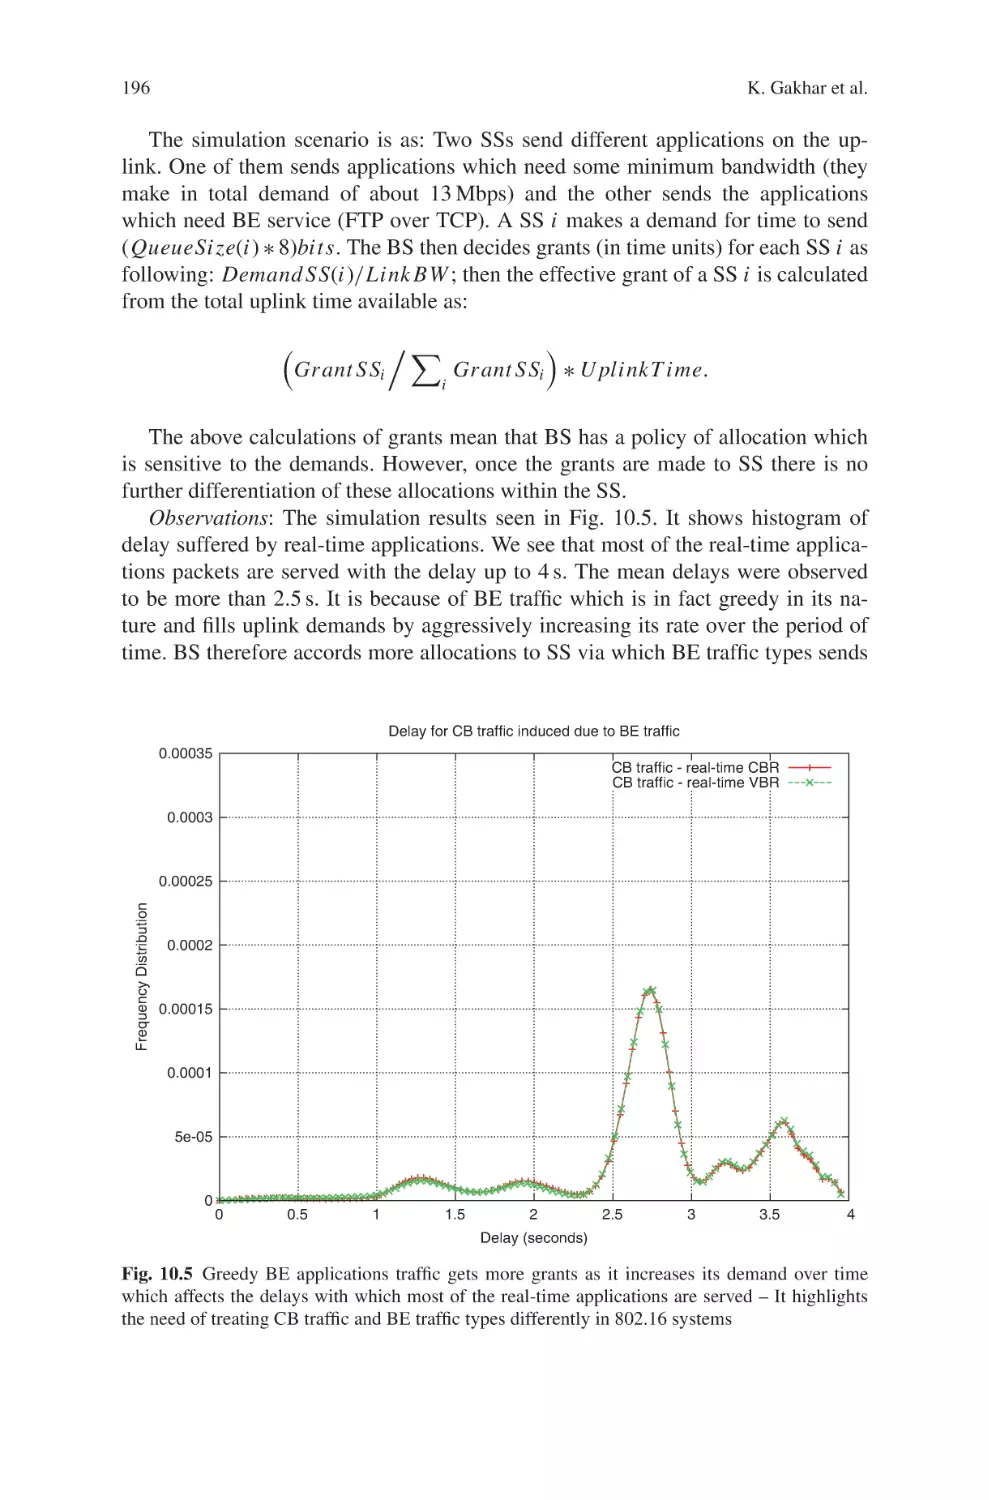
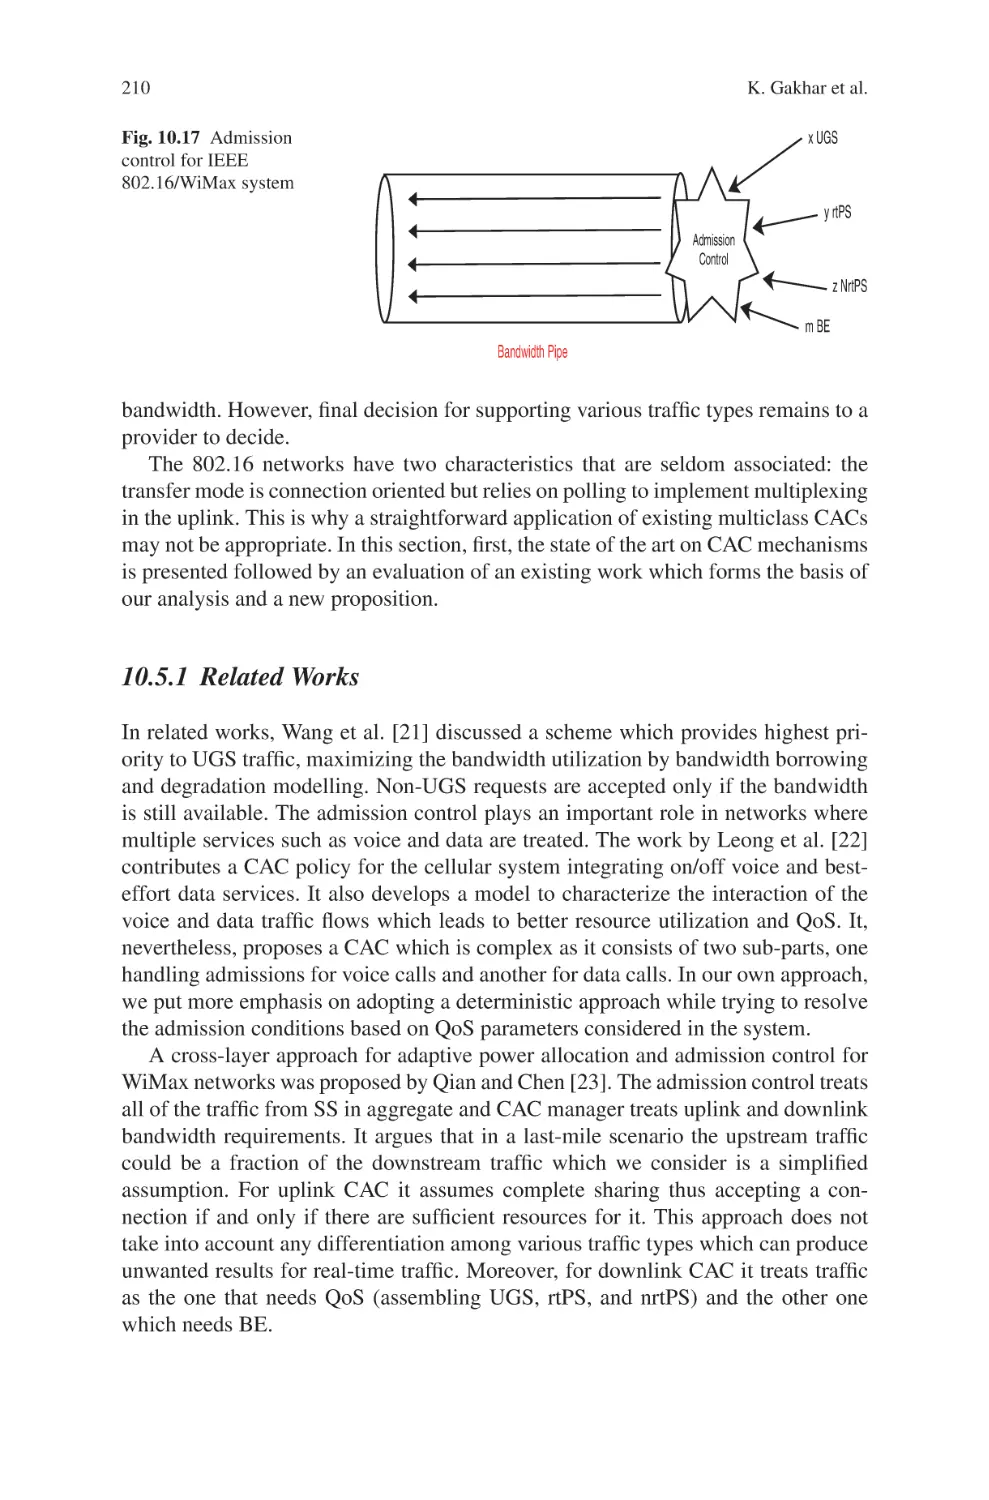
Current Technology Developments
of WiMax Systems
Maode Ma
Editor
Current Technology
Developments of WiMax
Systems
123
Editor
Dr. Maode Ma
Nanyang Technological University
School of Electrical & Electronic Engineering
50 Nanyang Avenue
Singapore 639798
Singapore
ISBN: 978-1-4020-9299-2
e-ISBN: 978-1-4020-9300-5
DOI 10.1007/978-1-4020-9300-5
Library of Congress Control Number: 2008936718
Springer Science+Business Media B.V. 2009
No part of this work may be reproduced, stored in a retrieval system, or transmitted
in any form or by any means, electronic, mechanical, photocopying, microfilming, recording
or otherwise, without written permission from the Publisher, with the exception
of any material supplied specifically for the purpose of being entered
and executed on a computer system, for exclusive use by the purchaser of the work.
c
Printed on acid-free paper
9 8 7 6 5 4 3 2 1
springer.com
Preface
Recent developments on wireless communication technology have resulted in
tremendous innovations to make broadband wireless networks able to compete with
3G cellular network. IEEE 802.16X standards have not only specified WiMax wireless access networks but also designed a framework of wireless metropolitan area
networks with mobility functionality. It is obvious that with further development of
various WiMax technologies, wide range of high-quality, flexible wireless mobile
applications and services could be provided, which will revolutionarily improve our
modern life to achieve the goal of accessing the global information at any place and
at any time by any mobile devices in the near future.
WiMax technology is the most promising global telecommunication technology
recently. WiMax technology and various WiMax networks are specified by the IEEE
802.16X standards, which define the Medium Access Control (MAC) layer and
the Physical (PHY) layer of fixed and mobile broadband wireless access systems.
This edited book has been produced by many contributors who have much knowledge of the standards and rich teaching and/or research experience of the WiMax
technology. This edited book is intended to be a comprehensive reference book
to address the recent developments of WiMax technologies for both academia and
industry. It can serve as an introduction book for beginners to get the fundamental
knowledge of various aspects of WiMax systems. It is also expected to be a good
reference for researchers and engineers to understand the recent developments of
the technology in order to promote further development of WiMax technologies
and systems.
The book consists of 13 chapters. Each of the chapters is either a technical
overview or literature survey on a particular topic or a proposed solution to a research issue of Wimax technology. The 13 chapters can be roughly classified into 3
parts. The first part is major on the fundamental issues in WiMax point-to-multipoint
(PMP) topology, consisting of Chapter 1 to Chapter 7. Chapter 1 addresses the
deployment of multi-antenna base stations in WiMax systems and corresponding
design of signal processing algorithms for interference mitigation involved in the
deployment. Two main solutions have been proposed for interference management
at the physical layer of WiMax systems. Chapter 2 presents a general background
introduction on various dynamic bandwidth allocation schemes and introduces a
Two-Phase Proportionating (TPP) algorithm as a solution to achieve a feasible dyv
vi
Preface
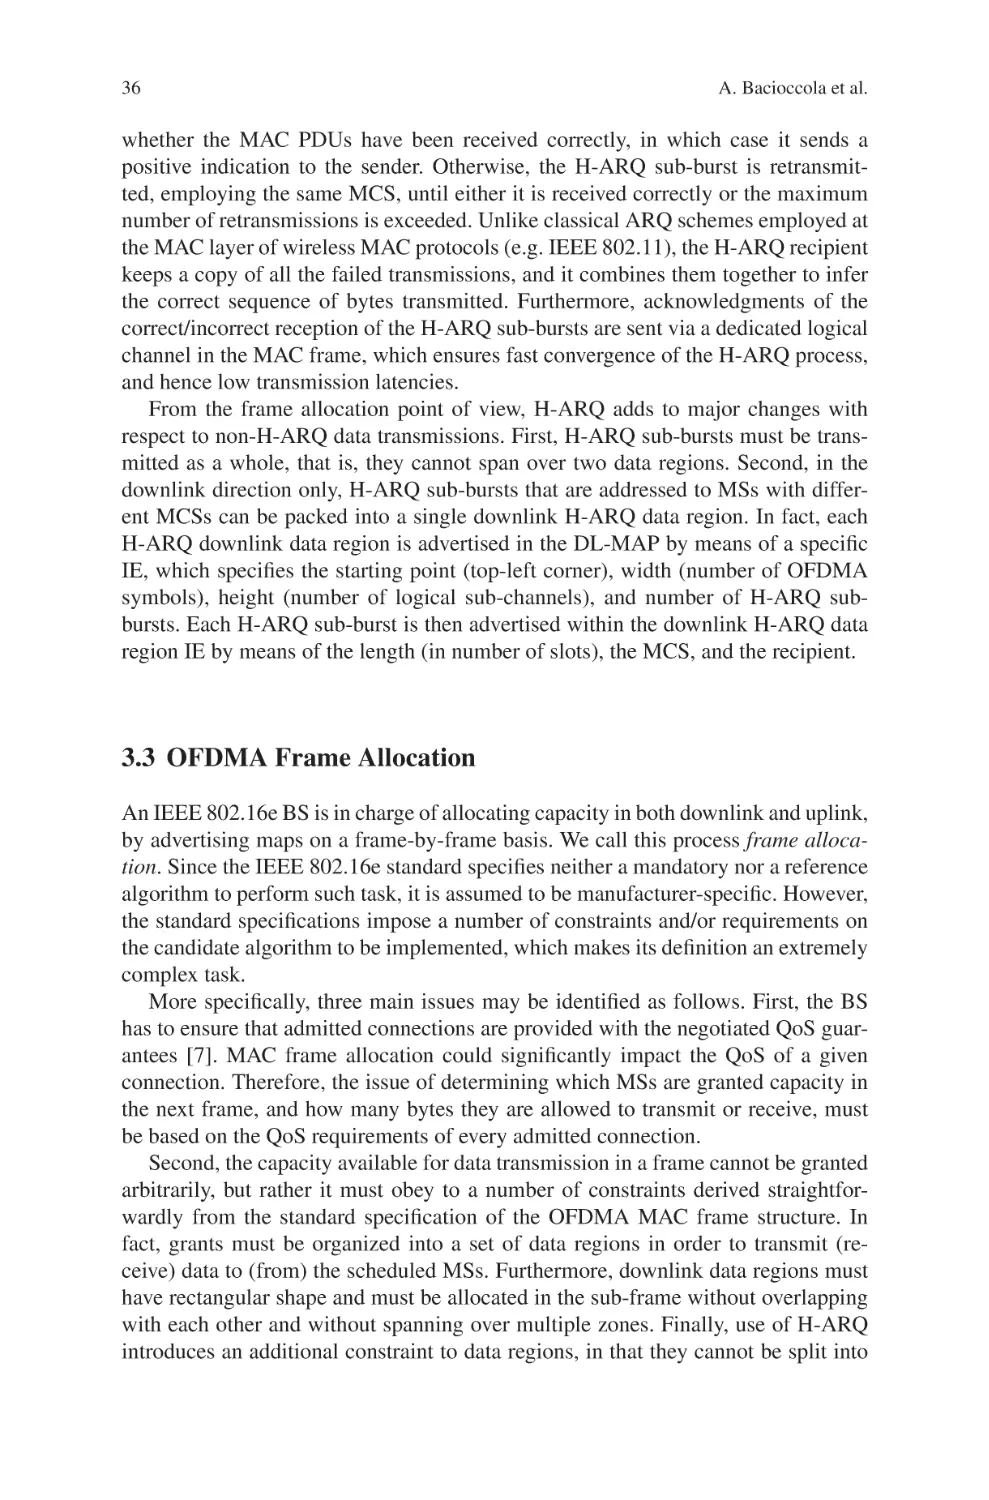
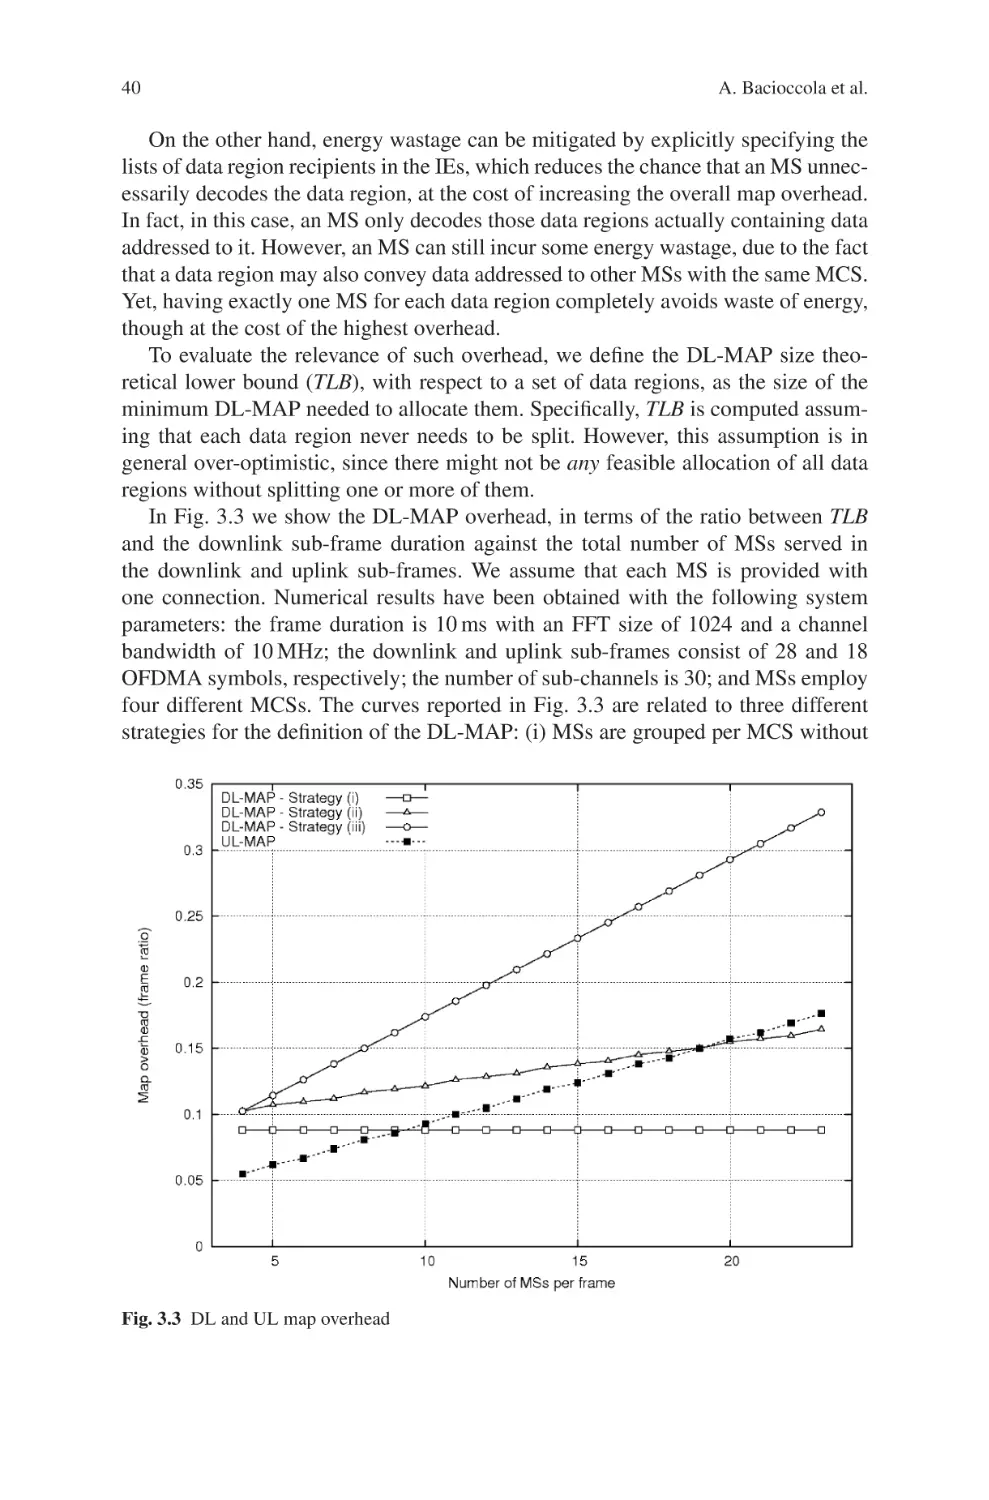
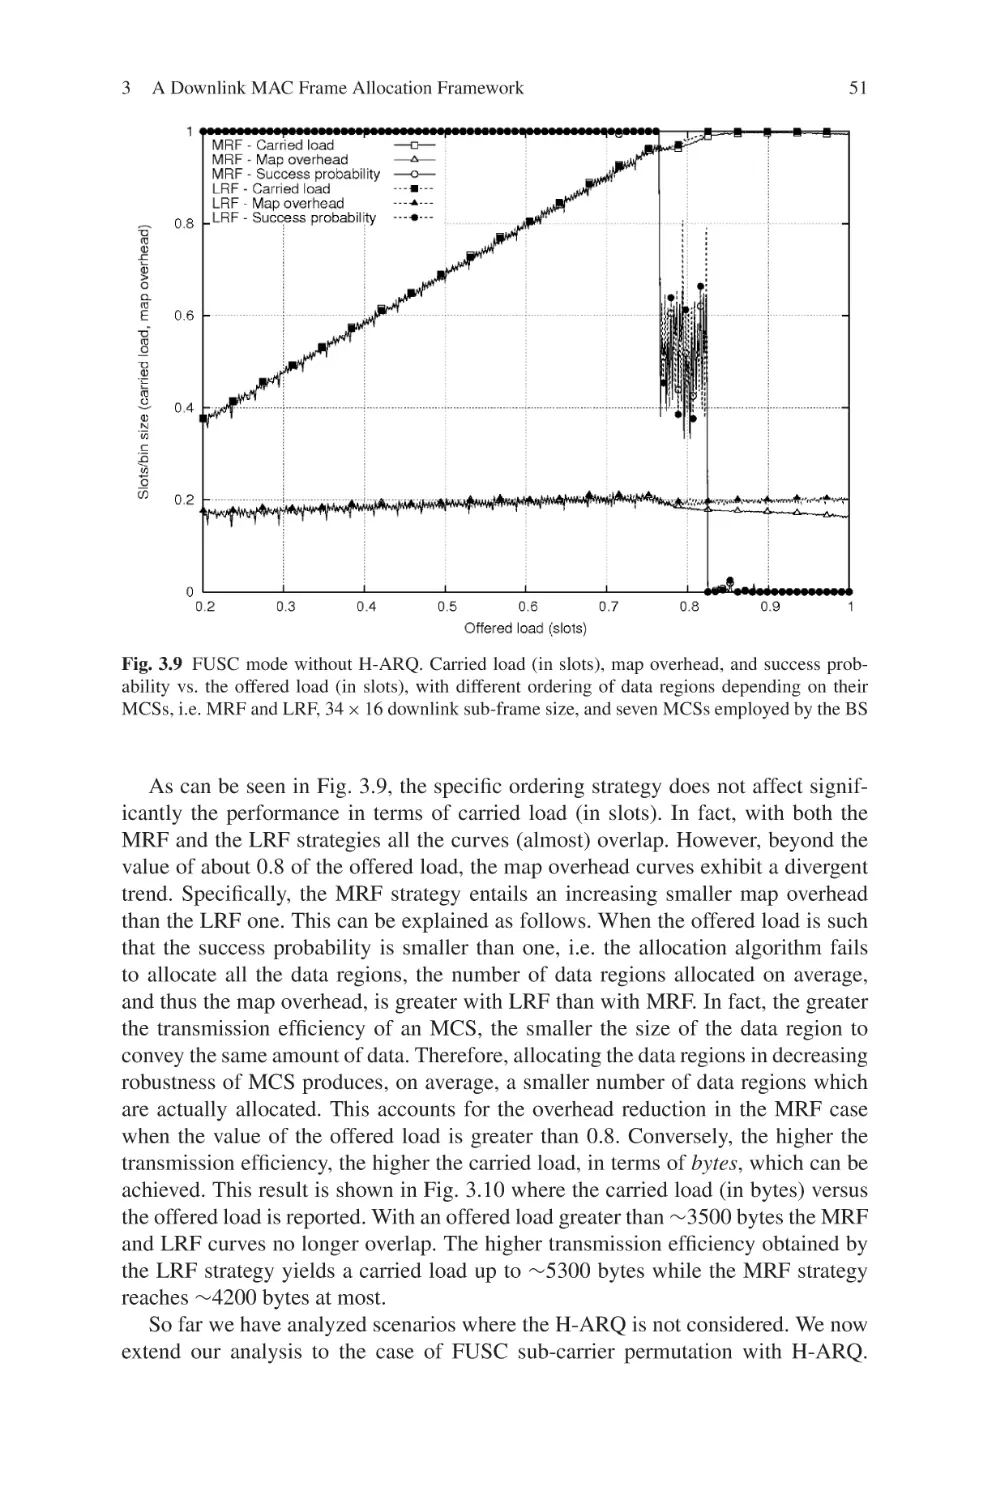
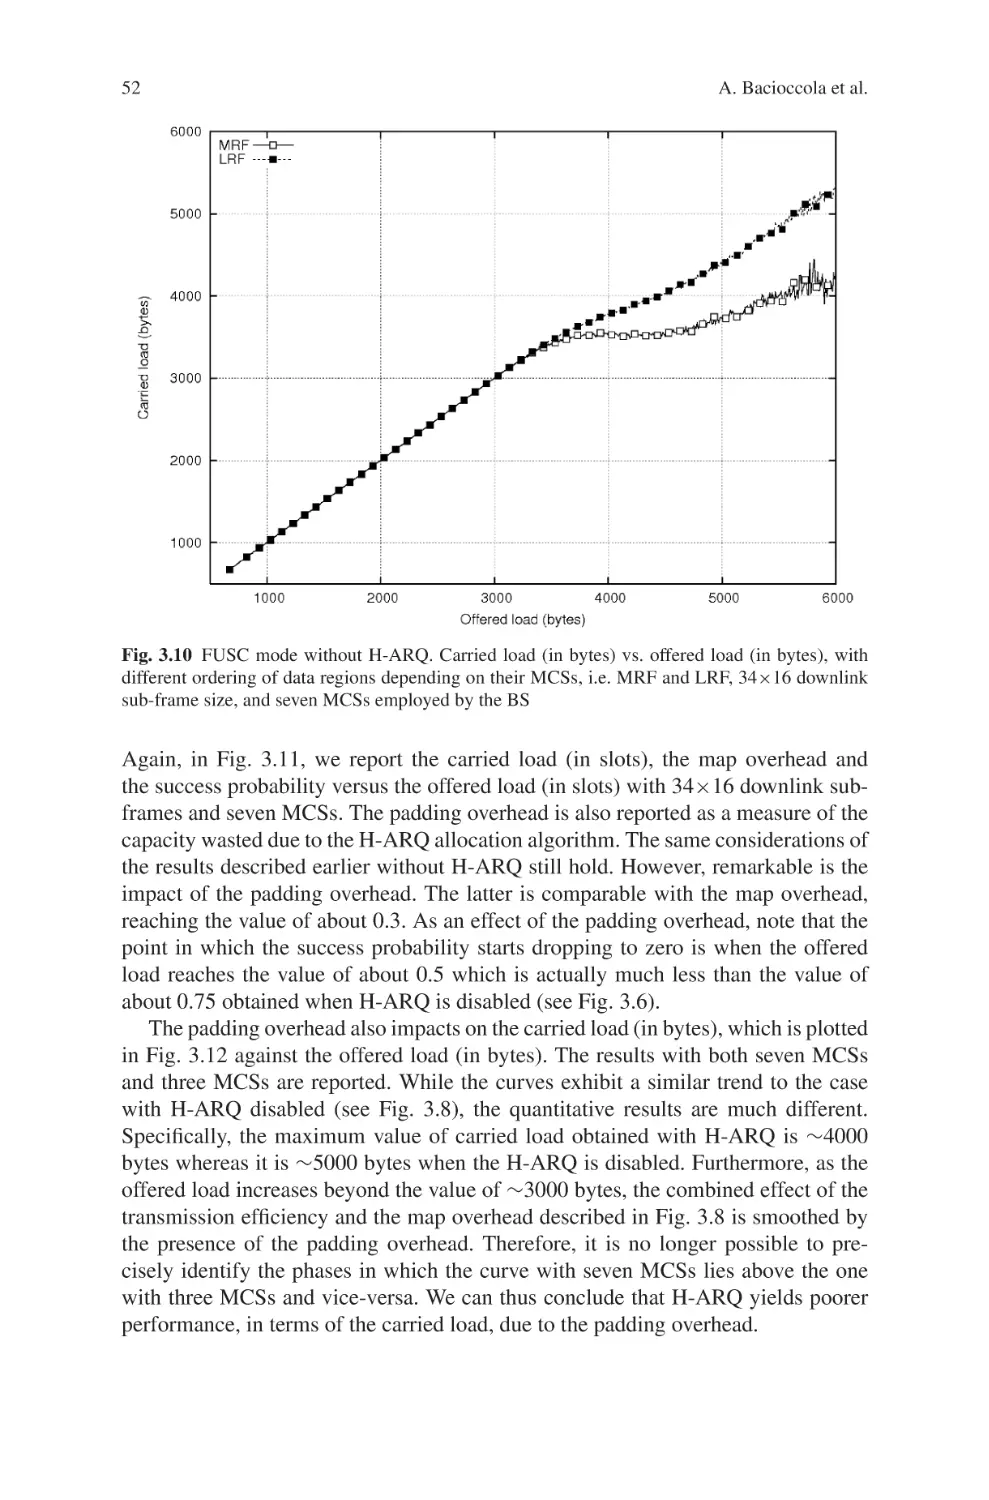
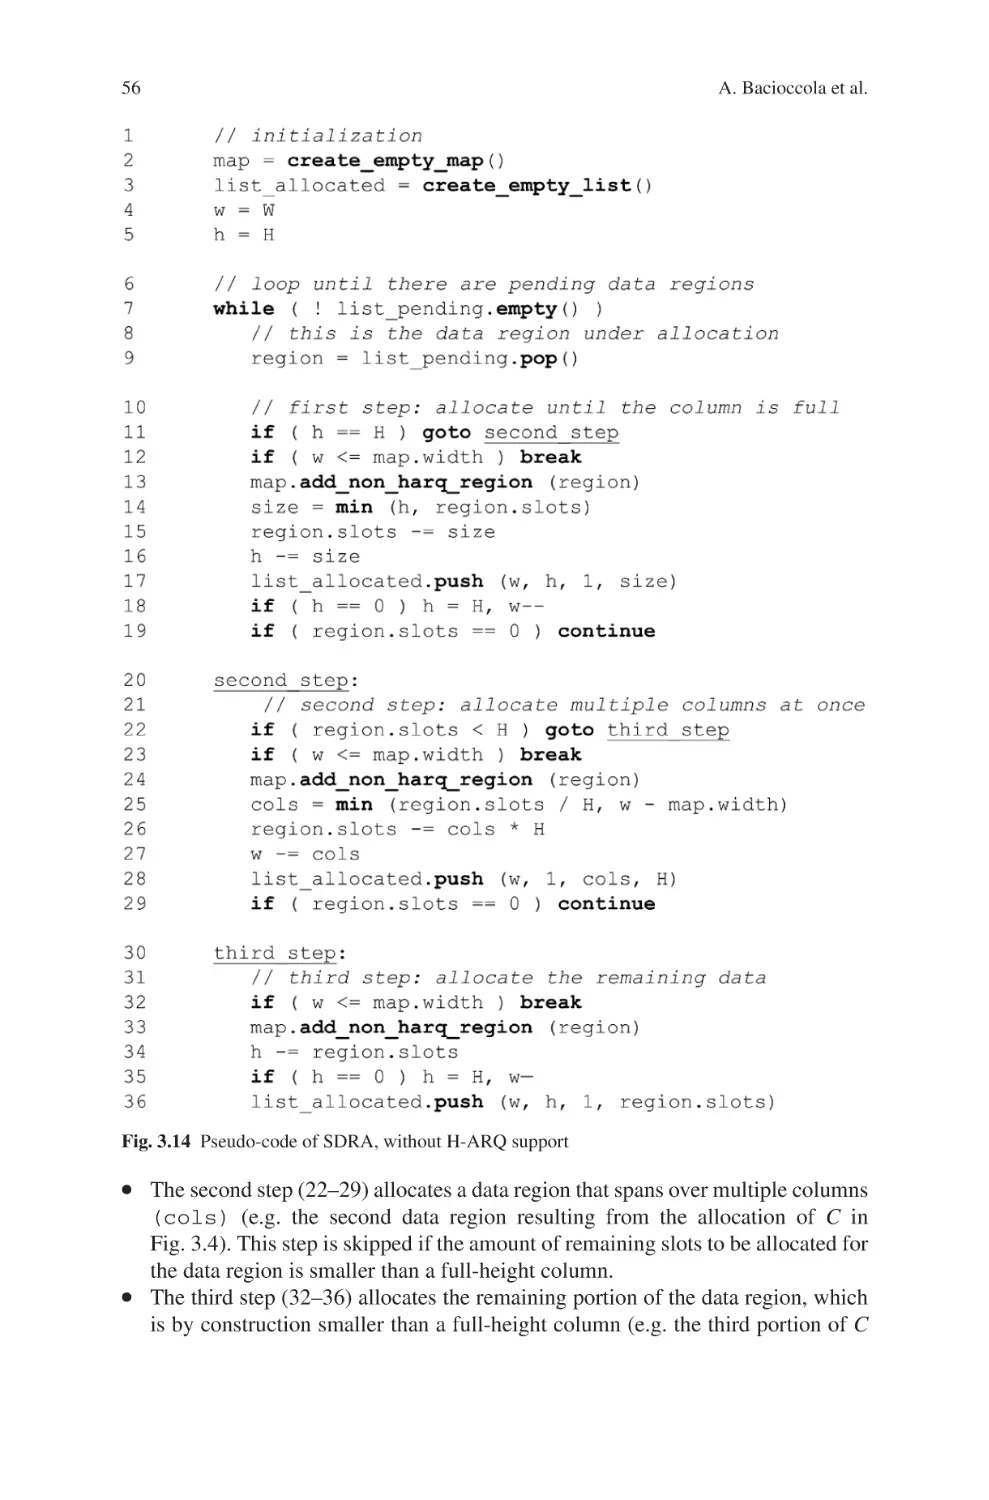
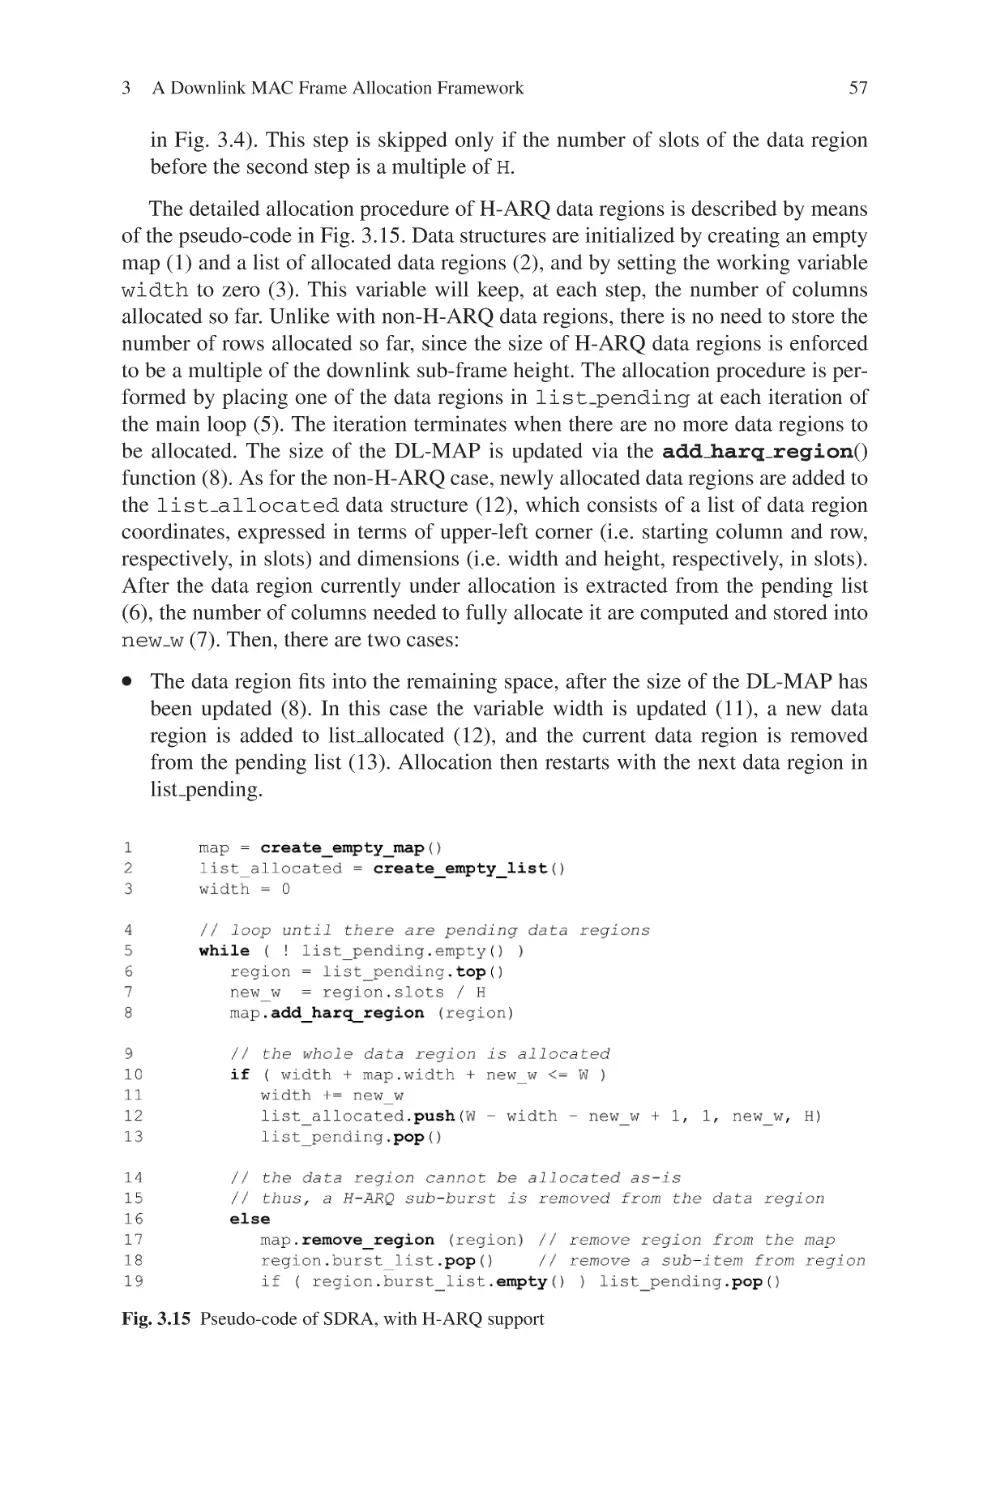
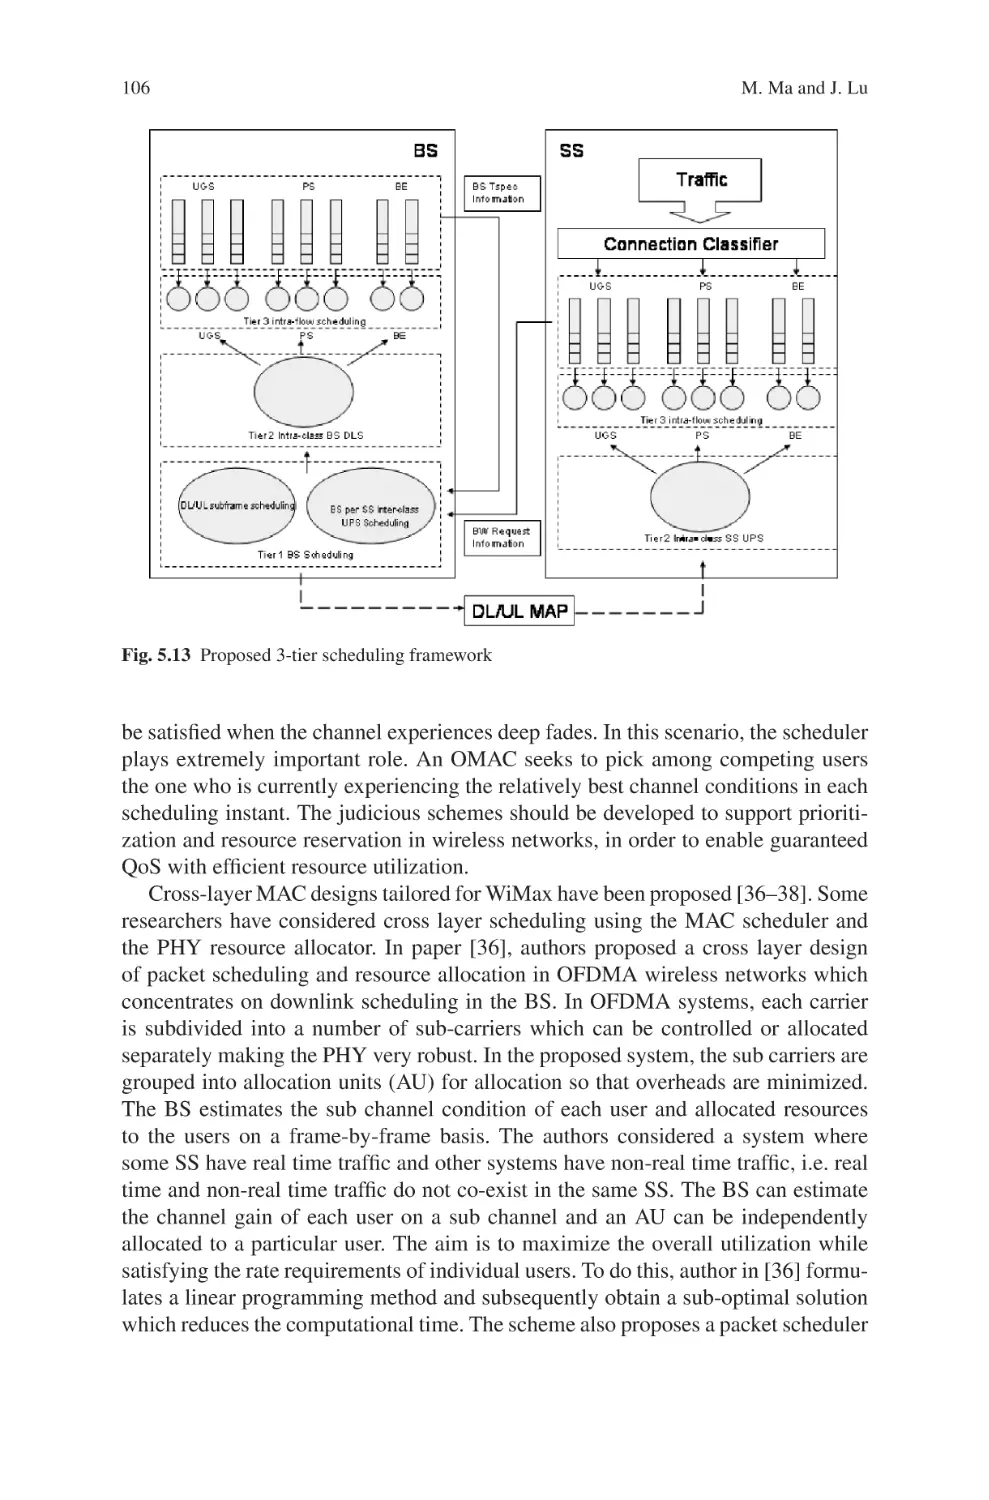
namic bandwidth allocation in order to increase the utilization of precious bandwidth and provide service differentiation. Chapter 3 is to address the frame allocation issue for the Quality of Service (QoS) provisioning, particularly based on the
Orthogonal Frequency Division Multiple Access (OFDMA) PHY layer technology.
A modular framework to handle frame allocation problems has been proposed to
decouple the constraints of data region allocation into the MAC frames. Chapter 4
provides a detailed overview of the state-of-the-art scheduling techniques employed
in WiMax systems and various issues related to the implementation of some of the
scheduling algorithms. Chapter 5 presents an introduction and literature review on
the QoS provisioning architecture and various technologies of traffic management
at different levels including call admission control (CAC) and traffic scheduling
to provide QoS guarantee in WiMax systems. In Chapter 6, a load-balancing approach to handle radio resource management in the mobile WiMax networks has
been presented. This approach is a set of algorithms including call admission control, adaptive transmission, horizontal handover, and dynamic bandwidth allocation
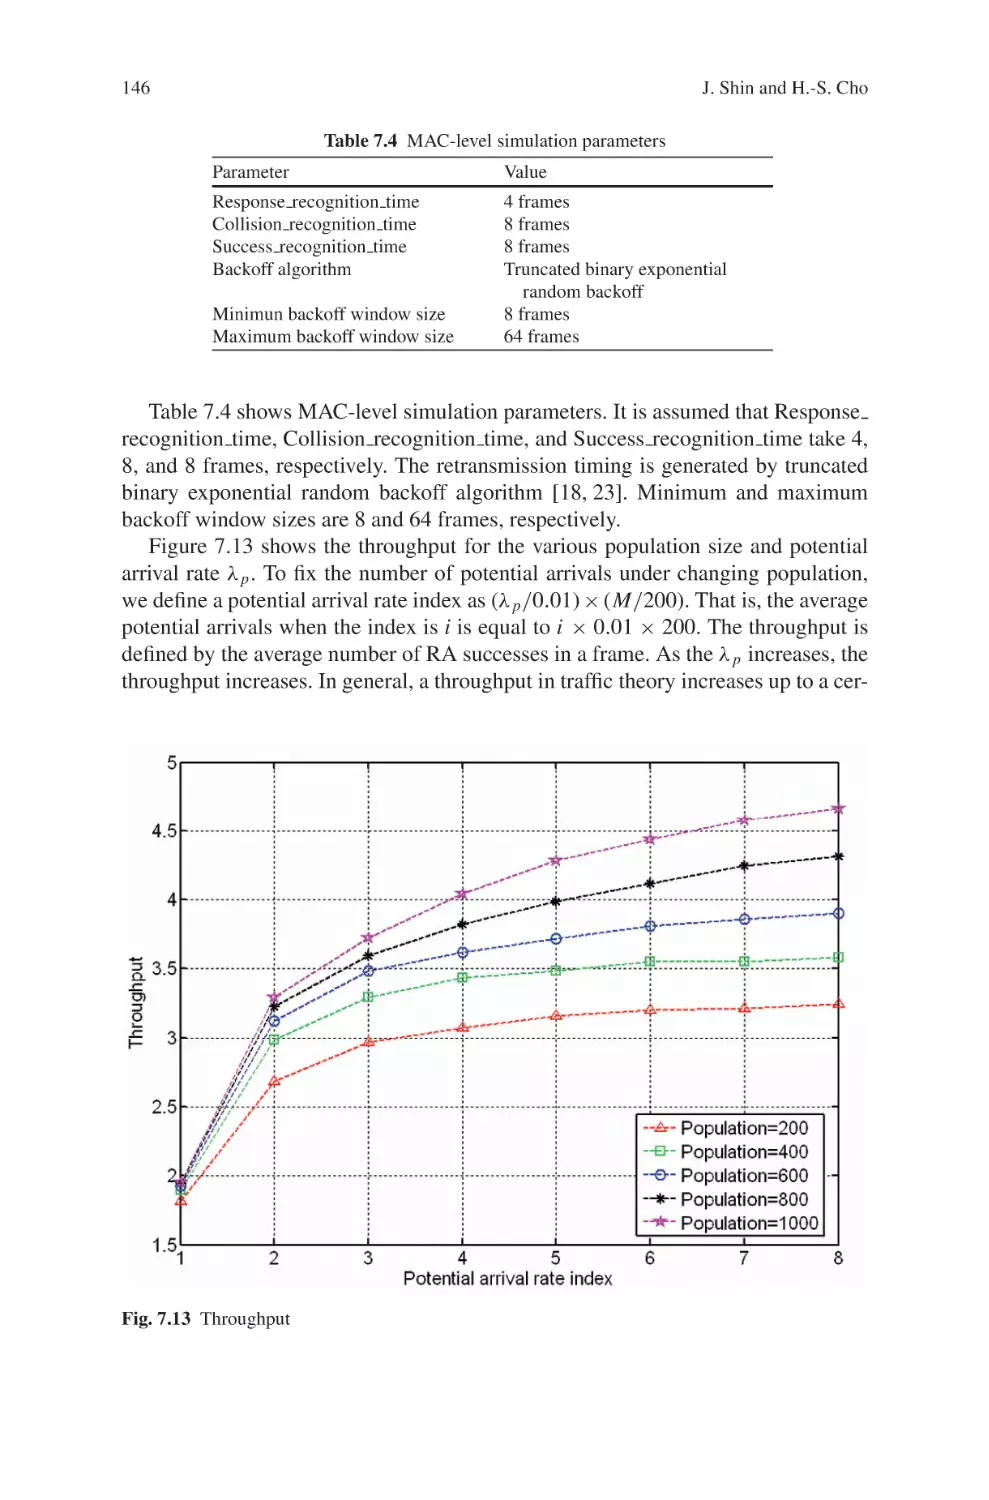
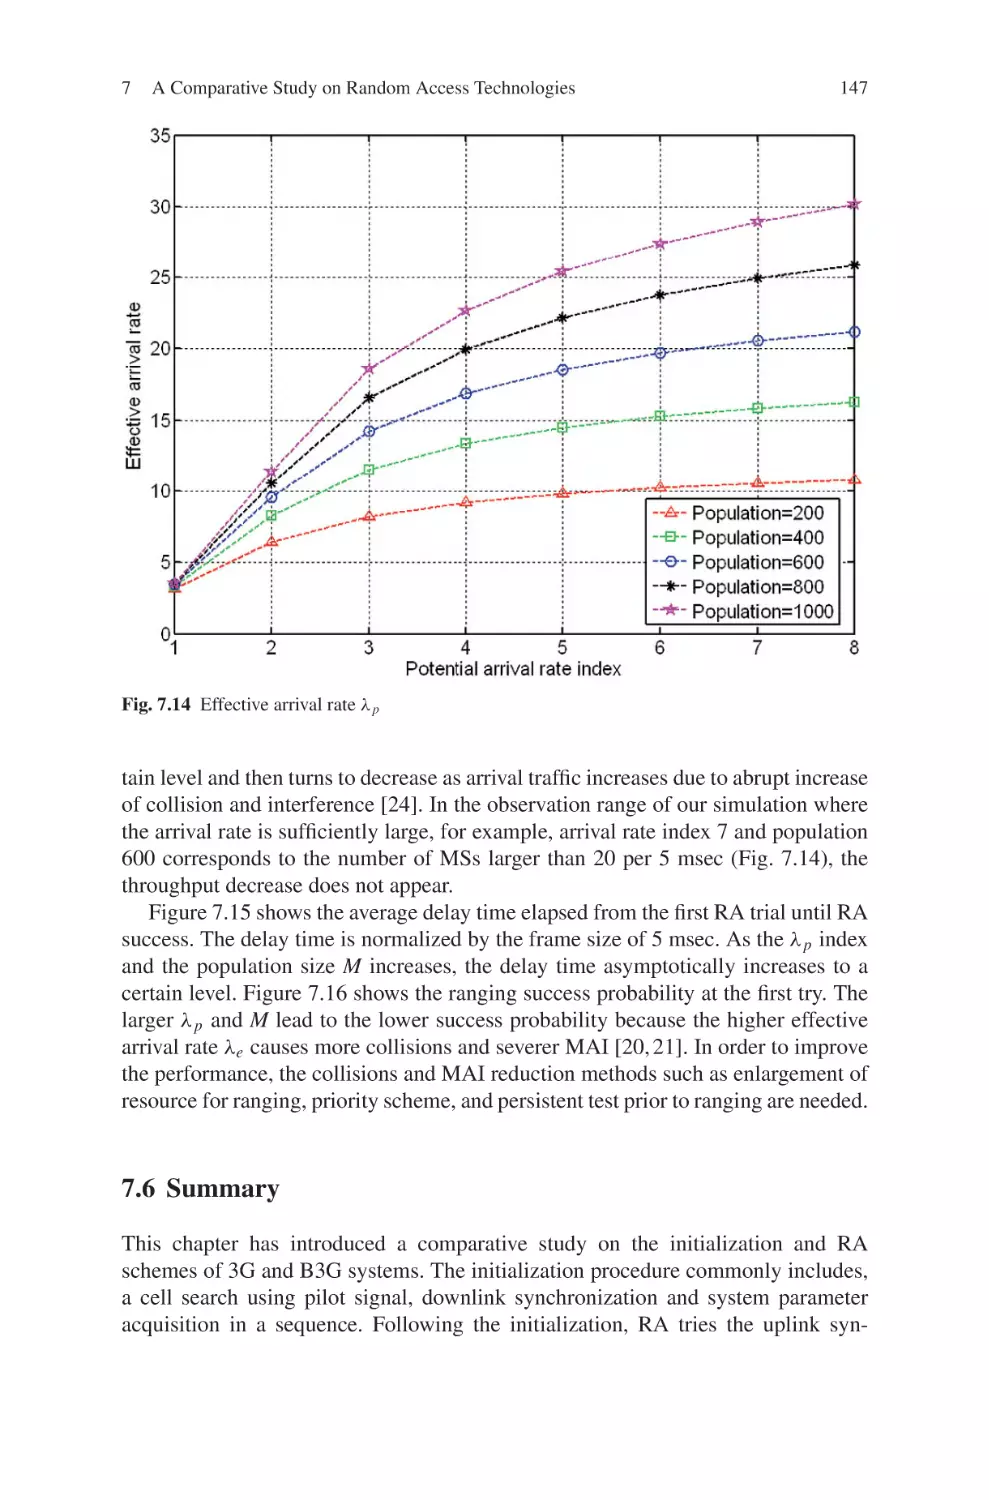
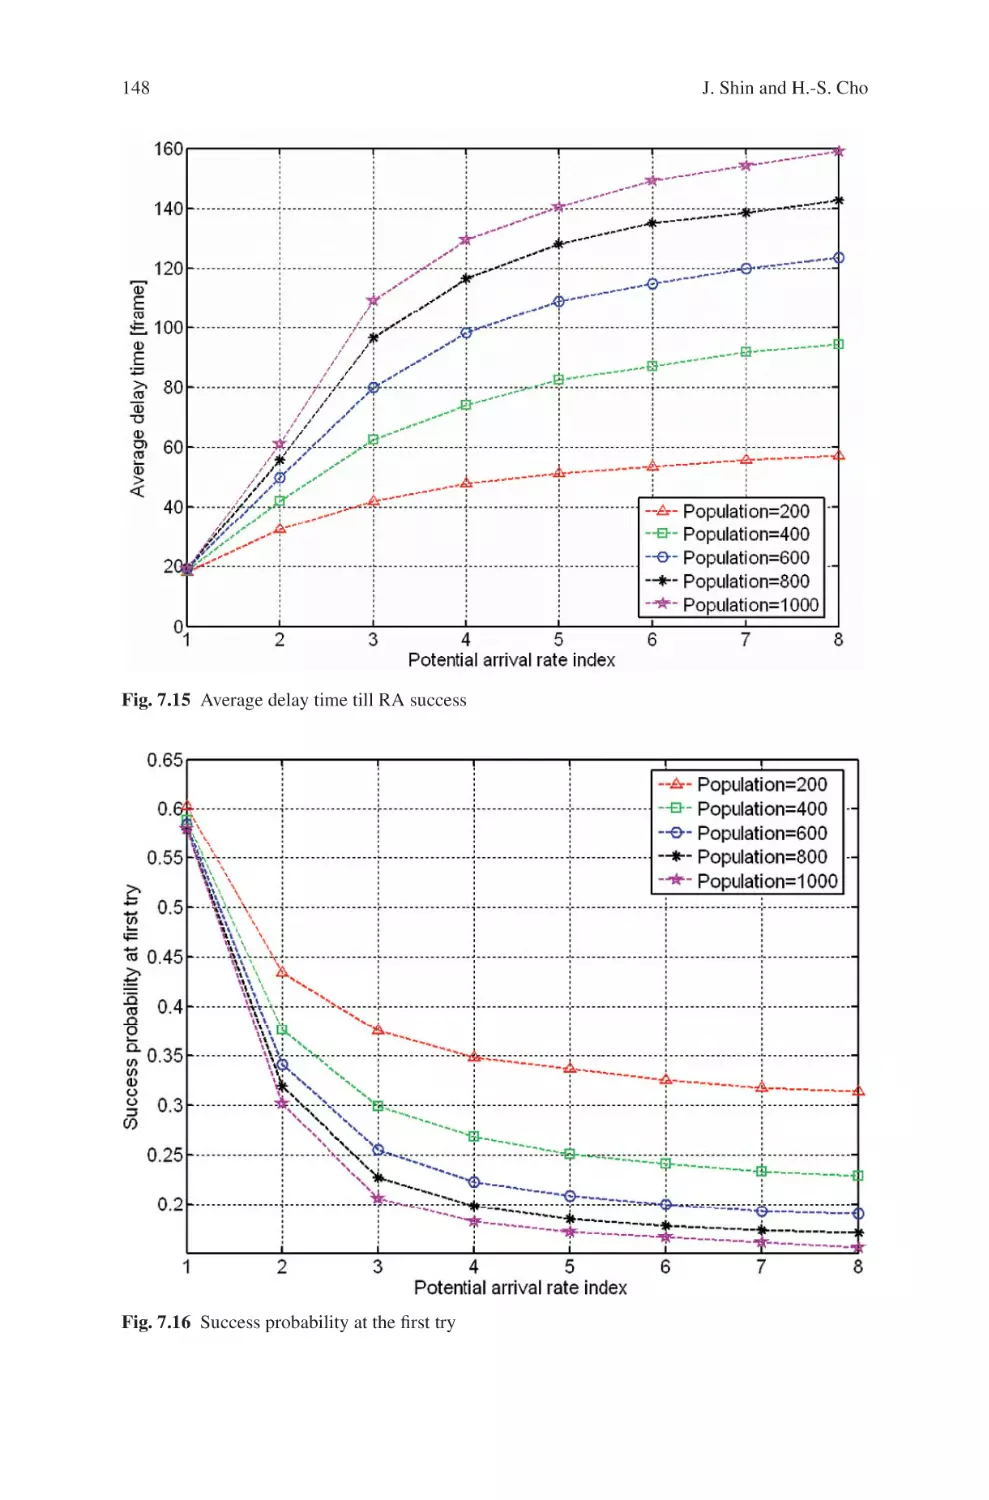
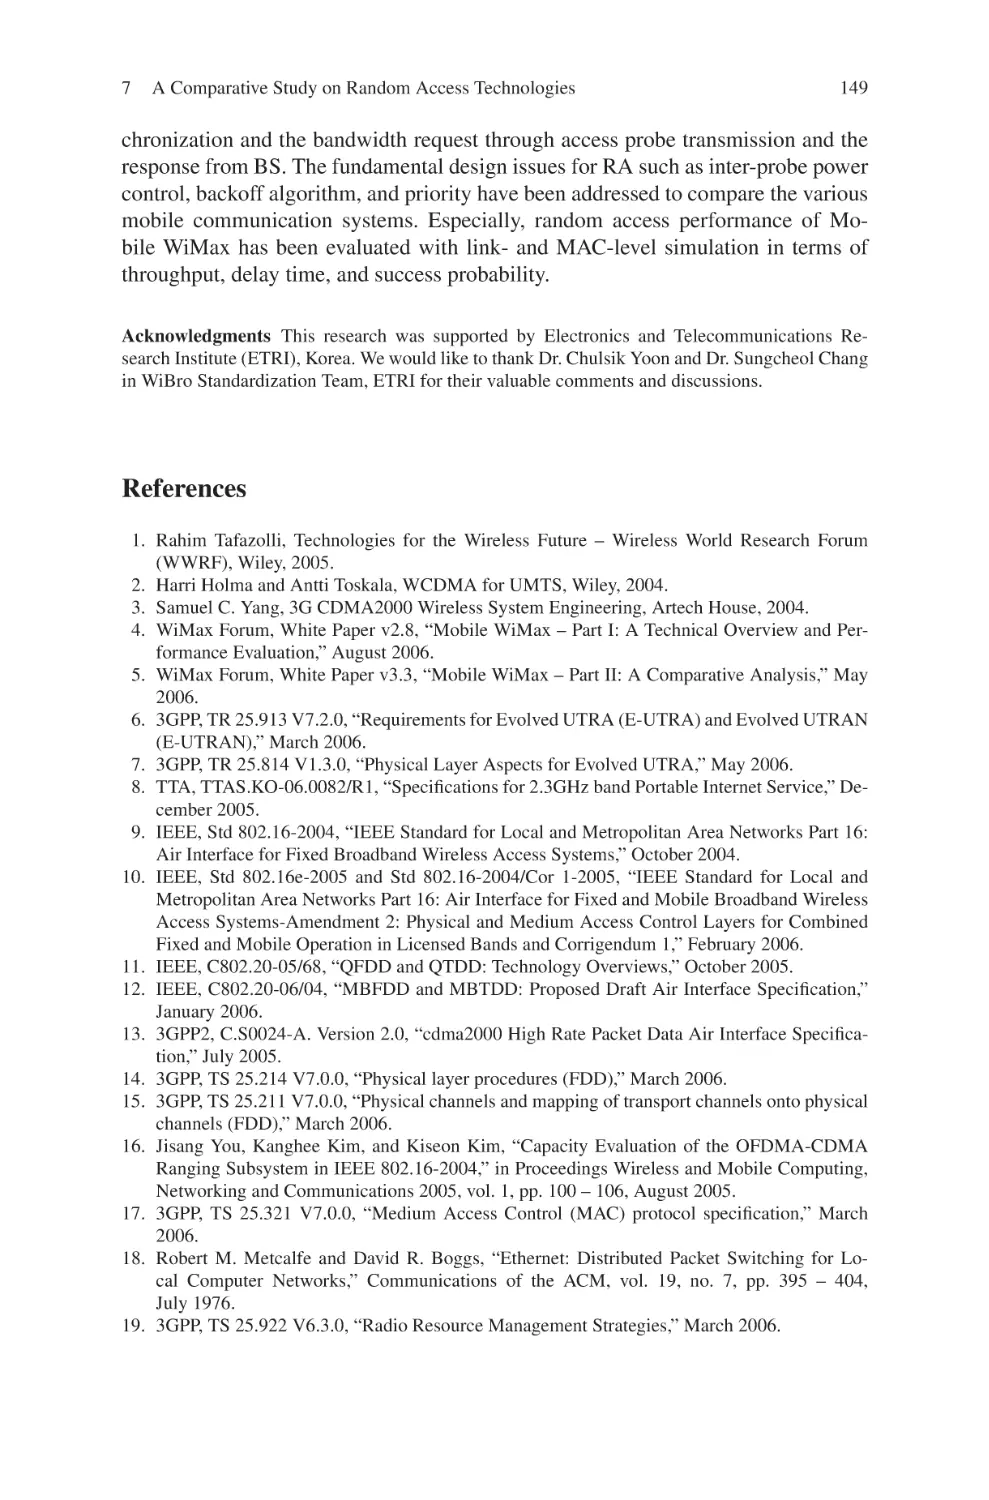
algorithms, which jointly maximize the network capacity and guarantee QoS requirements from different types of applications. Chapter 7 is a comparison study
on the random access technologies in various wireless systems including the third
generation (3G) of cellular systems like Wideband Code Division Multiple Access
(WCDMA) and CDMA2000, mobile WiMax, and 3G Long Term Evolution (LTE).
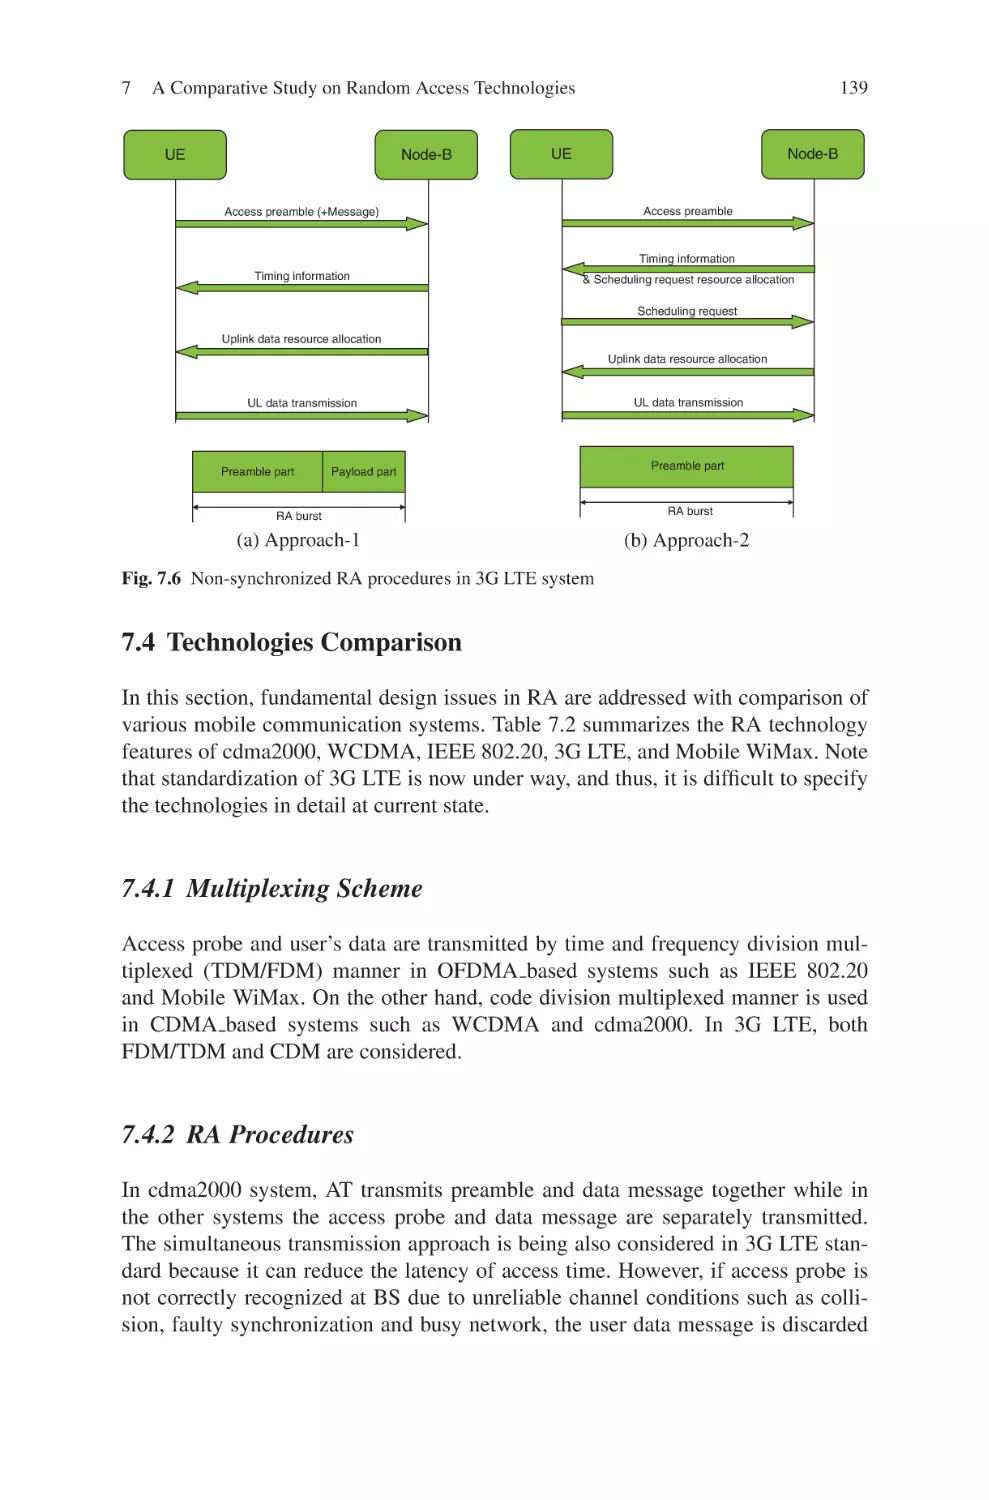
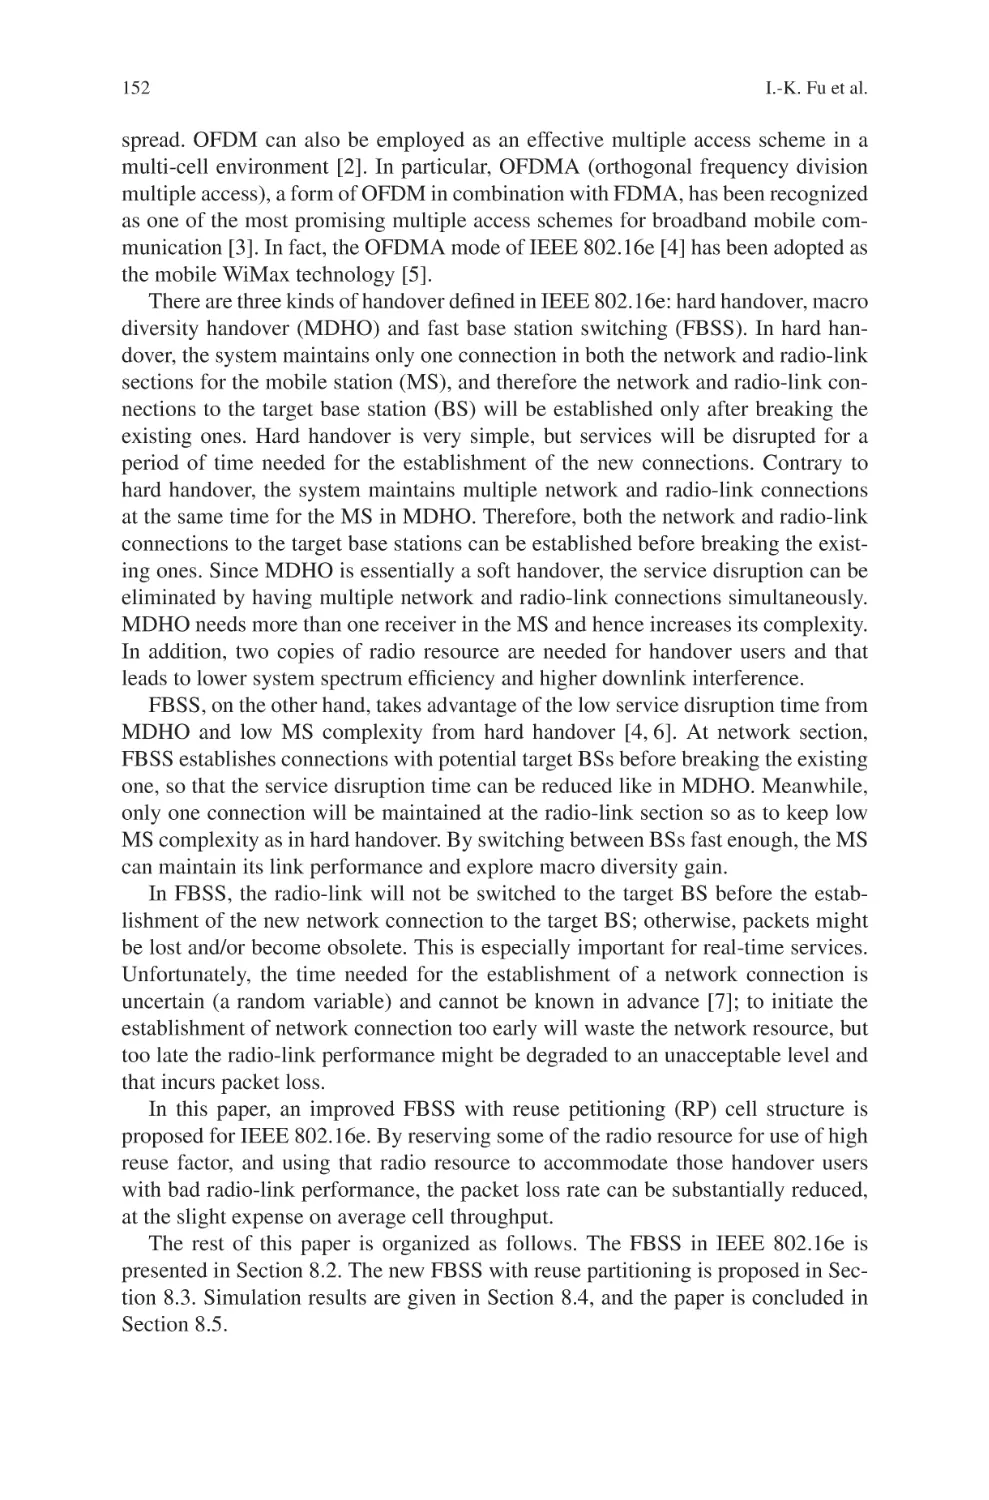
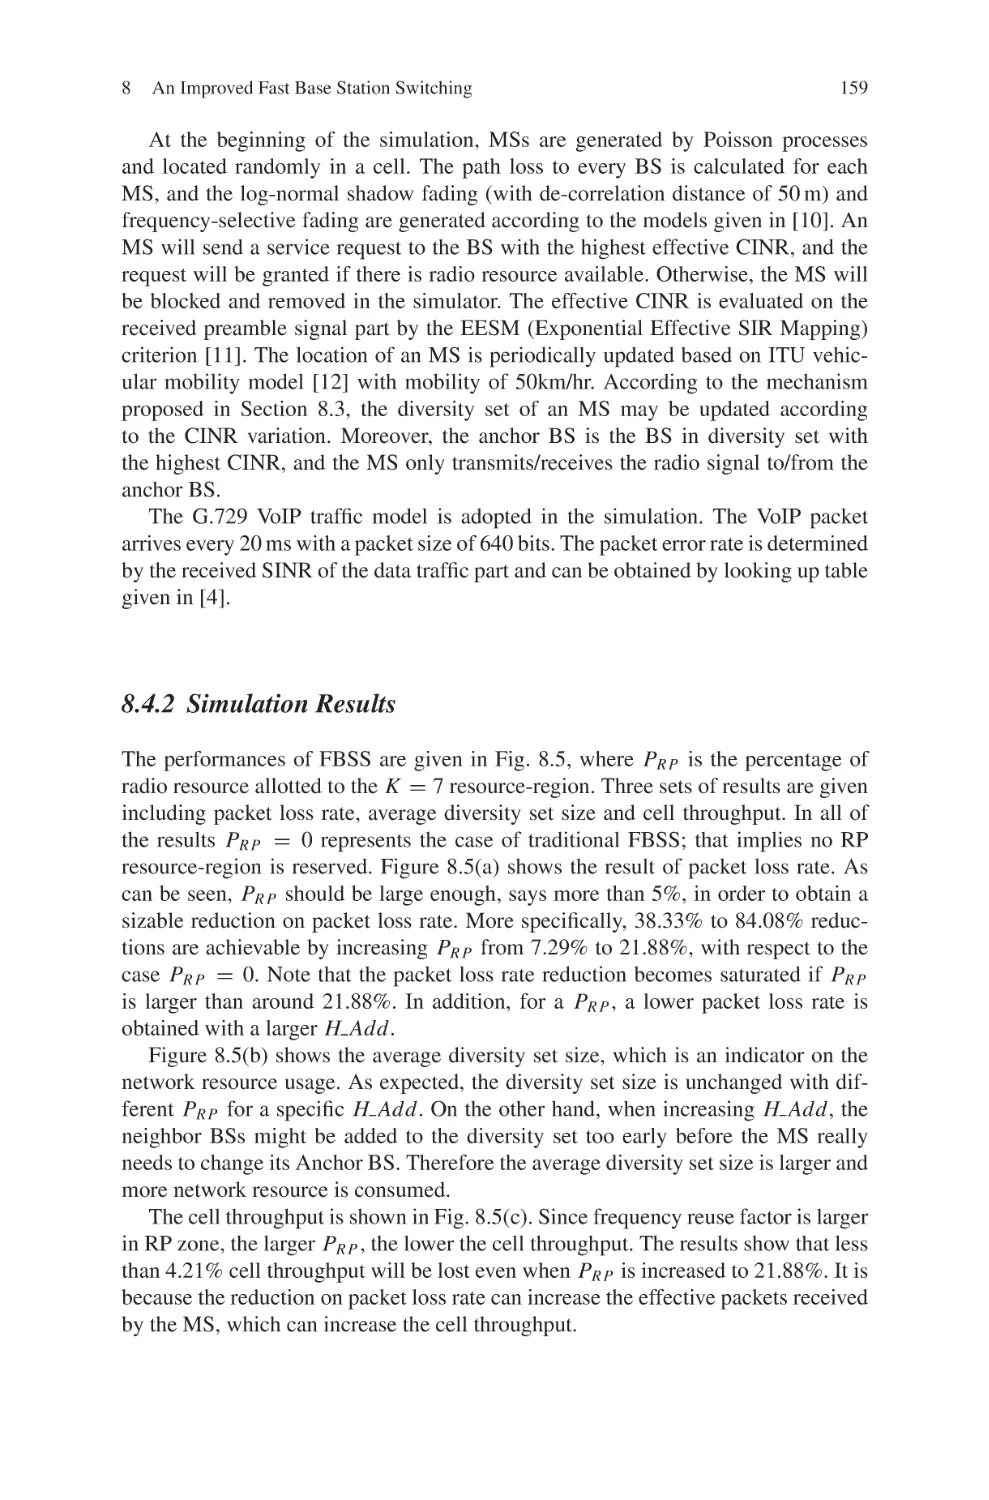
The second part is major on the mobility issues in WiMax cellular networks, consisting of Chapter 8 and Chapter 9. Chapter 8 is a proposed improvement on a
handover mechanism, which is the Fast Base Station Switching (FBSS), used in
mobile WiMax systems. The proposed FBSS with Reuse Partitioning Cell Structure scheme is to enhance the performance of the traditional FBSS. Chapter 9 is
a literature review on various handover schemes recently proposed to improve the
standard one specified in the IEEE 802.16e. It has presented the recent research
efforts to reduce the latency introduced in the handover process with aim to provide
QoS to different types of traffic during the handovers. The third part is major on
other topologies of WiMax networks and the integration of WiMax networks with
other wireless/wired networks, consisting of Chapter 10 to Chapter 13. Chapter 10
is a comprehensive study on WiMax systems with a proposal of a multiservice CAC
mechanism, which can significantly improve the performance of an existing CAC
scheme, and a proposal on the architecture of an interworking wireless network
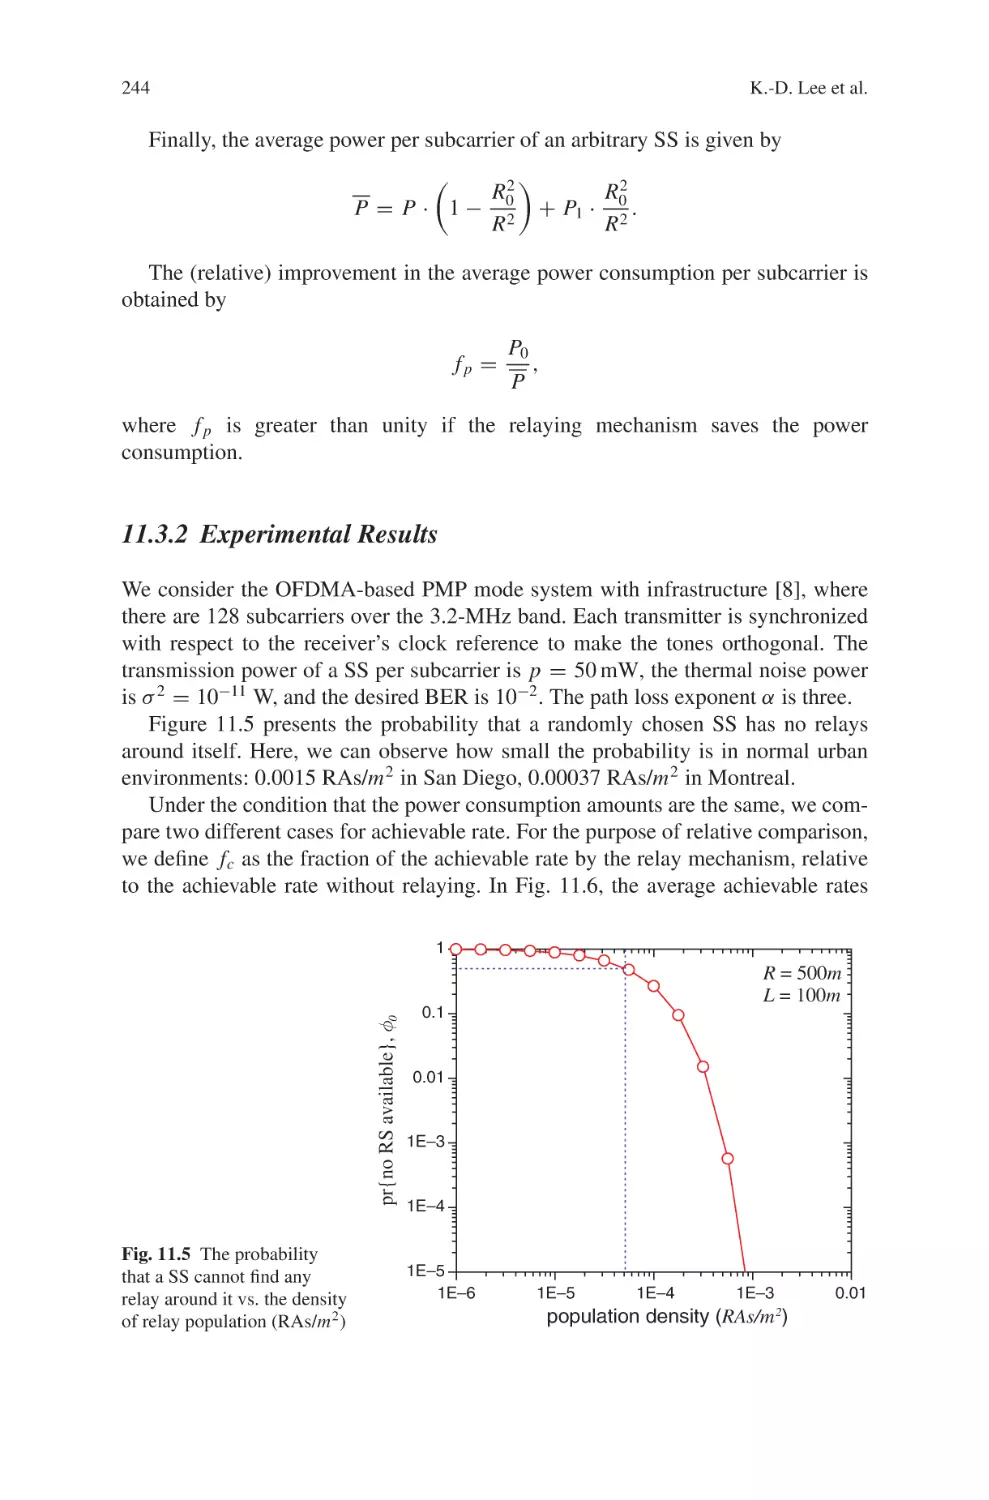
composed of WiMax and Wireless Local Area Network (WLAN) systems. Chapter 11 examines the power consumption performance in WiMax relay networks
specified by IEEE 802.16j. Chapter 12 studies the issue to provide large-scale reliable multicast and broadcast services by social psychology principles and game
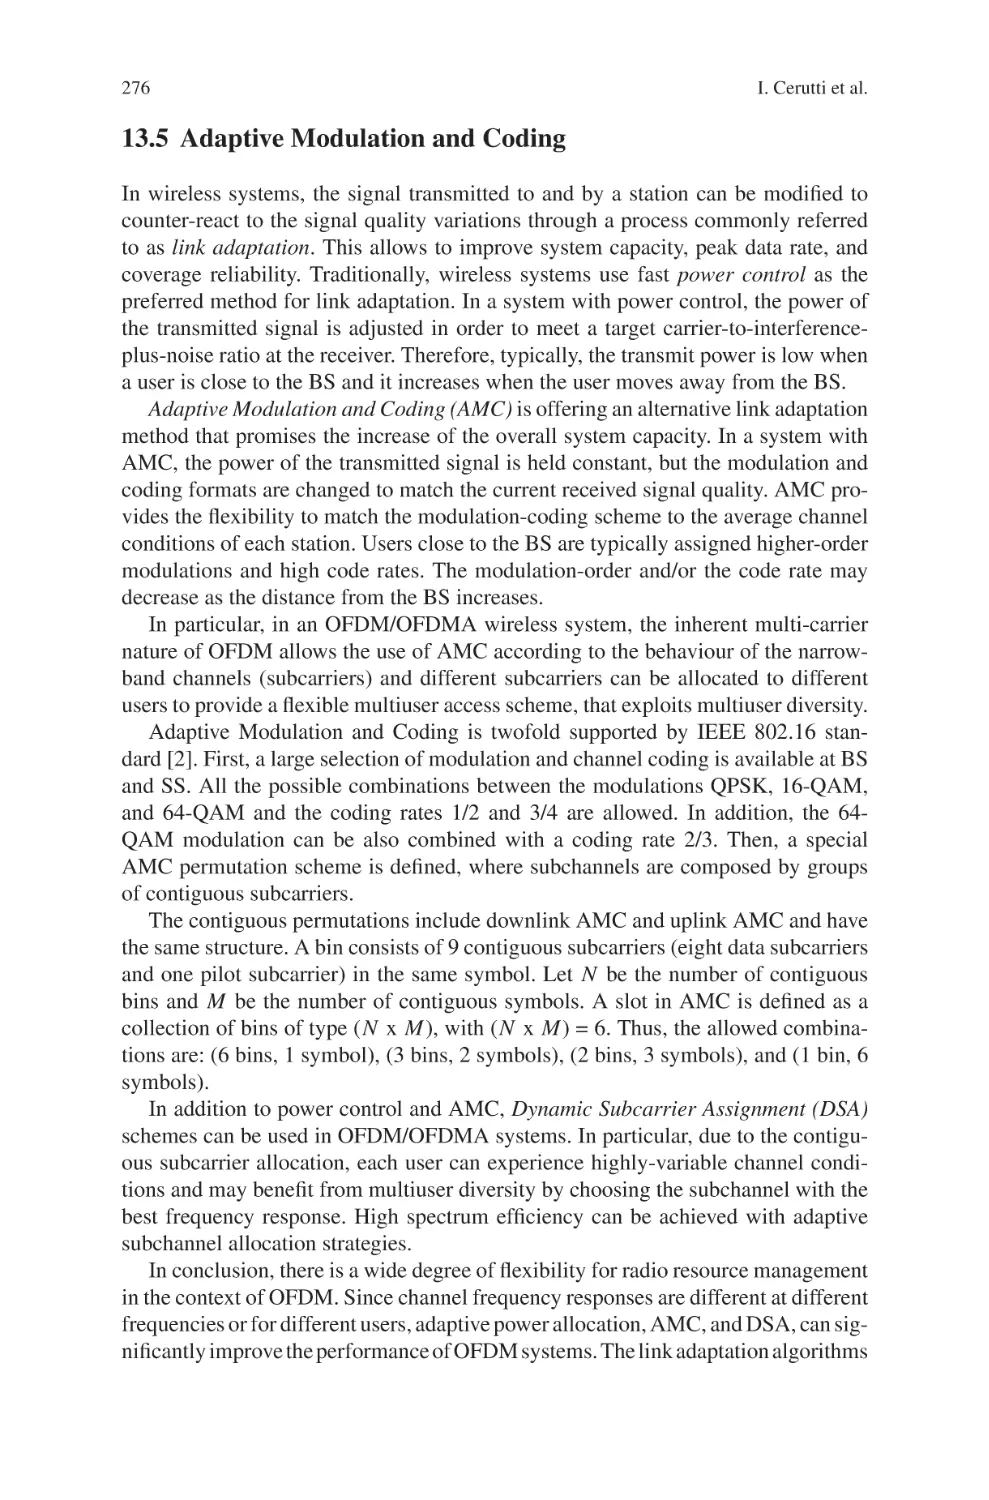
theory. Finally, Chapter 13 addresses physical layer technologies such as Multiple Input Multiple Output (MIMO) antennas and Adaptive Modulation and Coding
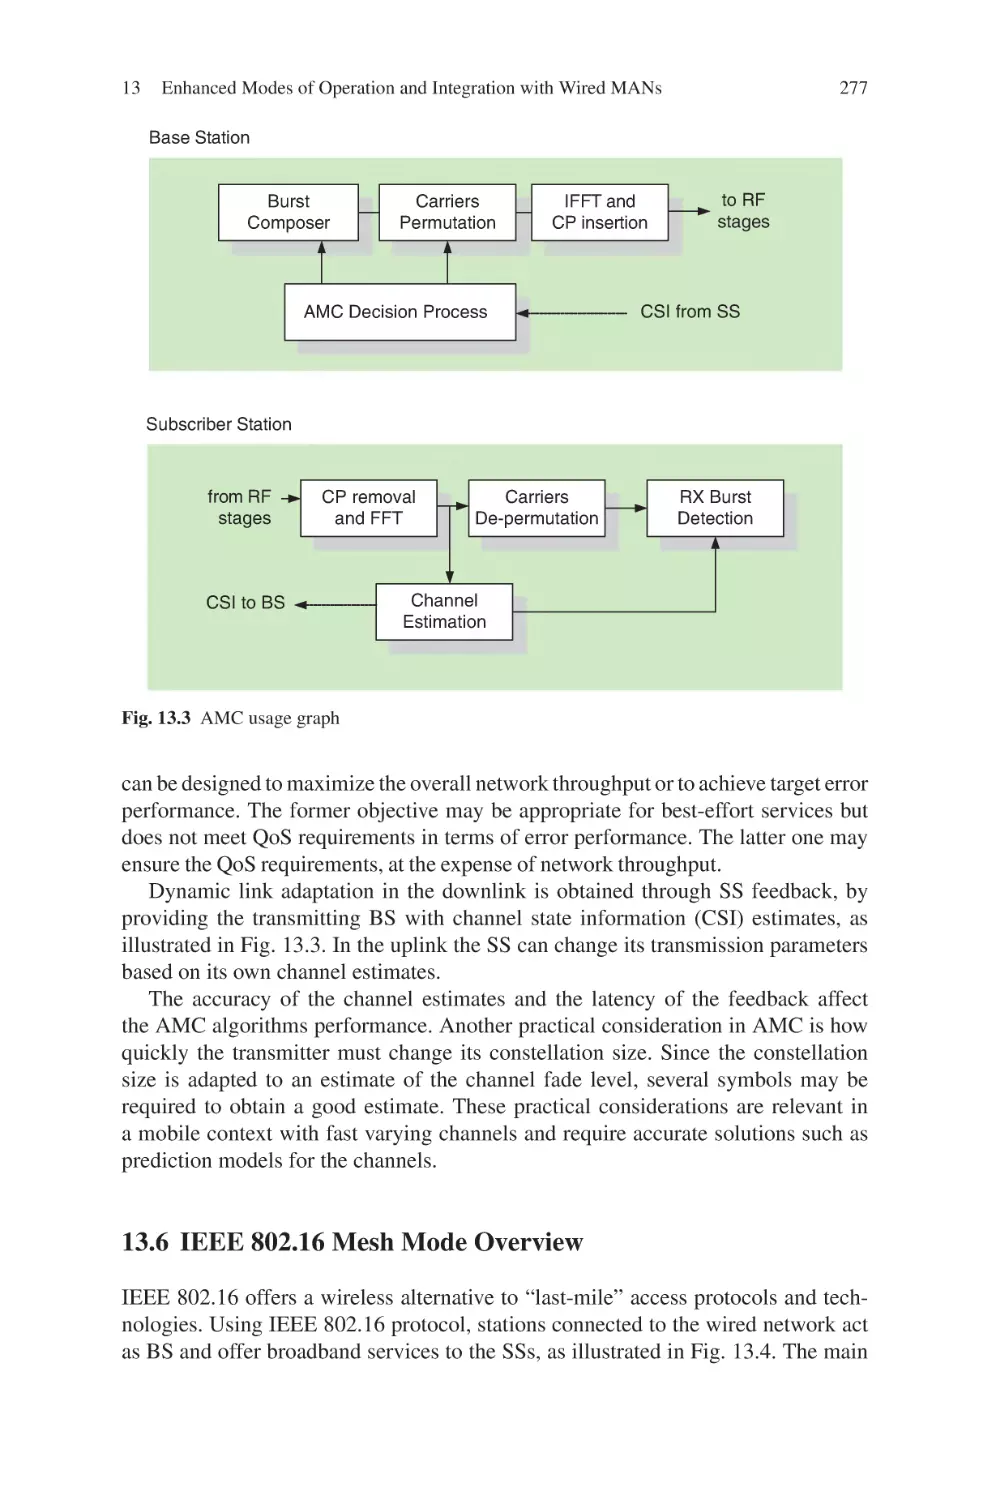
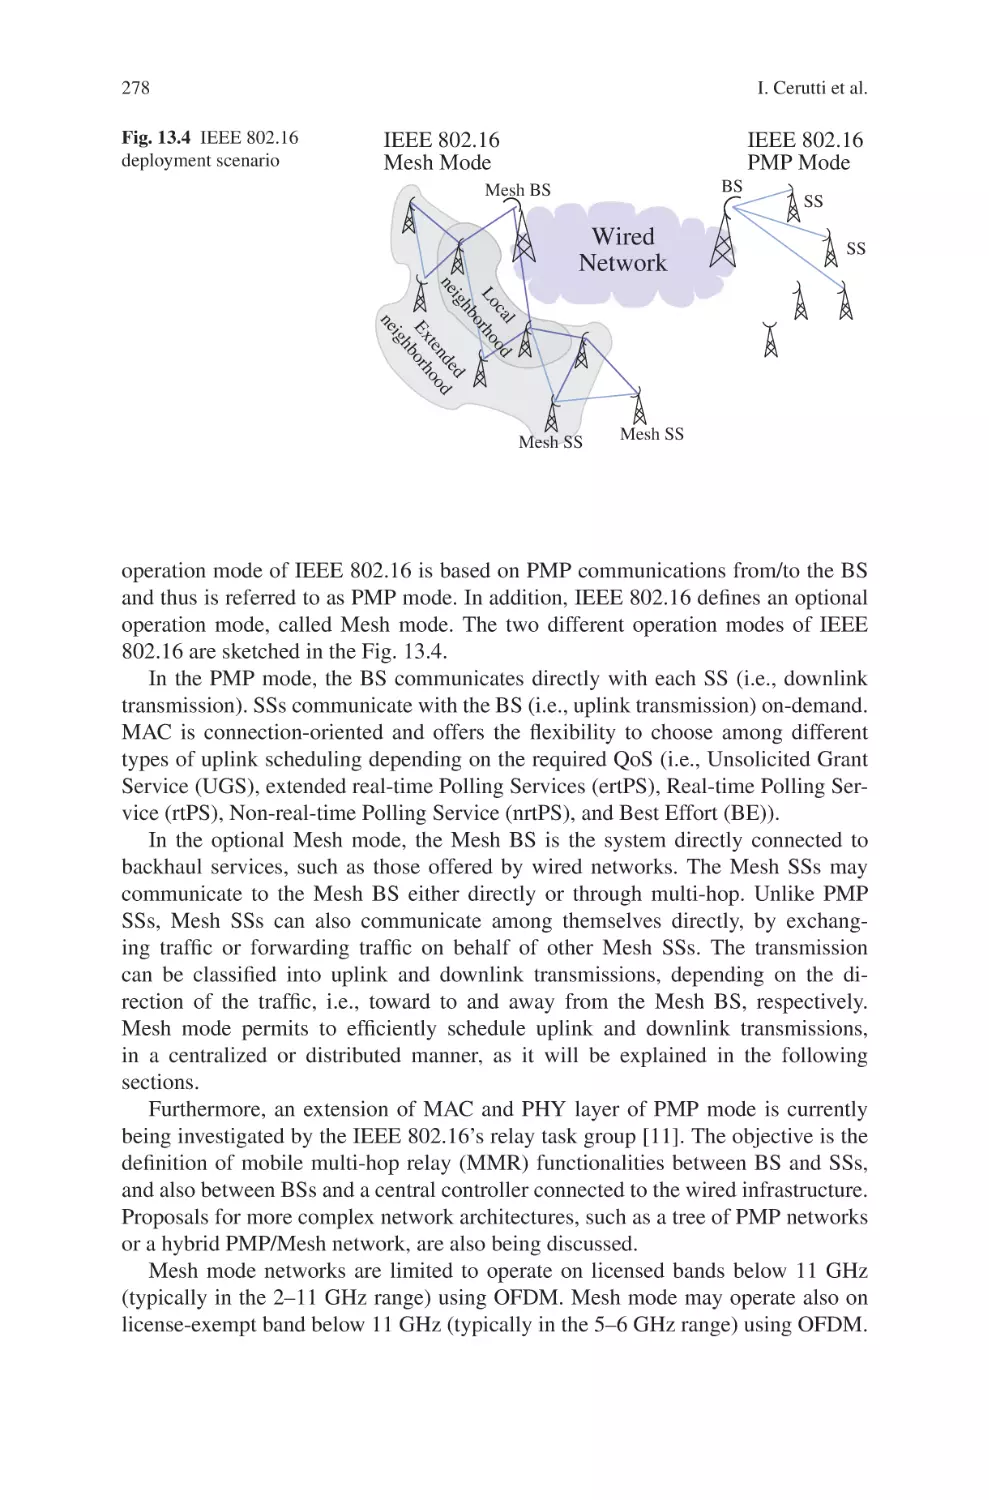
(AMC), the operations of WiMax mesh networks, and the integration of wireless and
wired/optical MANs.
It is obvious that without the great contributions and profound, excellent knowledge of WiMax technologies from the authors of each chapter, this book could not be
published to serve as a reference book to the world. I wish to thank each contributor
Preface
vii
of the book for his/her time, huge efforts, and great enthusiasm to the publication
of the book. I would also thank the publisher of the book and the representatives,
Mr. Mark de Jongh, Mrs. Cindy Zitter, and Ms. Deivanai Loganathan, Integra for
their patience and great helps in the publication process.
Singapore
Dr. Maode Ma
Contents
1 Deployment and Design of Multi-Antenna WiMax Systems in a
Non-Stationary Interference Environment . . . . . . . . . . . . . . . . . . . . . . . .
M. Nicoli, S. Savazzi, O. Simeone, R. Bosisio, G. Primolevo,
L. Sampietro and C. Santacesaria
1
2 Dynamic Bandwidth Allocation for 802.16E-2005 MAC . . . . . . . . . . . . . 17
Yi-Neng Lin, Shih-Hsin Chien, Ying-Dar Lin, Yuan-Cheng Lai
and Mingshou Liu
3 A Downlink MAC Frame Allocation Framework in IEEE 802.16e
OFDMA: Design and Performance Evaluation . . . . . . . . . . . . . . . . . . . . 31
Andrea Bacioccola, Claudio Cicconetti, Alessandro Erta, Luciano
Lenzini, Enzo Mingozzi and Jani Moilanen
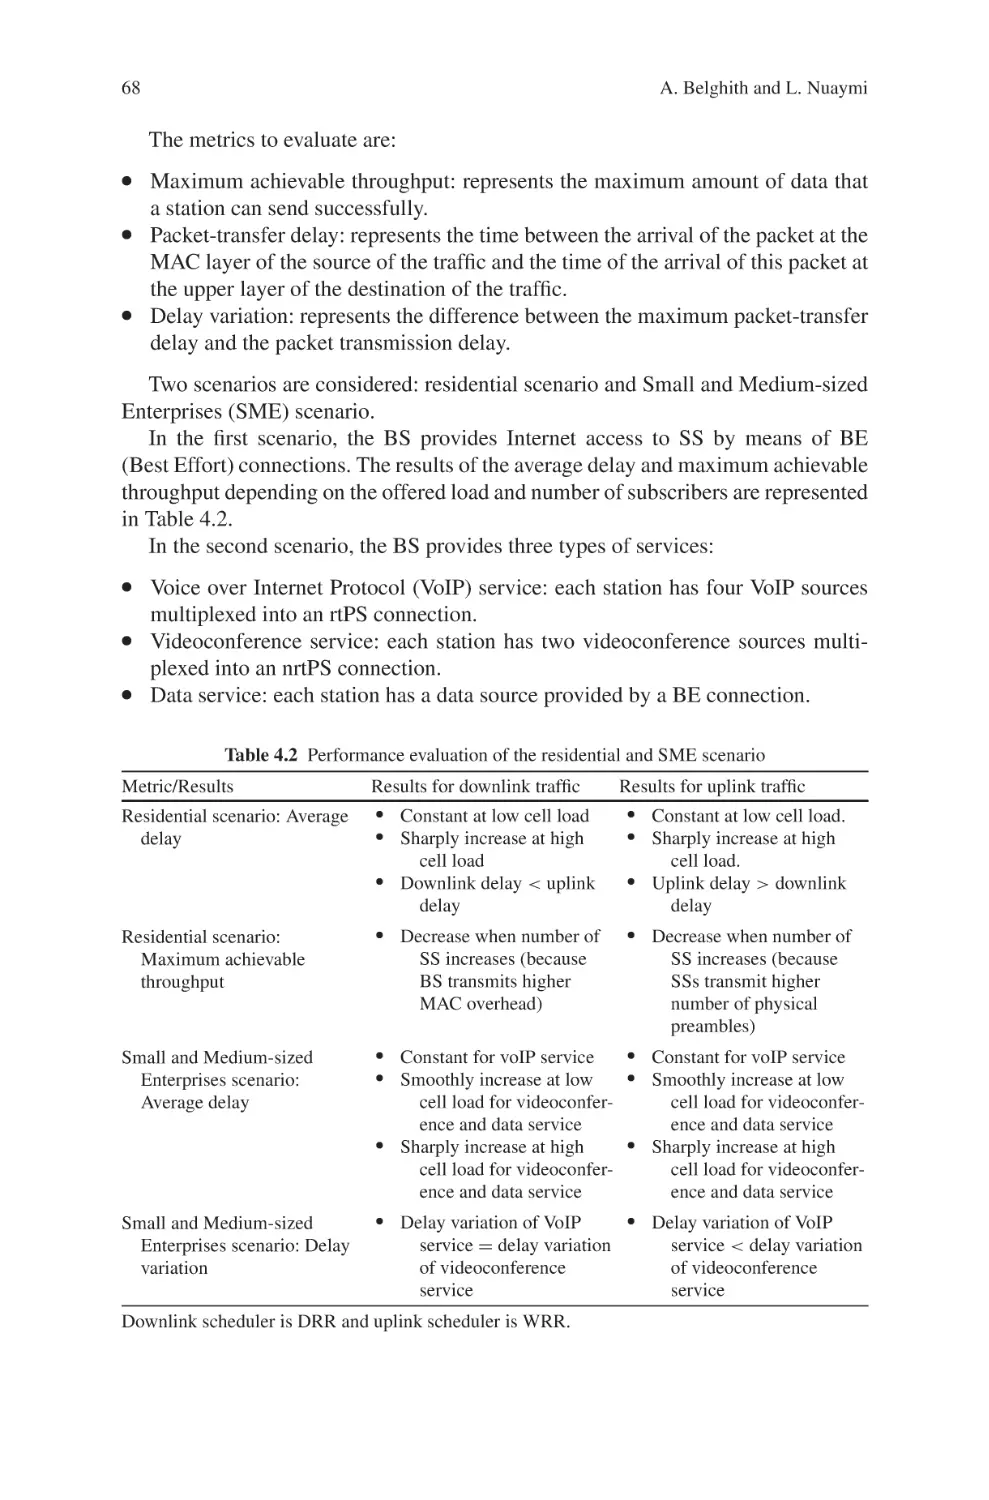
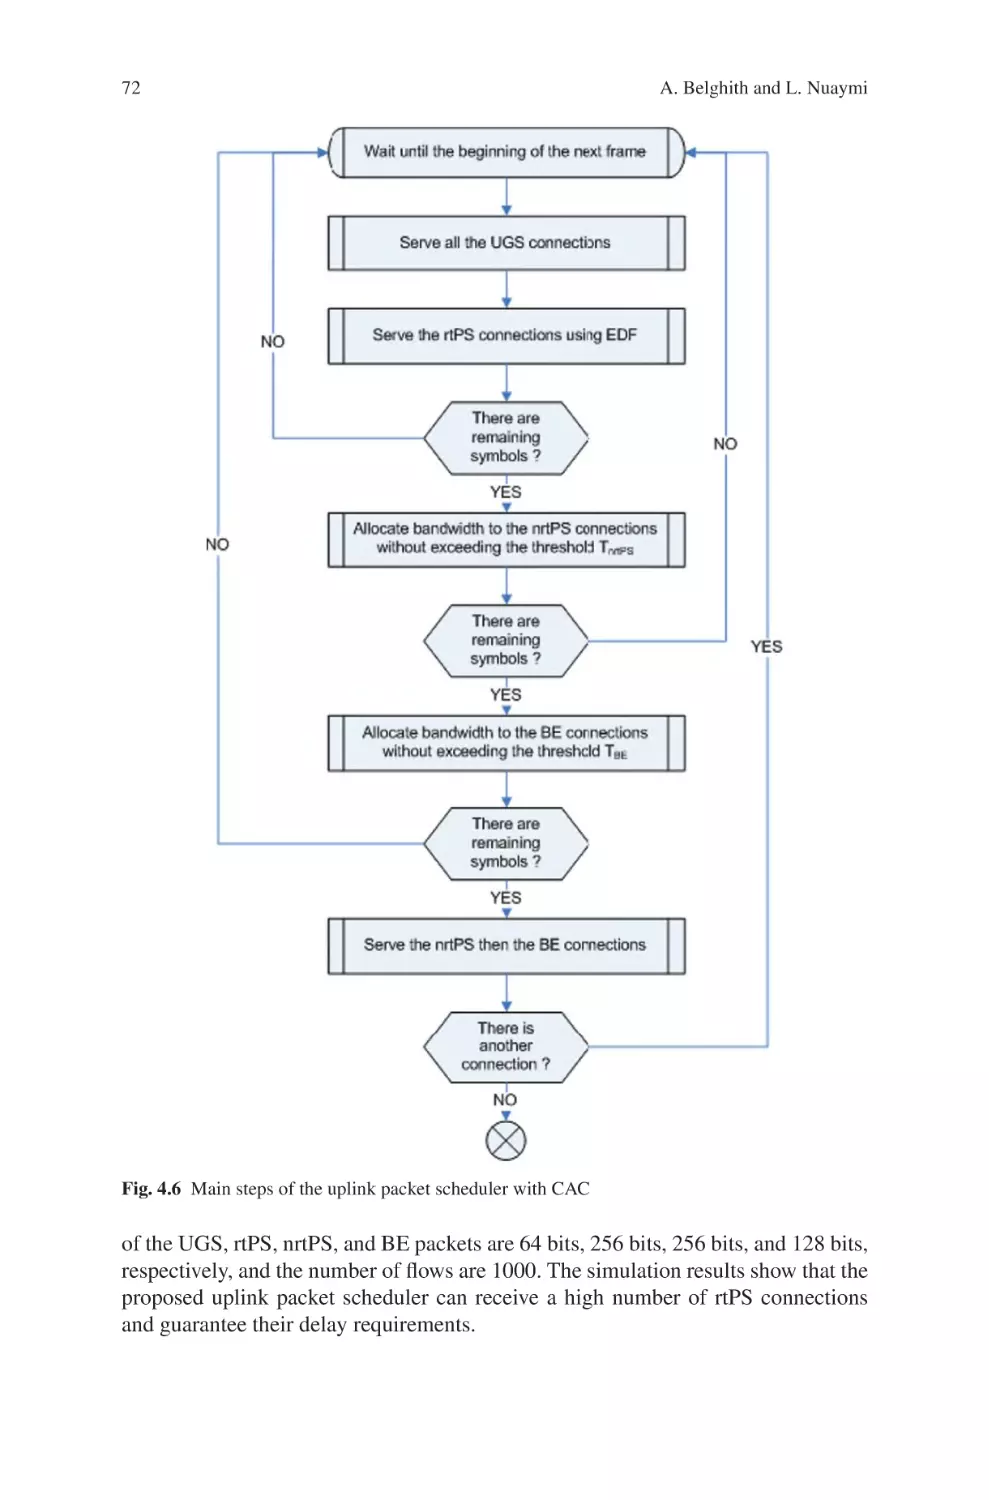
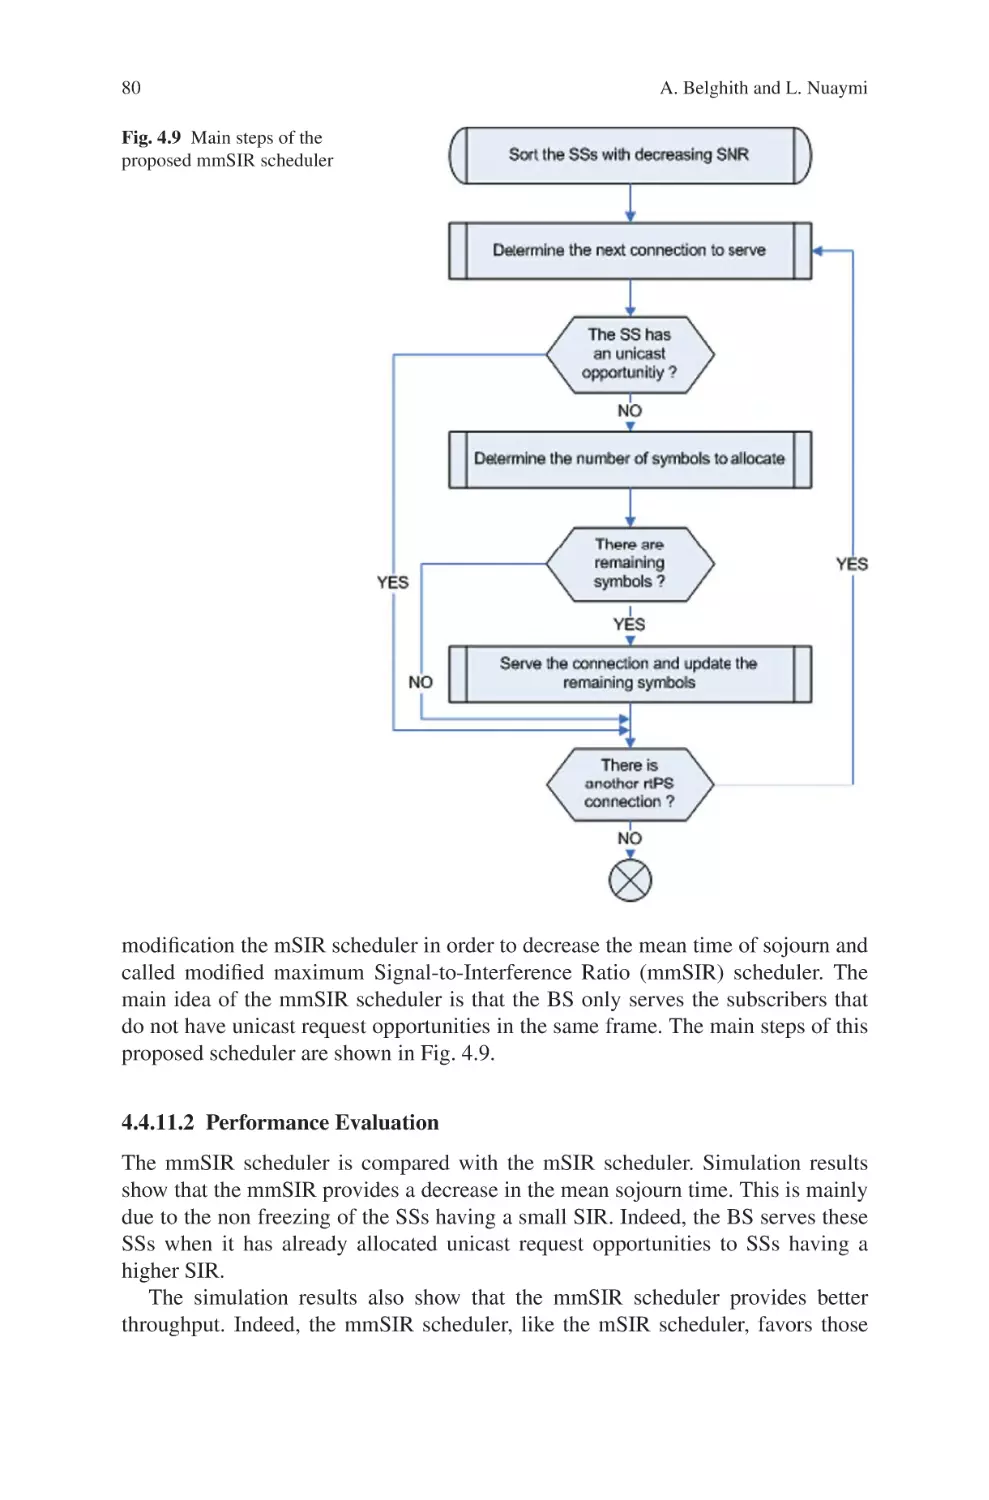
4 Scheduling Techniques for WiMax . . . . . . . . . . . . . . . . . . . . . . . . . . . . . . . 61
Aymen Belghith and Loutfi Nuaymi
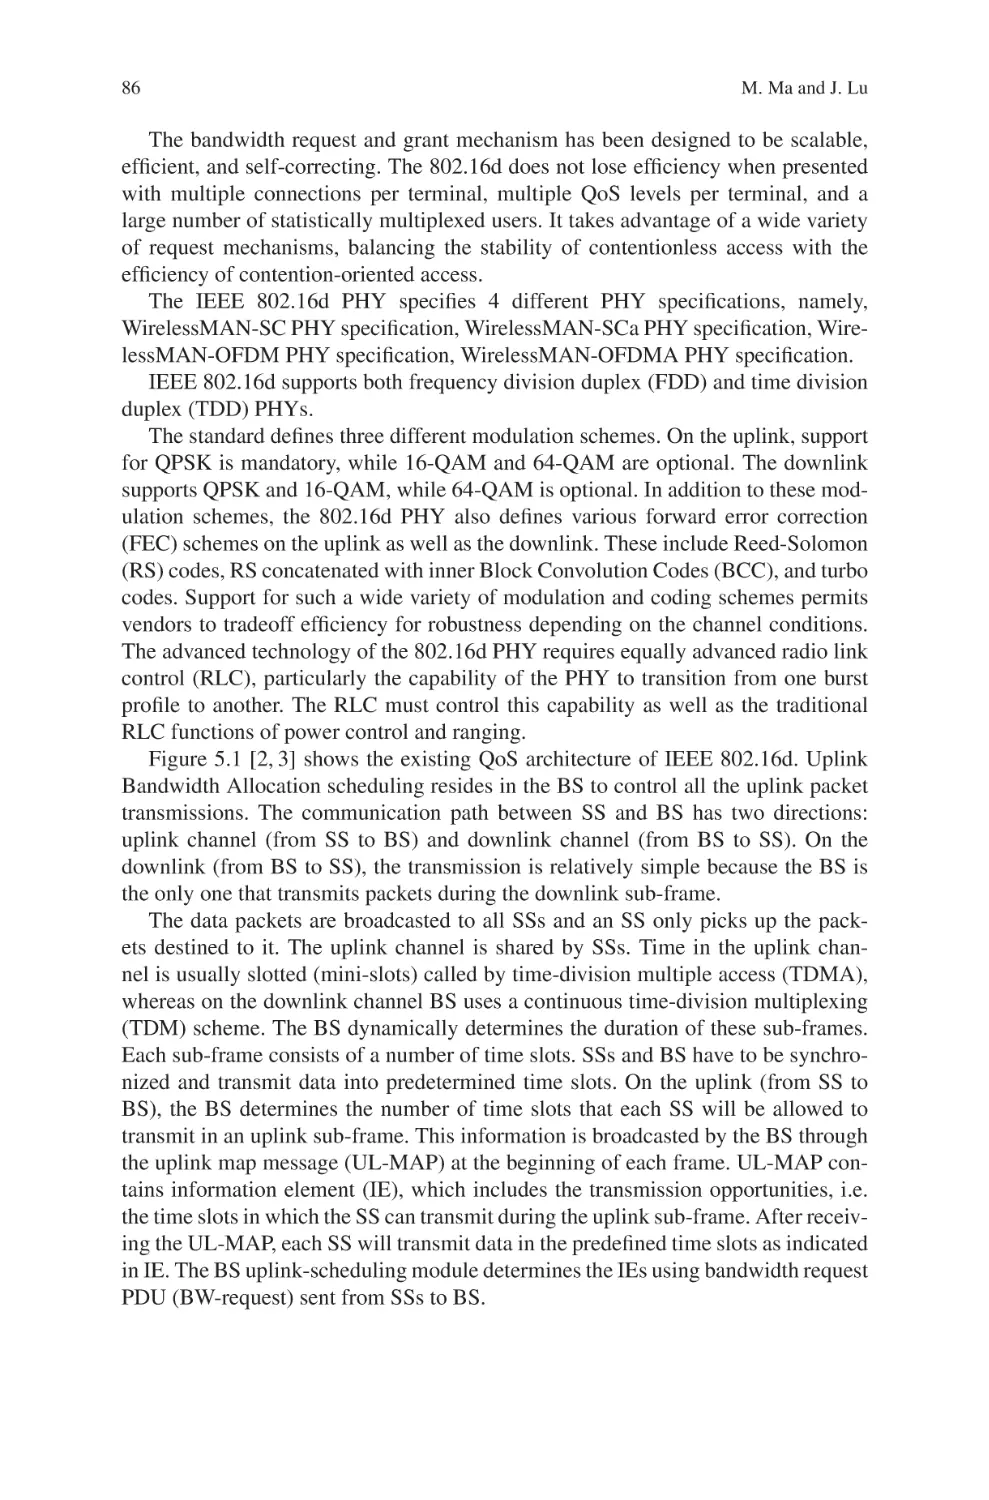
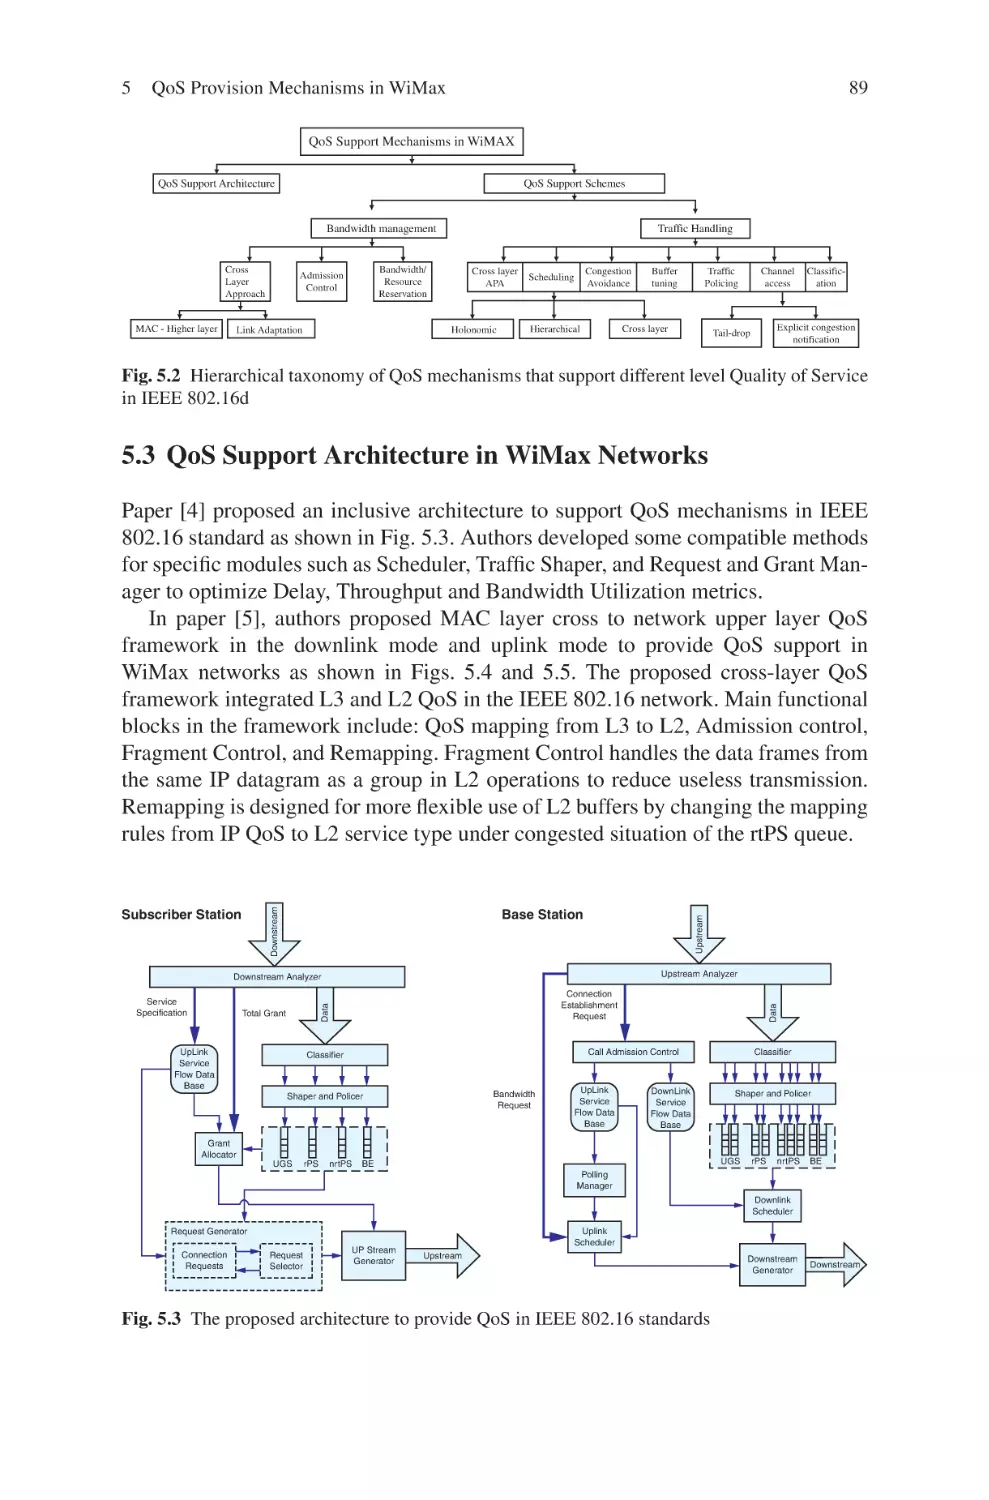
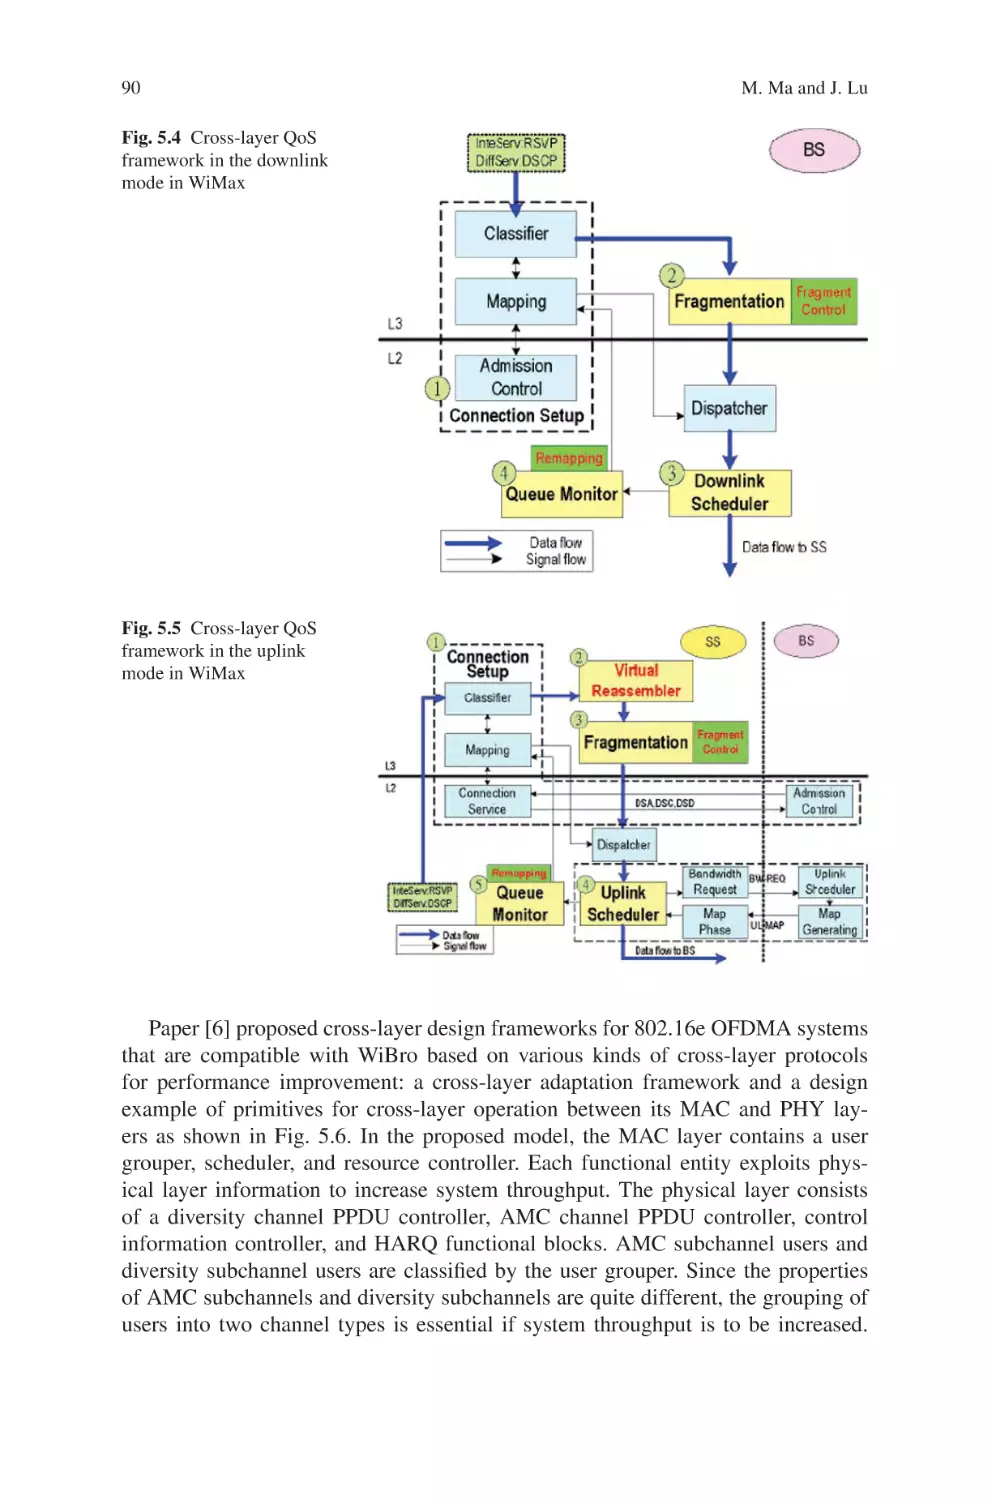
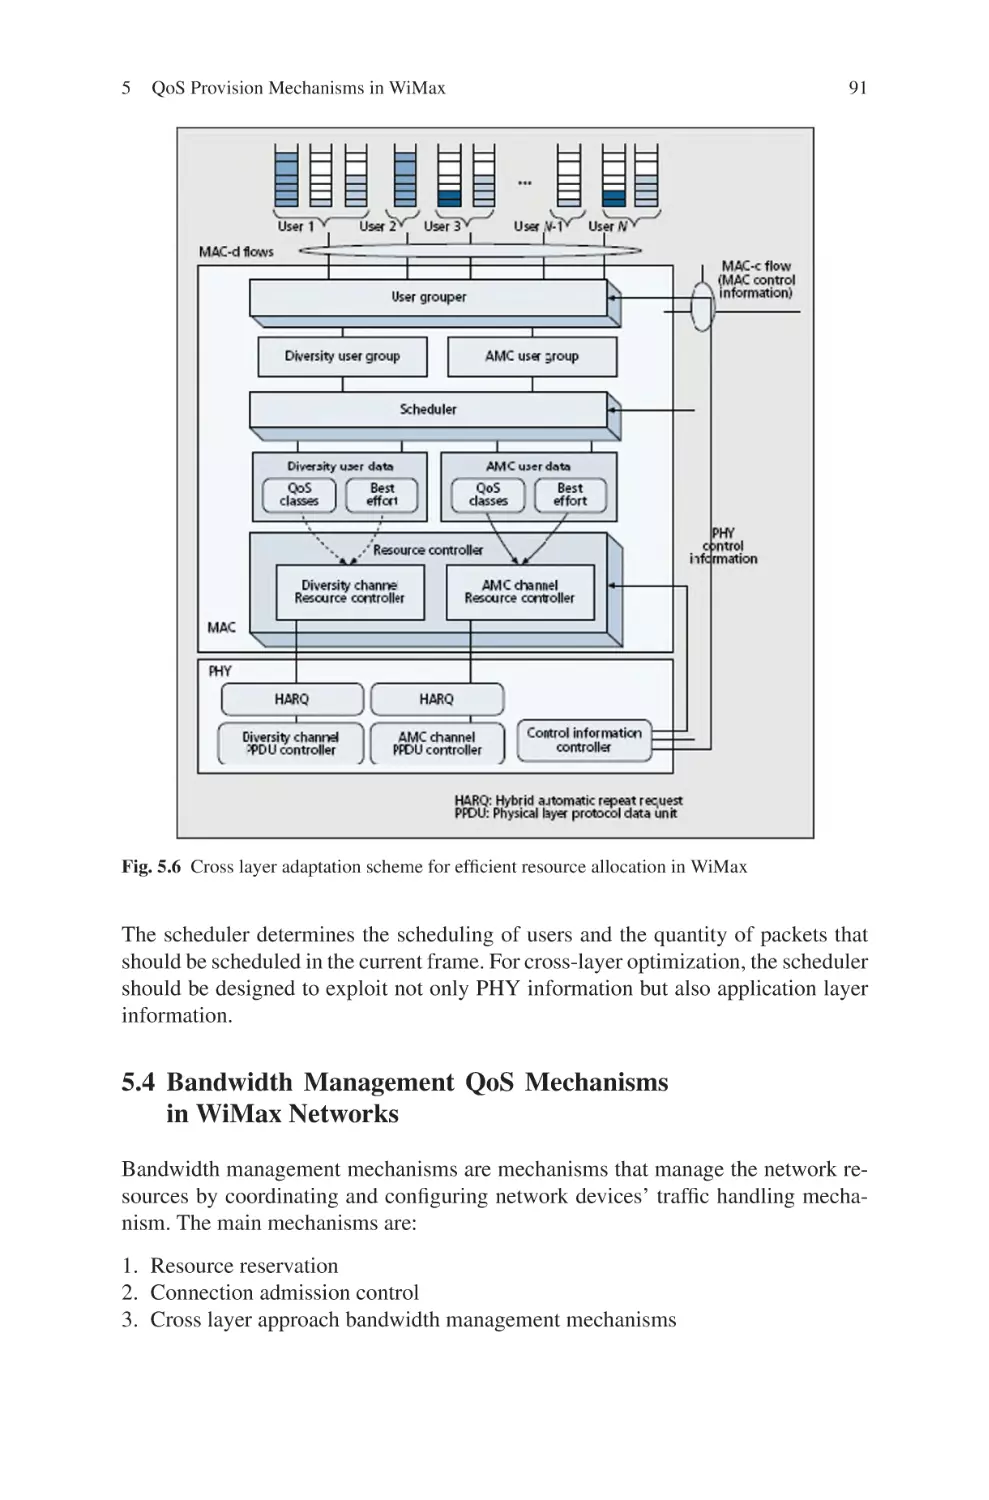
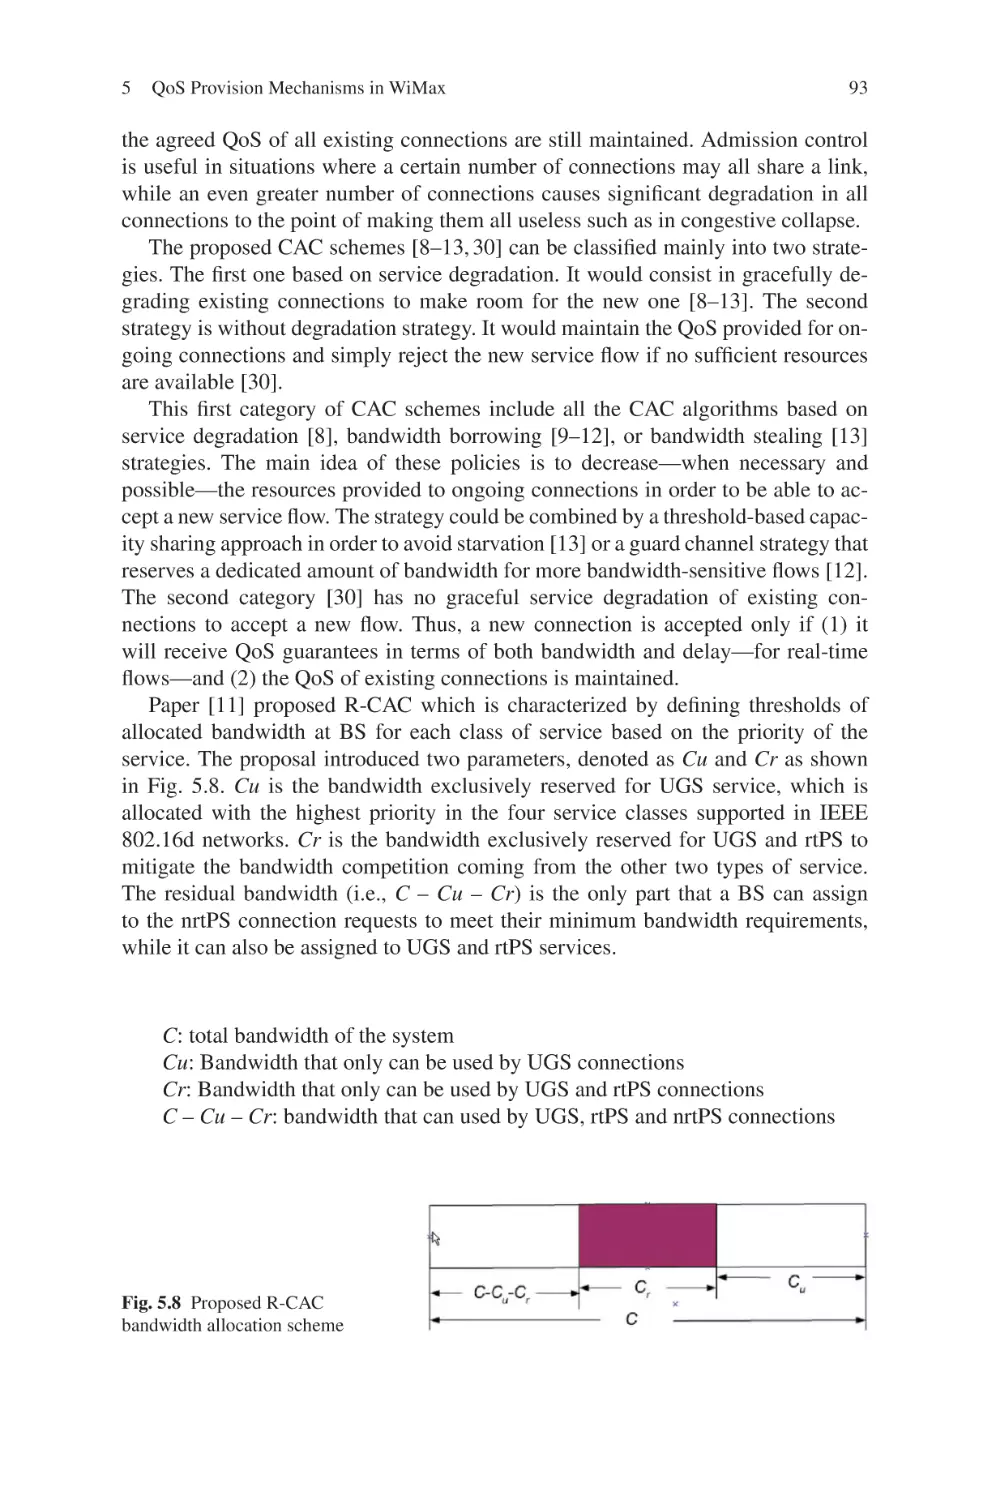
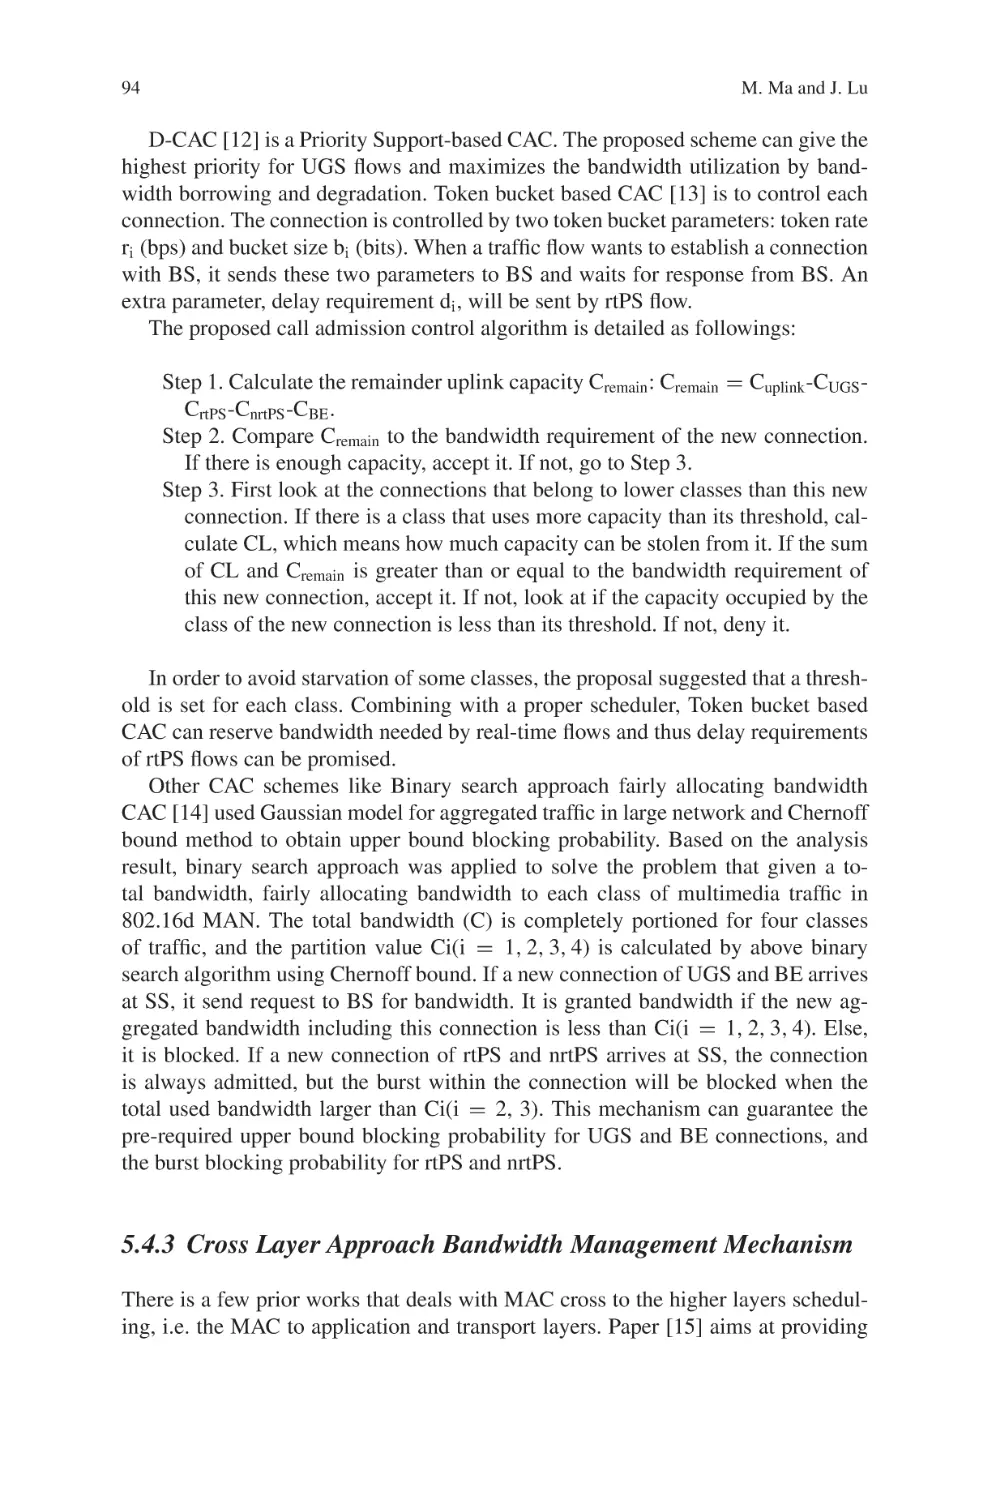
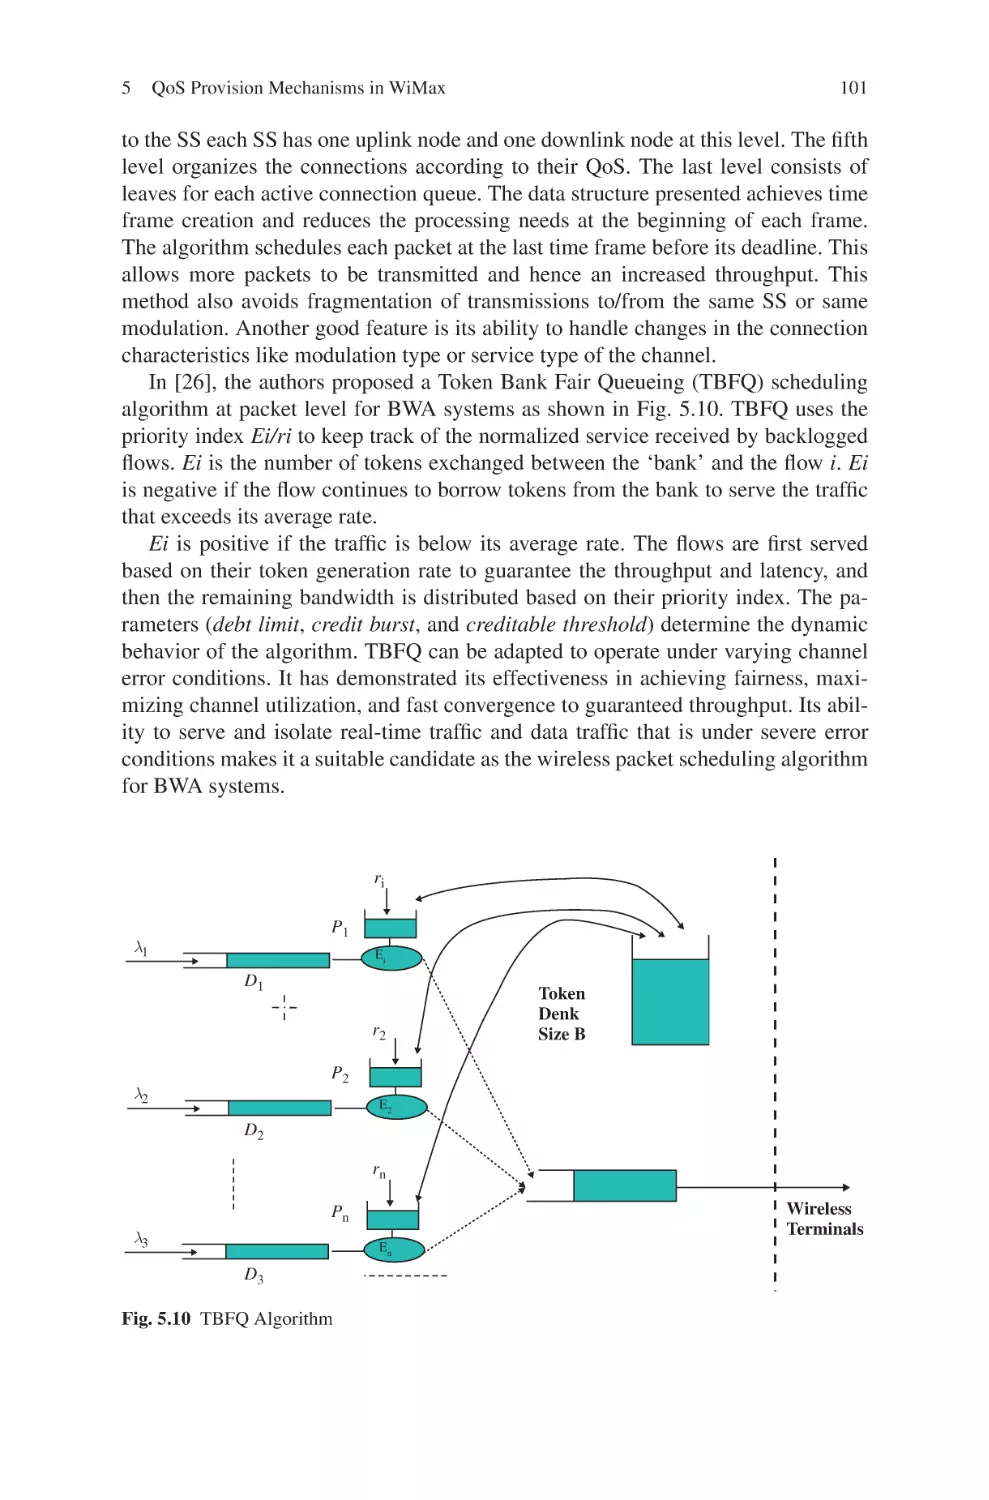
5 QoS Provision Mechanisms in WiMax . . . . . . . . . . . . . . . . . . . . . . . . . . . . 85
Maode Ma and Jinchang Lu
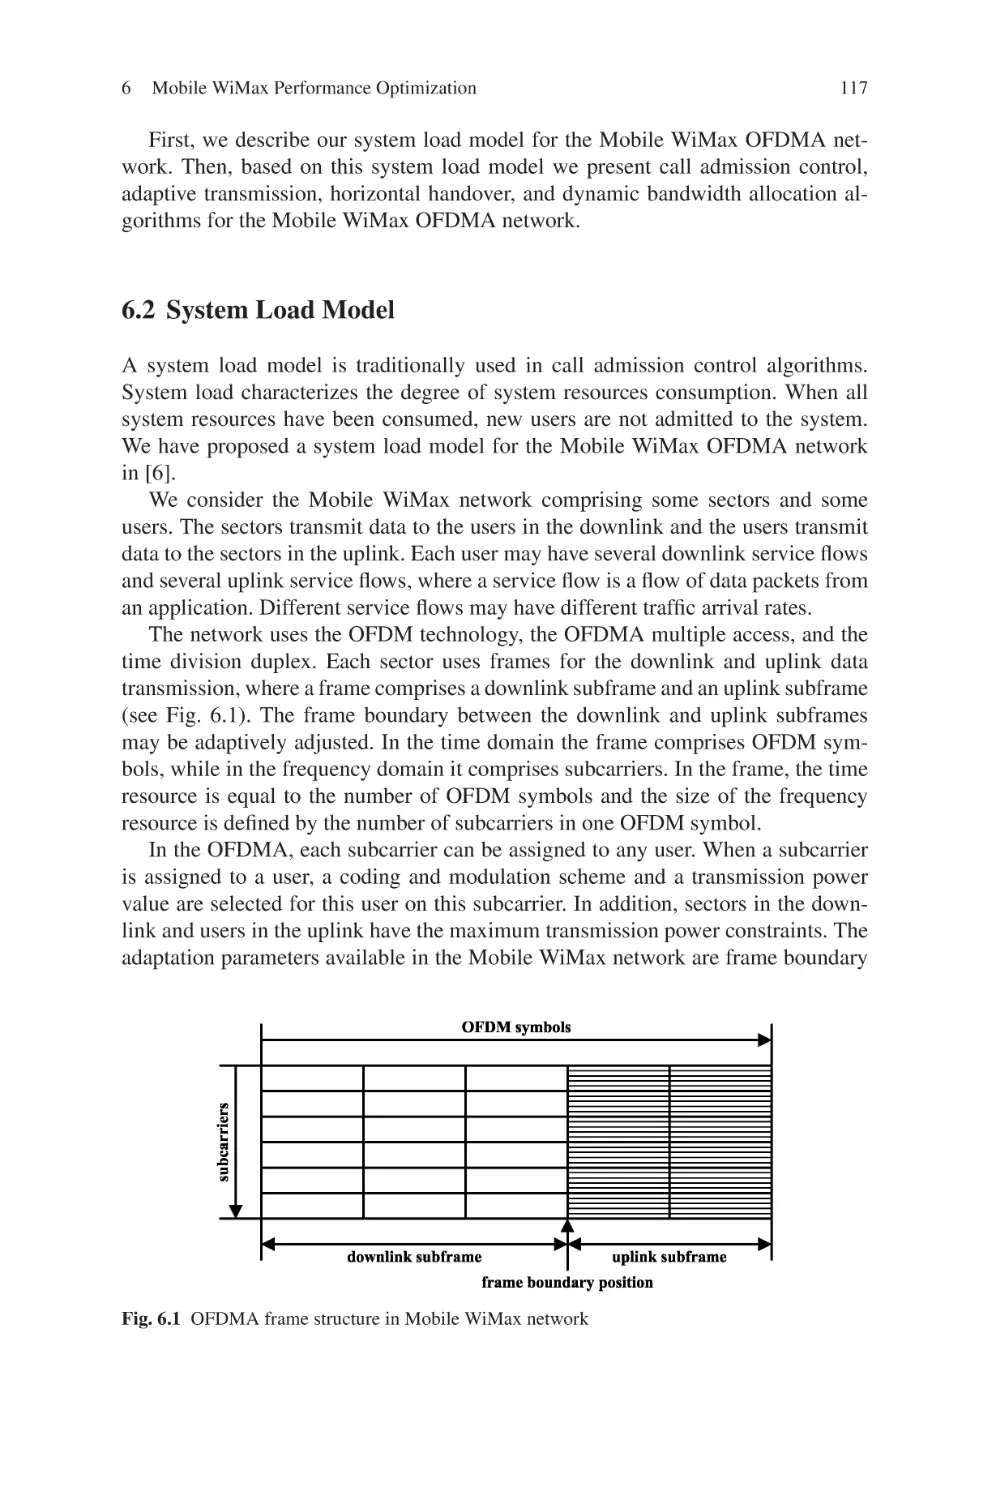
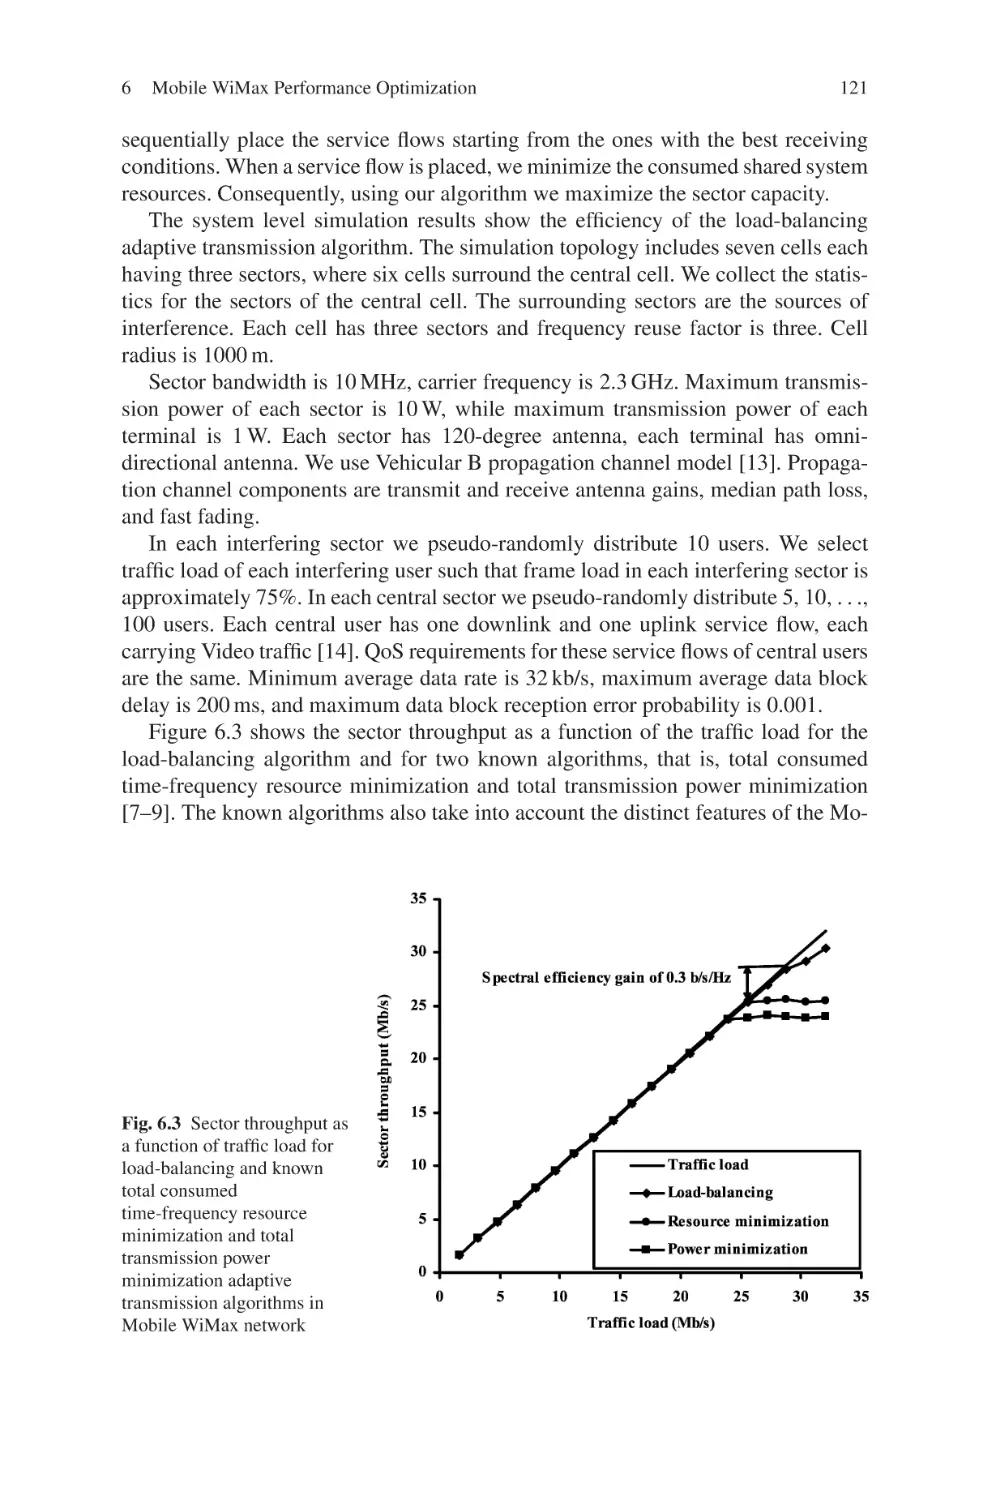
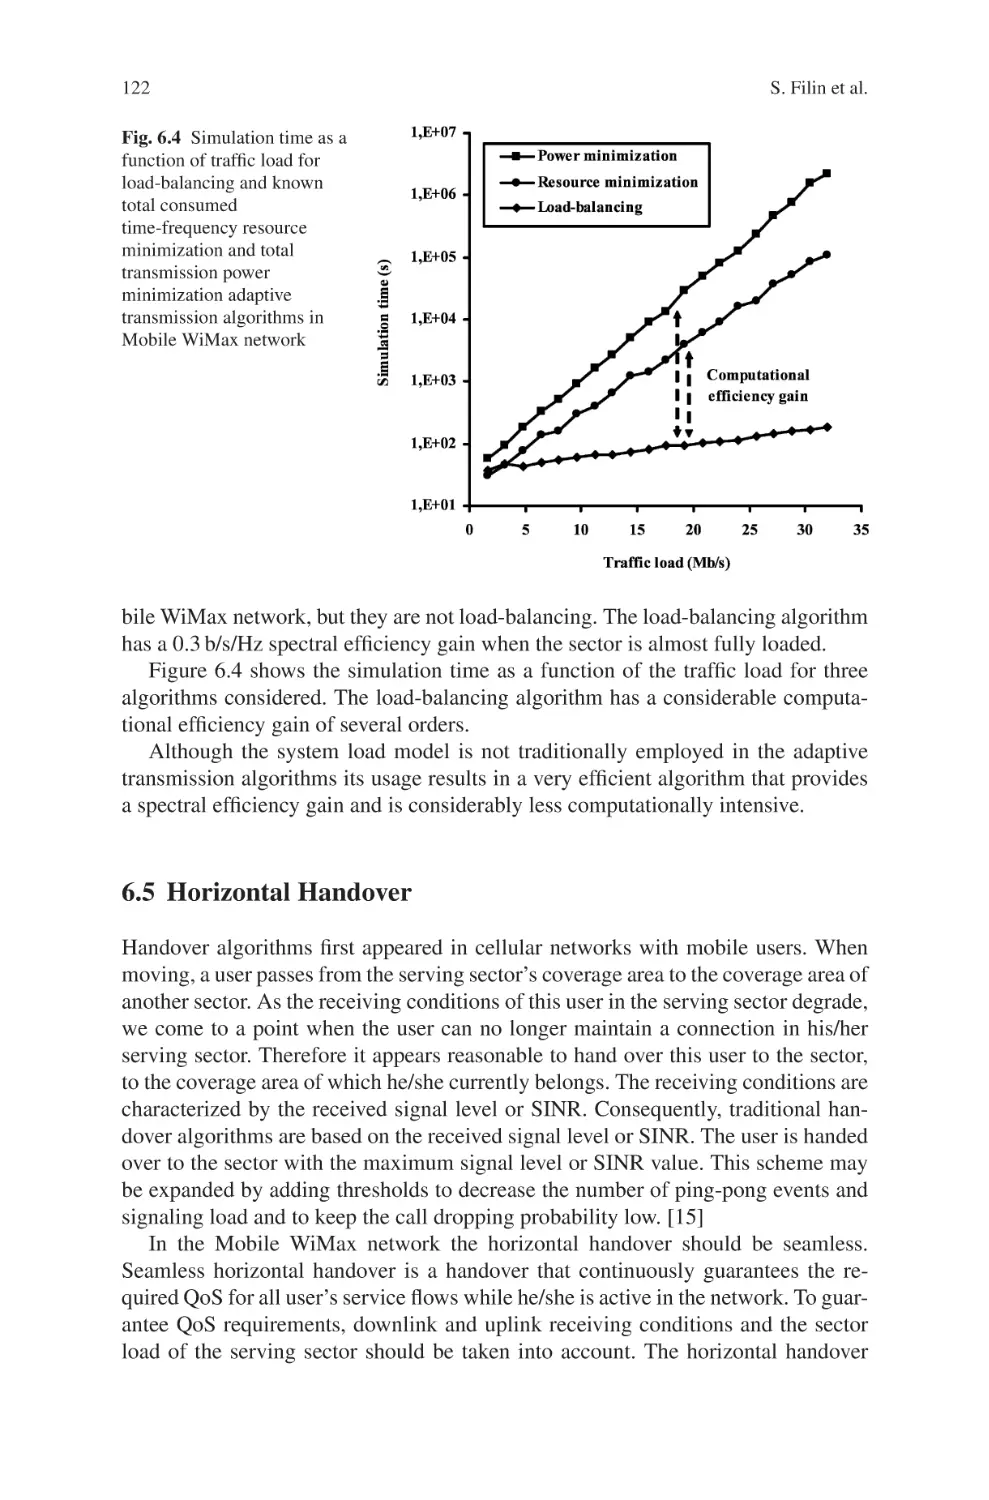
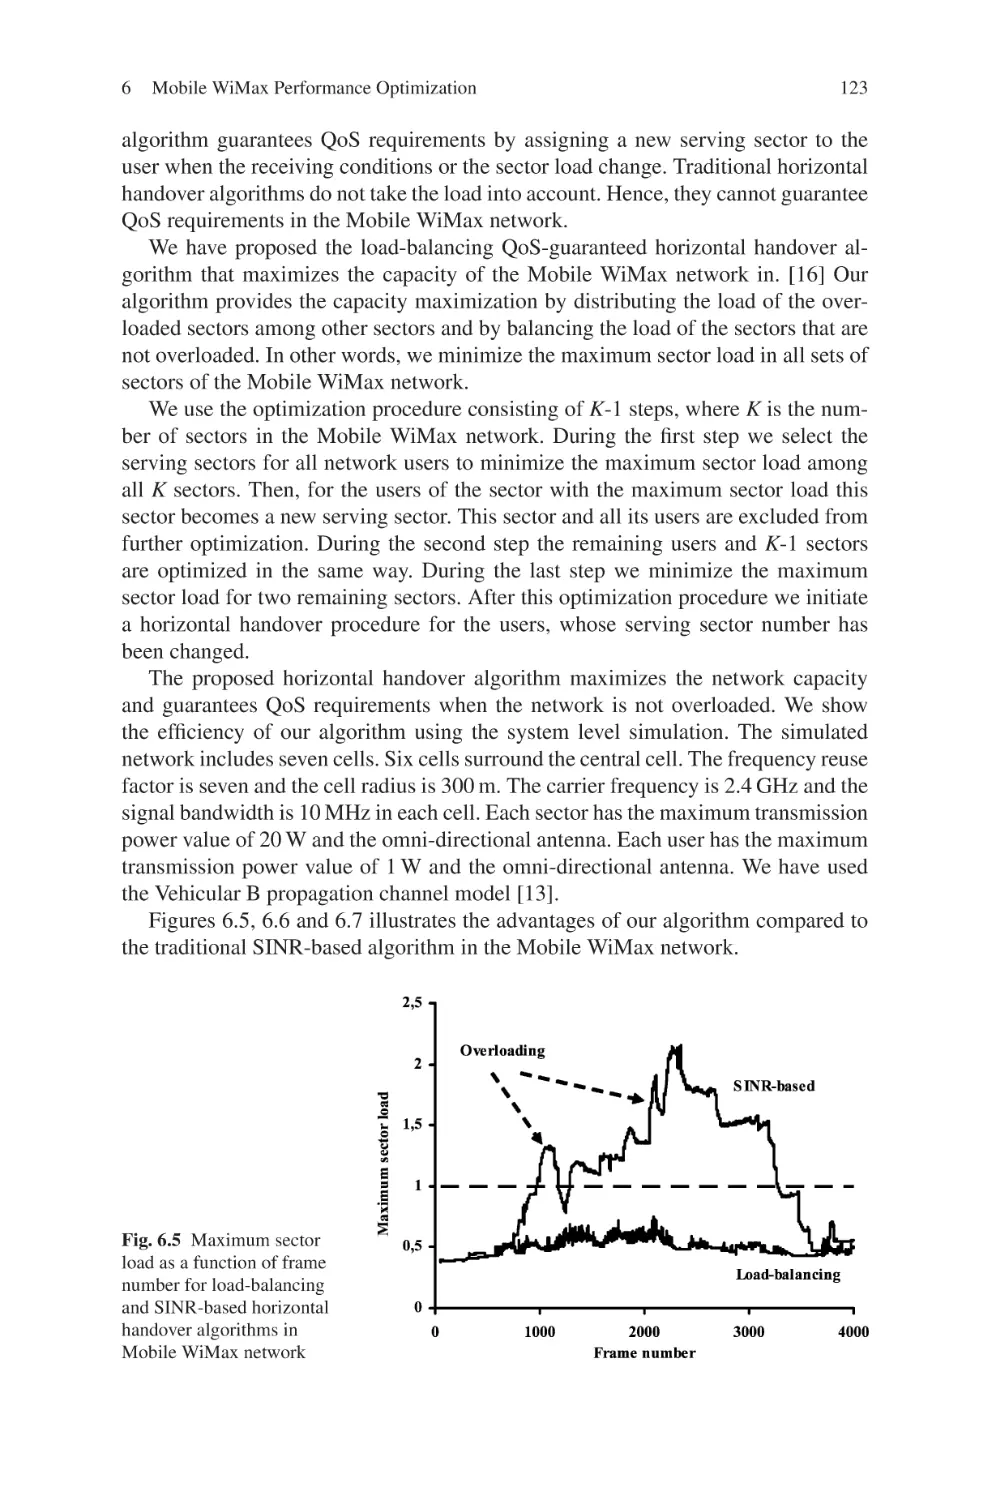
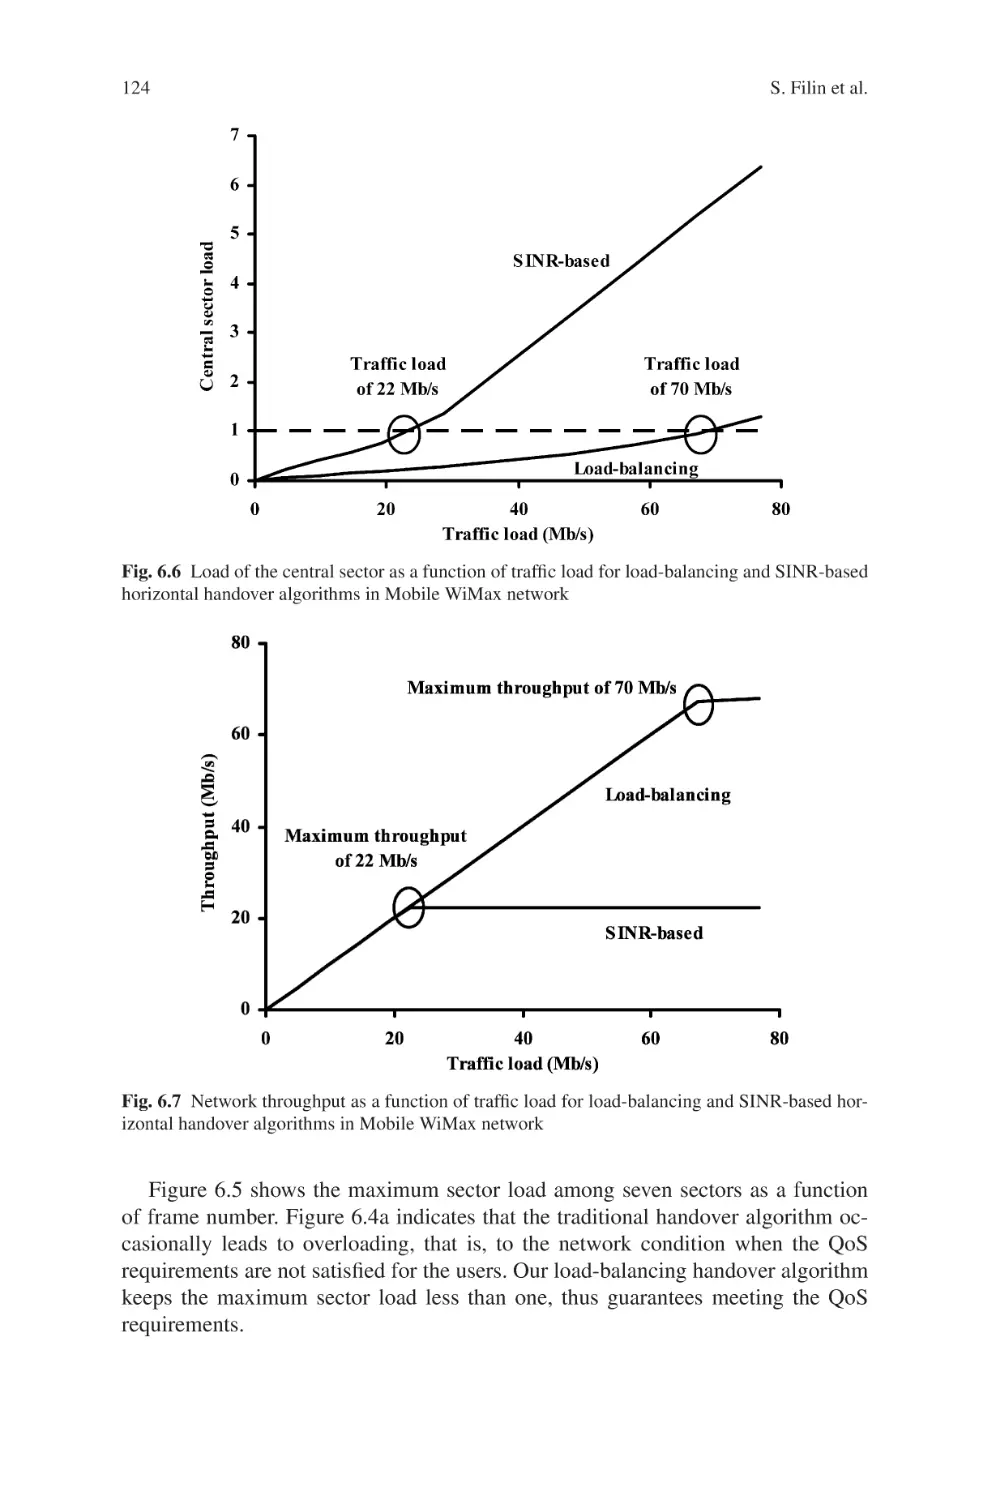
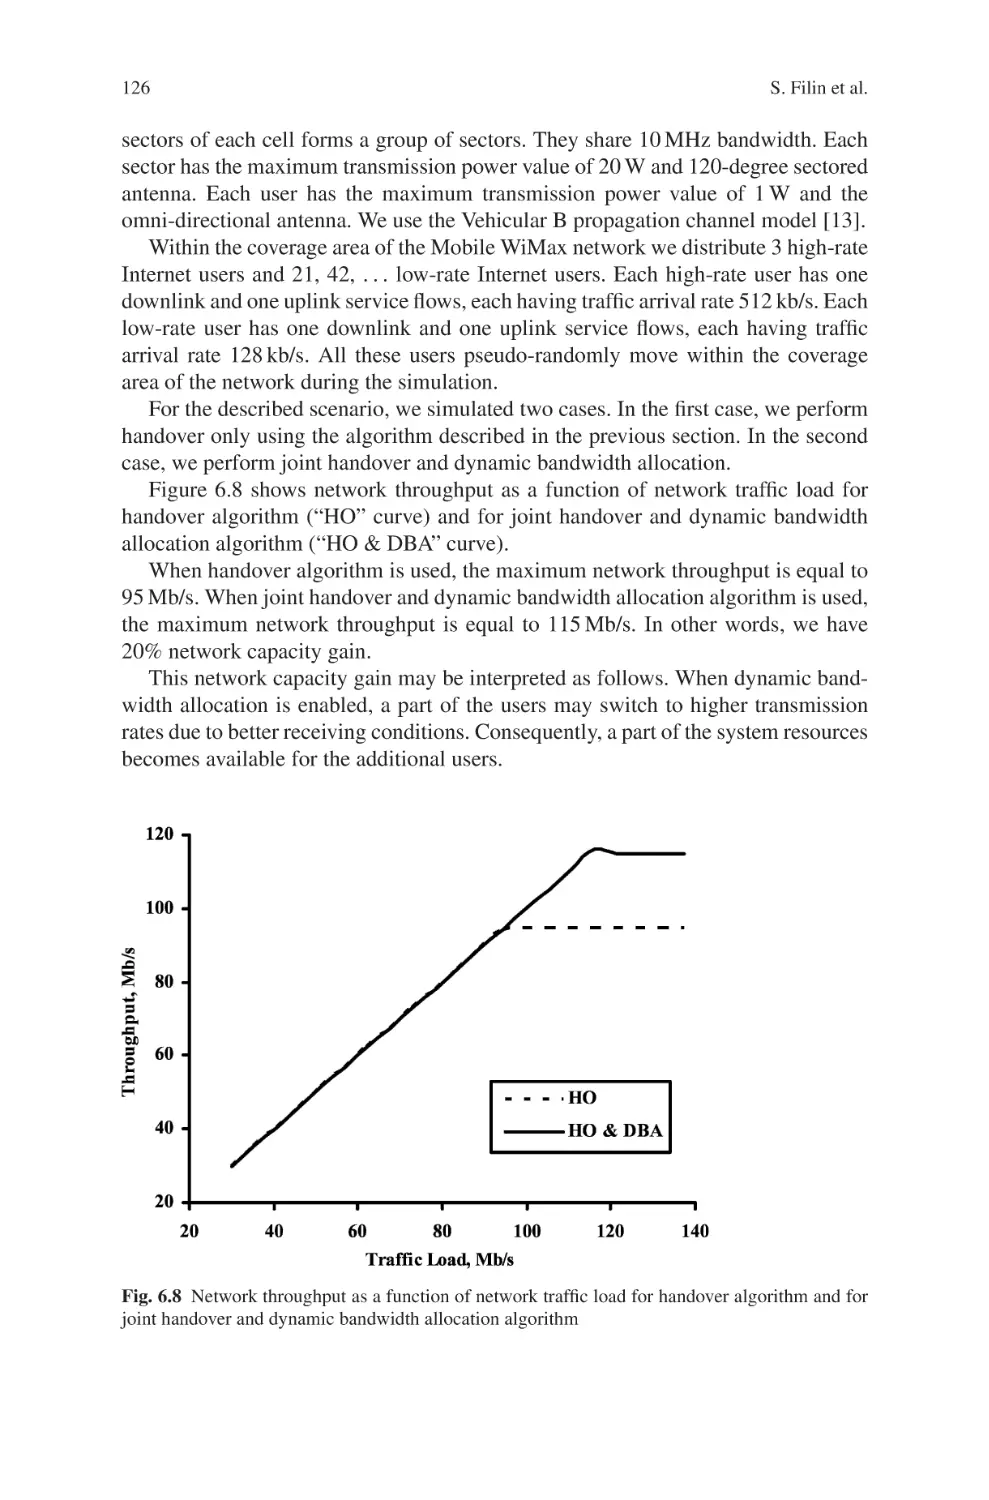
6 Mobile WiMax Performance Optimization . . . . . . . . . . . . . . . . . . . . . . . . 115
Stanislav Filin, Sergey Moiseev and Mikhail Kondakov
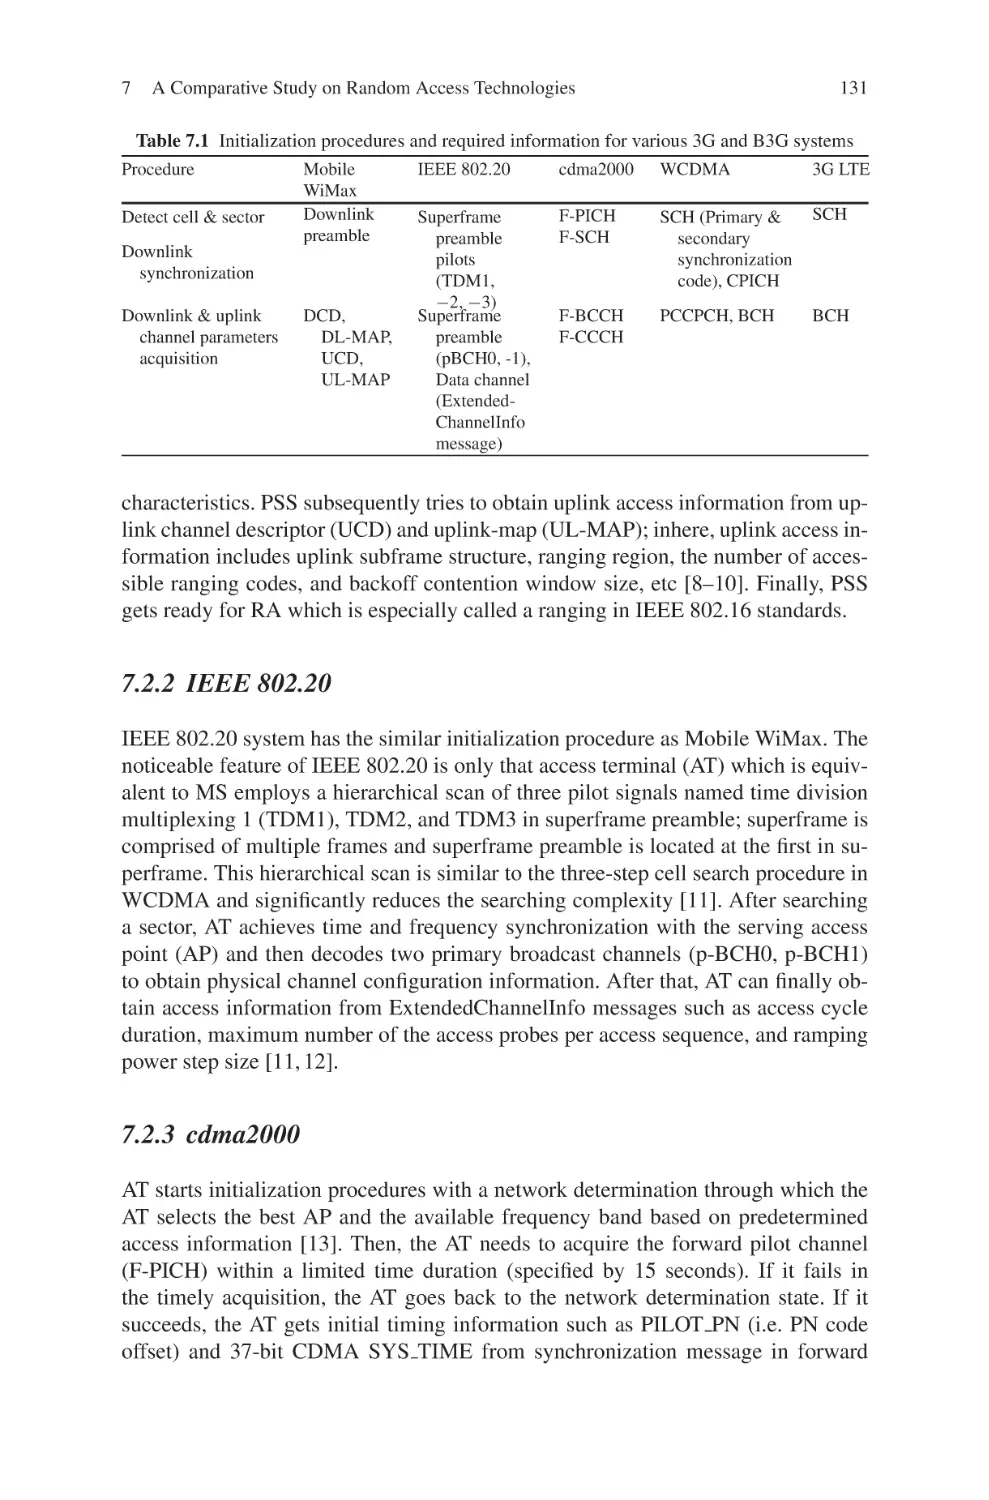
7 A Comparative Study on Random Access Technologies of 3G and
B3G Mobile Communications Systems . . . . . . . . . . . . . . . . . . . . . . . . . . . . 129
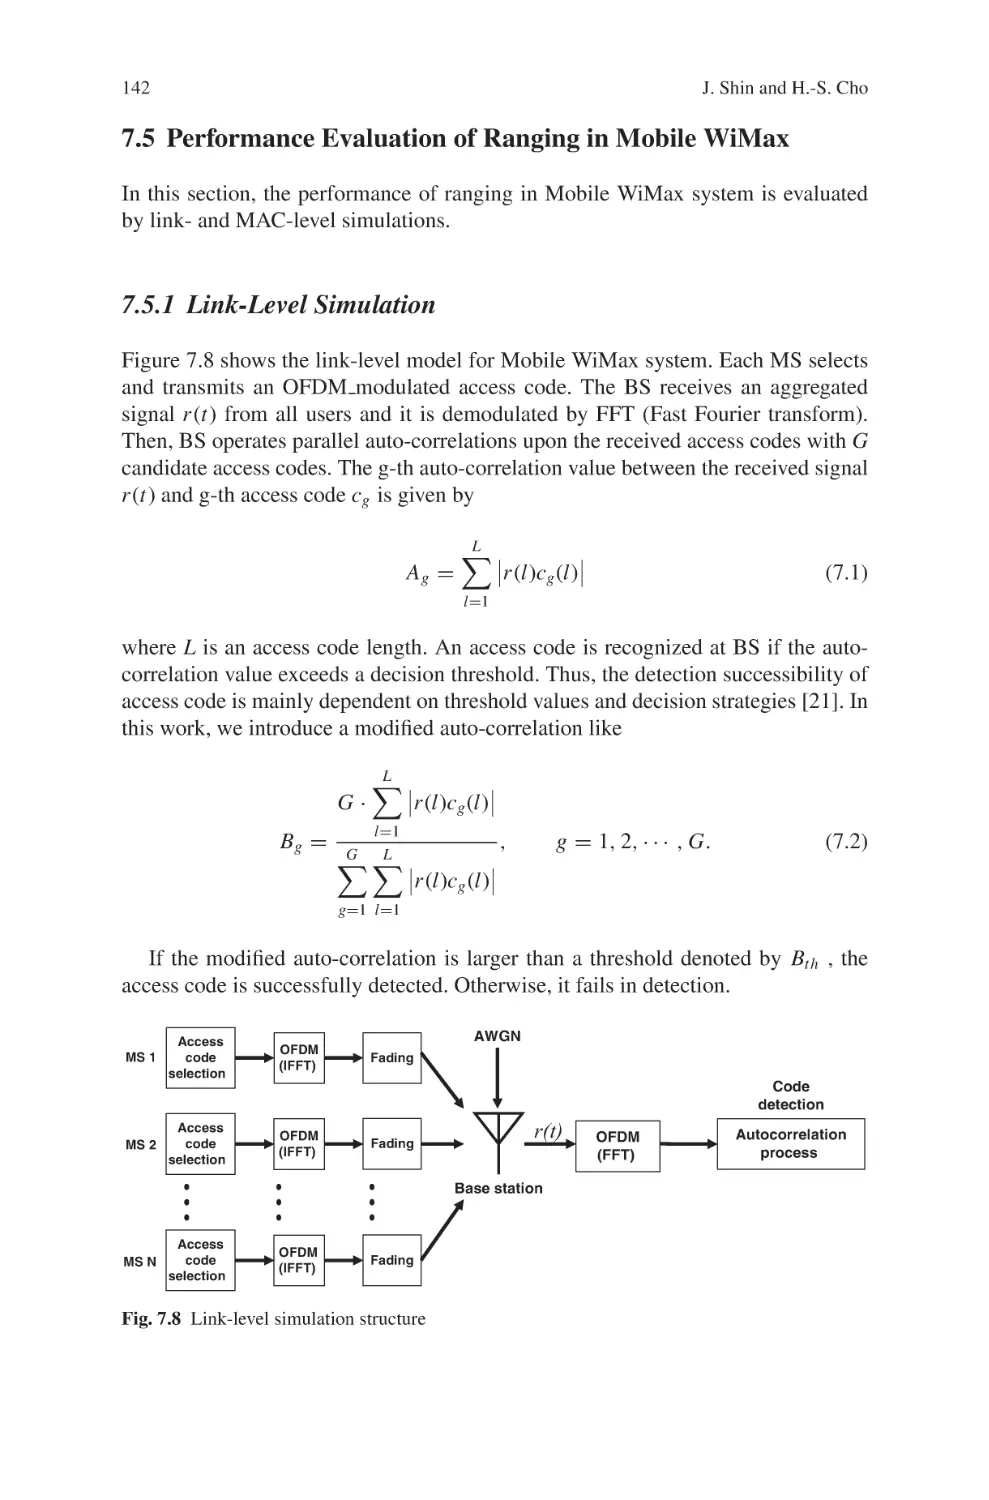
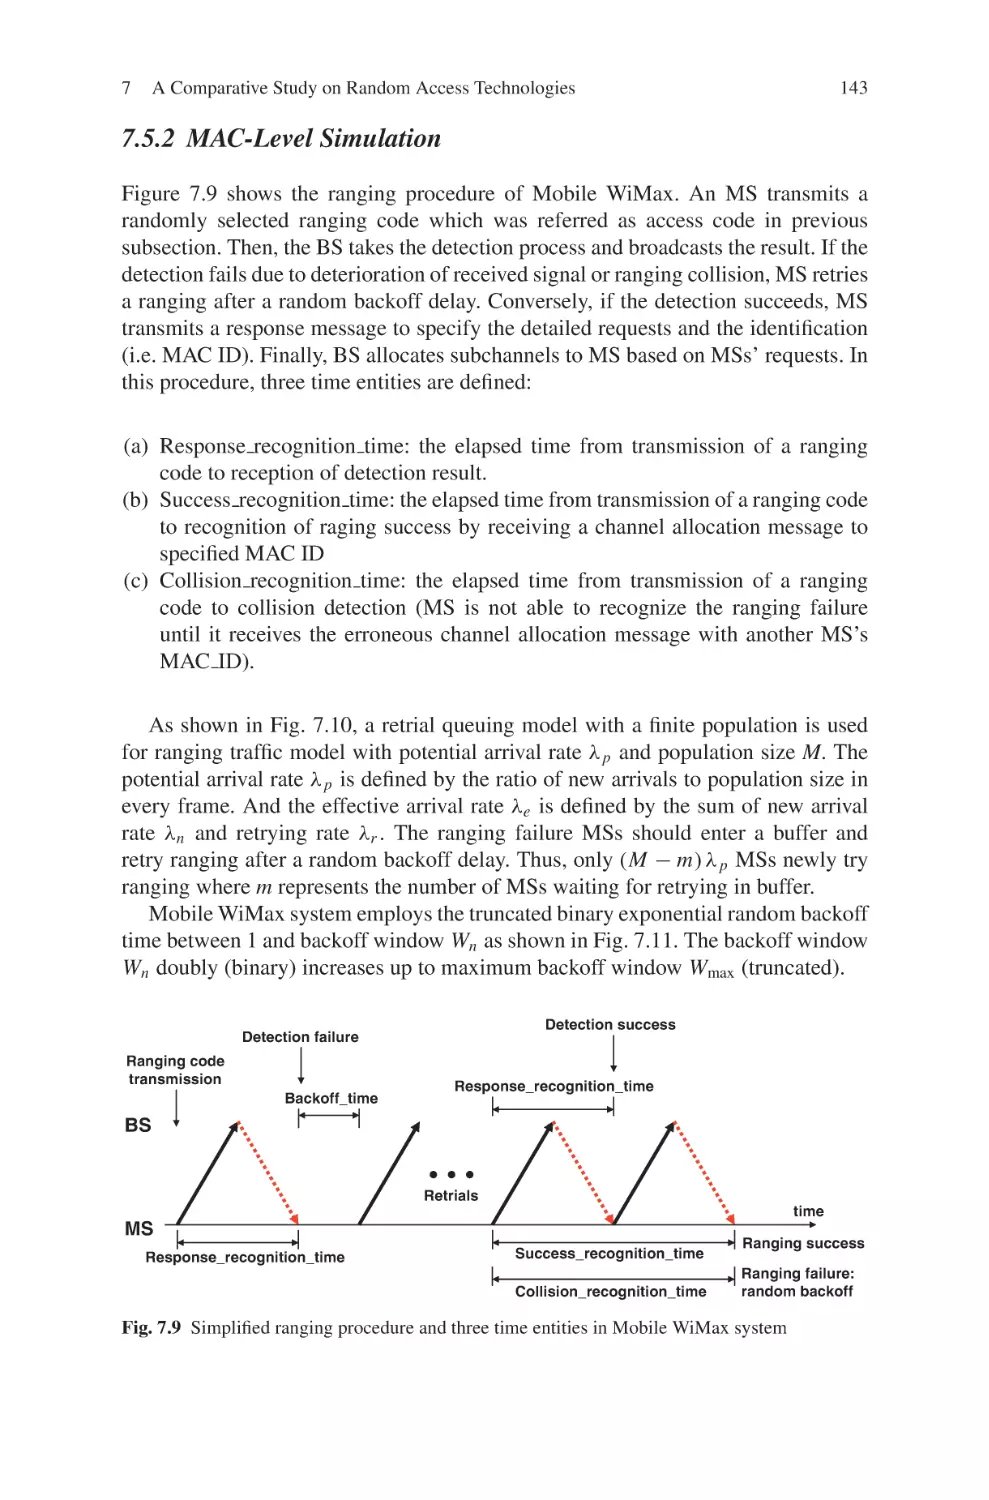
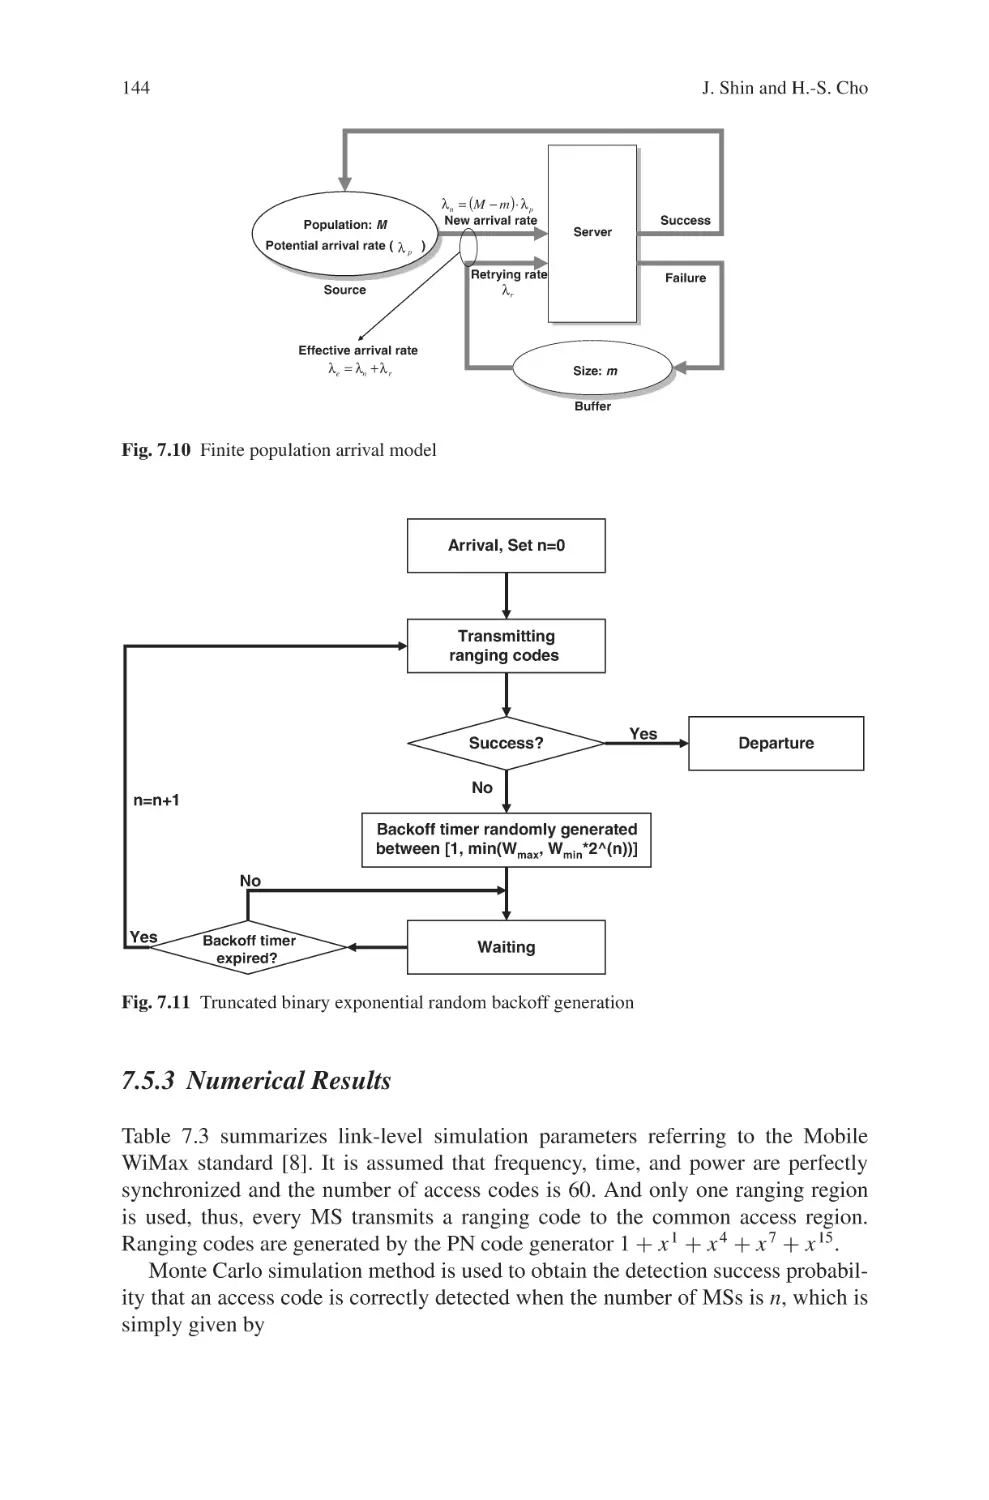
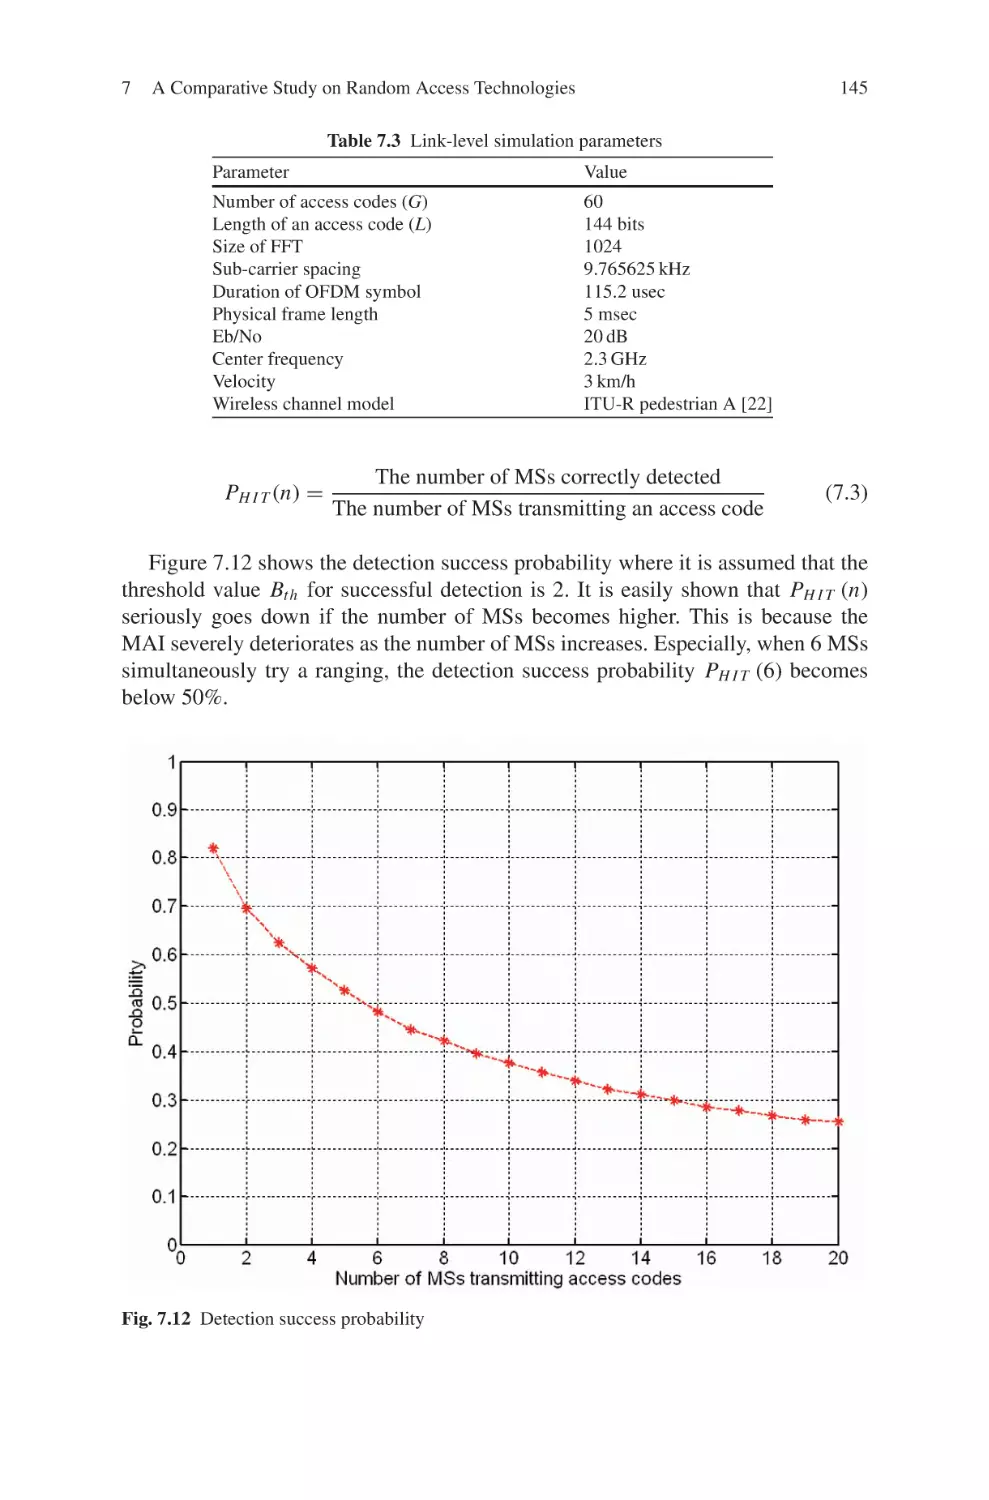
Jungchae Shin and Ho-Shin Cho
8 An Improved Fast Base Station Switching for IEEE 802.16e with
Reuse Partitioning . . . . . . . . . . . . . . . . . . . . . . . . . . . . . . . . . . . . . . . . . . . . . 151
I-Kang Fu, Hsiang-Jung Chiu and Wern-Ho Sheen
ix
x
Contents
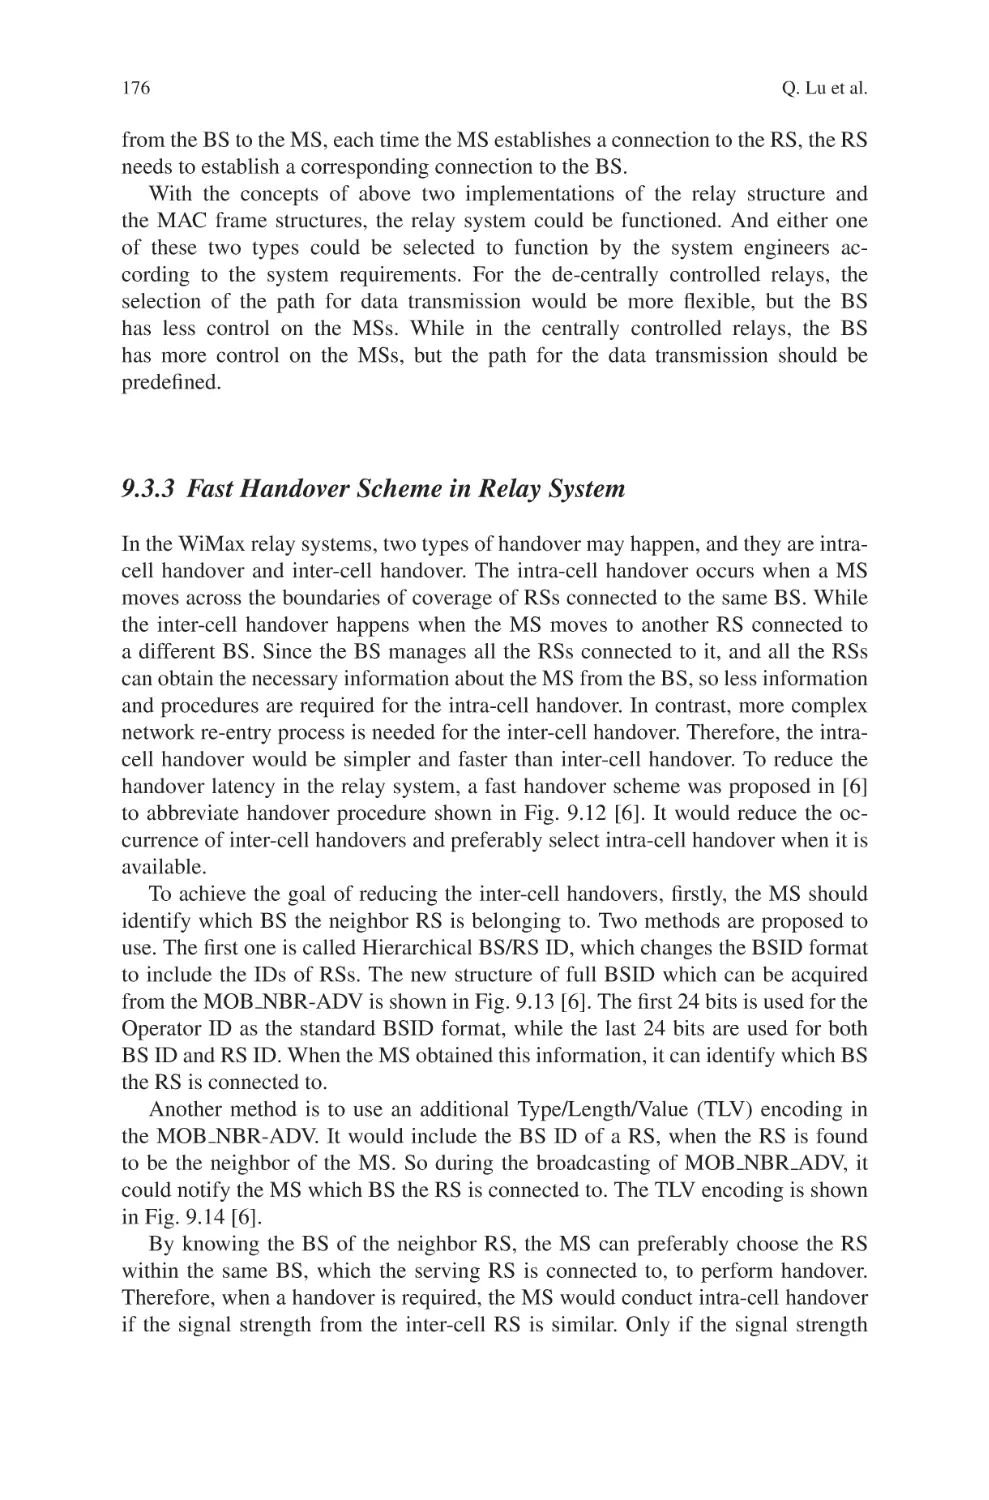
9 Fast Handover Schemes in IEEE 802.16E Broadband Wireless
Access System . . . . . . . . . . . . . . . . . . . . . . . . . . . . . . . . . . . . . . . . . . . . . . . . . 163
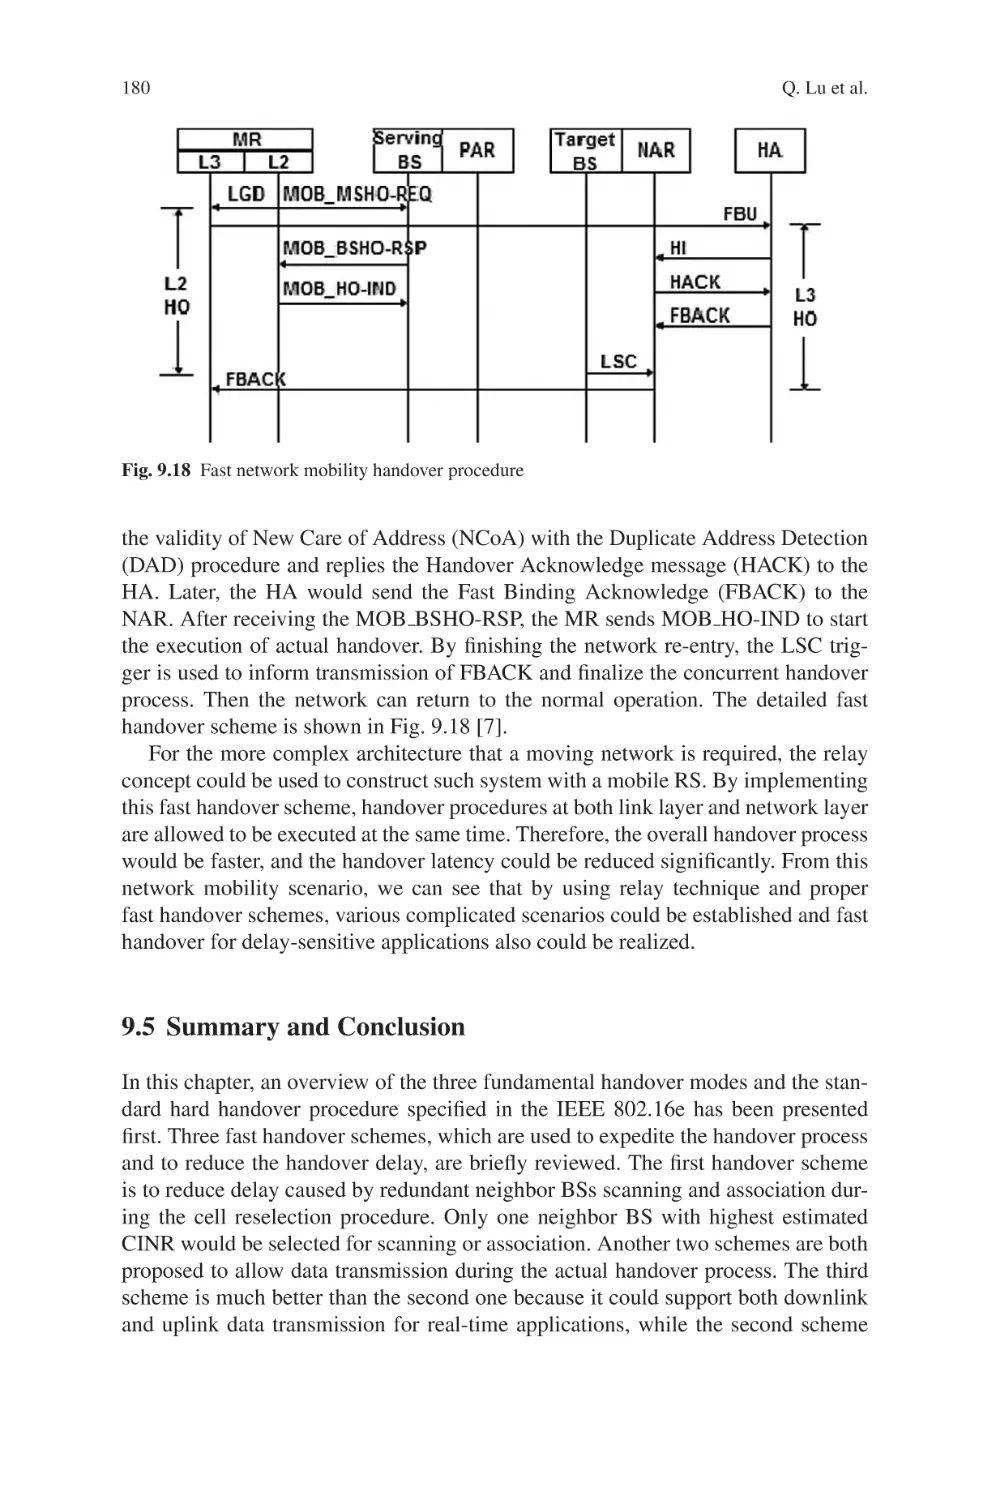
Qi Lu, Maode Ma and Hui Ming Liew
10 Addressing Multiservice Classes and Hybrid Architecture in
WiMax Networks . . . . . . . . . . . . . . . . . . . . . . . . . . . . . . . . . . . . . . . . . . . . . . 183
Kamal Gakhar, Mounir Achir, Alain Leroy and Annie Gravey
11 Energy-Efficient Multimedia Delivery in WMAN Using User
Cooperation Diversity . . . . . . . . . . . . . . . . . . . . . . . . . . . . . . . . . . . . . . . . . . 237
Ki-Dong Lee, Byung K. Yi and Victor C.M. Leung
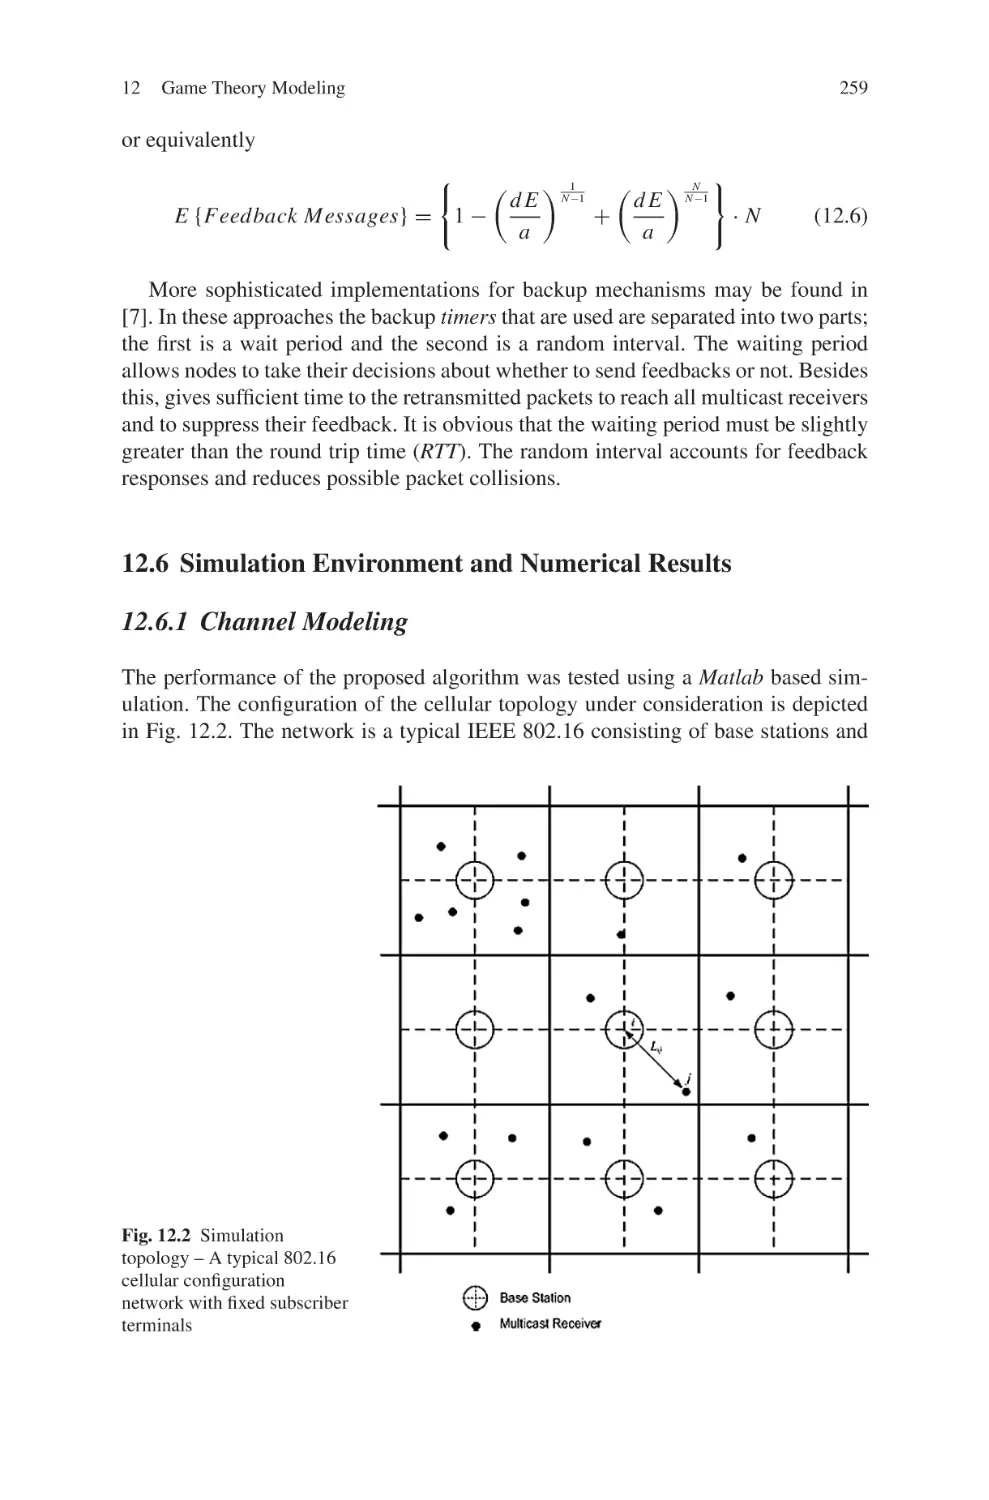
12 Game Theory Modeling of Social Psychology Principle for Reliable
Multicast Services in WiMax Networks . . . . . . . . . . . . . . . . . . . . . . . . . . . 251
Markos P. Anastasopoulos, Athanasios V. Vasilakos
and Panayotis G. Cottis
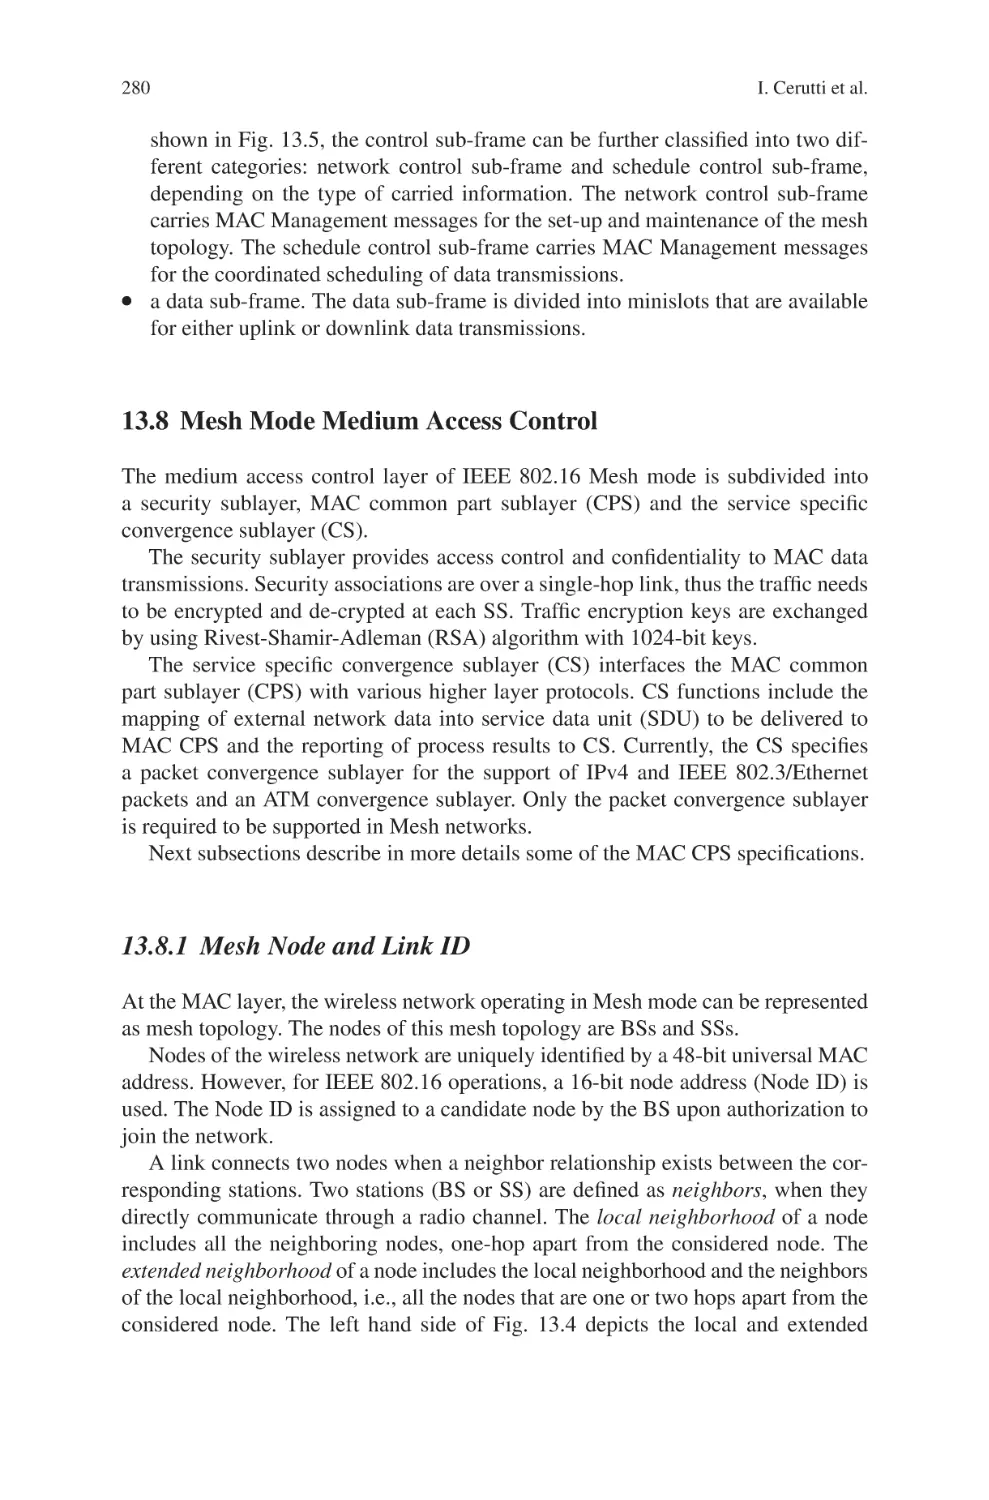
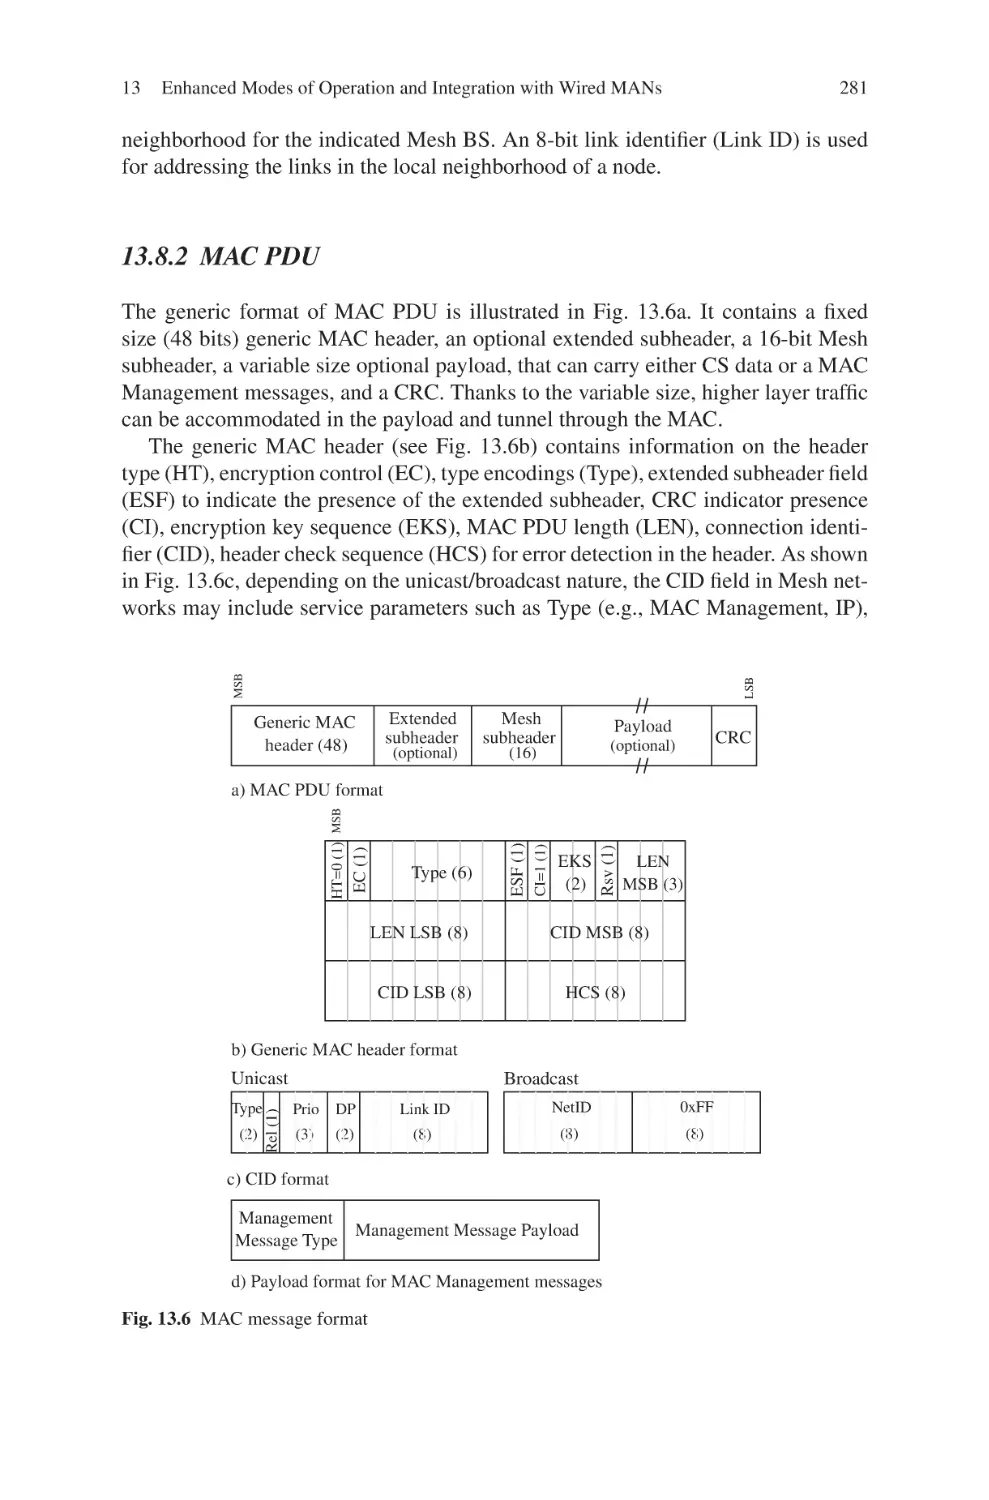
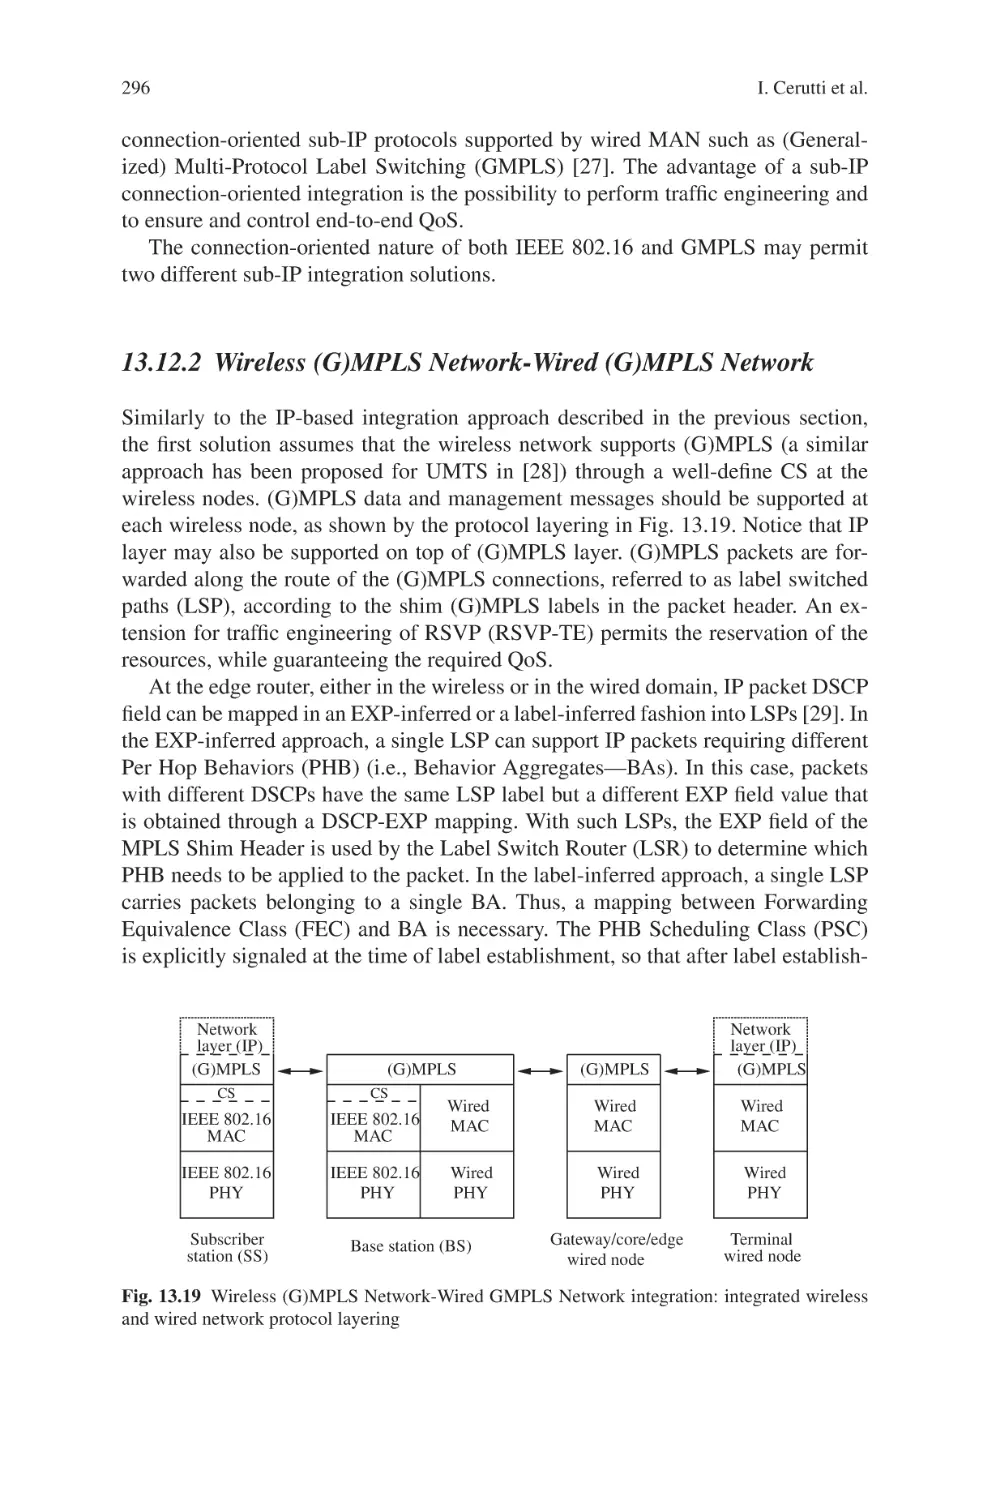
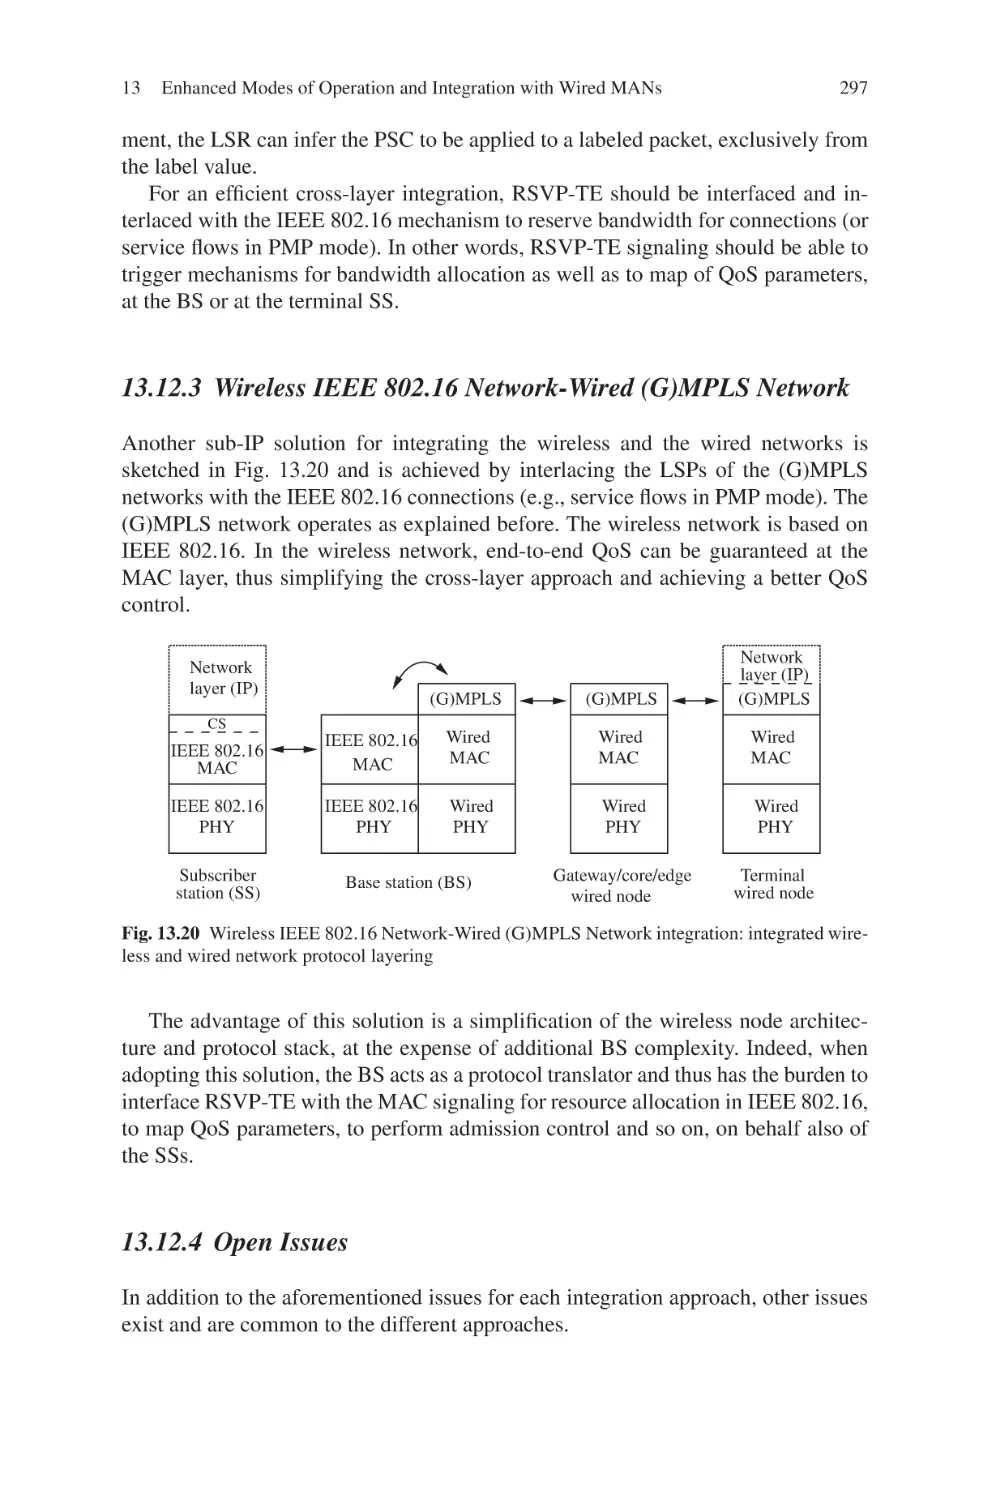
13 IEEE 802.16: Enhanced Modes of Operation and Integration with
Wired MANs . . . . . . . . . . . . . . . . . . . . . . . . . . . . . . . . . . . . . . . . . . . . . . . . . . 265
Isabella Cerutti, Luca Valcarenghi, Piero Castoldi, Dania Marabissi,
Filippo Meucci, Laura Pierucci, Enrico Del Re, Luca Simone Ronga,
Ramzi Tka and Farouk Kamoun
Biography of the Editor
Dr. Maode Ma received his BE degree in Computer
Engineering from Tsinghua University in 1982, ME degree
in Computer Engineering from Tianjin University in 1991
and PhD degree in Computer Science from Hong Kong
University of Science and Technology in 1999. He is an
Associate Professor in the School of Electrical and Electronic Engineering at Nanyang Technological University
in Singapore. He has extensive research interests including
wireless networking, optical networking, and so forth. He
has been a member of the technical program committee for
more than 80 international conferences. He has been a technical track chair, tutorial
chair, publication chair, and session chair for more than 40 international conferences. Dr. Ma has published more than 130 international academic research papers
on wireless networks and optical networks. He currently serves as an Associate Editor for IEEE Communications Letters, an Editor for IEEE Communications Surveys
and Tutorials, an Associate Editor for International Journal of Wireless Communications and Mobile Computing, an Associate Editor for International Journal of
Security and Communication Networks, and an Associate Editor for International
Journal of Vehicular Technology.
xi
Contributors
M. Achir TELECOM Bretagne, France
M. P. Anastasopoulos Wireless & Satellite Communications Group, School of
Electrical & Computer Engineering, National Technical University of Athens, Greece
A. Bacioccola Dipartimento di Ingegneria dell’Informazione, University of Pisa,
Italy
A. Belghith TELECOM Bretagne
R. Bosisio Dip. di Elettronica e Informazione, Politecnico di Milano, Piazza L. da
Vinci 32, 20133 Milano, Italy
P. Castoldi Scuola Superiore Sant’Anna, Pisa, Italy, castoldi@sssup.it
I. Cerutti Scuola Superiore Sant’Anna, Pisa, Italy, isabella.cerutti@sssup.it
S.-H. Chien National Chiao Tung University, University Road, Hsinchu, Taiwan
H.-J. Chiu Department of Communication Engineering, National Chiao Tung
University, Hsinchu, Taiwan
H.-S. Cho School of Electrical Engineering and Computer Science, Kyungpook
National University, Daegu, Korea
C. Cicconetti Dipartimento di Ingegneria dell’Informazione, University of Pisa,
Italy
P. G. Cottis Wireless & Satellite Communications Group, School of Electrical &
Computer Engineering, National Technical University of Athens, Greece
E. Del Re Università degli Studi di Firenze, Italy, enrico.delre@unifi.it
xiii
xiv
Contributors
A. Erta IMT Lucca Institute for Advanced Studies, Lucca, Italy
S. Filin National Institute of Information and Communications Technology, 3-4,
Hikarino-oka, Yokosuka, 239-0847, Japan
I.-K. Fu Department of Communication Engineering, National Chiao Tung University, Hsinchu, Taiwan
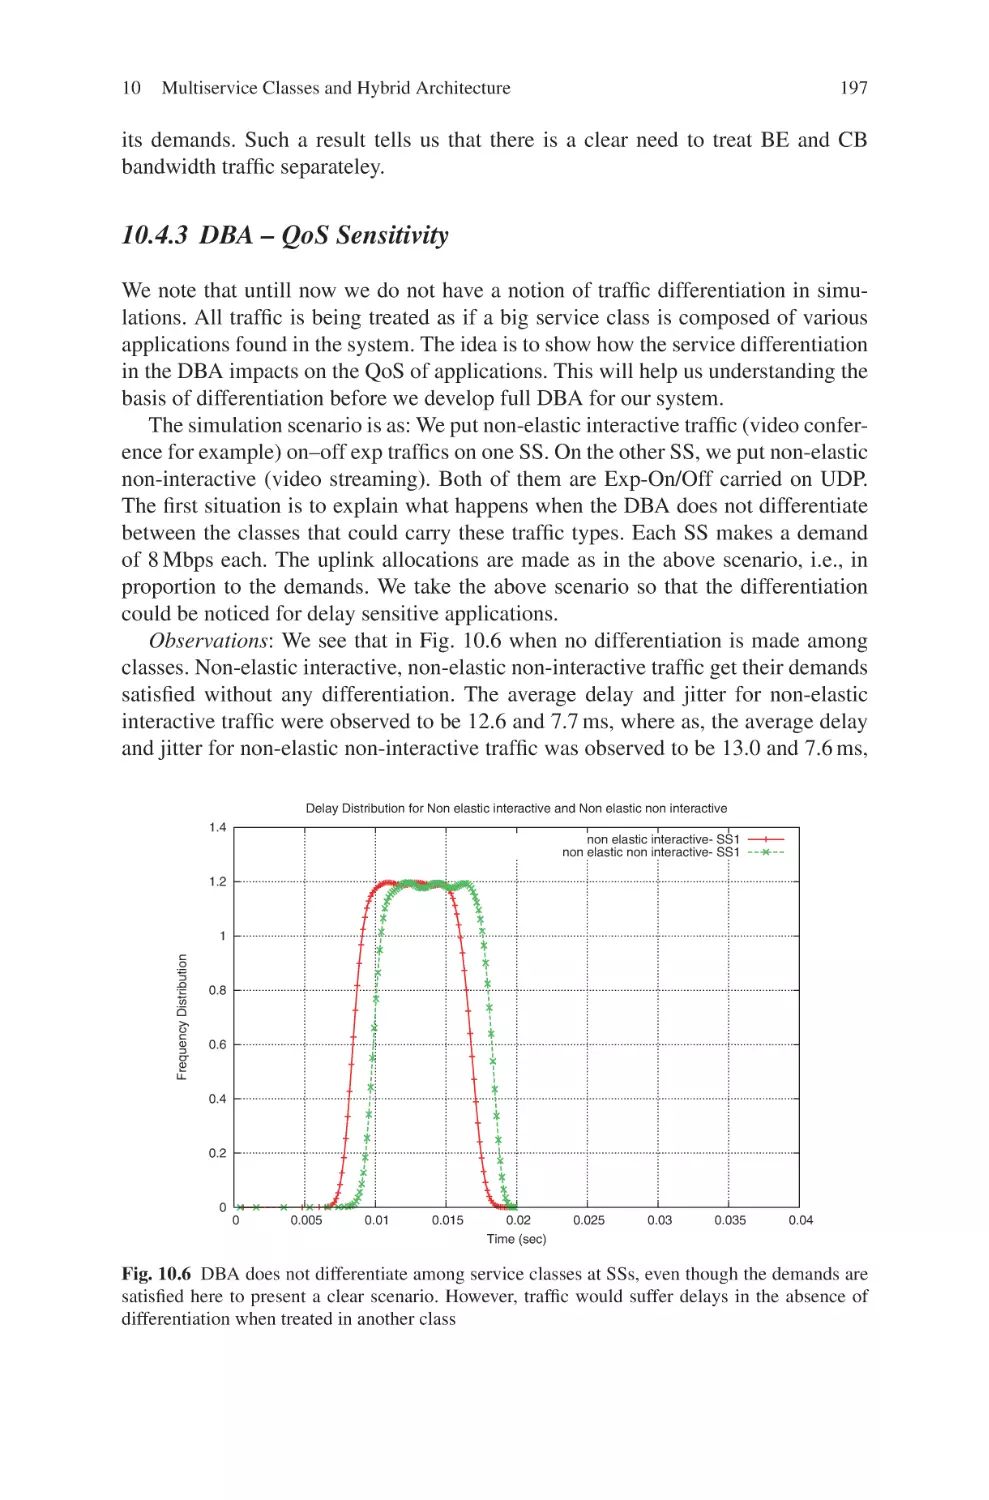
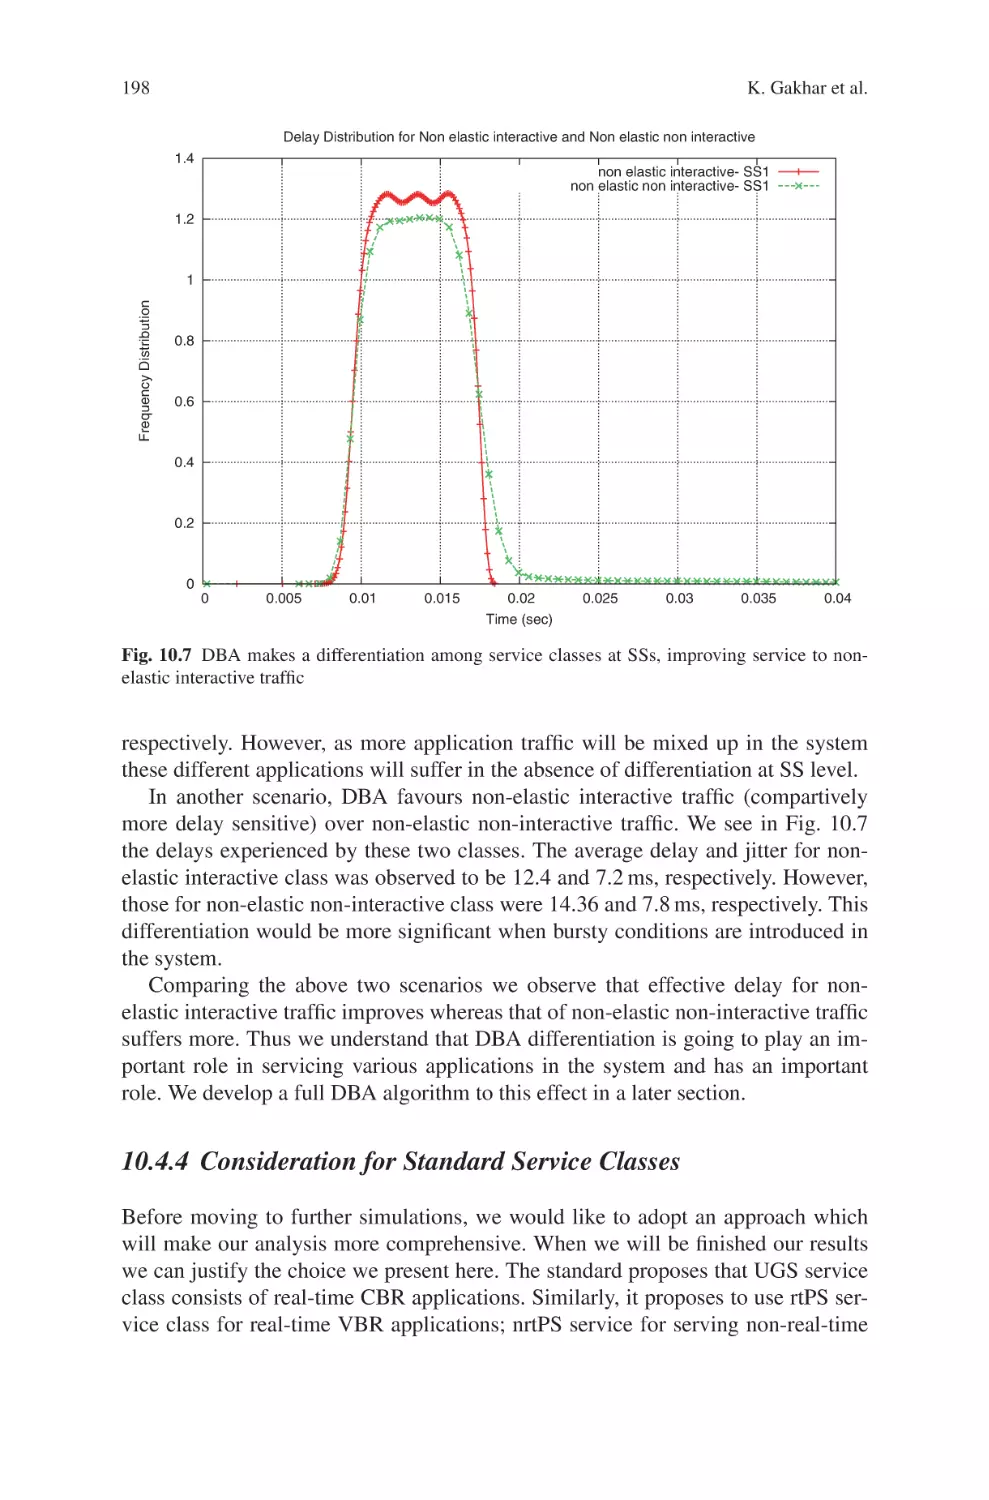
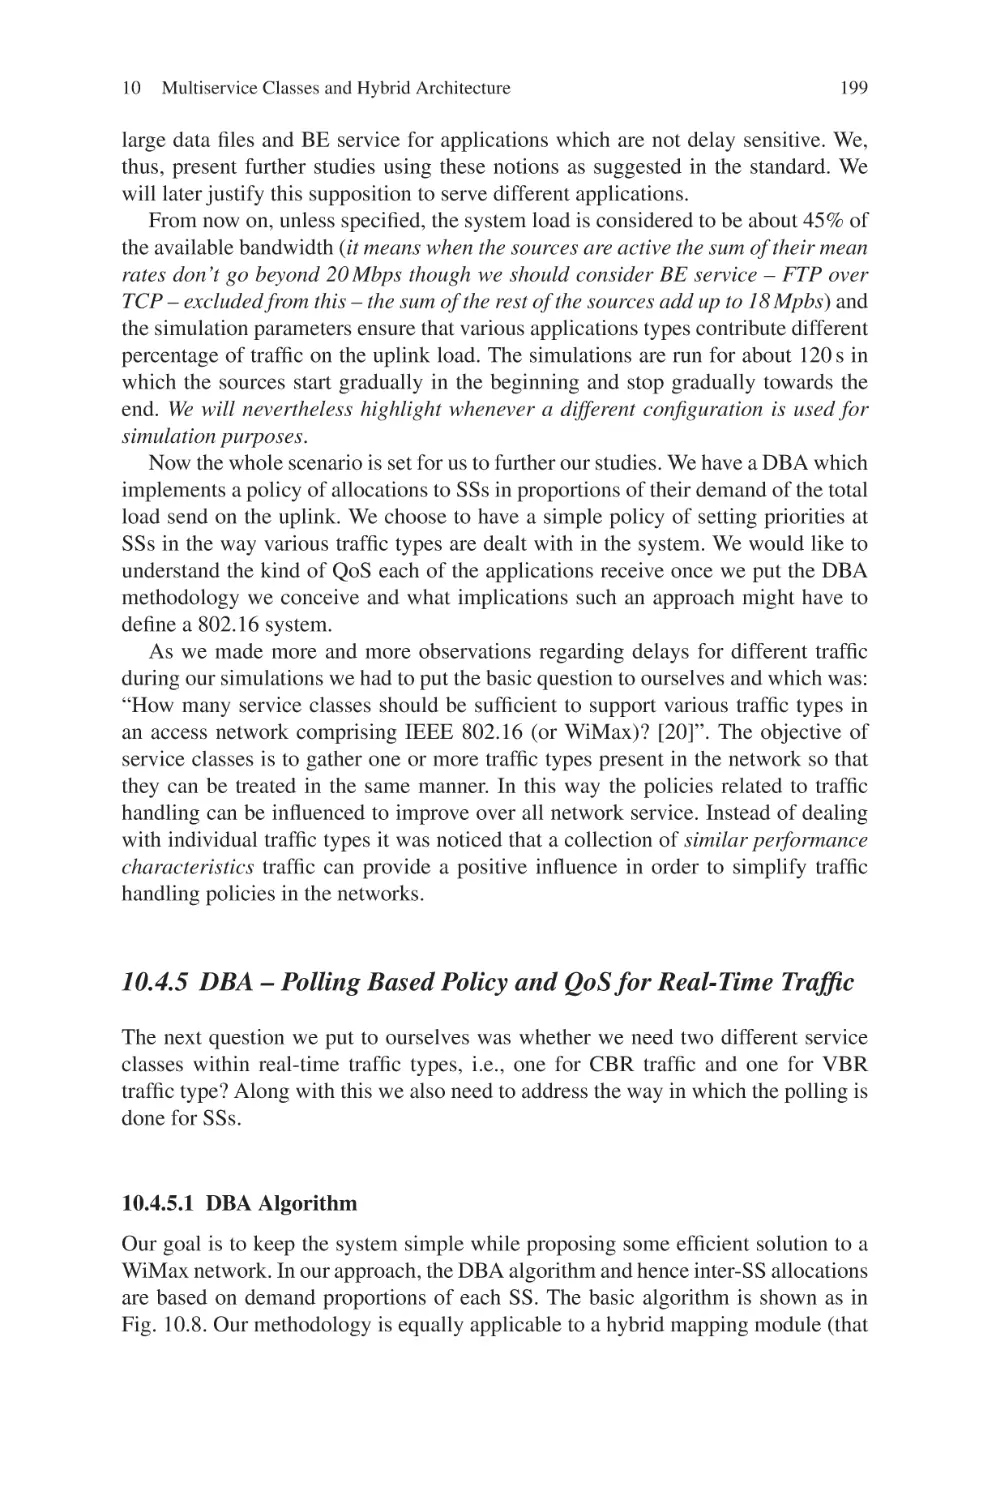
K. Gakhar 68 Rue Gallieni; 92100 Boulogne Billancourt, France,
kamal.gakhar@gmail.com
A. Gravey Department of Computer Science, TELECOM Bretagne, France
F. Kamoun École Nationale des Sciences de l’Informatique, Manouba, Tunisia,
kamoun@planet.tn
M. Kondakov Kodofon, 97, Moskovsky Prospekt, Voronezh, Russia
Y.-C. Lai National Taipei University of Science and Technology, Taipei, Taiwan
K.-D. Lee LD Electronics Mobile Research, San Diego, CA 92131, USA,
kdlee@ieee.org
L. Lenzini Dipartimento di Ingegneria dell’Informazione, University of Pisa, Italy
A. Leroy TELECOM Bretagne, France
V. C. M. Leung LD Electronics Mobile Research, San Diego, CA 92131, USA
H. M. Liew School of Electrical and Electronic Engineering, Nanyang
Technological Unversity, Singapore
Y.-N. Lin National Chiao Tung University, University Road, Hsinchu, Taiwan
Y.-D. Lin National Chiao Tung University, University Road, Hsinchu, Taiwan
M. Liu Intel Innovation Center, Taiwan
J. Lu School of Electrical and Electronic Engineering, Nanyang Technological
University, Singapore
Q. Lu School of Electrical and Electronic Engineering, Nanyang Technological
Unversity, Singapore
M. Ma School of Electrical and Electronic Engineering, Nanyang Technological
Unversity, Singapore
Contributors
xv
D. Marabissi Università degli Studi di Firenze, Italy, dania.marabissi@unifi.it
F. Meucci Università degli Studi di Firenze, Italy, filippo.meucci@unifi.it
E. Mingozzi Dipartimento di Ingegneria dell’Informazione, University of Pisa,
Italy, e.mingozzi@iet.unipi.it
J. Moilanen Nokia Siemens Networks, Helsinki, Finland
S. Moiseev Kodofon, 97, Moskovsky Prospekt, Voronezh, Russia
M. Nicoli Dip. di Elettronica e Informazione, Politecnico di Milano, Piazza L. da
Vinci 32, 20133 Milano, Italy, nicoli@elet.polimi.it
L. Nuaymi TELECOM Bretagne
L. Pierucci Università degli Studi di Firenze, Italy, laura.pierucci@unifi.it
G. Primolevo WISYTech, Via Cadore, 21, 20035 Lissone, Milano Italy
L. S. Ronga CNIT, Firenze, Italy, luca.ronga@cnit.it
L. Sampietro Nokia Siemens Networks S.p.A. Com CRD MW, S.S. 11 Padana
Superiore Km. 158, 20060 Cassina de’ Pecchi (Milano), Italy
C. Santacesaria Nokia Siemens Networks S.p.A. Com CRD MW, S.S. 11 Padana
Superiore Km. 158, 20060 Cassina de’ Pecchi (Milano), Italy
S. Savazzi Dip. di Elettronica e Informazione, Politecnico di Milano, Piazza L. da
Vinci 32, 20133 Milano, Italy
W.-H. Sheen Department of Communication Engineering, National Chiao Tung
University, Hsinchu, Taiwan
J. Shin School of Electrical Engineering and Computer Science, Kyungpook
National University, Daegu, Korea
O. Simeone CCSPR, New Jersey Institute of Technology (NJIT), University Heights
07102, Newark, USA
U. Spagnolini Dip. di Elettronica e Informazione, Politecnico di Milano, Piazza L.
da Vinci 32, 20133 Milano, Italy
xvi
Contributors
R. Tka École Nationale des Sciences de l’Informatique, Manouba, Tunisia,
ramzi@planet.tn
L. Valcarenghi Scuola Superiore Sant’Anna, Pisa, Italy, luca.valcarenghi@sssup.it
A. V. Vasilakos Wireless & Satellite Communications Group, School of Electrical
& Computer Engineering, National Technical University of Athens, Greece
B. K. Yi LG Electronics Mobile Research, San Diego, CA 92131, USA
Chapter 1
Deployment and Design of Multi-Antenna
WiMax Systems in a Non-Stationary
Interference Environment
M. Nicoli, S. Savazzi, O. Simeone, R. Bosisio, G. Primolevo,
L. Sampietro and C. Santacesaria
Abstract WiMax has already been adopted worldwide by operators attracted by
promises of large throughput and coverage for broadband wireless access. However,
towards the goal of an efficient deployment of the technology, a thorough analysis
of its performance in presence of frequency reuse under realistic traffic conditions is
mandatory. In particular, in both fixed and mobile WiMax applications, an important
performance limiting factor is inter-cell interference, which has strong time-varying
and non-stationary features. Two main solutions have been proposed for interference
management at the physical layer of WiMax systems, namely, multi-antenna technology and random subcarrier permutation (as in the latest version of the standard,
IEEE 802.16-2005). In this chapter, system deployment of multi-antenna base stations, and related design of signal processing algorithms for interference mitigation,
are discussed. Extensive numerical results for realistic interference models show the
advantages of the optimized multi-antenna deployment and design in combination
with subcarrier permutation.
1.1 Introduction
WiMax (Worldwide Interoperability for Microwave Access) is a standard-based
technology that provides last mile broadband wireless access. Operators worldwide
have already embraced this solution as either a complement or an alternative to
existing wired and wireless technologies, such as cable, Digital Subscriber Line
(DSL) or second/third generation (2G/3G) cellular systems [1]. Applications range
from the provision of wireless services for rural or developing areas, to intensive
and real-time applications on notebooks and other mobile devices. A first version
of the standard, IEEE 802.16-2004 [2], was designed to provide broadband access
M. Nicoli (B)
Dip. di Elettronica e Informazione, Politecnico di Milano, Piazza L. da Vinci 32,
20133 Milano, Italy
e-mail: nicoli@elet.polimi.it
M. Ma (ed.), Current Technology Developments of WiMax Systems,
C Springer Science+Business Media B.V. 2009
DOI 10.1007/978-1-4020-9300-5 1,
1
2
M. Nicoli et al.
to fixed subscriber stations, while the recently approved IEEE 802.16-2005 [3] supports both fixed and mobile access. Among the various options proposed in the
IEEE 802.16 physical (PHY) layer specifications, the Orthogonal Frequency Division Multiplexing mode with 256 subcarriers in [2] and the Scalable OFDMA mode
in [3] (here referred to as, respectively, 802.16-OFDM-256 and 802.16-SOFDMA)
have sparkled the most interest as access solutions for the deployment of a cellular
Wireless Metropolitan Area Network (WMAN).
While analysis of single WiMax links for fixed applications is by now well studied (see, e.g., the survey in [1]), the impact of a deployment of WiMax (either
fixed or mobile) over a given geographical area is currently under investigation.
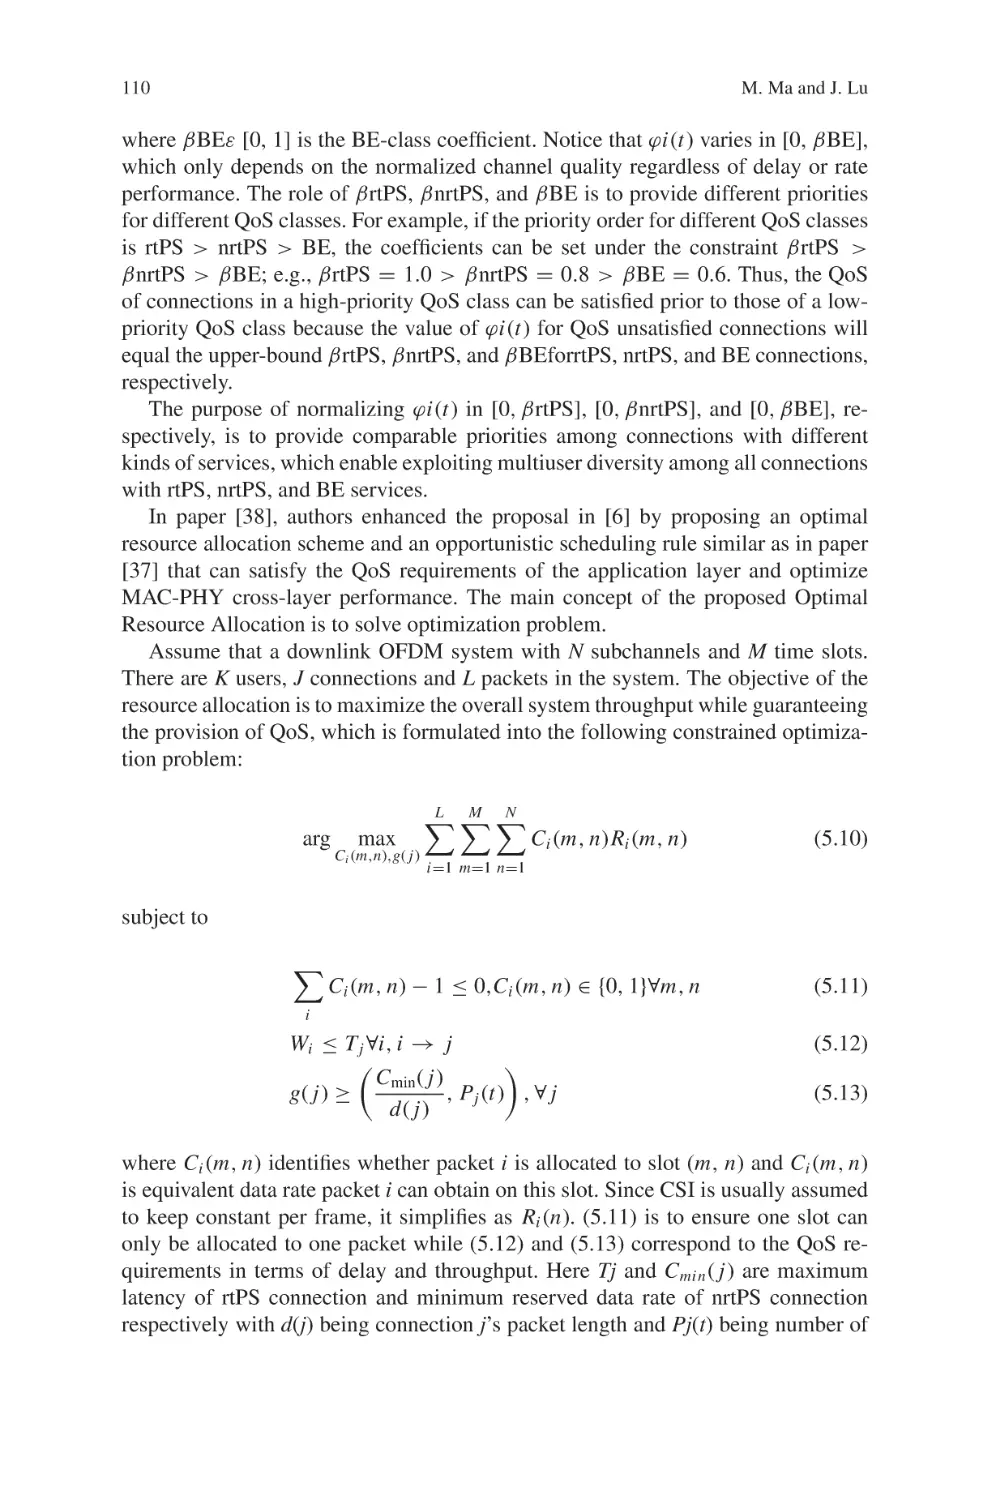
WiMax access points distributed over the coverage area form a cellular structure
with given frequency reuse factor (see Fig. 1.1(a) for square cells with reuse factor
(c)
(a)
Δθ =
33.7
SINR [dB]
4
45
deg
3.5
40
SS1
SS2
BS1
Linear
array
Δ e [λ]
2.5
SS3
BS3
BS0
Δi
35
BS2
SS0
Δe
3
30
2
1.5
25
1
20
1000 m
Δe
0.5
15
(d)
(b)
SINR [dB]
4
50
620 m
3.5
45
Δθ
=4
SS2
Δ e [λ]
deg
SS0
40
6.1
SS1
BS0
3
Δe
2.5
35
2
30
1.5
Δi
25
Δe
1
SS3
Linear
array
20
0.5
No-SD Max-FD
0.5
1
1.5
2
2.5
3
3.5
4
15
Δ i [λ]
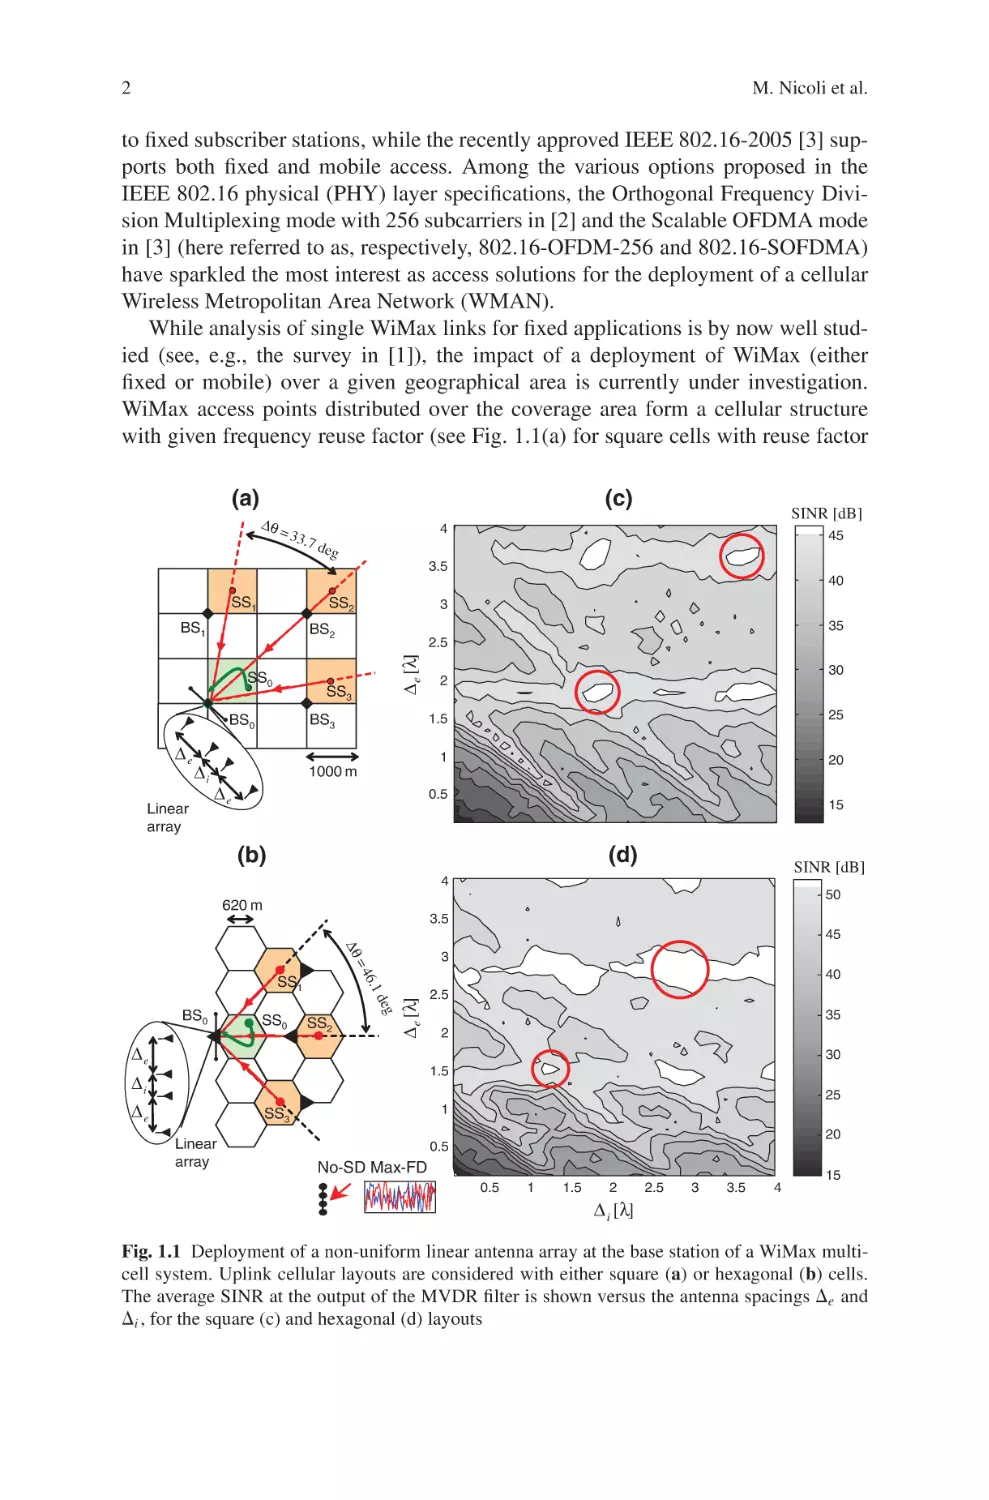
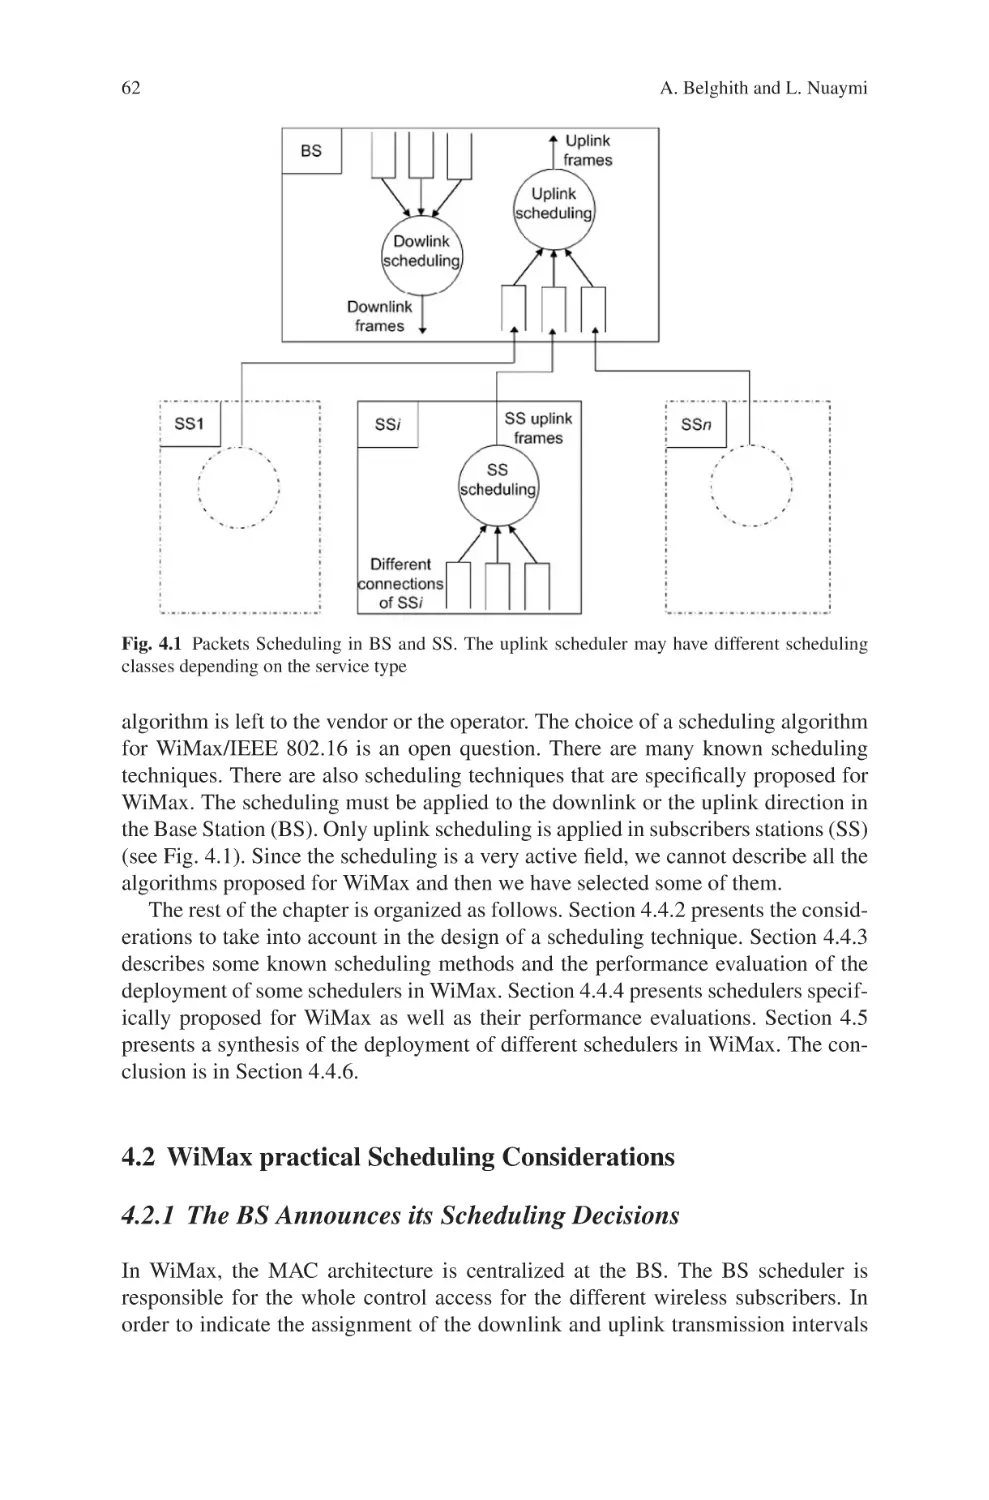
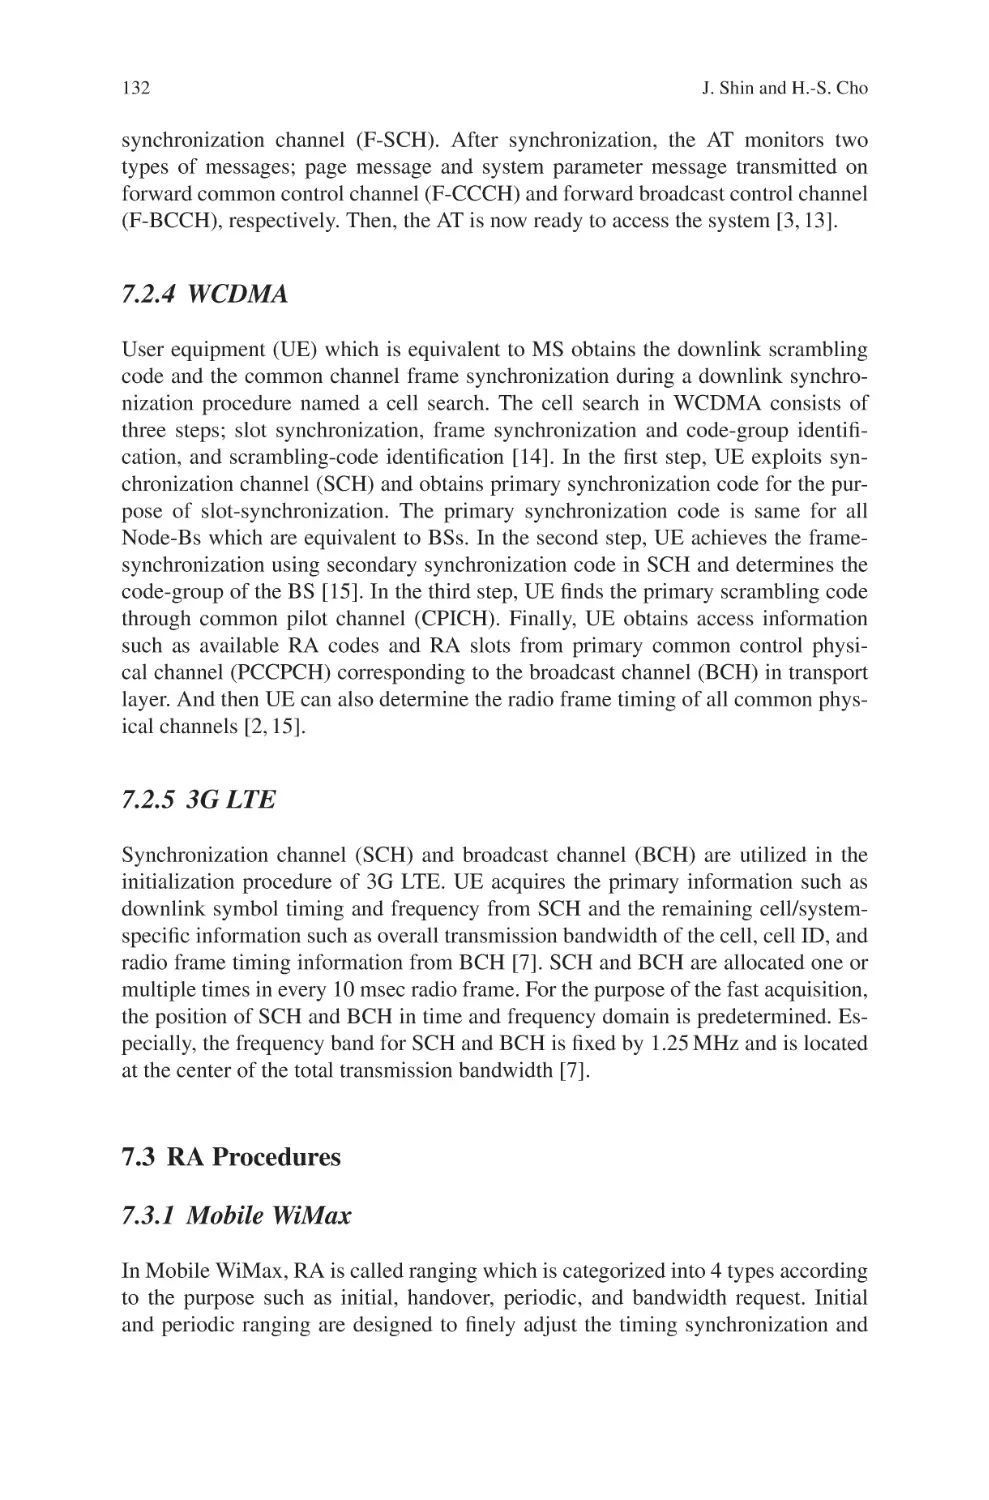
Fig. 1.1 Deployment of a non-uniform linear antenna array at the base station of a WiMax multicell system. Uplink cellular layouts are considered with either square (a) or hexagonal (b) cells.
The average SINR at the output of the MVDR filter is shown versus the antenna spacings ⌬e and
⌬i , for the square (c) and hexagonal (d) layouts
1
Deployment and Design of Multi-Antenna
3
4, and Fig. 1.1(b) for hexagonal cells with reuse factor 3). In such a scenario, the
main technological challenge is the mitigation of inter-cell interference. This issue
is even more relevant in WiMax than in existing 2G/3G cellular systems due to the
larger data rates that WiMax promises to offer, which call for more sophisticated
interference-reduction techniques. The task of designing a WiMax system robust to
inter-cell interference is made even more challenging by the non-stationary nature
of interference in both fixed and mobile applications. In a fixed system, based on
IEEE 802.16-OFDM-256, asynchronous transmission in interfering cells causes the
inter-cell interference to vary within a given communication session. In fact, in a
typical scenario, out-of-cell subscriber stations (SS) are expected to start and end
their transmission on a time scale that cannot be controlled by the interfered cells.
On the other hand, mobile WiMax based on IEEE 802.16-SOFDMA adopts random
subcarrier permutation within a time-frequency grid (as in the Partially Used Subchannelization, PUSC, mode [3, 4]) in order to provide interference diversity. After
the permutation, subcarriers allocated to a given user are subject to the interference
of different out-of-cell subscribers, thus leading to a non-stationary interference
scenario.
This chapter presents an overview of existing solutions to the problem of (nonstationary) interference-mitigation techniques at the PHY layer of a WiMax-compliant system for both IEEE 802.16-OFDM-256 and SOFDMA. As recognized at
academic and industrial levels, a satisfactory interference management hinges on
multi-antenna technology (see, e.g., [5, 6]). Therefore, in this chapter we focus on
deployment and design of WiMax systems in presence of multi-antenna at the base
station (BS). As a case study, we investigate the uplink (UL), i.e. the communication
from SSs to BS, as illustrated in Fig. 1.1(a, b).
We first study optimal deployment of an antenna array at WiMax base stations as
a trade-off between diversity and interference-rejection capability of the antenna array (Section 1.3). The advantages of an optimized array in terms of coverage and average throughput with respect to conventional antenna array deployments are shown
through extensive numerical simulations in Section 1.4. Then, signal processing
techniques at the BS that allow to cope efficiently with non-stationary interference
are addressed. These techniques are based on the exploitation of the pilot subcarriers prescribed by the IEEE 802.16-OFDM-256 standard for adaptive estimation
of channel/interference parameters (Section 5.1). Finally, subcarrier permutation as
defined by the PUSC mode of IEEE 802.16-SOFDMA is considered, in combination
with multi-antenna technology, in order to cope with non-stationary interference.
Performance of such a solution is discussed to validate its suitability (Section 5.2).
1.2 WiMax System
In this section we present a brief overview of the PHY layer specified by the standards IEEE 802.16-OFDM-256 and IEEE 802.16-SOFDMA. We focus on the UL
side of the radio link, where complex receiver algorithms at the BS side can give
4
M. Nicoli et al.
the most relevant gains in cell coverage and link quality. Moreover, we introduce
the basic model of a multi-cell WiMax system, that will be used for performance
assessment.
1.2.1 Overview of IEEE 802.16 PHY Layer
Both the OFDM-256 [2] and the SOFDMA [3] modes of IEEE 802.16 are targeted
to bandwidths in the low 2-11 GHz range (for performance evaluation purposes,
in the remainder of the chapter we will consider 3.5 GHz as the carrier frequency)
and employ OFDM modulation for their basic symbol structure. Apart from these
fundamental similarities, the two PHY layers exhibit profound differences in both
the chosen multiple access scheme and the system parameters, and require a separate
introduction. A summary of the basic system parameters of IEEE 802.16 is given in
Table 1.1.
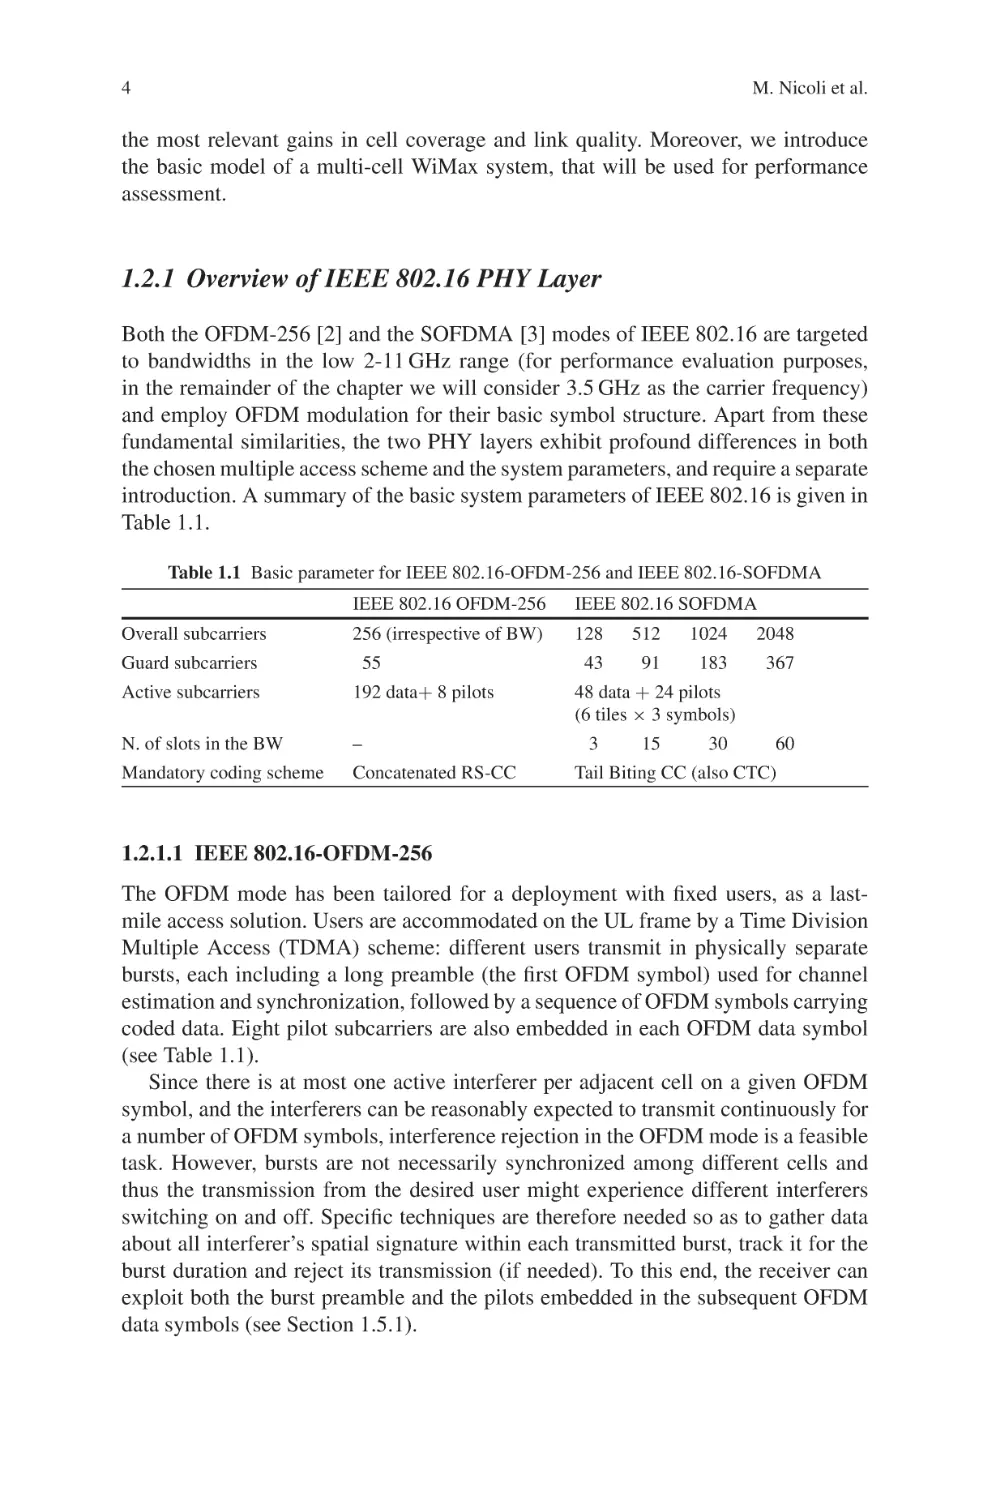
Table 1.1 Basic parameter for IEEE 802.16-OFDM-256 and IEEE 802.16-SOFDMA
Overall subcarriers
Guard subcarriers
IEEE 802.16 OFDM-256
IEEE 802.16 SOFDMA
256 (irrespective of BW)
128
512
1024
2048
43
91
183
367
55
Active subcarriers
192 data+ 8 pilots
N. of slots in the BW
–
Mandatory coding scheme
Concatenated RS-CC
48 data + 24 pilots
(6 tiles × 3 symbols)
3
15
30
60
Tail Biting CC (also CTC)
1.2.1.1 IEEE 802.16-OFDM-256
The OFDM mode has been tailored for a deployment with fixed users, as a lastmile access solution. Users are accommodated on the UL frame by a Time Division
Multiple Access (TDMA) scheme: different users transmit in physically separate
bursts, each including a long preamble (the first OFDM symbol) used for channel
estimation and synchronization, followed by a sequence of OFDM symbols carrying
coded data. Eight pilot subcarriers are also embedded in each OFDM data symbol
(see Table 1.1).
Since there is at most one active interferer per adjacent cell on a given OFDM
symbol, and the interferers can be reasonably expected to transmit continuously for
a number of OFDM symbols, interference rejection in the OFDM mode is a feasible
task. However, bursts are not necessarily synchronized among different cells and
thus the transmission from the desired user might experience different interferers
switching on and off. Specific techniques are therefore needed so as to gather data
about all interferer’s spatial signature within each transmitted burst, track it for the
burst duration and reject its transmission (if needed). To this end, the receiver can
exploit both the burst preamble and the pilots embedded in the subsequent OFDM
data symbols (see Section 1.5.1).
1
Deployment and Design of Multi-Antenna
5
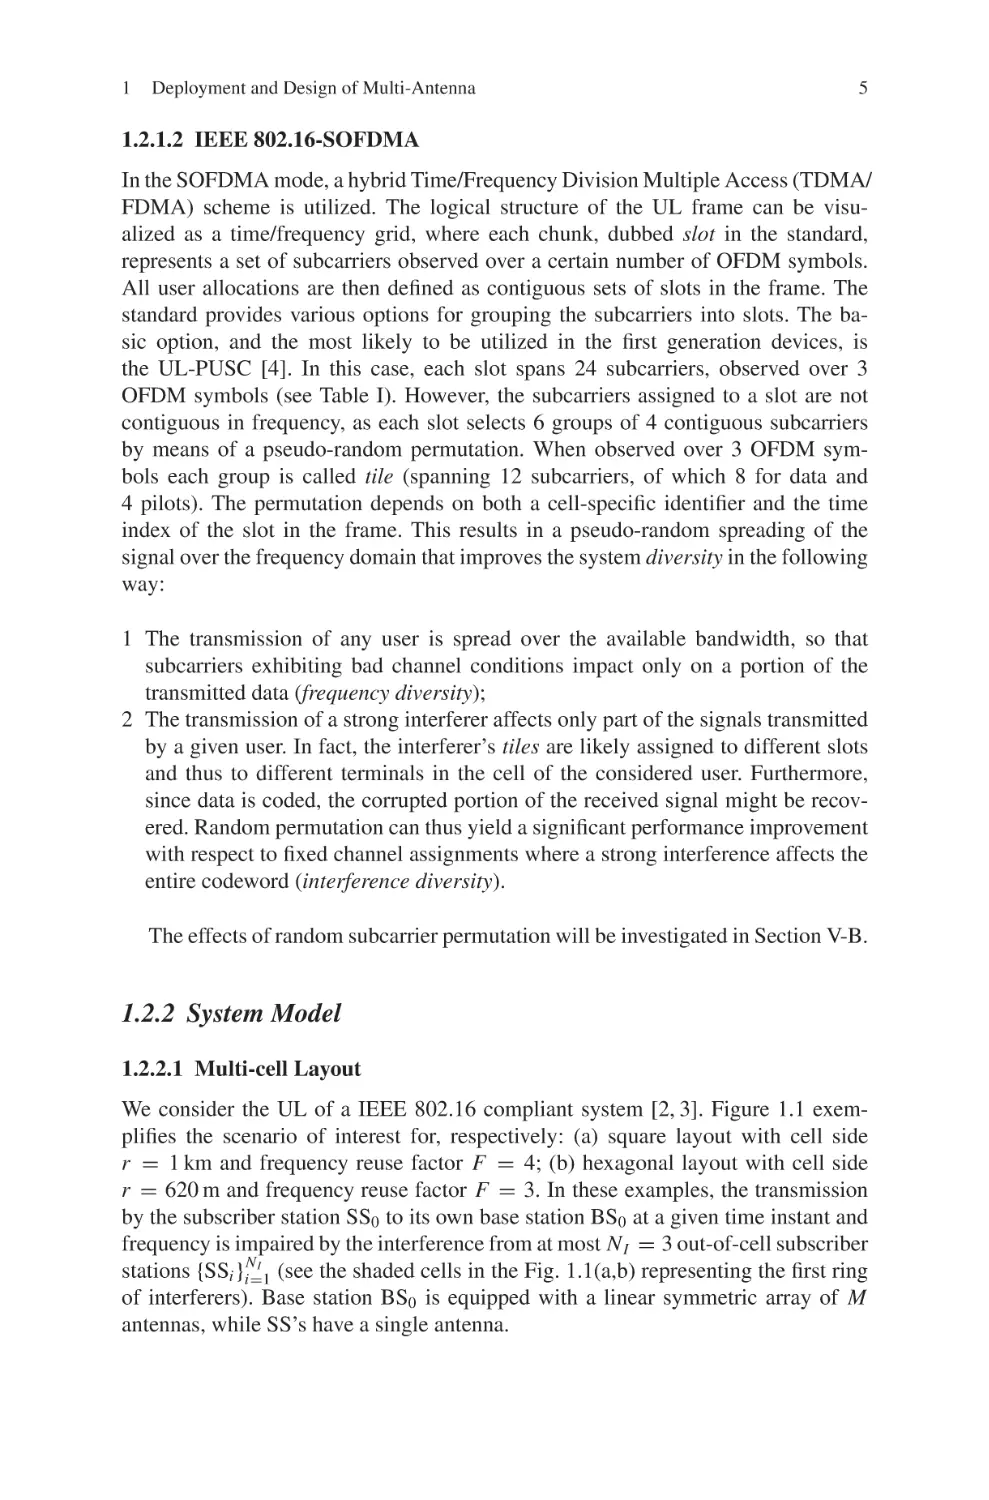
1.2.1.2 IEEE 802.16-SOFDMA
In the SOFDMA mode, a hybrid Time/Frequency Division Multiple Access (TDMA/
FDMA) scheme is utilized. The logical structure of the UL frame can be visualized as a time/frequency grid, where each chunk, dubbed slot in the standard,
represents a set of subcarriers observed over a certain number of OFDM symbols.
All user allocations are then defined as contiguous sets of slots in the frame. The
standard provides various options for grouping the subcarriers into slots. The basic option, and the most likely to be utilized in the first generation devices, is
the UL-PUSC [4]. In this case, each slot spans 24 subcarriers, observed over 3
OFDM symbols (see Table I). However, the subcarriers assigned to a slot are not
contiguous in frequency, as each slot selects 6 groups of 4 contiguous subcarriers
by means of a pseudo-random permutation. When observed over 3 OFDM symbols each group is called tile (spanning 12 subcarriers, of which 8 for data and
4 pilots). The permutation depends on both a cell-specific identifier and the time
index of the slot in the frame. This results in a pseudo-random spreading of the
signal over the frequency domain that improves the system diversity in the following
way:
1 The transmission of any user is spread over the available bandwidth, so that
subcarriers exhibiting bad channel conditions impact only on a portion of the
transmitted data (frequency diversity);
2 The transmission of a strong interferer affects only part of the signals transmitted
by a given user. In fact, the interferer’s tiles are likely assigned to different slots
and thus to different terminals in the cell of the considered user. Furthermore,
since data is coded, the corrupted portion of the received signal might be recovered. Random permutation can thus yield a significant performance improvement
with respect to fixed channel assignments where a strong interference affects the
entire codeword (interference diversity).
The effects of random subcarrier permutation will be investigated in Section V-B.
1.2.2 System Model
1.2.2.1 Multi-cell Layout
We consider the UL of a IEEE 802.16 compliant system [2, 3]. Figure 1.1 exemplifies the scenario of interest for, respectively: (a) square layout with cell side
r = 1 km and frequency reuse factor F = 4; (b) hexagonal layout with cell side
r = 620 m and frequency reuse factor F = 3. In these examples, the transmission
by the subscriber station SS0 to its own base station BS0 at a given time instant and
frequency is impaired by the interference from at most N I = 3 out-of-cell subscriber
NI
(see the shaded cells in the Fig. 1.1(a,b) representing the first ring
stations {SSi }i=1
of interferers). Base station BS0 is equipped with a linear symmetric array of M
antennas, while SS’s have a single antenna.
6
M. Nicoli et al.
1.2.2.2 Modeling the Radio Environment
Let us consider the antenna-array receiver at the base station BS0 . The (base-band)
signal received on the t-th subcarrier on a given OFDM symbol can be written as
yt = ht xt + nt ,
(1.1)
where xt denotes the symbol transmitted by the desired station SS0 , while ht is a
vector gathering the M (complex) channel gains between the transmitter SS0 and the
M antennas of BS0 . These gains account for path-loss, shadowing and fast-fading
effects due to the propagation from SS0 to BS0 [7]. Notice that long-term fading
effects due to shadowing can be, to a certain extent, mitigated through power control. Generally, the propagation channel ht is the superposition of the contributions
of several paths, each characterized by a complex amplitude, a time of arrival and a
direction of arrival (DOA). In our performance analysis, the multipath components
are modelled according to the Stanford University Interim (SUI) channel models [8],
and DOAs are considered as Gaussian distributed around the main direction SS0 BS0 , with a moderate angular spread. The baseline case of signal coming from a
single direction that might be different from the line-of-sight (LOS) one (i.e., with
null angular spread) will also be considered and referred to as a no-spatial-diversity
(No-SD) channel. It is perfectly understood that this particular case has limited applicability either in the fixed and in the mobile wireless environment, although it
might model, in some cases, propagation scenarios where the BS0 and the SS0 are
marginally surrounded by scattering. As further performance references, we consider two simplified fading models that deviate from the SUI one and can be seen as
extreme cases of frequency selectivity:
r
r
No frequency diversity (No-FD): the channel gains are constant over the subcarriers (as for a null delay spread or, equivalently, a frequency-flat channel);
Maximum frequency diversity (Max-FD): the channel gains are uncorrelated
over the subcarriers (as for the ideal case of a maximum delay spread).
The focus of this chapter is on the effect of the noise vector nt , that is given by
the sum of the background noise and inter-cell interference. The latter is generated
by the set It of users, {SSi }i∈It , that are active in the nearby cells on the same
subcarrier and the same OFDM symbol as the desired transmission. Propagation
from interferers to BS0 is modelled similarly to the user SS0 . The main difference is
that shadowing effects on the interfering channels cannot be compensated by power
control and lead to fluctuations of the interference level up to 20-30dB.
1.2.2.3 Characterization of the Inter-cell Interference
According to the discussion above, inter-cell interference is characterized at the
base station BS0 by the multipath channels corresponding to the propagation from
the users {SSi }i∈It to BS0 . This information is summarized by the spatial covariance
of the interference-plus-noise signal nt , defined as Qt = E[nt nH
t ], that collects the
1
Deployment and Design of Multi-Antenna
7
noise correlation between any pair of antennas [6]. This quantity is fundamental
when treating the interference as Gaussian; it depends not only on the propagation
environment but also on the inter-element spacing used at the antenna array (see
Section 1.3). Accurate estimation and tracking algorithms for the covariance matrix Qt are necessary tools in order to design interference mitigation algorithms at
the BS. As explained above, while this task is feasible in IEEE 802.16-OFDM-256
systems (see Section 1.5.1), this is highly impractical in the UL-PUSC mode of the
SOFDMA standard (see Section 1.5.2).
1.3 Antenna Array Design
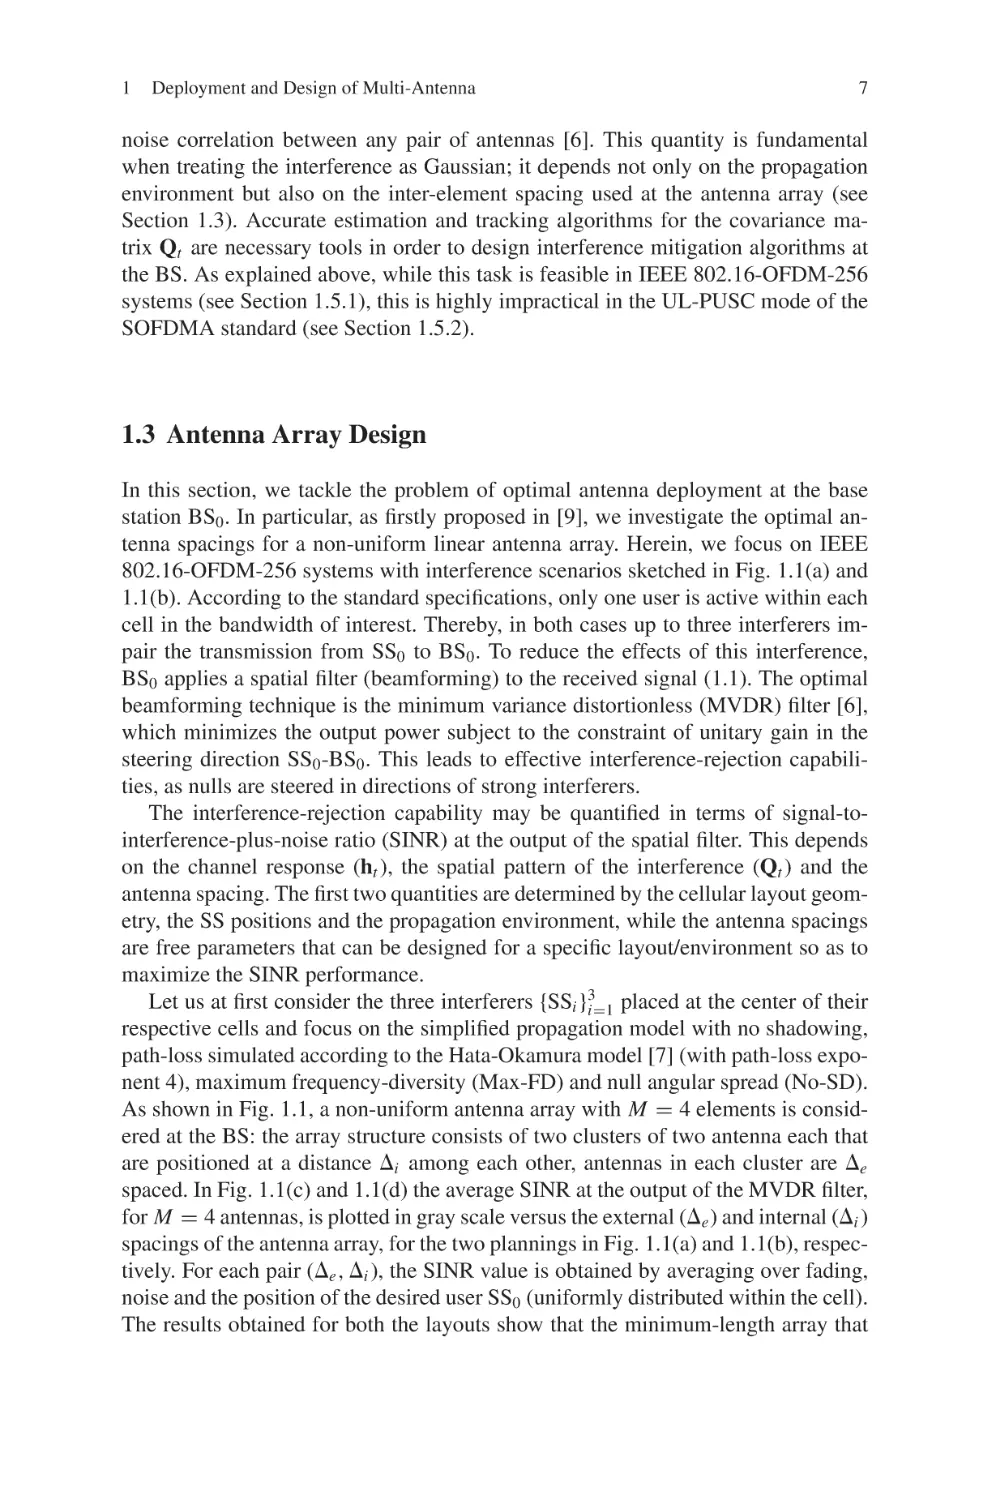
In this section, we tackle the problem of optimal antenna deployment at the base
station BS0 . In particular, as firstly proposed in [9], we investigate the optimal antenna spacings for a non-uniform linear antenna array. Herein, we focus on IEEE
802.16-OFDM-256 systems with interference scenarios sketched in Fig. 1.1(a) and
1.1(b). According to the standard specifications, only one user is active within each
cell in the bandwidth of interest. Thereby, in both cases up to three interferers impair the transmission from SS0 to BS0 . To reduce the effects of this interference,
BS0 applies a spatial filter (beamforming) to the received signal (1.1). The optimal
beamforming technique is the minimum variance distortionless (MVDR) filter [6],
which minimizes the output power subject to the constraint of unitary gain in the
steering direction SS0 -BS0 . This leads to effective interference-rejection capabilities, as nulls are steered in directions of strong interferers.
The interference-rejection capability may be quantified in terms of signal-tointerference-plus-noise ratio (SINR) at the output of the spatial filter. This depends
on the channel response (ht ), the spatial pattern of the interference (Qt ) and the
antenna spacing. The first two quantities are determined by the cellular layout geometry, the SS positions and the propagation environment, while the antenna spacings
are free parameters that can be designed for a specific layout/environment so as to
maximize the SINR performance.
3
placed at the center of their
Let us at first consider the three interferers {SSi }i=1
respective cells and focus on the simplified propagation model with no shadowing,
path-loss simulated according to the Hata-Okamura model [7] (with path-loss exponent 4), maximum frequency-diversity (Max-FD) and null angular spread (No-SD).
As shown in Fig. 1.1, a non-uniform antenna array with M = 4 elements is considered at the BS: the array structure consists of two clusters of two antenna each that
are positioned at a distance ⌬i among each other, antennas in each cluster are ⌬e
spaced. In Fig. 1.1(c) and 1.1(d) the average SINR at the output of the MVDR filter,
for M = 4 antennas, is plotted in gray scale versus the external (⌬e ) and internal (⌬i )
spacings of the antenna array, for the two plannings in Fig. 1.1(a) and 1.1(b), respectively. For each pair (⌬e , ⌬i ), the SINR value is obtained by averaging over fading,
noise and the position of the desired user SS0 (uniformly distributed within the cell).
The results obtained for both the layouts show that the minimum-length array that
8
M. Nicoli et al.
maximizes the average SINR is a uniform linear array (ULA) with ⌬i = ⌬e = ⌬opt ,
being ⌬opt = 1.8λ the optimal spacing for the layout (a) and ⌬opt = 1.4λ for the
layout (b) (λ denotes the carrier wavelength). This confirms the analytical results
of [10], where the optimal spacing is found to be ⌬opt = nλ/ sin(⌬θ ) where n is
a non-zero integer and ⌬θ the angular separation between interferers (n = 1 for
minimum-length array).
We recall that the inter-element spacing normally used for beamforming purposes
is the one that maximizes the DOA resolution under the non-alias constraint, i.e.,
⌬m = λ/[2 sin(θmax )] where θmax is the largest DOA admissible for the considered cellular layout. In particular, this equals the usual spacing ⌬m = λ/2 when
the antenna array covers the whole sector of 180deg (θmax = π/2), while for the
plannings in Fig. 1.1 it is: θmax = π/4 and ⌬m = 0.71λ for the square layout;
(b) θmax = π/3 and ⌬m = 0.58λ for the hexagonal layout. With respect to this
standard antenna deployment with spacing ⌬m , the optimal antenna array is wider
(⌬opt > ⌬m ) and provides a larger SINR at the output. From Fig. 1.1(c,d), the
SINR gain with respect to the first solution is around 5dB. Such a gain can be
justified by noticing that the optimal spacing introduces a certain degree of angular
equivocation in the directivity function of the array, so that the three interferers with
DOAs [θ1 , θ2 , θ3 ] = [−⌬θ, 0, +⌬θ ] are grouped together along the unique direction
θ = 0. The spatial wave numbers associated to the DOAs of the interferers SS1 and
⌬
SS3 are indeed ω1 = ω3 = ±2π λopt sin(⌬θ ) = ± 2πn and coincide with that of
the broadside interferer SS2 (ω2 = 0). This effect renders interference mitigation
more effective, as one null of the directivity function on the broadside is enough to
virtually reject three interferers, thus leaving other degrees of freedom to increase
the spatial diversity.
When the position of the interferers is not known a-priori at the time of the
antenna deployment, or it varies due to terminal mobility as prescribed in IEEE
802.16-SOFDMA [3], these concepts have to be adapted to randomness of SS’s positions. In such scenarios, the SINR has to be averaged over the expected positions
of both user and interferers within their cells before being optimized. Interestingly,
simulation results show that the optimal spacing remains essentially the same as in
the static scenario considered above (for n = 1), due to the symmetry of the problem
at hand. The performance gain with respect to standard antenna deployment reduces
to 2dB (the reader may refer to [11] for a numerical validation).
1.4 Coverage Analysis
In this section we compare the average cell throughput provided by the optimized
ULA with inter-element spacing ⌬opt and MVDR processing, as derived in the previous section, with that obtained by a conventional ULA with spacing ⌬m . The
performance gain of the optimized array is evaluated for an IEEE 802.16-OFDM256 system with bandwidth 4MHz. As prescribed in [2], seven possible transmis7
, can be used, with throughput ranging from 1.2 Mbit/s (T1 ) to
sion modes, {Ti }i=1
1
Deployment and Design of Multi-Antenna
9
11.9 Mbits/s (T7 ) for the selected bandwidth. According to the adaptive modulation
and coding approach, the transmission mode is selected based on specific channel
measurements so as to guarantee a fixed bit error rate.
The average throughput for each position of the user SS0 in the cell is obtained
for fixed interferers placed at the center of their respective cells (as indicated in
Fig. 1.1(a,b)), as follows. For each position of SS0 , the average BER (averaged with
respect to the channel, the noise and the interference) at the output of the decoder
7
. The best transmission mode is then
is evaluated for all transmission modes {Ti }i=1
selected as the one that satisfies the constraint BER≤ 10−6 (e.g., to model applications that have stringent reliability requirements) and provides the largest bit-rate.
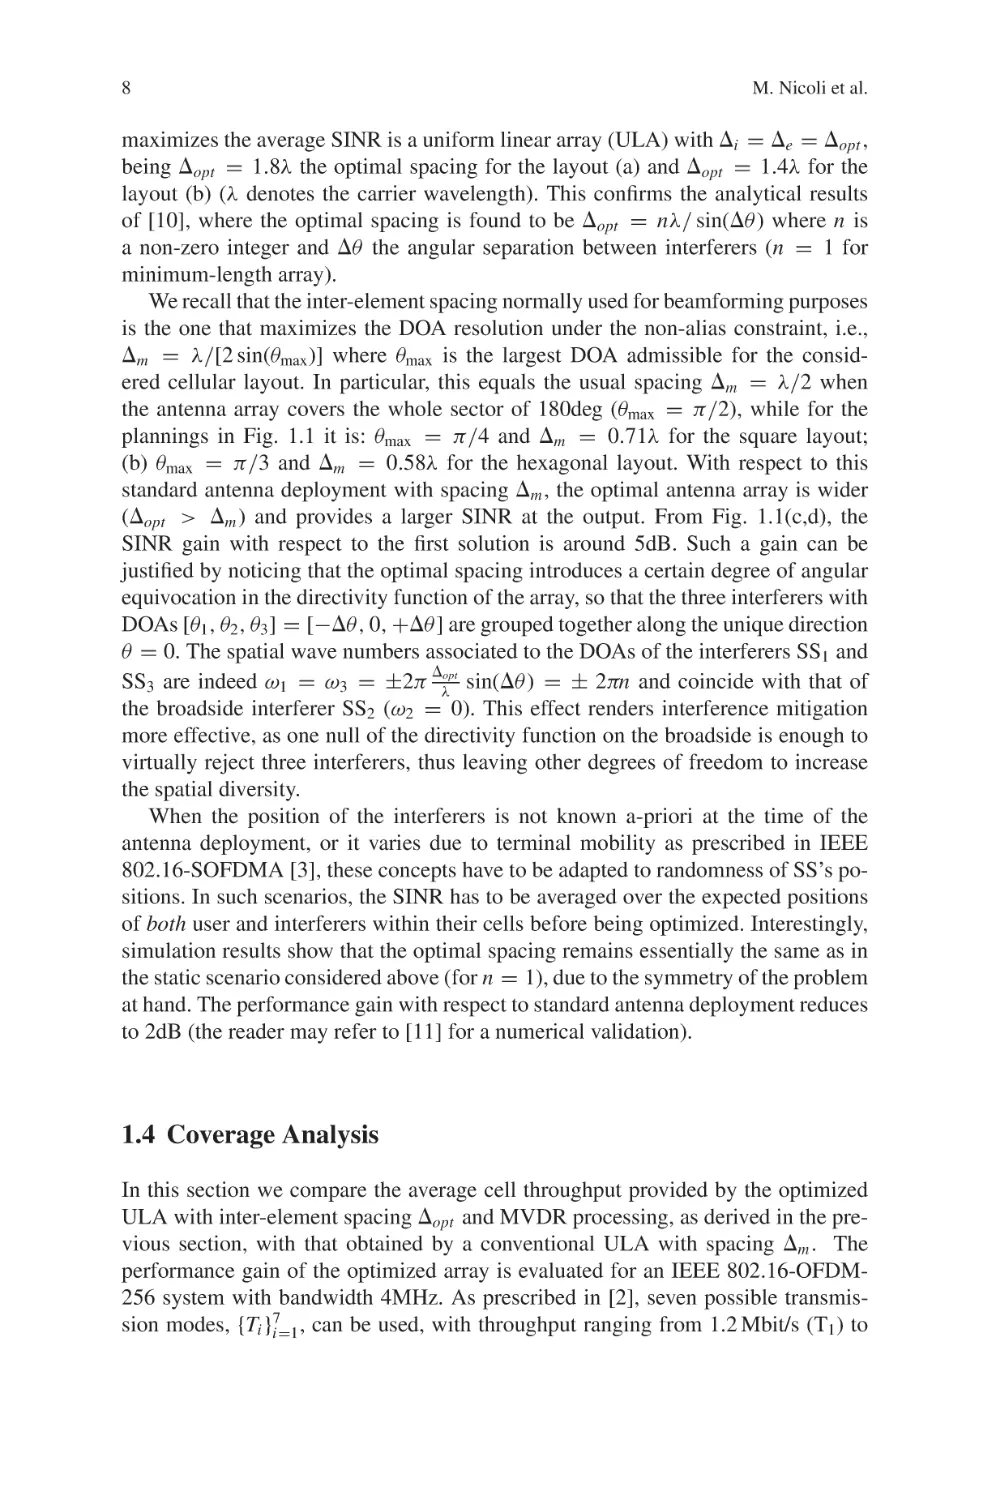
This allows to obtain a coverage map, detailed for all transmission modes, as those
exemplified for the square layout in Fig. 1.2 and for the hexagonal layout in Fig. 1.3,
for the channel model Max-FD with null angular spread (No-SD). In these examples
the number of receiving antennas M ranges from 1 (left figures) to 4 (right figures),
while the inter-element spacing is the conventional one (⌬m ) used for beamforming
(top) or the optimized one (⌬opt ) for throughput maximization (bottom).
Once the coverage maps have been obtained, the average throughput R̄b [bit/s]
for the overall cell can be evaluated through a weighted average of the throughputs associated to the different transmission modes, using as weighting factors the
(normalized) areas where the modes are supported. The results are summarized in
Fig. 1.4 for the square layout and in Fig. 1.5 for the hexagonal layout. The number of
antennas ranges between M = 1 and 4, both the case of omnidirectional (on the top)
and directional antennas (on the bottom) at the BS are considered; performances
are evaluated for the two antenna spacings ⌬opt and ⌬m . Each column refers to a
different channel model: no frequency diversity and null angular spread (No-FD
No-SD, column (1); SUI-3 with null angular spread (SUI-3 No-SD, column (2);
M=2
M=3
M=4
No-SD Max-FD
Δ = Δ m = 0.7λ
M=1
5.94 Mbps
4.61 Mbps
6.80 Mbps
7.64 Mbps
T6
T5
T4
λ
Δ = Δ opt = 1.8
T7
Δθ
SS1
T3
SS 2
4.61 Mbps
SS 3
T2
6.70 Mbps
8.05 Mbps
8.90 Mbps T1
7
Fig. 1.2 Coverage for all transmission modes {Ti }i=1
represented in gray-scale for the square
planning shown on the right. The arrows indicate the directions of arrival of the interferers. The
BS antenna array has a number of elements ranging from M = 1 (left) to M = 4 (right), and
inter-element spacing optimized for beamforming ⌬m (top) or for coverage ⌬opt (bottom)
10
M. Nicoli et al.
M=2
M=3
No-SD Max-FD
M=4
Δ = Δ m = 0.6λ
M=1
4.47 Mbps
5.56 Mbps
7.55 Mbps
6.70 Mbps
T7
Δ = Δ opt = 1.4 λ
T6
SS
SS
T5
Δθ
T4
SS
4.47 Mbps
T3
6.60 Mbps
T2
9.06 Mbps
8.00 Mbps
T1
7
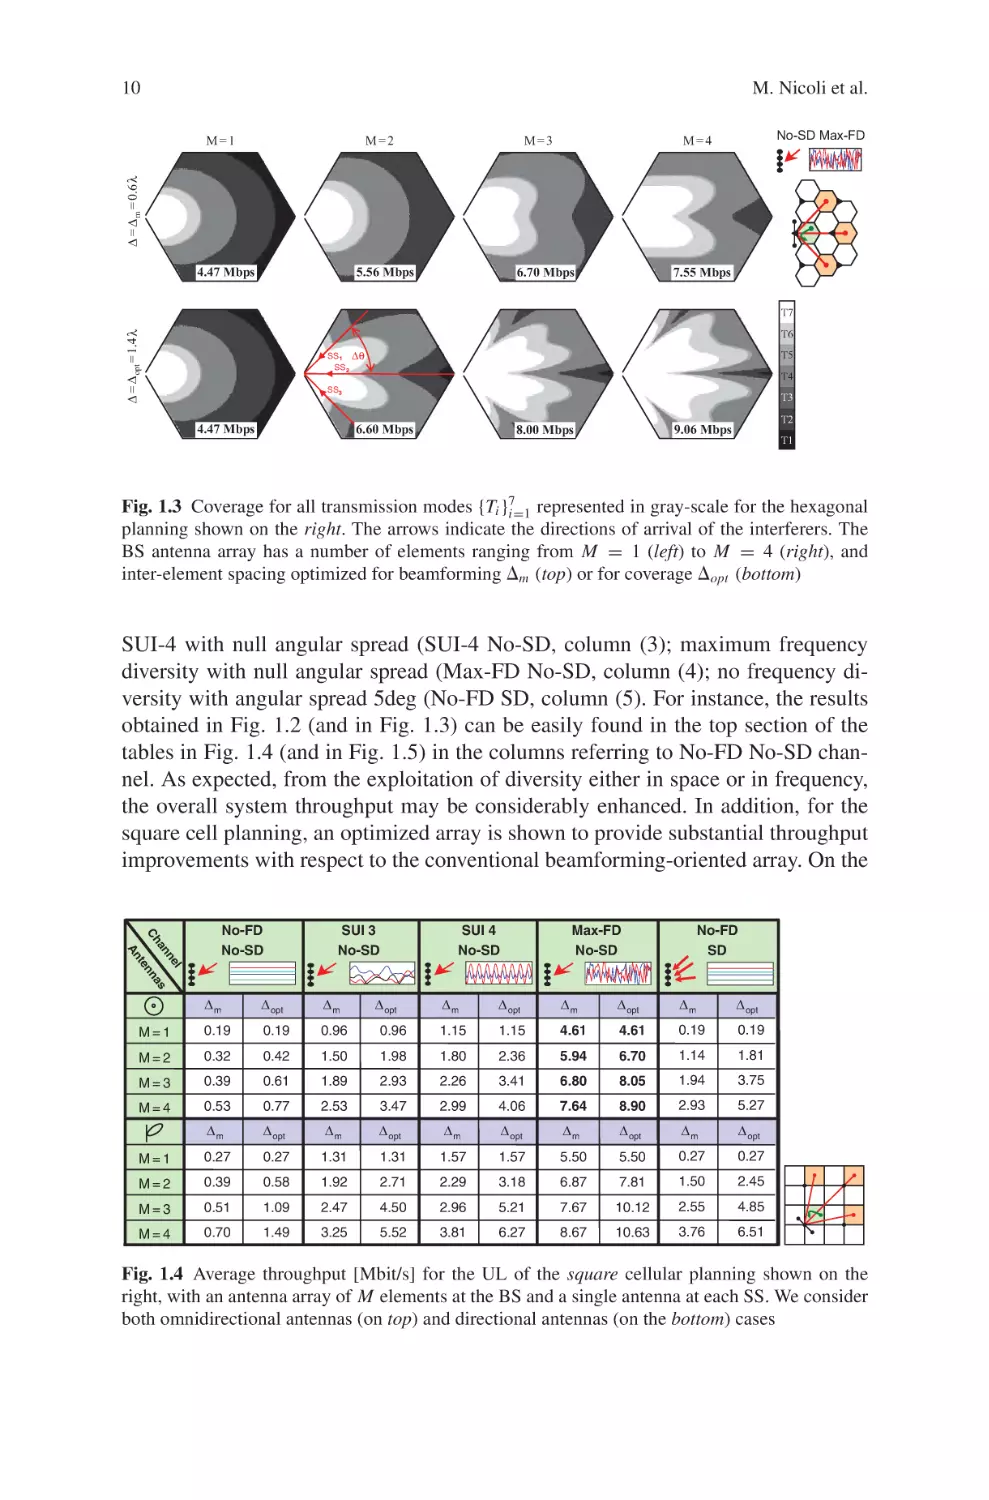
Fig. 1.3 Coverage for all transmission modes {Ti }i=1
represented in gray-scale for the hexagonal
planning shown on the right. The arrows indicate the directions of arrival of the interferers. The
BS antenna array has a number of elements ranging from M = 1 (left) to M = 4 (right), and
inter-element spacing optimized for beamforming ⌬m (top) or for coverage ⌬opt (bottom)
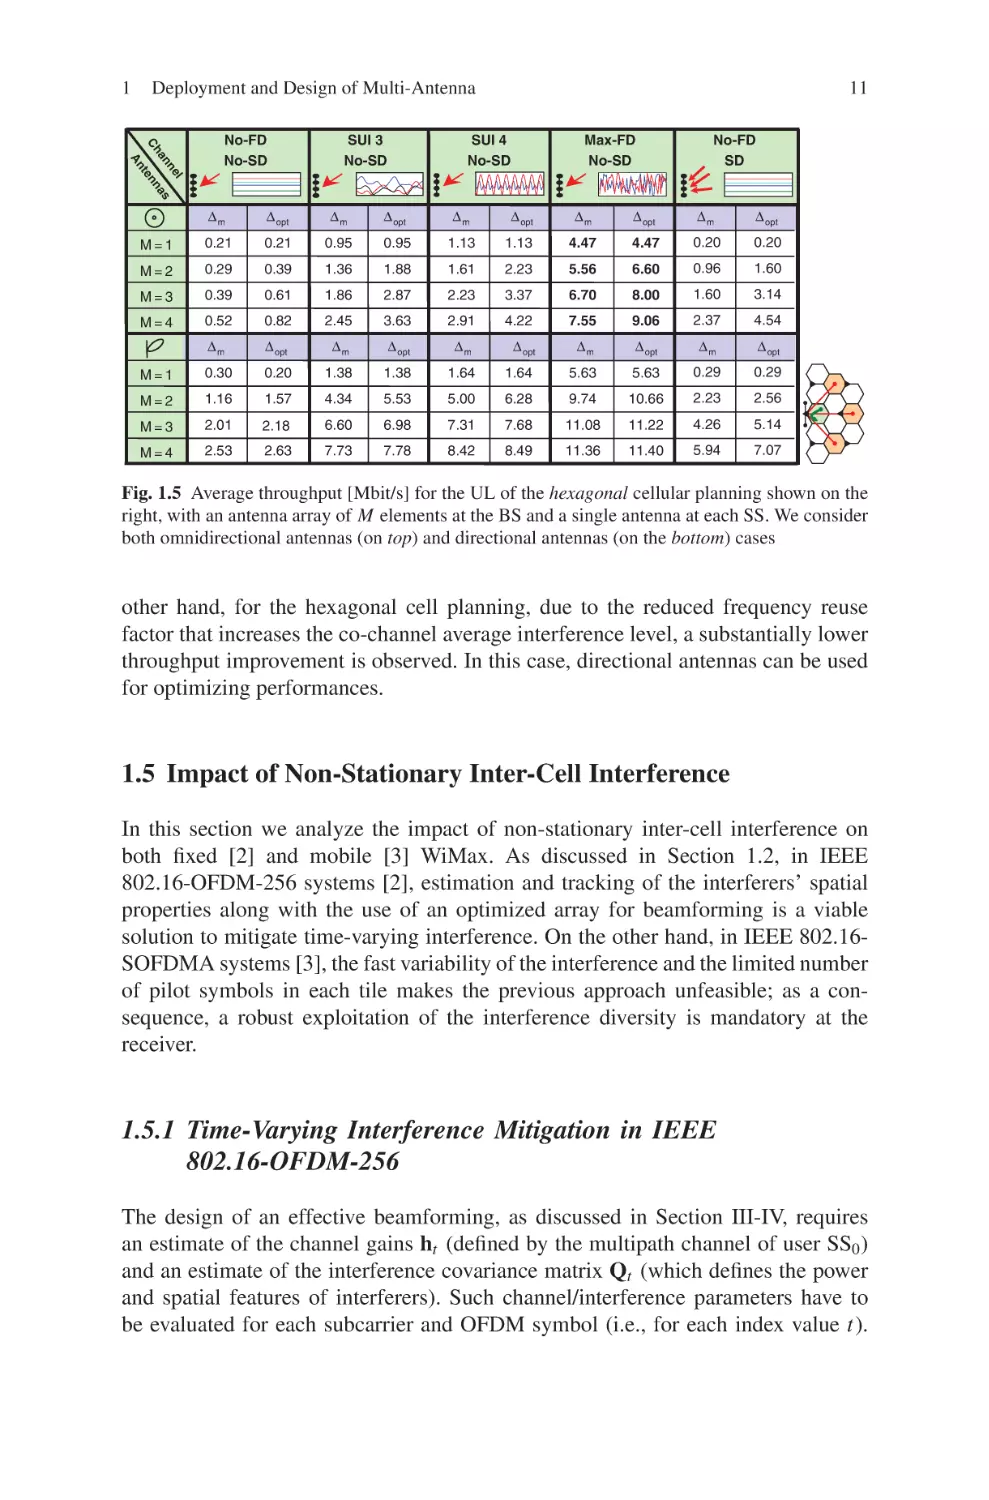
SUI-4 with null angular spread (SUI-4 No-SD, column (3); maximum frequency
diversity with null angular spread (Max-FD No-SD, column (4); no frequency diversity with angular spread 5deg (No-FD SD, column (5). For instance, the results
obtained in Fig. 1.2 (and in Fig. 1.3) can be easily found in the top section of the
tables in Fig. 1.4 (and in Fig. 1.5) in the columns referring to No-FD No-SD channel. As expected, from the exploitation of diversity either in space or in frequency,
the overall system throughput may be considerably enhanced. In addition, for the
square cell planning, an optimized array is shown to provide substantial throughput
improvements with respect to the conventional beamforming-oriented array. On the
l
ne
an
as
Ch
nn
te
An
No-FD
No-SD
SUI 3
No-SD
SUI 4
No-SD
Δ opt
Max-FD
No-SD
No-FD
SD
Δm
Δ opt
Δm
Δm
Δ opt
Δm
Δ opt
Δm
Δ opt
M=1
0.19
0.19
0.96
0.96
1.15
1.15
4.61
4.61
0.19
0.19
M=2
0.32
0.42
1.50
1.98
1.80
2.36
5.94
6.70
1.14
1.81
M=3
0.39
0.61
1.89
2.93
2.26
3.41
6.80
8.05
1.94
3.75
M=4
0.53
0.77
2.53
3.47
2.99
4.06
7.64
8.90
2.93
5.27
Δm
Δ opt
Δm
Δ opt
Δm
Δ opt
Δm
Δ opt
Δm
Δ opt
M=1
0.27
0.27
1.31
1.31
1.57
1.57
5.50
5.50
0.27
0.27
M=2
0.39
0.58
1.92
2.71
2.29
3.18
6.87
7.81
1.50
2.45
M=3
0.51
1.09
2.47
4.50
2.96
5.21
7.67
10.12
2.55
4.85
M=4
0.70
1.49
3.25
5.52
3.81
6.27
8.67
10.63
3.76
6.51
Fig. 1.4 Average throughput [Mbit/s] for the UL of the square cellular planning shown on the
right, with an antenna array of M elements at the BS and a single antenna at each SS. We consider
both omnidirectional antennas (on top) and directional antennas (on the bottom) cases
1
Deployment and Design of Multi-Antenna
Ch
l
ne
an
as
nn
te
An
No-FD
No-SD
SUI 3
No-SD
11
SUI 4
No-SD
Max-FD
No-SD
No-FD
SD
Δm
Δ opt
Δm
Δ opt
Δm
Δ opt
Δm
Δ opt
Δm
Δ opt
M=1
0.21
0.21
0.95
0.95
1.13
1.13
4.47
4.47
0.20
0.20
M=2
0.29
0.39
1.36
1.88
1.61
2.23
5.56
6.60
0.96
1.60
M=3
0.39
0.61
1.86
2.87
2.23
3.37
6.70
8.00
1.60
3.14
M=4
0.52
0.82
2.45
3.63
2.91
4.22
7.55
9.06
2.37
4.54
Δm
Δ opt
Δm
Δ opt
Δm
Δ opt
Δm
Δ opt
Δm
Δ opt
M=1
0.30
0.20
1.38
1.38
1.64
1.64
5.63
5.63
0.29
0.29
M=2
1.16
1.57
4.34
5.53
5.00
6.28
9.74
10.66
2.23
2.56
M=3
2.01
2.18
6.60
6.98
7.31
7.68
11.08
11.22
4.26
5.14
M=4
2.53
2.63
7.73
7.78
8.42
8.49
11.36
11.40
5.94
7.07
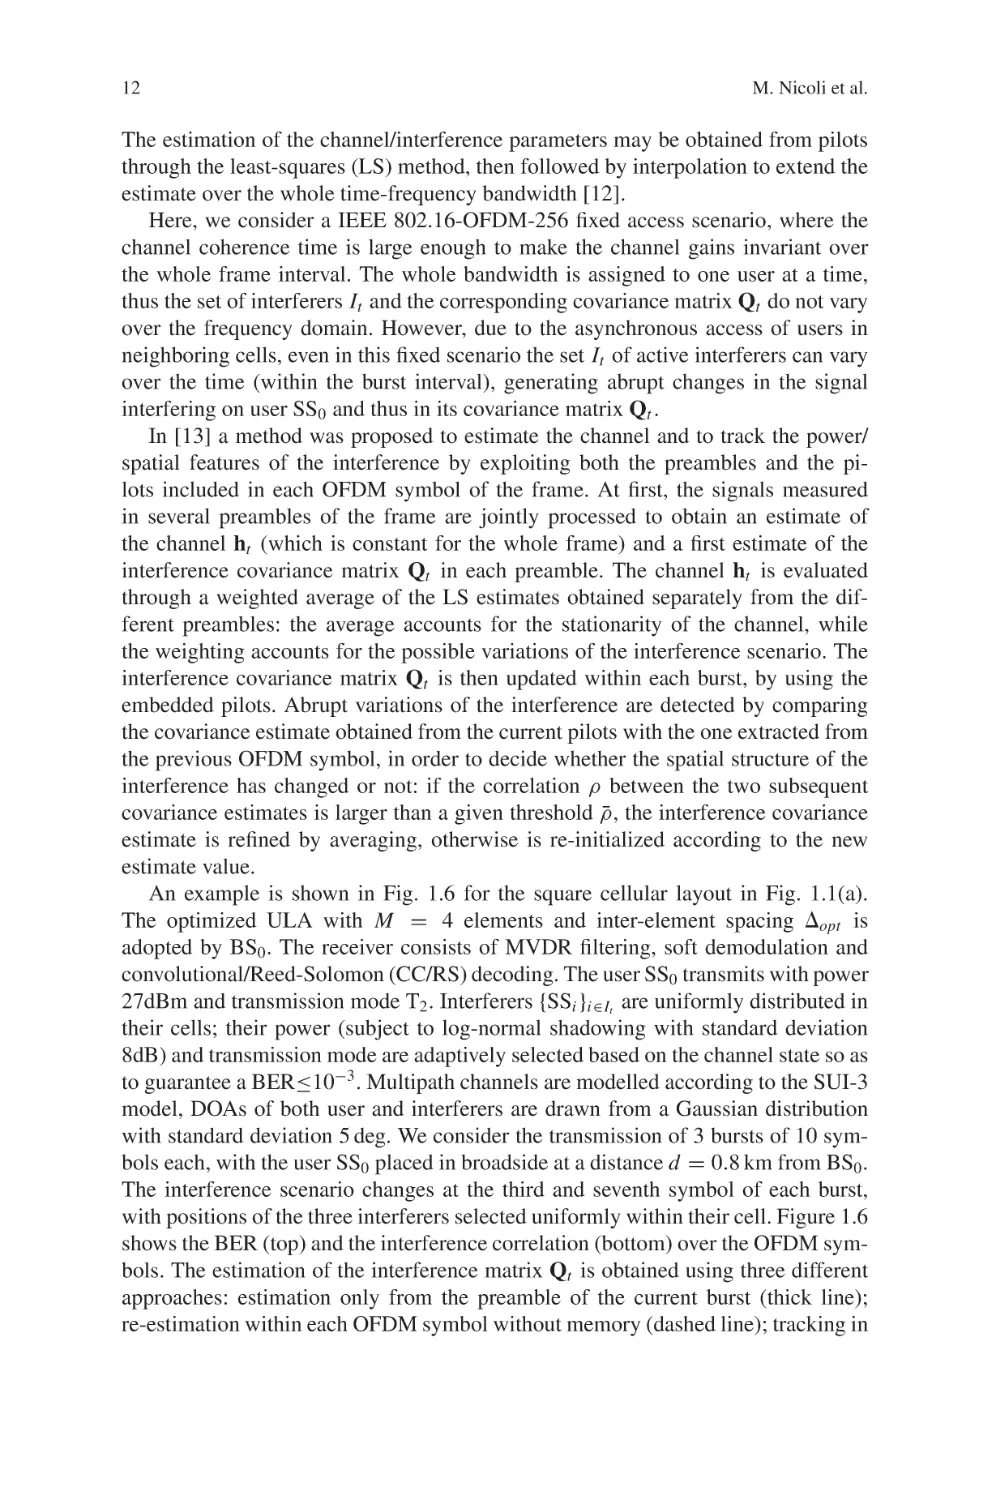
Fig. 1.5 Average throughput [Mbit/s] for the UL of the hexagonal cellular planning shown on the
right, with an antenna array of M elements at the BS and a single antenna at each SS. We consider
both omnidirectional antennas (on top) and directional antennas (on the bottom) cases
other hand, for the hexagonal cell planning, due to the reduced frequency reuse
factor that increases the co-channel average interference level, a substantially lower
throughput improvement is observed. In this case, directional antennas can be used
for optimizing performances.
1.5 Impact of Non-Stationary Inter-Cell Interference
In this section we analyze the impact of non-stationary inter-cell interference on
both fixed [2] and mobile [3] WiMax. As discussed in Section 1.2, in IEEE
802.16-OFDM-256 systems [2], estimation and tracking of the interferers’ spatial
properties along with the use of an optimized array for beamforming is a viable
solution to mitigate time-varying interference. On the other hand, in IEEE 802.16SOFDMA systems [3], the fast variability of the interference and the limited number
of pilot symbols in each tile makes the previous approach unfeasible; as a consequence, a robust exploitation of the interference diversity is mandatory at the
receiver.
1.5.1 Time-Varying Interference Mitigation in IEEE
802.16-OFDM-256
The design of an effective beamforming, as discussed in Section III-IV, requires
an estimate of the channel gains ht (defined by the multipath channel of user SS0 )
and an estimate of the interference covariance matrix Qt (which defines the power
and spatial features of interferers). Such channel/interference parameters have to
be evaluated for each subcarrier and OFDM symbol (i.e., for each index value t).
12
M. Nicoli et al.
The estimation of the channel/interference parameters may be obtained from pilots
through the least-squares (LS) method, then followed by interpolation to extend the
estimate over the whole time-frequency bandwidth [12].
Here, we consider a IEEE 802.16-OFDM-256 fixed access scenario, where the
channel coherence time is large enough to make the channel gains invariant over
the whole frame interval. The whole bandwidth is assigned to one user at a time,
thus the set of interferers It and the corresponding covariance matrix Qt do not vary
over the frequency domain. However, due to the asynchronous access of users in
neighboring cells, even in this fixed scenario the set It of active interferers can vary
over the time (within the burst interval), generating abrupt changes in the signal
interfering on user SS0 and thus in its covariance matrix Qt .
In [13] a method was proposed to estimate the channel and to track the power/
spatial features of the interference by exploiting both the preambles and the pilots included in each OFDM symbol of the frame. At first, the signals measured
in several preambles of the frame are jointly processed to obtain an estimate of
the channel ht (which is constant for the whole frame) and a first estimate of the
interference covariance matrix Qt in each preamble. The channel ht is evaluated
through a weighted average of the LS estimates obtained separately from the different preambles: the average accounts for the stationarity of the channel, while
the weighting accounts for the possible variations of the interference scenario. The
interference covariance matrix Qt is then updated within each burst, by using the
embedded pilots. Abrupt variations of the interference are detected by comparing
the covariance estimate obtained from the current pilots with the one extracted from
the previous OFDM symbol, in order to decide whether the spatial structure of the
interference has changed or not: if the correlation ρ between the two subsequent
covariance estimates is larger than a given threshold ρ̄, the interference covariance
estimate is refined by averaging, otherwise is re-initialized according to the new
estimate value.
An example is shown in Fig. 1.6 for the square cellular layout in Fig. 1.1(a).
The optimized ULA with M = 4 elements and inter-element spacing ⌬opt is
adopted by BS0 . The receiver consists of MVDR filtering, soft demodulation and
convolutional/Reed-Solomon (CC/RS) decoding. The user SS0 transmits with power
27dBm and transmission mode T2 . Interferers {SSi }i∈It are uniformly distributed in
their cells; their power (subject to log-normal shadowing with standard deviation
8dB) and transmission mode are adaptively selected based on the channel state so as
to guarantee a BER≤10−3 . Multipath channels are modelled according to the SUI-3
model, DOAs of both user and interferers are drawn from a Gaussian distribution
with standard deviation 5 deg. We consider the transmission of 3 bursts of 10 symbols each, with the user SS0 placed in broadside at a distance d = 0.8 km from BS0 .
The interference scenario changes at the third and seventh symbol of each burst,
with positions of the three interferers selected uniformly within their cell. Figure 1.6
shows the BER (top) and the interference correlation (bottom) over the OFDM symbols. The estimation of the interference matrix Qt is obtained using three different
approaches: estimation only from the preamble of the current burst (thick line);
re-estimation within each OFDM symbol without memory (dashed line); tracking in
Deployment and Design of Multi-Antenna
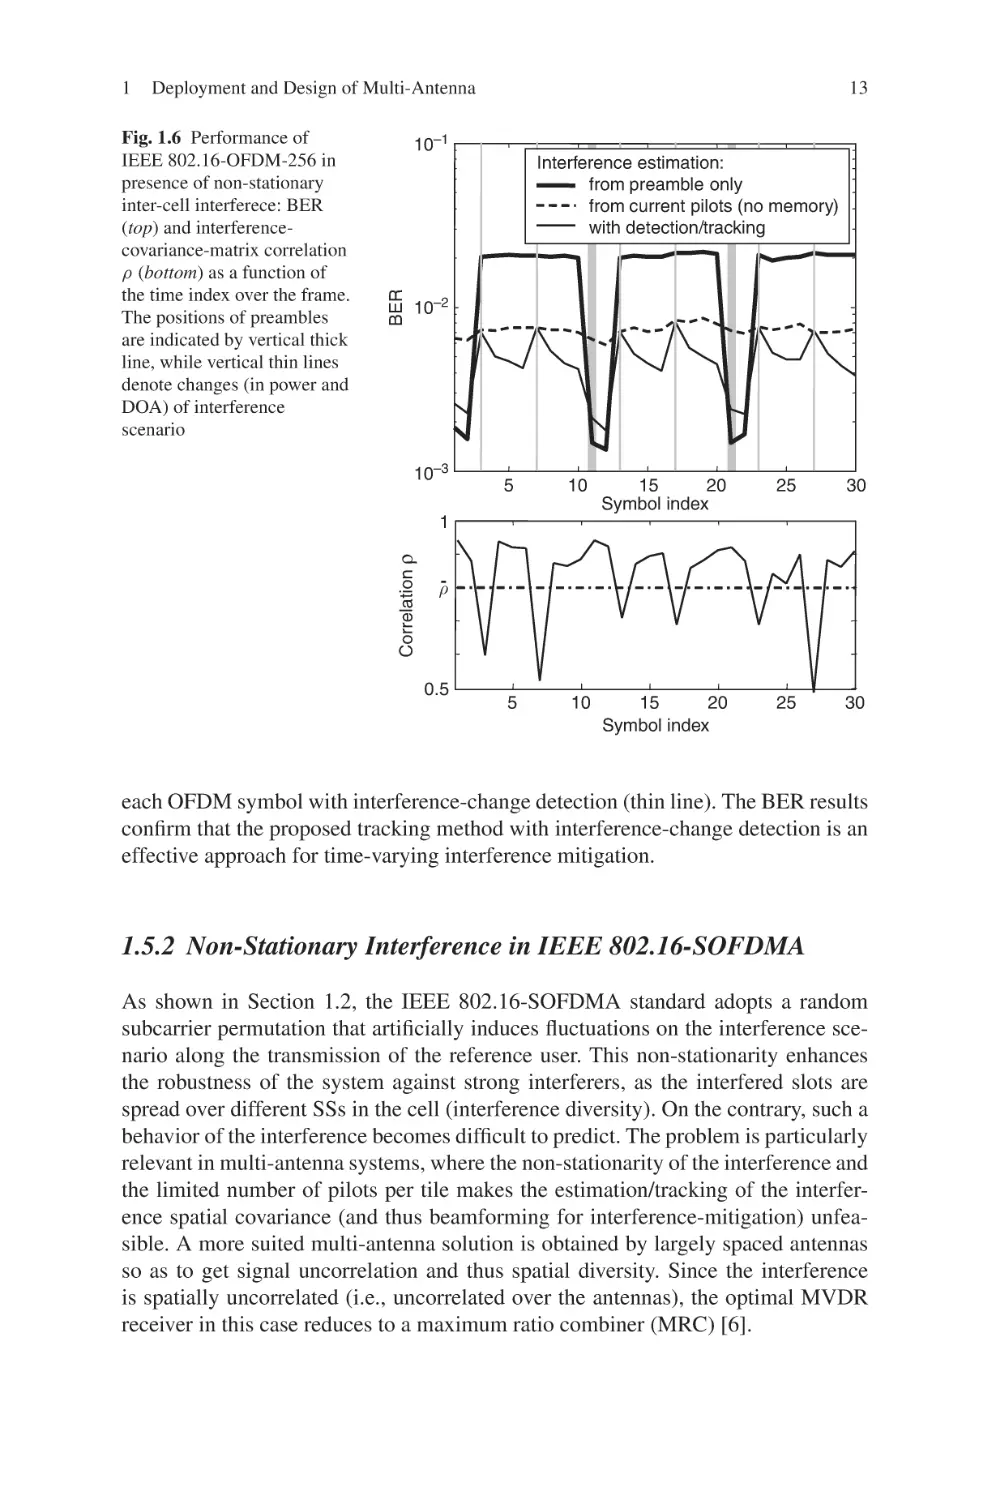
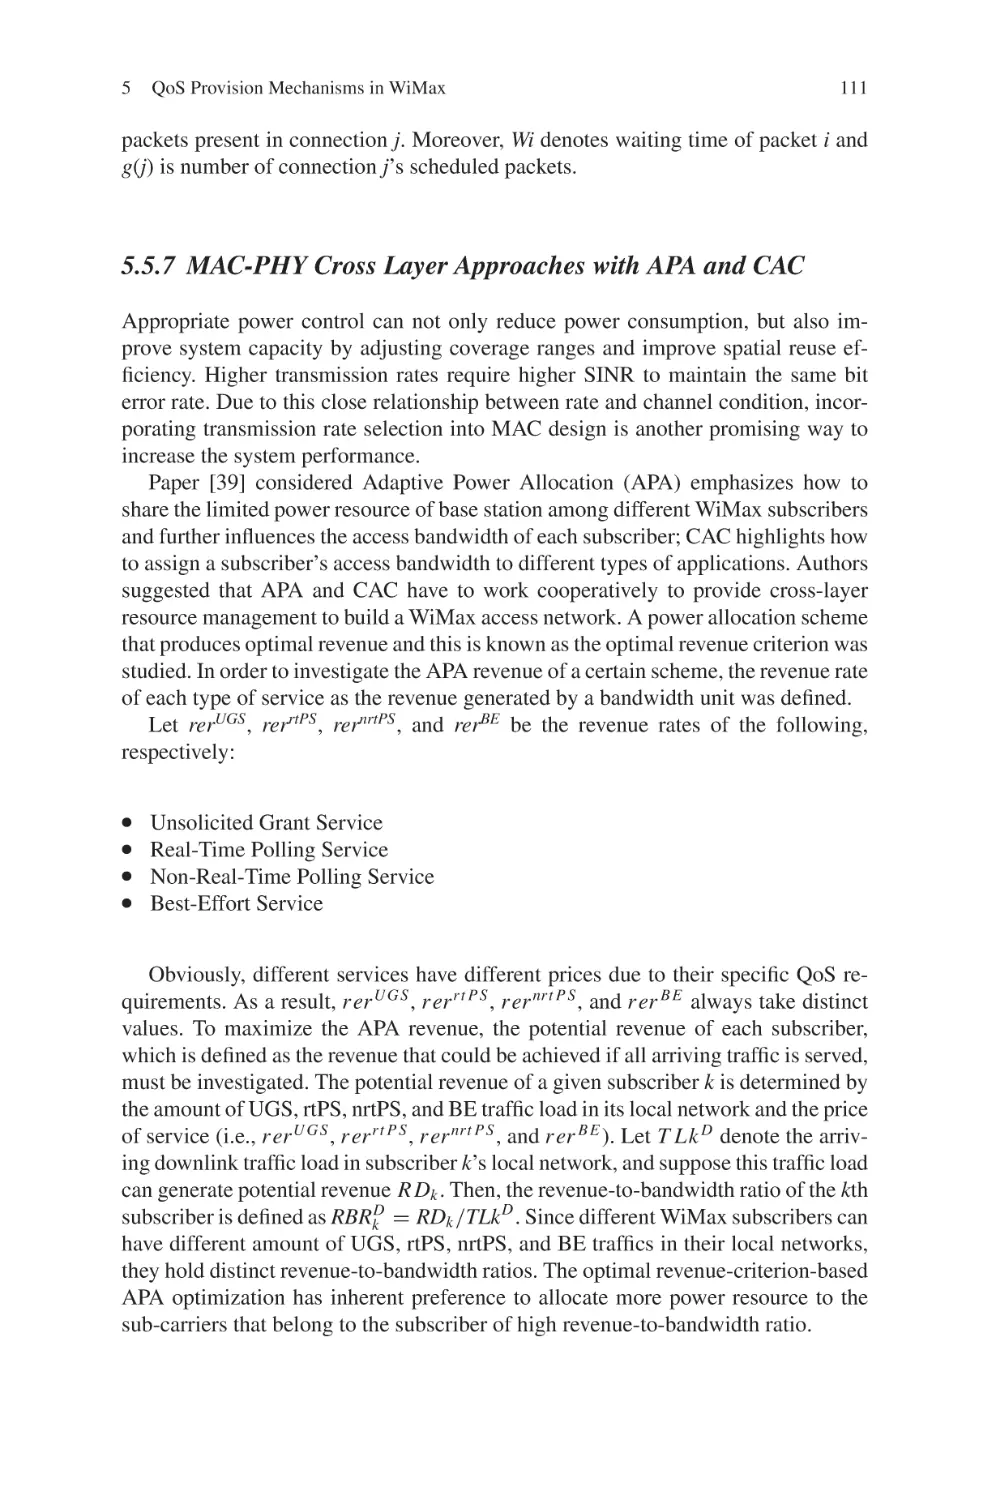
Fig. 1.6 Performance of
IEEE 802.16-OFDM-256 in
presence of non-stationary
inter-cell interferece: BER
(top) and interferencecovariance-matrix correlation
ρ (bottom) as a function of
the time index over the frame.
The positions of preambles
are indicated by vertical thick
line, while vertical thin lines
denote changes (in power and
DOA) of interference
scenario
13
10–1
Interference estimation:
from preamble only
from current pilots (no memory)
with detection/tracking
BER
1
10–2
10–3
5
10
15
20
Symbol index
25
30
5
10
15
20
Symbol index
25
30
Correlation ρ
1
ρ
0.5
each OFDM symbol with interference-change detection (thin line). The BER results
confirm that the proposed tracking method with interference-change detection is an
effective approach for time-varying interference mitigation.
1.5.2 Non-Stationary Interference in IEEE 802.16-SOFDMA
As shown in Section 1.2, the IEEE 802.16-SOFDMA standard adopts a random
subcarrier permutation that artificially induces fluctuations on the interference scenario along the transmission of the reference user. This non-stationarity enhances
the robustness of the system against strong interferers, as the interfered slots are
spread over different SSs in the cell (interference diversity). On the contrary, such a
behavior of the interference becomes difficult to predict. The problem is particularly
relevant in multi-antenna systems, where the non-stationarity of the interference and
the limited number of pilots per tile makes the estimation/tracking of the interference spatial covariance (and thus beamforming for interference-mitigation) unfeasible. A more suited multi-antenna solution is obtained by largely spaced antennas
so as to get signal uncorrelation and thus spatial diversity. Since the interference
is spatially uncorrelated (i.e., uncorrelated over the antennas), the optimal MVDR
receiver in this case reduces to a maximum ratio combiner (MRC) [6].
14
M. Nicoli et al.
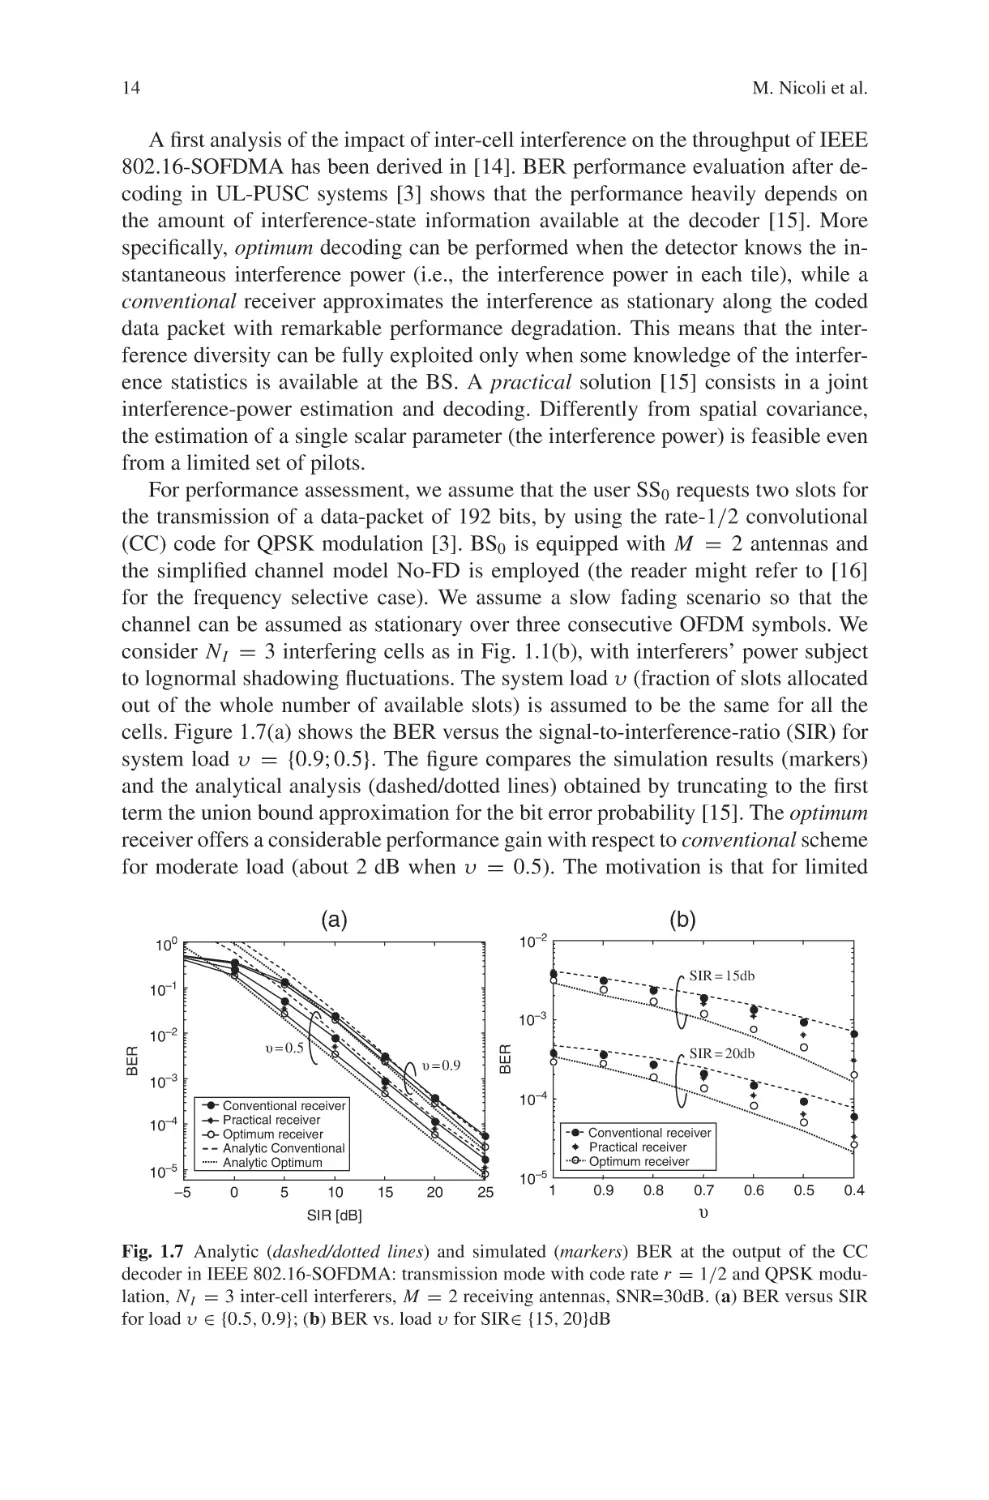
A first analysis of the impact of inter-cell interference on the throughput of IEEE
802.16-SOFDMA has been derived in [14]. BER performance evaluation after decoding in UL-PUSC systems [3] shows that the performance heavily depends on
the amount of interference-state information available at the decoder [15]. More
specifically, optimum decoding can be performed when the detector knows the instantaneous interference power (i.e., the interference power in each tile), while a
conventional receiver approximates the interference as stationary along the coded
data packet with remarkable performance degradation. This means that the interference diversity can be fully exploited only when some knowledge of the interference statistics is available at the BS. A practical solution [15] consists in a joint
interference-power estimation and decoding. Differently from spatial covariance,
the estimation of a single scalar parameter (the interference power) is feasible even
from a limited set of pilots.
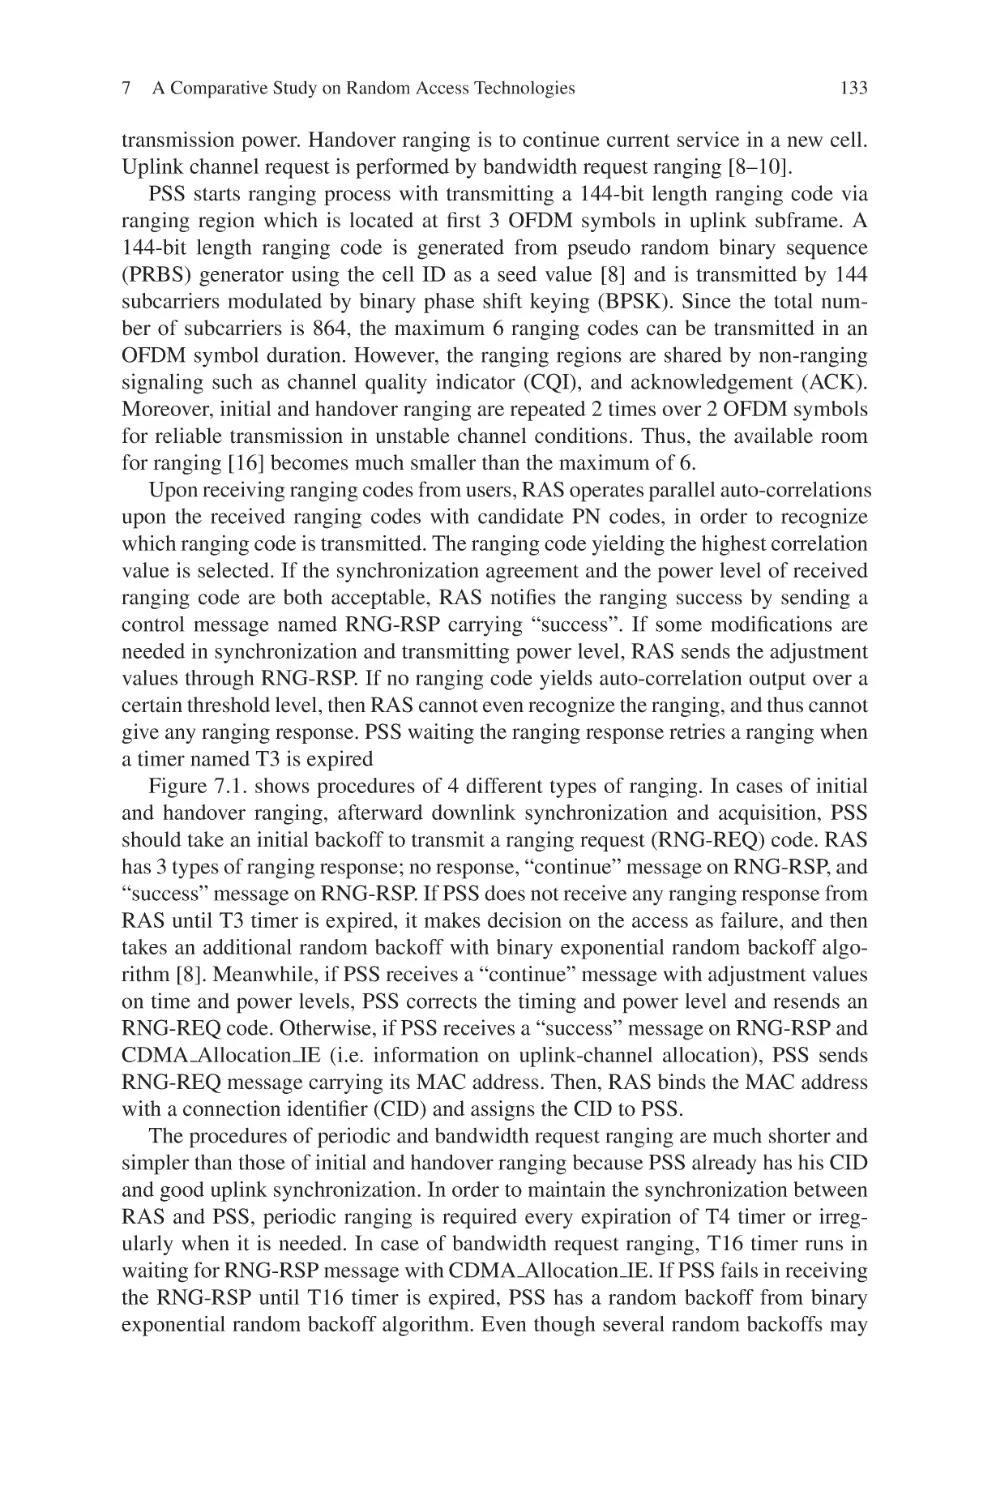
For performance assessment, we assume that the user SS0 requests two slots for
the transmission of a data-packet of 192 bits, by using the rate-1/2 convolutional
(CC) code for QPSK modulation [3]. BS0 is equipped with M = 2 antennas and
the simplified channel model No-FD is employed (the reader might refer to [16]
for the frequency selective case). We assume a slow fading scenario so that the
channel can be assumed as stationary over three consecutive OFDM symbols. We
consider N I = 3 interfering cells as in Fig. 1.1(b), with interferers’ power subject
to lognormal shadowing fluctuations. The system load υ (fraction of slots allocated
out of the whole number of available slots) is assumed to be the same for all the
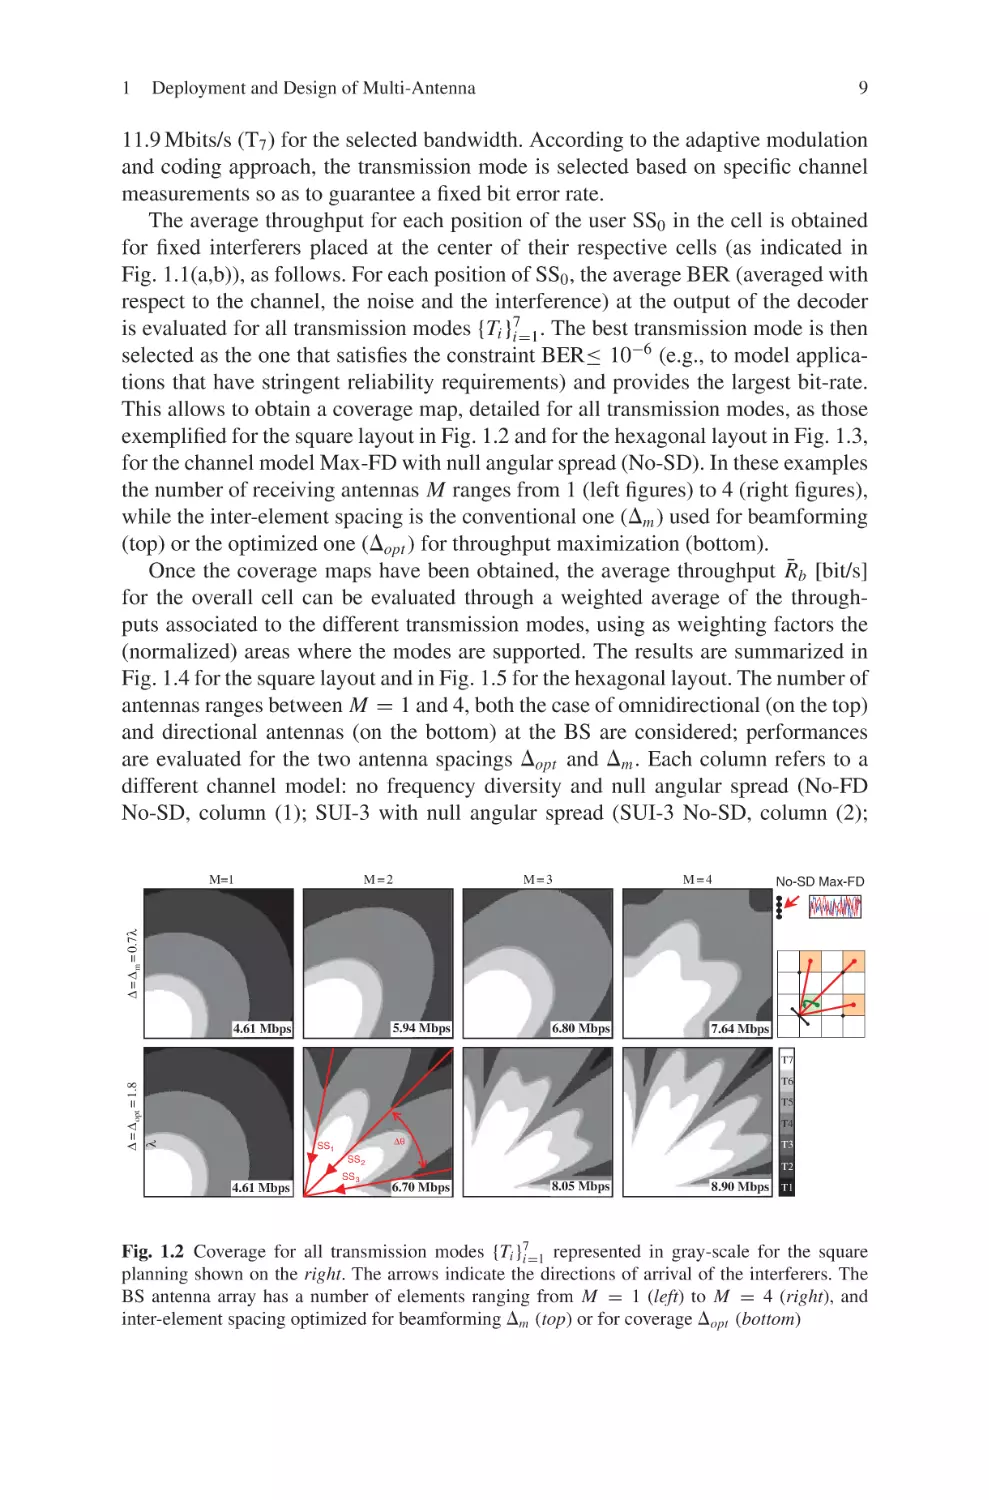
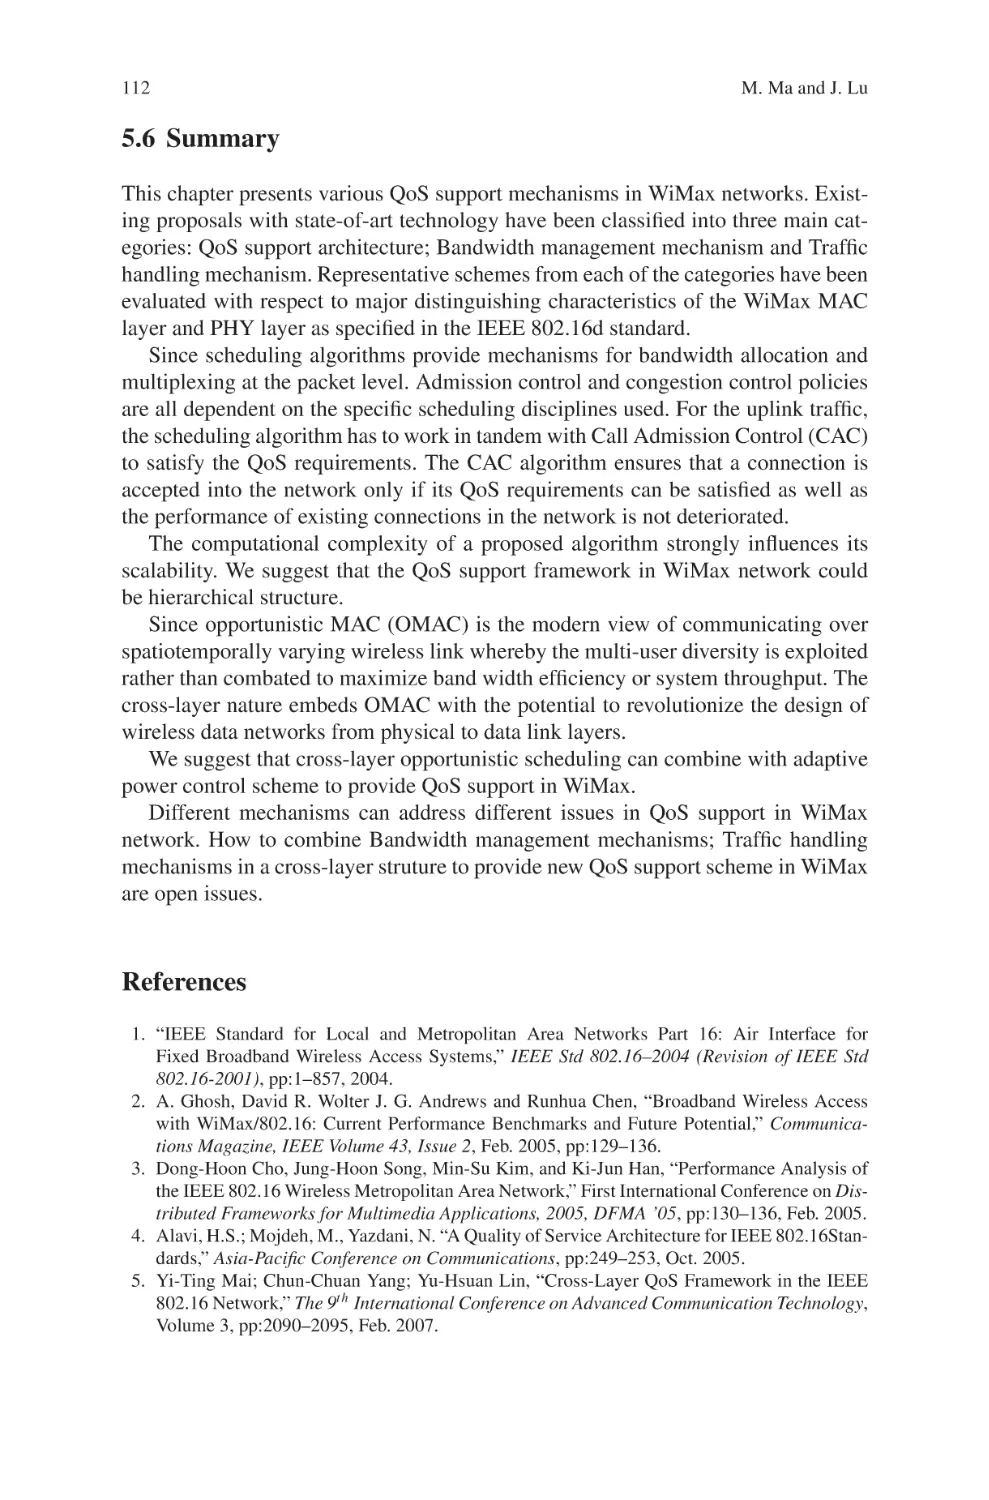
cells. Figure 1.7(a) shows the BER versus the signal-to-interference-ratio (SIR) for
system load υ = {0.9; 0.5}. The figure compares the simulation results (markers)
and the analytical analysis (dashed/dotted lines) obtained by truncating to the first
term the union bound approximation for the bit error probability [15]. The optimum
receiver offers a considerable performance gain with respect to conventional scheme
for moderate load (about 2 dB when υ = 0.5). The motivation is that for limited
(b)
(a)
10–2
100
SIR = 15db
10–1
BER
υ = 0.5
υ = 0.9
10–3
10
–4
10–5
–5
BER
10–3
10–2
10–4
Conventional receiver
Practical receiver
Optimum receiver
Analytic Conventional
Analytic Optimum
0
5
10
SIR [dB]
SIR = 20db
Conventional receiver
Practical receiver
Optimum receiver
15
20
25
10–5
1
0.9
0.8
0.7
0.6
0.5
0.4
υ
Fig. 1.7 Analytic (dashed/dotted lines) and simulated (markers) BER at the output of the CC
decoder in IEEE 802.16-SOFDMA: transmission mode with code rate r = 1/2 and QPSK modulation, N I = 3 inter-cell interferers, M = 2 receiving antennas, SNR=30dB. (a) BER versus SIR
for load υ ∈ {0.5, 0.9}; (b) BER vs. load υ for SIR∈ {15, 20}dB
1
Deployment and Design of Multi-Antenna
15
load (υ → 0) the number of interfering users sharing the same subcarrier abruptly
changes from tile to tile, thus making the interference to heavily fluctuate along the
coded packet. On the other hand, for large load (υ → 1) the number of collisions
with the interferers is almost constant (N I ) and the influence of the interference
non-stationarity is mitigated. As a consequence, the conventional receiver is mainly
effective in systems with large load. The results are corroborated by Fig. 1.7(b) that
shows the BER versus the system load υ for SIR= {15; 20}dB.
1.6 Conclusions
This chapter has focused on technological solutions at the PHY layer for management of inter-cell interference in WiMax-compliant systems. The study has assumed
components and features as defined in the standards IEEE 802.16-OFDM-256 [2]
and SOFDMA [3]. The main conclusion is that an appropriate system design (deployment and signal processing) allows to harness relevant performance gains in
terms of transmission quality-of-service. From an evolutionary perspective, further
enhancements in the interference rejection capabilities of the PHY layer could be
achieved by: (1) introducing multi-cell cooperation: decoding at different cell-sites
is performed jointly by capitalizing on the existing high-capacity backbone: (2)
cross-layer optimization of PHY layer and higher layers functionalities, such as
scheduling.
Acknowledgments The authors would like to acknowledge the former students D. Archetti,
A. Bonfanti, M. Sala and A. Villarosa for their contribution to the development of the simulator for
IEEE 802.16 systems.
This work was supported by Nokia Siemens Networks S.p.A. Com CRD MW, Cassina de’
Pecchi, Italy and by MIUR-FIRB Integrated System for Emergency (InSyEme) project under the
grant RBIP063BPH.
References
1. A. Ghosh, D. R. Wolter, J. G. Andrews, R. Chen, “Broadband wireless access with
WiMax/802.16: current performance benchmarks and future potential,” IEEE Commun. Mag.,
Vol. 43, No. 2, pp. 129–136, Feb. 2005.
2. IEEE Std 802.16TM -2004, “802.16TM IEEE standard for local and metropolitan area networks
Part 16: Air interface for fixed broadband wireless access systems,” Oct. 2004.
3. IEEE Std 802.16eTM -2005 and IEEE Std 802.16TM -2004/Cor 1-2005 5, “IEEE standard for
local and metropolitan area networks Part 16: Air interface for fixed and mobile broadband
wireless access systems. Amendment 2: Physical and medium access control layers for combined fixed and mobile operation in licensed bands and Corrigendum 1,” Sep. 2005.
4. H. Yaghoobi, “Scalable OFDMA physical layer in IEEE 802.16 WirelessMAN”, Intel Tech.
J., Vol. 8, No. 3, pp. 201–212, Aug. 2004.
5. A. Salvekar, S. Sandhu, Q. Li, M. Vuong, X. Qian, “Multiple-antenna technology in WiMax
Systems,” Intel Technology Journal, Vol. 8, No. 3, pp. 229–240, Aug. 2004.
6. H. L. Van Trees, Optimum Array Processing, Wiley, 2002.
16
M. Nicoli et al.
7. A. Goldsmith, Wireless Communications, Cambridge University Press, 2005.
8. IEEE 802.16.3c-01/53, IEEE 802.16 Broadband Wireless Access Working Group, “Simulating the SUI channel models,” April 2004.
9. R. Jana and S. Dey, “3G wireless capacity optimization for widely spaced antenna arrays,”
IEEE Pers. Commun., Vol. 7, No. 6, pp. 32–35, Dec. 2000.
10. S. Savazzi, O. Simeone, and U. Spagnolini, “Optimal design of linear arrays in a TDMA cellular system with Gaussian interference,” EURASIP Journ. on Wireless Comm. and Networking,
Smart Antennas for Next Generation Wireless Systems, 2006.
11. M. Nicoli, L. Sampietro, C. Santacesaria, S. Savazzi, O. Simeone, U. Spagnolini, “Throughput
optimization for non-uniform linear antenna arrays in multicell WiMax systems,” Int’l. ITGIEEE Workshop on Smart Antennas, March 2006.
12. Y. Li, L. J. Cimini and N. R. Sollenberger, “Robust channel estimation for OFDM systems
with rapid dispersive fading,” IEEE Trans. Commun., Vol. 46, No. 7, pp. 902–915, July 1998.
13. M. Nicoli, M. Sala, L. Sampietro, C. Santacesaria, O. Simeone, “Adaptive array processing for
time-varying interference mitigation in IEEE 802.16,” Proc. IEEE Int’l. Symp. on Pers. Indoor
and Mobile Radio Commun. (PIMRC’06), Helsinki, Sep. 2006.
14. S-E. Elayoubi, B. Fourestiè, and X. Auffret, “On the capacity of OFDMA 802.16 systems,”
Proc. IEEE Int’l. Conf. on Commun. (ICC’06), June 2006.
15. R. Bosisio and U. Spagnolini, “Collision model for the bit error rate analysis of multicell
multiantenna OFDMA systems,” Proc. IEEE Int’l. Conf. on Commun. (ICC’07), June 2007.
16. D. Molteni, M. Nicoli, R. Bosisio, L. Sampietro, “Performance analysis of multiantenna
WiMax systems over frequency selective fading channels,” Proc. IEEE Int’l. Symp. on Pers.
Indoor and Mobile Radio Commun. (PIMRC’07), Athens, Sep. 2007.
Chapter 2
Dynamic Bandwidth Allocation
for 802.16E-2005 MAC
Yi-Neng Lin, Shih-Hsin Chien, Ying-Dar Lin, Yuan-Cheng Lai
and Mingshou Liu
Abstract The IEEE 802.16e-2005 is designed to support high bandwidth for the
wireless metropolitan area network. However, the link quality is likely to degrade
drastically due to the unstable wireless links, bringing ordeals to the real-time applications. Therefore, a feasible bandwidth allocation algorithm is required to utilize
the precious bandwidth and to provide service differentiation. This article presents
the general background of allocation schemes and introduces a Two-Phase Proportionating (TPP) algorithm to tackle the above challenges. The first phase dynamically determines the subframe sizes while the second phase further differentiates
service classes and prevents from bandwidth waste. Performance comparison with
other algorithms confirms that TPP achieves the highest bandwidth utilization and
the most appropriate differentiation.
Keywords WiMax · Dynamic · Bandwidth Allocation · Proportion · Service
Differentiation
2.1 Introduction
General broadband technologies have been used to provide multimedia applications
with stable connectivity. However, for a growing volume of hand-held devices running these applications, those technologies are unable to meet the requirements such
as ubiquitous access, low deployment cost, and mobility support. Broadband wireless access (BWA), standardized as 802.16e-20051 [1] and known as WiMax, has
emerged to be a potential candidate to meet these criteria. The standard defines
signaling mechanisms [2] between base stations (BSs) and subscriber stations (SSs)
considering both fixed and mobile wireless broadband. It supports not only seamless
handover at vehicle speeds but also an extra service class compared to the previous
version, 802.16-2004 [3].
Y.-N. Lin (B)
National Chiao Tung University, University Road, Hsinchu, Taiwan
1
In the following contexts we use 802.16 to represent 802.16e-2005.
M. Ma (ed.), Current Technology Developments of WiMax Systems,
C Springer Science+Business Media B.V. 2009
DOI 10.1007/978-1-4020-9300-5 2,
17
18
Y.-N. Lin et al.
However, the nature of wireless communication makes it difficult to provide stable signal quality, and could lead to much degraded bandwidth. For example, signal gradually fades as the transmission distance stretches, and channels are usually
interfered with each other. Furthermore, though 802.16 defines service classes for
differentiation, no mechanism is specified to fulfill the QoS guarantees. Therefore, a
feasible algorithm is required to utilize and fairly allocate the bandwidth considering
the following issues. First, the Grant Per SS (GPSS) scheme specified in the standard
needs to be adhered to. In this scheme, the BS grants requested bandwidth to each
SS rather than to each connection, so that the SS can flexibly respond to different
QoS requirements of the connections. Second, in order to make the best use of
the link, the separation between uplink and downlink subframes and the number of
physical-layer slots needed given a certain amount of requested bytes, have to be
carefully determined.
Similar situations to design allocation algorithm in 802.16 can be seen in systems such as Wi-Fi (Wireless Fidelity) [4] and DOCSIS (Data over Cable System
Interface Specifications) [5] because of the similar point-to-multipoint architectures.
However, Wi-Fi adopts arbitrary contention for transmission opportunities in any
time and is thus not appropriate in the WiMax environment having lengthy roundtrip delay. Also little can be referenced from works regarding the DOCSIS since it
follows the Grant Per Connection (GPC) scheme [6] which is not flexible for SSs
to be adaptive to connections of real-time applications and is not supported by the
standard. Several works [7–10] investigating allocation algorithms over 802.16 are
proposed, but again only the GPC scheme is supported. The solution researched
by [11] is based on GPSS, but the separation of the uplink and downlink channels is
fixed so that bandwidth is usually not properly utilized.
In this article, a novel bandwidth allocation algorithm, Two-Phase Proportionating (TPP), is introduced to maximize the bandwidth utilization as well as to meet
the QoS requirements under the Time Division Duplexing (TDD) mode. TDD, compared to the Frequency Division Duplexing (FDD), is frequently favored because of
the flexibility to divide a time frame into adequate uplink and downlink subframes so
that bandwidth waste could be minimized. Employing the concept of proportionate
allocation, the algorithm dynamically adjusts the uplink and downlink subframes
considering different slot definitions, and fairly allocates each subframe to queues
of different classes. Simulation results further validate the efficiency of bandwidth
utilization and service differentiation.
The rest of this article is organized as follows. We brief the IEEE 802.16 MAC
and review the related works to justify our problems. Then we introduce the TPP algorithm and exemplify the operations, followed by the simulation setup and results.
Some conclusive remarks are given finally, outlining some future directions.
2.2 Background
Unlike Wi-Fi which is used for small range communications, WiMax is mainly
applied to metropolitan area networks and therefore must master all data transmission decisions to/from SSs to avoid synchronization problems. In this section, we
2
Dynamic Bandwidth Allocation
19
brief the WiMax frame structure under TDD mode, describe the five service classes
whose connections fill up the frame, and detail the packet flow in the BS MAC. The
bandwidth allocation module as well as its input and output is identified according to
the flow. Some related researches investigating the allocation problem are discussed.
2.2.1 Overview of the MAC Protocol
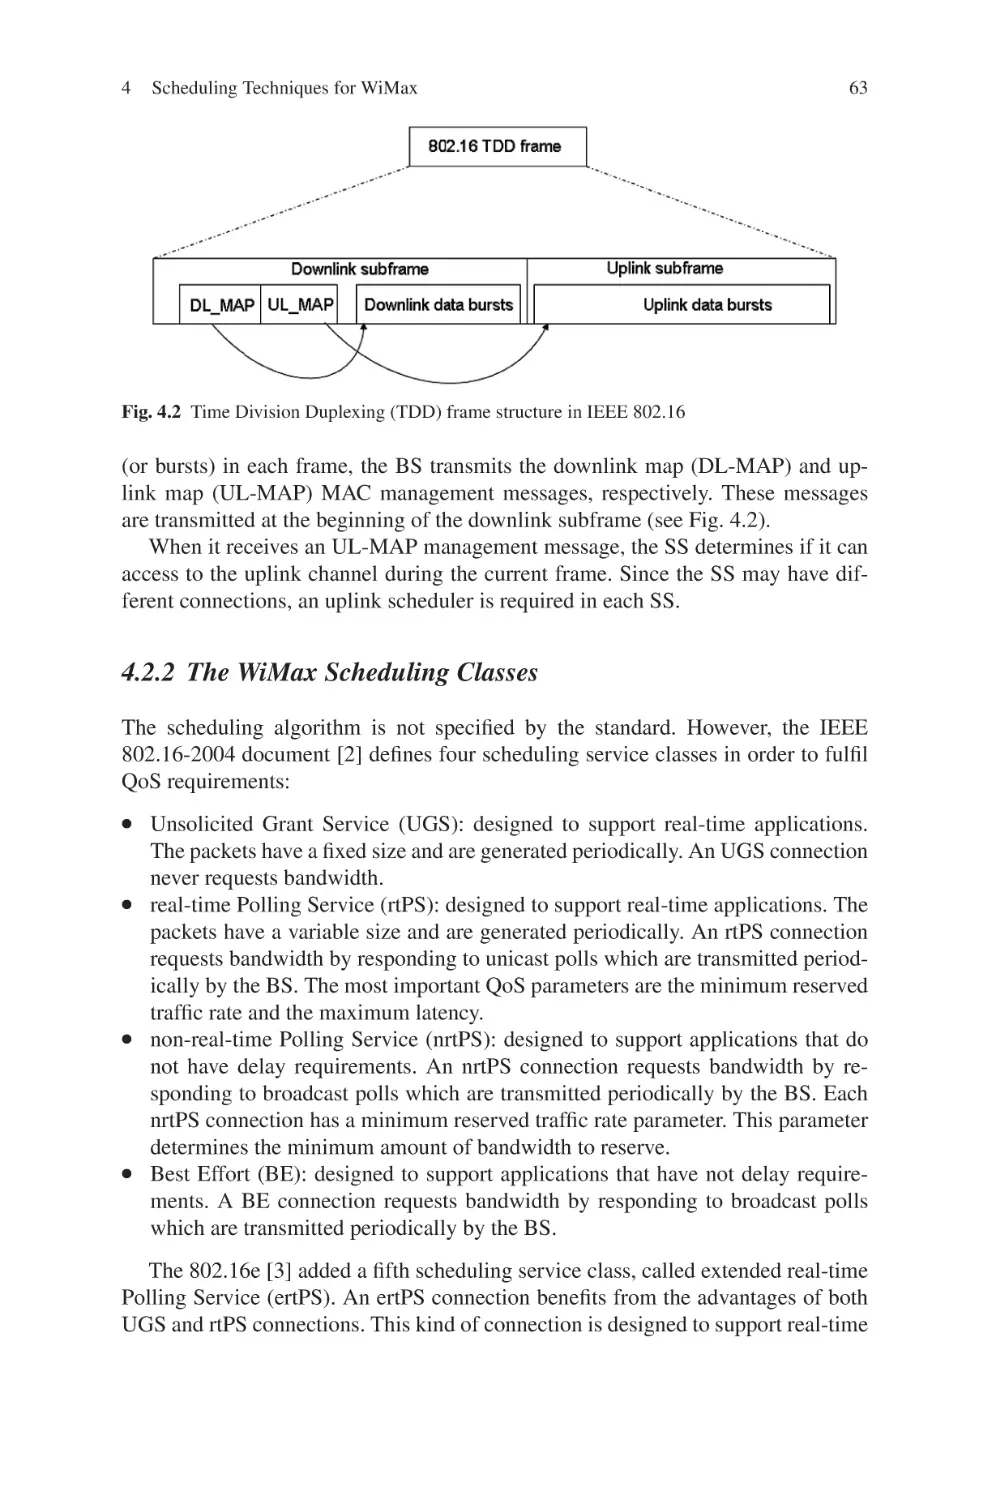
2.2.1.1 TDD Subframe
The frame structure under TDD includes (1) UL-MAP and DL-MAP for control messages, and (2) downlink and uplink data bursts whose scheduled time is
determined by the bandwidth allocation algorithm and is indicated in the MAP
messages. All UL-MAP/DL-MAP and data bursts are composed of a number of
OFDMA (Orthogonal Frequency Division Multiplexing Access) slots, in which a
slot is one subchannel by three OFDMA symbols in uplink and one subchannel
by two OFDMA symbols in downlink. This mode is named PUSC (Partial Usage
of Subchannels), the mandatory mode in 802.16, and is considered throughout the
work.
2.2.1.2 Uplink Scheduling Classes
The 802.16 currently supports five uplink scheduling classes, namely the Unsolicited Grant Service (UGS), Real-time Polling Service (rtPS), Non-real-time
polling Service (nrtPS), Best Effort (BE), and the lately proposed Extended Realtime Polling Service (ertPS). Each service class defines different data handling
mechanisms to carry out service differentiation. The UGS has the highest priority
and reserves a fixed amount of slots at each interval for bandwidth guarantee. rtPS,
nrtPS, and BE rely on the periodic polling to gain transmission opportunities from
BS, while the ertPS reserves a fixed number of slots as UGS does and notifies the BS
in the contention period of possible reservation changes. nrtPS and BE also contend,
according to their pre-configured priority, for transmission opportunities if they fail
to get enough bandwidth from polling. An nrtPS service flow is always superior to
that of BE.
2.2.1.3 Detailed Packet Flow in the MAC Layer
The complete packet flow in the uplink and downlink of a BS MAC is illustrated
as follows. For the downlink processing flow, both IP and ATM packets in the
network layer are transformed from/to the MAC Convergence Sublayer (CS) by
en/de-capsulating the MAC headers. According to the addresses and ports, packets
are classified to the corresponding connection ID of a service flow which further
determines the QoS parameters. Fragmentation and packing are then performed
to form a basic MAC Protocol Data Unit (PDU), whose size frequently adapts
to the channel quality, followed by the allocation of resulting PDUs into queues.
Once the allocation starts, the bandwidth management unit arranges the data burst
20
Y.-N. Lin et al.
transmissions to fill up the frame. The MAP builder then writes the arrangement,
namely the allocation results, into the MAP messages to notify the PHY interface when to send/receive the scheduled data in the time frame. Encryption, header
checksum and frame CRC calculations are carried out to the PDUs before they are
finally sent to the PHY. The uplink processing flow is similar to that of the downlink
except that the BS also receives standalone or piggybacked bandwidth requests.
Among the above operations, it is obvious that the bandwidth management, and thus
the bandwidth allocation algorithm, are critical and need to be carefully designed in
order to improve the performance of the system.
2.2.2 Related Work
A number of studies regarding the bandwidth allocation over 802.16 can be found.
Hawa and Petr [7] propose a QoS architecture applicable for both DOCSIS and
802.16 using semi-preemptive priority for scheduling UGS traffic while priorityenhanced Weighted Fair Queuing (WFQ) for others. Chu et al. [8] employ the
Multi-class Priority Fair Queuing (MPFQ) for the SS scheduler and the Weighted
Round Robin (WRR) for that of the BS. Though innovative in the architectural
design, both of them do not present experiment results validating the architecture. Wongthavarawat and Ganz [9] introduce the Uplink Packet Scheduling (UPS)
for service differentiation. It applies the Strict Priority to the selection among
service classes, in which the UL and DL have same capacity, and each service
class adopts a certain scheduling algorithm for queues within it. However, this
scheme deals with only uplink channel so that overall bandwidth utilization suffers. The Deficient Fair Priority Queue (DFPQ) [10], which uses the maximum
sustained rate as the deficit counter to specify the transmission quantum, dynamically adjusts the uplink and downlink proportion. Nonetheless, this method is suitable only for GPC rather than GPSS. Maheshwari et al. [11] support GPSS using
proportion, though the proportion is not alterable in run-time. Furthermore, the
above schemes do not consider the slot definition when translating data bytes requested by SSs into OFDMA slots to practically determine the allocation of a time
frame.
2.2.3 Goals
To solve the allocation problem which could lead to long latency and serious jittering, a well-designed bandwidth allocation algorithm shall possess three merits. First
and obviously, the algorithm must implement GPSS to comply with the standard as
well as to provide flexible packet scheduling in SSs. Second, service classes should
adhere to the corresponding QoS requirements such as Maximum Sustained Traffic
Rate (MSTR) and Minimum Reserved Traffic Rate (MRTR) for differentiated guarantees. The former prevents a certain class from consuming too much bandwidth
while the latter sustains a service class with least feeds. Third, in order to achieve
2
Dynamic Bandwidth Allocation
21
high throughput, the proportion of the uplink and downlink subframes should be
able to be dynamically adjusted. The separator was previously fixed and failed to
adapt to situations in which uplink and downlink bandwidth needs vary.
2.3 Two-Phase Proportionating
This section details the concept and procedure of the proposed Two-Phase Proportionating (TPP) algorithm. Each phase manipulates different levels of allocation to
achieve high bandwidth utilization and QoS guarantees. An example is presented
finally.
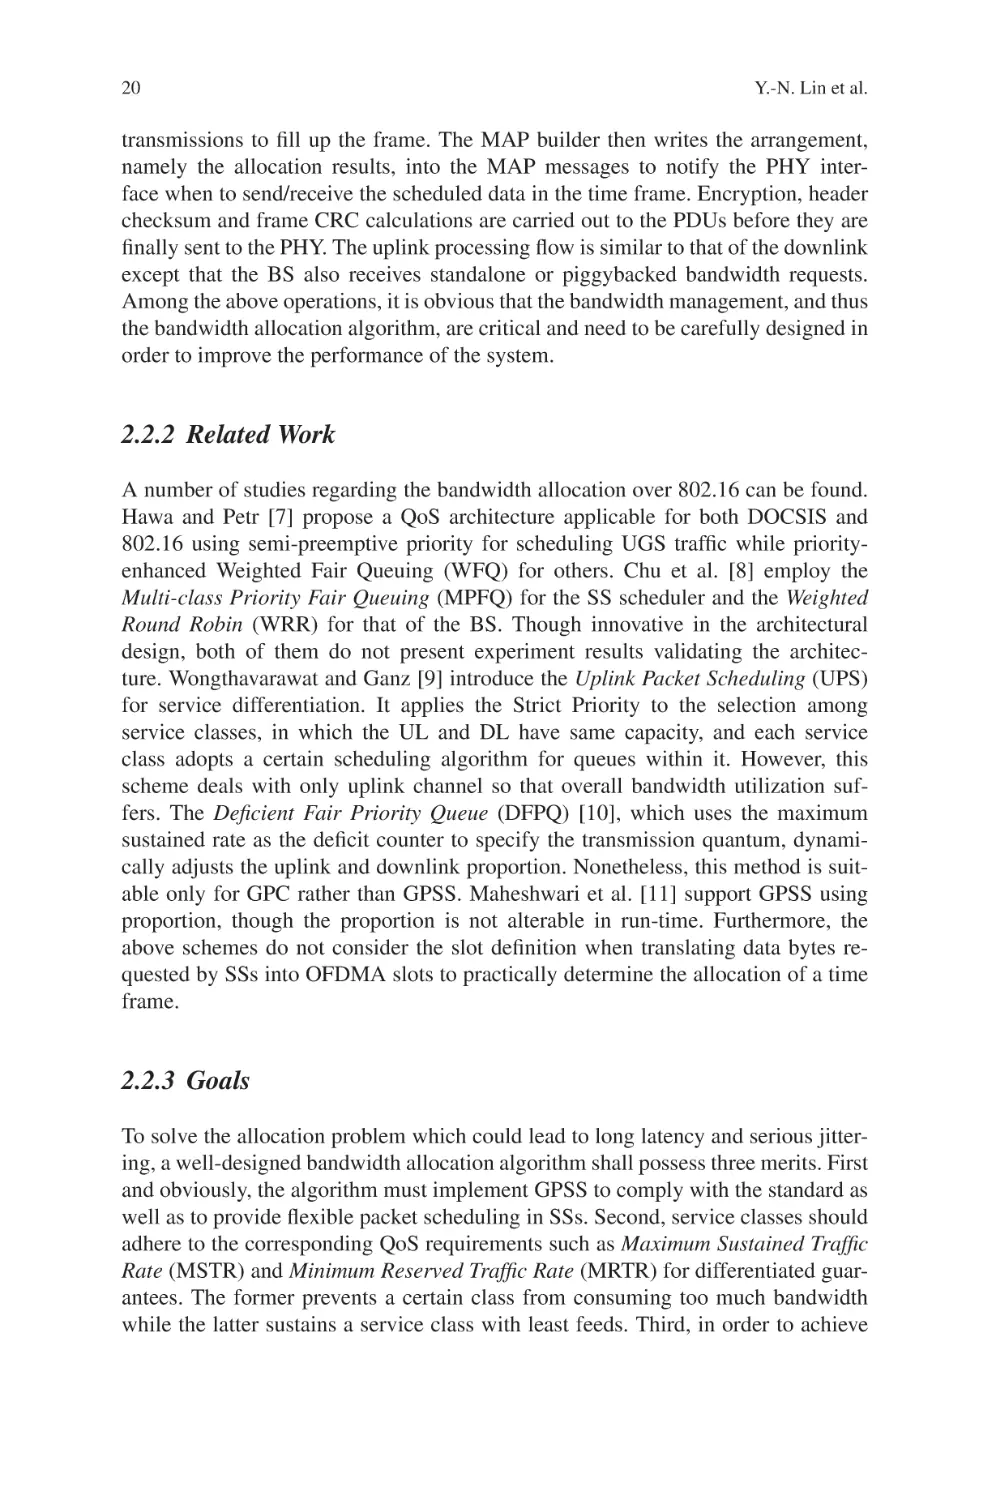
2.3.1 Overview of the Algorithm
The goal of bandwidth allocation in 802.16 is actually to fill up the whole TDD
time frame, in which the proportions of the uplink and downlink subframes can be
dynamically adjusted. Every subframe is further allocated to service classes/queues
of different QoS requirements. Observing these two targets, the Two-Phase Proportionating (TPP) is proposed in this work to well utilize the bandwidth. The first
phase decides the subframe sizes according to the requested sizes of both downlink
and uplink, while the second phase distributes the bandwidth to each queue based on
the corresponding QoS parameter represented as weight, and an adjustment factor
reflecting the practical demand. Finally the TPP adheres to the GPSS by granting
SSs the allocated bandwidth of each queue. The operations of the algorithm are
depicted in Fig. 2.1 and elaborated in the following subsections.
Convergence Sublayer
Translator
Downlink
Queues with/o
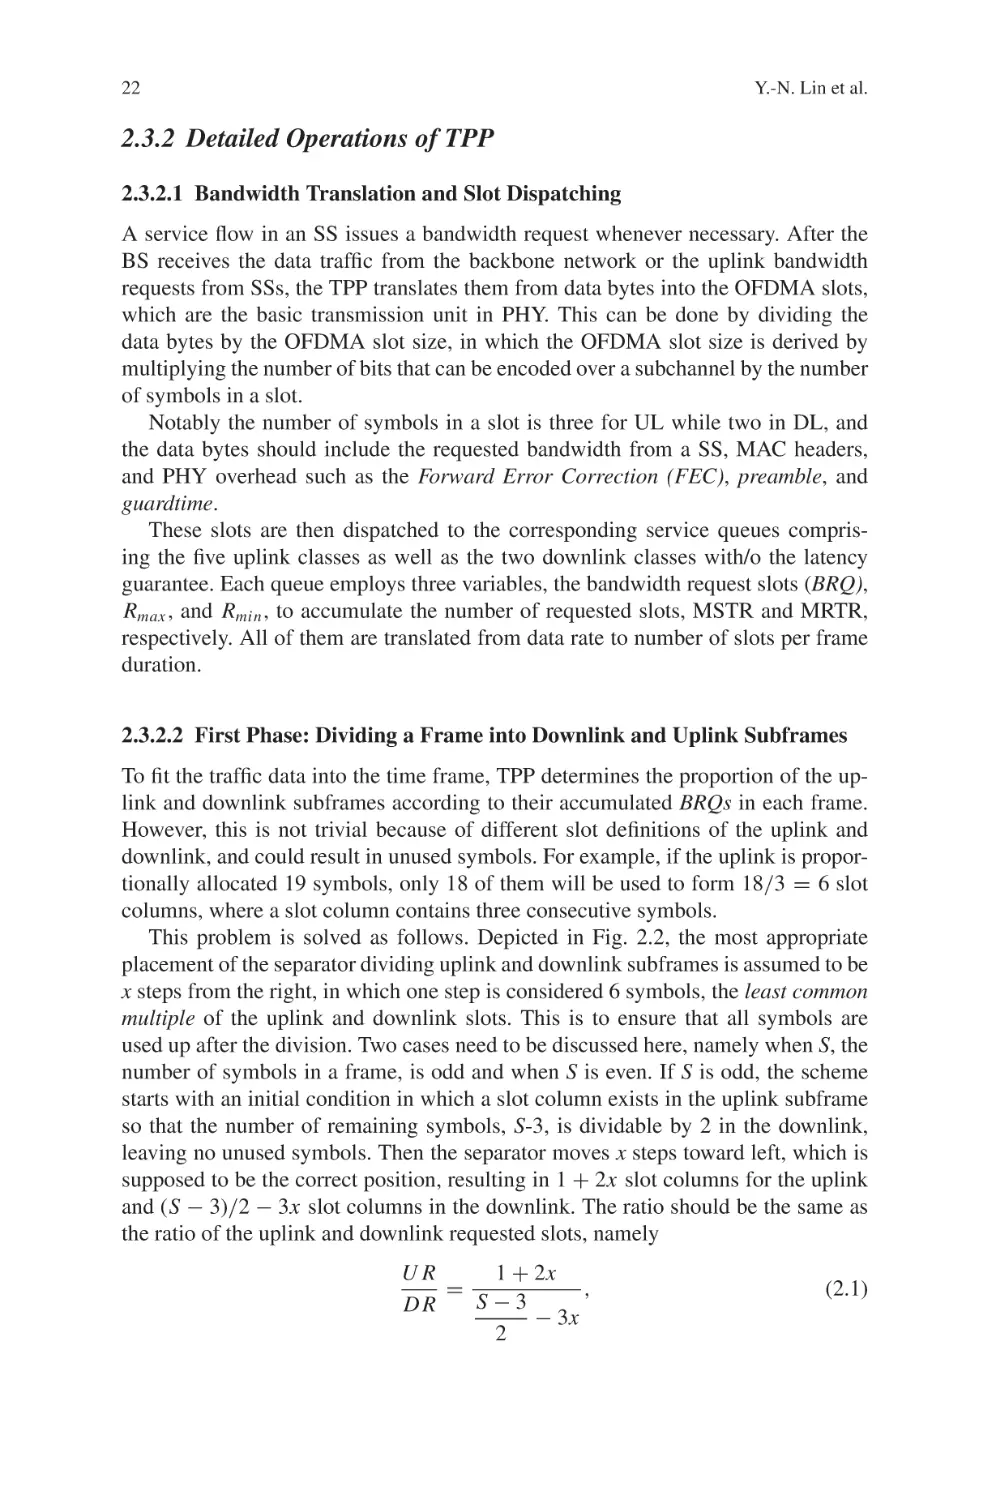
latency
Downlink
data
Uplink
Assign slots
for queues
Determine
UL/DL subframe
First phase
proportionating
UGS
Second phase
proportionating
Second phase
proportionating
Assign slots
to SSs
Assign slots
to SSs
Write in
DL-MAP
Write in
UL-MAP
ertPS
Translator
Bandwidth
requests
rtPS
nrtPS
Two-Phase
Proportionating
BE
PHY Layer
Fig. 2.1 Architecture of the Two-Phase Proportionating (TPP)
Downlink
frame
Uplink
frame
22
Y.-N. Lin et al.
2.3.2 Detailed Operations of TPP
2.3.2.1 Bandwidth Translation and Slot Dispatching
A service flow in an SS issues a bandwidth request whenever necessary. After the
BS receives the data traffic from the backbone network or the uplink bandwidth
requests from SSs, the TPP translates them from data bytes into the OFDMA slots,
which are the basic transmission unit in PHY. This can be done by dividing the
data bytes by the OFDMA slot size, in which the OFDMA slot size is derived by
multiplying the number of bits that can be encoded over a subchannel by the number
of symbols in a slot.
Notably the number of symbols in a slot is three for UL while two in DL, and
the data bytes should include the requested bandwidth from a SS, MAC headers,
and PHY overhead such as the Forward Error Correction (FEC), preamble, and
guardtime.
These slots are then dispatched to the corresponding service queues comprising the five uplink classes as well as the two downlink classes with/o the latency
guarantee. Each queue employs three variables, the bandwidth request slots (BRQ),
Rmax , and Rmin , to accumulate the number of requested slots, MSTR and MRTR,
respectively. All of them are translated from data rate to number of slots per frame
duration.
2.3.2.2 First Phase: Dividing a Frame into Downlink and Uplink Subframes
To fit the traffic data into the time frame, TPP determines the proportion of the uplink and downlink subframes according to their accumulated BRQs in each frame.
However, this is not trivial because of different slot definitions of the uplink and
downlink, and could result in unused symbols. For example, if the uplink is proportionally allocated 19 symbols, only 18 of them will be used to form 18/3 = 6 slot
columns, where a slot column contains three consecutive symbols.
This problem is solved as follows. Depicted in Fig. 2.2, the most appropriate
placement of the separator dividing uplink and downlink subframes is assumed to be
x steps from the right, in which one step is considered 6 symbols, the least common
multiple of the uplink and downlink slots. This is to ensure that all symbols are
used up after the division. Two cases need to be discussed here, namely when S, the
number of symbols in a frame, is odd and when S is even. If S is odd, the scheme
starts with an initial condition in which a slot column exists in the uplink subframe
so that the number of remaining symbols, S-3, is dividable by 2 in the downlink,
leaving no unused symbols. Then the separator moves x steps toward left, which is
supposed to be the correct position, resulting in 1 + 2x slot columns for the uplink
and (S − 3)/2 − 3x slot columns in the downlink. The ratio should be the same as
the ratio of the uplink and downlink requested slots, namely
1 + 2x
UR
=
,
S−3
DR
− 3x
2
(2.1)
Dynamic Bandwidth Allocation
23
Fig. 2.2 The placement of
the separator in the first phase
S symbols
1 slot comprises 2 symbols
1 slot comprises 3 symbols
UR
S −3
− 3x slot col.
2
UR
1 + 2x
=
DR S − 3 − 3 x
2
Separator (finial placement)
Control messages
Subchannel index
DR
S −3
slot col.
2
Downlink Subframe
TTG
1+2x slot col.
moving x
steps, namely
6x symbols
Separator (initial placement)
2
Slot
col.
Uplink Subframe
where UR and DR represents the BRQ of the uplink and downlink, respectively.
Similar concept can be applied to the case when S is even, except that in the initial
condition no slot column exists in the uplink whereas S/2 slot columns are derived
in the downlink,
2x
UR
.
=
S
DR
− 3x
2
(2.2)
The x can be obtained after solving the equation and notably is rounded off if it
has a fraction.
2.3.2.3 Second Phase: Allocating Subframes to Queues
After properly dividing the frame into uplink and downlink subframes, in the second phase we start to allocate them to service queues. In this phase, the Rmin of all
queues are firstly satisfied for minimum slots guarantee, followed by the proportionating of the remaining slots to queues except the UGS and ertPS whose requested
slots are already served. Since higher service classes typically have higher Rmax
values, we take the Rmax as the weight for proportion. However, only referring to
Rmax may cause bandwidth waste or starvation of some queues. An example for the
former case is a high class queue having a BRQ very close to Rmin . The additional
number of slots assigned will be excessive because of the large Rmax , leading to
unnecessary bandwidth waste. Similarly, a low class queue yet having a BRQ close
to Rmax may not get enough feed. We use an adjustment factor,
B R Q − Rmin
Rmax − Rmin
24
Y.-N. Lin et al.
referred to as the A-Factor, for the Rmax of each queue to fix this problem so that a
high class queue requiring less bandwidth (BRQ) will be reflected and offset while
a low class queue demanding much will be compensated. The remaining slots are
therefore allocated according to the following proportion
rt P S
nr t P S
BE
B R Q r t P S − Rmin
B R Q nr t P S − Rmin
B R Q B E − Rmin
rt P S
nr t P S
BE
Rmax
:
Rmax
:
Rmax
.
rt P S
nr t P S
BE
B
E
r
t
P
S
nr
t
P
S
Rmax − Rmin
Rmzx − Rmin
Rmax − Rmin
(2.3)
2.3.2.4 Per-SS Bandwidth Grant within Each Queue
The slots allocated to each queue are finally distributed to SSs in the fashion of
GPSS. Similar to the second phase, the minimum number of requested slots of
each SS is satisfied first. Nevertheless, the remaining slots of each queue are evenly
assigned to SSs since there is no priority among them.
2.3.2.5 Example
This section gives an example of the TPP, in which UR and DR are 60 and 40,
respectively. Suppose S is 26, then the separator should be moved toward left with
number of steps x = 3 according to Eq. (2.1), indicating 6x/3 = 6 slot columns for
uplink while (26−6x)/2 = 4 slot columns for downlink. If we use direct proportion,
however, the number of symbols for uplink is 26 × [60/(60 + 40)] ∼
= 16, in which
only 15 symbols are effective.
The uplink is adopted as an example for the second phase. Assuming 6 subchannels in a symbol, 6 × 6 = 36 slots are thus allocated to the uplink after the first
phase. Rmin , BRQ, and Rmax of the five service classes are as in Table 2.1. The
scheduler allocates the guaranteed minimum number of slots to each queue, and
later proportionate the remaining slots to queues of the lower three classes according
to Eq. (2.2) since the UGS and ertPS are already satisfied. As we can see in the table,
using Rmax as the weight without the A-Factor causes three slots to be unnecessarily
assigned to the rtPS.
Table 2.1 Parameters and allocation results of the second phase
Item
UGS
ertPS
rtPS
nrtPS
BE
Rmax
8
8
16
8
12
BRQ
8
8
6
8
12
Rmin
8
8
6
4
2
BRQ-Rmin
n/a
n/a
0
4
10
Rmax with A-Factor
n/a
n/a
0
2
6
Rmax without A-Factor
n/a
n/a
3
3
2
2
Dynamic Bandwidth Allocation
25
2.4 Simulation
Through OPNET simulation we evaluate the TPP algorithm, focusing on the bandwidth utilization and the differentiated guarantee among service classes.
2.4.1 Simulation Setup
We have made several modifications on the original DOCSIS module of OPNET to
adapt to the IEEE 802.16 requirements. The topology consists of one BS serving
20 SSs, and two remote stations including an FTP server and a voice endpoint.
Five service classes are supported and each class involves four SSs. The UL and
DL channel capacity is 10.24 Mbps and the frame duration is 5ms. All classes in
Figs. 2.4, 2.5 and 2.6 run voice applications with G.711 codec and 64Kbps bit rate.
The Rmax of rtPS, nrtPS and BE are 8, 6, and 4, respectively, while Rmin are 4, 2,
and 1, respectively.
2.4.2 Numerical Results
2.4.2.1 Subframe Allocation: Static vs. Dynamic
The first-phase of TPP is advantageous in utilizing the bandwidth when the load of
the uplink and downlink are different, as Fig. 2.3 proves. The FTP traffic load of the
downlink is three times of the uplink. In Fig. 2.3a the downlink utilization is bound
to 50% because of the static subframe allocation. However, by stealing the unused
uplink slot columns for the downlink, TPP improves the overall link utilization from
75 to 96%.
(b)
100
90
80
70
60
50
40
30
20
10
0
Total
0
10
Downlink
20
30
Uplink
40
50
Time (sec)
Bandwidth utilization (%)
Bandiwidth utilization (%)
(a)
60
70
80
100
90
80
70
60
50
40
30
20
10
0
Total
0
10
20
30
Downlink
40
50
Time (sec)
60
Uplink
70
80
Fig. 2.3 Bandwidth utilization: (a) static subframe allocation with UL:DL = 1:1; (b) dynamic
subframe allocation with UL:DL = 1:3
2.4.2.2 Effectiveness of the A-Factor
As introduced previously, the A-Factor helps avoid bandwidth waste by reflecting
the requested amount of classes. To understand the effectiveness, we compare it with
26
1.4
Rmax with A-Factor
Rmin
Rmax
BRQ
BRQ-Rmin
1.2
Grant Ratio.
Fig. 2.4 Effectiveness of the
A-Factor. Four schemes with
a simple weight such as Rmin ,
Rmax , BRQ, and BRQ-Rmin
are involved for comparison
Y.-N. Lin et al.
1
0.8
0.6
0.4
0.2
0
rtPS
nrtPS
BE
four schemes which simply use a weight such as Rmin , Rmax , BRQ, and BRQ–Rmin ,
for each class. A term named Grant Ratio is defined as the ratio of number of allocated slots to the number of requested ones. A grant ratio larger than 1 means that
the service class is allocated more than requested, resulting in bandwidth waste. As
presented in Fig. 2.4, the Grant Ratios of rtPS using Rmin , Rmax and BRQ are about
1.2, implying excessive allocations, while appropriate amounts are provided when
using the A-Factor and BRQ–Rmin . The nrtPS using Rmax with A-Factor obtains
more slots than those in other schemes. In BE, though the one using BRQ–Rmin has
the highest Grant Ratio, this scheme is not feasible because it tends to favor classes
with a small Rmin which oftentimes is BE, and therefore violates the spirit of service
differentiation.
Service Differentiation — Figure 2.5a displays the number of granted and minimally reserved slots, respectively, as well as the average delay for each class under
different numbers of SSs. As we can see in the figure, the UGS and ertPS sustain the number of reserved slots even when the number of SSs advances 60. For
other classes, the system guarantees the differentiated Rmin , namely 4:2:1, until the
number of SSs exceeds 50. For the average delay depicted in Fig. 2.5b, only minor
difference is observed among classes initially until the number of SSs reaches 40,
rather than 50. This is because not enough additional slots can be allocated but only
the minimum requirement is satisfied. Again, the delay of the UGS and ertPS are
always kept under 10 ms.
Performance — The performance of TPP is compared with the Deficit Fair Priority Queue (DFPQ) and Strict Priority (SP) in terms of bandwidth utilization, as
depicted in Fig. 2.6a. From the figure we can learn that the bandwidth utilizations
of the three algorithms increase linearly but start to decrease when hitting a certain
level: 85.5% for TPP, 80.6% for DFPQ and 68.4% for SP. The reason why they are
not fully utilized is explored by looking into the average frame occupation of service
classes, as presented in Fig. 2.6b. Each class has an unused portion, which occurs
during the translation from requested bytes to slots. Since the calculation, namely
dividing the requested bytes by slot size, always rounds up, the resulted assignment
is often larger than expected.
As an example shown in Fig. 2.6c, assuming that a slot contains 64 bytes, which
is one of the supported sizes, and the amount requested by service flow (SF) #1 is
213 bytes, the number of requested slots is thus four, causing a 256 − 213 = 43
Dynamic Bandwidth Allocation
Fig. 2.5 Service
differentiation: (a) the
variation of minimally
reserved slots and granted
slots of each request under
each class; (b) average delay
between service classes. To
make the differences
recognizable, in (a) the
numbers of allocated slots per
request for (rtPS-total,
nrtPS-total, BE), which is
(47.2, 52.7, 53.7) for 10 SSs
and (22.8, 23,2, 21,7) for 20
SSs are omitted
27
UGS
nrtPS-min
nrtPS-total
(a)
Number of allocated slots
per request
2
ertPS
BE-min
BE-total
rtPS-min
rtPS-total
10
8
6
4
2
0
10
20
30
40
Number of SSs
50
60
(b)
Average delay (ms)
10000
UGS
ertPS
rtPS
nrtPS
BE
1000
100
10
1
10
20
30
40
Number of SSs
50
60
bytes waste. However, TPP alleviates this effect by reserving minimum required
slots first, rather than paying up all requested slots at once for an SF.
Take Fig. 2.6c for instance and assume that the number of available slots is nine
and the MRTR of each SF is three, TPP breadth-firstly allocates every SF three slots
which are slightly insufficient whereas the allocated slots are not wasted; nonetheless, the DFPQ depth-firstly tries to satisfy all SFs’ requested slots but results in
the waste for the first two SFs and the starvation of the third which has the lowest
priority. The SP has a largest waste also because of its static allocation. Besides, the
UGS contributes to the relatively more amount of unused portion than other classes,
revealing the drawback of unnecessary slot reservation. Finally, aside the high efficiency in bandwidth consumption, TPP is advantageous in service differentiation.
As depicted in Fig. 2.6b, the ratio of allocated bandwidth for rtPS, nrtPS and BE is
very close to 4:2:1, compared to other two algorithms.
2.5 Conclusions and Future Work
This work considers the problem of bandwidth allocation for 802.16 in order to
well utilize the precious wireless link and to support service differentiation. Among
others, an allocation scheme called TPP is presented. The uplink and downlink
Y.-N. Lin et al.
Bandwidth utilization (%)
28
100
90
80
70
60
50
40
30
20
10
0
TPP
DFPQ
SP
5
10
15
(a)
20 25 30 35
Number of SSs
40
45
50
Frame occupation (%)
35
UGS
ertPS
rtPS
nrtPS
BE
unused
30
25
20
15
10
5
0
(b)
TPP
DFPQ
Unused
SP
213 bytes
4 slots
256 bytes
SF1
SF1
Requested
64 bytes
per slot
Allocated
Allocated
but unused
Requested
(c)
SF1
SF2
SF3
TPP
SF1
SF2
DFPQ
SF3
SF1
SF2
SF3
Fig. 2.6 Performance comparison with SP and DFPQ: (a) bandwidth utilization; (b) frame occupation under three schemes with 48 SSs; (c) example of allocations by TPP and DFPQ, in which
number of slots to be allocated to three service flows is 9
bandwidth allocations are considered at the same time so that the allocation can
be dynamically adjusted. Simulation results confirm that bandwidth utilization increases 20% by applying the first phase proportionating; differentiation among
classes is appropriately achieved in the second phase.
2
Dynamic Bandwidth Allocation
29
Though service differentiation is carried out in BS, the SSs should also be capable of providing similar support in order to meet the QoS requirement of various
applications. Therefore, the future work will be focusing on designing a sophisticated allocation algorithm for the SS to manipulate the per-SS grant. The ultimate
target will be implementing both algorithms in real BSs and SSs for performance
validation.
References
1. IEEE 802.16 Working Group, “Air Interface for Fixed and Mobile Broadband Wireless Access
Systems – Amendment for Physical and Medium Access Control Layers for Combined Fixed
and Mobile Operation in Licensed Bands,” Feb. 2006.
2. G. Nair et al., “IEEE 802.16 Medium Access Control and Service Provisioning,” Intel Technology Journal, Vol 8, Issue 3, Aug. 2004.
3. IEEE 802.16 Working Group, “Air Interface for Fixed Broadband Wireless Access Systems,”
Oct. 2004.
4. IEEE 802.11 Working Group, “Wireless LAN Medium Access Control (MAC) and Physical
Layer (PHY) Specifications,” Sep. 1999.
5. Cable Television Laboratories Inc., “Data-Over-Cable Service Interface Specifications - Radio
Frequency Interface Specification v1.1,” July 1999.
6. W. M. Yin, C. J. Wu and Y. D. Lin, “Two-phase Minislot Scheduling Algorithm for HFC QoS
Services Provisioning,” GLOBECOM, Nov. 2001.
7. M. Hawa and D. W. Petr, “Quality of Service Scheduling in Cable and Broadband Wireless
Access Systems,” IWQoS, May 2002.
8. G. S. Chu, D. Wang and S. Mei, “A QoS Architecture for the MAC Protocol of IEEE 802.16
BWA System,” Communications, Circuits and Systems and West Sino Expositions, IEEE, July
2002.
9. K. Wongthavarawat and A. Ganz, “IEEE 802.16 Based Last Mile Broadband Wireless Military
Networks with Quality of Service Support,” MILCOM, Oct. 2003.
10. J. Chen, W. Jiao and H. Wang, “A Service Flow Management Strategy for IEEE802.16 Broadband Wireless Access Systems in TDD Mode,” ICC, May 2005.
11. S. Maheshwari, S. lyer and K. Paul, “An Efficient QoS Scheduling Architecture for IEEE
802.16 Wireless MANs,” Asian International Mobile Computing Conference, Jan. 2006.
Chapter 3
A Downlink MAC Frame Allocation
Framework in IEEE 802.16e OFDMA:
Design and Performance Evaluation
Andrea Bacioccola, Claudio Cicconetti, Alessandro Erta, Luciano Lenzini,
Enzo Mingozzi and Jani Moilanen
Abstract The IEEE 802.16e standard specifies a connection-oriented centralized
Medium Access Control (MAC) protocol, based on Time Division Multiple Access
(TDMA), which adds mobility support defined by the IEEE 802.16 standard for
fixed broadband wireless access. To this end, Orthogonal Frequency Division Multiple Access (OFDMA) is specified as the air interface. In OFDMA, the MAC frame
extends over two dimensions: time, in units of OFDMA symbols, and frequency, in
units of logical sub-channels. The Base Station (BS) is responsible for allocating
data into the frames so as to meet the Quality of Service (QoS) guarantees of the
Mobile Stations’ (MSs) admitted connections. This is done on a frame-by-frame
basis by defining the content of map messages, which advertise the position and
shape of data regions reserved for transmission to/from MSs. We refer to the process
of defining the content of map messages as frame allocation. Through a detailed
analysis of the standard, we show that the latter is an overly complex task. We then
propose a modular framework to solve the frame allocation problem, which decouples the constraints of data region allocation into the MAC frame, i.e. the definition
of the position and shape of the data regions according to a set of scheduled grants,
from the QoS requirements of connections. Allocation is carried out by means of
the Sample Data Region Allocation algorithm (SDRA), which also supports Hybrid
Automatic Repeat Request (H-ARQ), an optional feature of IEEE 802.16e. Finally,
we evaluate the effectiveness of SDRA by means of Monte Carlo analysis in several
scenarios, involving mixed Voice over IP (VoIP) and Best Effort (BE) MSs with
varied modulations, with different sub-carrier permutations and frequency re-use
plans.
Keywords IEEE 802.16 · Medium access control protocols · Resource allocation
E. Mingozzi (B)
Dipartimento di Ingegneria dell’Informazione, University of Pisa, Italy
e-mail: e.mingozzi@iet.unipi.it
M. Ma (ed.), Current Technology Developments of WiMax Systems,
C Springer Science+Business Media B.V. 2009
DOI 10.1007/978-1-4020-9300-5 3,
31
32
A. Bacioccola et al.
3.1 Introduction
During the last few years, we have witnessed a daunting increase of the use of
electronic communication devices in everyday life. This is due to the spread of
sophisticated handheld equipments, such as mobile phones and palmtops, which
are available at an increasingly lower cost. This has boosted a technology advance
in the area of mobile Broadband Wireless Access (BWA), since these devices, by
necessity, cannot rely on the use of wired connections. A by-product of these two
factors is that people are becoming more and more accustomed to portable communication devices, which, in turn, produces unforeseen needs and requirements.
For instance, the well-known GSM technology, primarily targeted at traditional
voice applications, has recently moved towards the GPRS/EDGE architectures for
packet-based data transmission. Packet access is also implemented for multimedia services in UMTS, by means of High-Speed Downlink/Uplink Packet Access
(HSDPA/HSUPA), in addition to the legacy code-division multiple access (CDMA)
based circuit-switched mode.
In the context of mobile BWA, a novel standard has been published recently by
the IEEE, namely IEEE 802.16e [1], which extends the 2004 version of IEEE 802.16
for fixed BWA [2,3], so that high transmission efficiency for mobile users is coupled
with Quality of Service (QoS) support to enable multimedia services. A non-profit
association, the Worldwide Interoperability for Microwave Access (WiMax) forum,
was formed to define the specifications for compatibility and interoperability of
the IEEE 802.16 wireless equipments. According to the WiMax forum, Orthogonal
Frequency Division Multiple Access (OFDMA) is the target air interface for mobile
BWA with IEEE 802.16e. In fact, OFDMA has been shown to provide mobile users
with an improved resilience against multi-path fading in non-line-of-sight environments, with respect to alternative technologies, like FDM/TDM and CDMA, which
are used in competing mobile wireless standards, respectively GPRS, EDGE, and
UMTS [4]. Furthermore, a multiple access technique based on OFDMA has been
proposed by the 3GPP consortium as the downlink air interface in the context of the
Long Term Evolution (LTE) project, which is an ongoing effort to lead the current
UMTS standard towards 4G wireless technologies [5].
An IEEE 802.16e cell consists of a number of Mobile Stations (MSs) served by
a Base Station (BS), which controls the access to the wireless medium in a centralized manner. Before transmitting to/receiving from the BS, any MS must request
the admission of a new connection. If the connection is accepted, the BS is then
responsible for meeting the requested QoS guarantees. The access to the medium
is scheduled on a frame basis. MAC frames extend over two dimensions: time, in
units of OFDMA symbols, and frequency, in units of logical sub-channels [4]. Data
packets are thus conveyed into bi-dimensional (i.e. time and frequency) data regions,
which are advertised by the BS via specific in-band control messages, which share
the same resources as data. In the following, the process of defining the content of
maps is referred to as frame allocation, which is left unspecified by the standard.
Since the frame allocation problem is a complex task, which can significantly
impact on the overall performance of the system, we propose a modular framework
3
A Downlink MAC Frame Allocation Framework
33
based on a pipeline approach. Specifically, our framework decouples the process of
scheduling data to the admitted connections from the activity of allocating the data
regions into the MAC frames. The SDRA algorithm is then provided as a simple
solution to the latter, i.e. allocation, which does not depend on the specific scheduling algorithms adopted by the BS to meet the QoS requirements of the admitted
connections. SDRA has been originally proposed in [6] and is extended here to
support Hybrid Automatic Repeat Request (H-ARQ), which is an optional feature
of the IEEE 802.16e to enhance coverage and capacity in mobile applications. An
extensive analysis of the proposed algorithm is carried out through Monte Carlo
analysis to evaluate its performance under varied system configurations.
3.2 IEEE 802.16e
The IEEE 802.16e MAC protocol is connection-oriented and explicitly supports
QoS by defining five different QoS scheduling services: namely, Unsolicited Grant
Service (UGS), real-time Polling Service (rtPS), extended real-time Polling Service
(ertPS), non real-time Polling Service (nrtPS), and Best Effort (BE). Each scheduling service is designed to support a specific class of applications and is therefore
characterized by a different set of QoS requirements (see [7] for further details).
Connections are uni-directional, i.e. either uplink or downlink, while MSs can establish multiple connections with the BS. MAC Service Data Units (SDUs), which
are used to convey data from the upper layers, e.g. Internet Protocol version 4 (IPv4)
datagrams or Ethernet frames, are encapsulated into MAC Protocol Data Units
(PDUs), which are then transmitted to the peer MAC layer through the physical
layer. Furthermore, time is partitioned into frames of fixed duration, which are, in
turn, divided into downlink and uplink sub-frames1 . The former is used by the BS to
transmit data to the MSs, whereas the MSs transmit to the BS in the latter. Fig. 3.1
reports the frame structure in case of Time Division Duplex (TDD).
OFDMA is a multiplexing technique for Non-Line-of-Sight (NLOS) operations
which subdivides the bandwidth into multiple frequency sub-carriers then grouped
into subsets, called sub-channels [8, 9]. The IEEE 802.16e standard specifies a few
sub-carrier permutations, i.e. the mapping of logical sub-channels onto physical subcarriers. Different mappings are tailored to different transmission environments and
user characteristics, as described in [10]. Two sub-carrier permutations are mandatory for downlink transmission: Partial Usage of Sub-channels (PUSC) and Full Usage of Sub-channels (FUSC). For uplink transmission, PUSC is the only mandatory
sub-carrier permutation. A zone is a portion of the frame in which one of the above
sub-carrier permutations is applied. As shown in Fig. 3.1, multiple zones within
the same downlink or uplink sub-frame, employing different sub-channels mapping
schemes, may exist.
1 Frame partition into sub-frames can occur both in the time domain, i.e. TDD, and in the frequency
domain, i.e. FDD. The latter is supported by the standard, but TDD is the option currently deployed
in the first mobile WiMax releases.
34
A. Bacioccola et al.
Fig. 3.1 IEEE 802.16e OFDMA sample TDD frame structure. The number of OFDMA symbols
and sub-channels reported in the figure are not realistic
With a slight abuse of notation, we can consider a frame as a matrix where rows
and columns are sub-channels and OFDMA symbols, respectively (see Fig. 3.1).
The number of OFDMA symbols and sub-channels per frame depends on the frame
duration, the channel bandwidth, the Fast Fourier Transform (FFT) size, the Cyclic
Prefix length, the direction, and the sub-carrier permutation. In any case, the minimum resource allocation unit is the OFDMA slot (hereafter slot) and consists of
one or more sub-channels by one or more OFDMA symbols. With regard to the
mandatory sub-carrier permutations, a downlink PUSC slot is two OFDMA symbols by one sub-channel large, a downlink FUSC slot is one OFDMA symbol by
two sub-channels large, and an uplink PUSC slot is three OFDMA symbols by one
sub-channel large.
Furthermore, the standard specifies several Modulation and Coding Schemes
(MCSs) which can be used by the BS and MSs to adapt the transmission rate to
the channel conditions. Therefore, while the dimensions of a slot are determined by
the physical layer parameters and sub-carrier permutation only, the amount of data
that can be conveyed into a single slot depends on the robustness of the MCS. The
more robust the MCS is, the less the number of data bytes per slot are. The set of
available MCSs, both for uplink and downlink transmission, is advertised by the BS
on a regular basis through dedicated control messages, called Downlink Channel
Descriptor (DCD) and Uplink Channel Descriptor (UCD).
As illustrated in Fig. 3.1, the downlink sub-frame begins with a physical preamble needed by the MSs for synchronization and channel quality estimation. The
preamble, which consists of a known sequence of modulated pilots, lasts one
OFDMA symbol in the time domain and covers all the available sub-channels in
the frequency domain. After the preamble, the BS transmits the Frame Control
Header (FCH), which defines the structure of the first downlink PUSC zone and the
length in slots of the downlink map (DL-MAP) message. The DL-MAP message
3
A Downlink MAC Frame Allocation Framework
35
is thus allocated within the downlink sub-frame in column-wise order from the end
of the FCH. If the DL-MAP exceeds the number of rows in a column, the allocation continues from the beginning of the next column. The remaining part of the
downlink sub-frame is allocated as a number of data regions, which consist of twodimensional portions of the downlink sub-frame formed by a group of contiguous
logical sub-channels in a group of contiguous OFDMA symbols. A data region may
be visualized as a rectangle of OFDMA slots as shown in Fig. 3.1, and cannot span
over two zones. However, MAC SDUs can be fragmented into many MAC PDUs,
which in turn can be conveyed in different data regions2 . In other words, data that
are intended to be conveyed in a data region can actually span over multiple data
regions, provided that the appropriate slot boundaries are taken into account. If the
size of the MAC PDUs of a data region is not a multiple of the number of bytes
contained in the data region slots, the remaining portion is padded with stuff bytes.
The size of each data region and its coordinates, with respect to the upper-left corner
of the downlink sub-frame, depend on the frame allocation process and are specified
by the BS in the downlink map (DL-MAP) message, which is advertised at the
beginning of the downlink sub-frame in a PUSC zone. The standard allows that data
directed to MSs employing the same MCS can be grouped into a single data region
to reduce the overhead. In fact, each data region is specified through an Information
Element (IE) into the DL-MAP, which can optionally include the list of connections
to which the data region is addressed, namely the data region recipients.
With regard to the uplink direction, MSs access the medium in accordance with
the uplink data regions advertised by the BS. Unlike downlink, uplink data regions
are explicitly defined by the standard as a number of contiguous slots, starting from
the upper-left corner of the uplink sub-frame, allocated in row-wise order as shown
in Fig. 3.1. The end of each uplink data region is the beginning of the next one. Like
downlink, each uplink data region incurs the overhead of one IE in the uplink map
(UL-MAP) message. The latter is transmitted by the BS in the PUSC zone of the
downlink sub-frame.
In the following we call maps the DL-MAP and UL-MAP messages. Since maps
have to be decoded by all the MSs in the cell, the BS must employ the most robust
MCS among those currently in use by the MSs. Therefore, even though the number
of bits required to encode a single IE is rather limited, the total amount of overhead,
in slots, required for the transmission of maps can be significant.
To increase the range and robustness of data transmission, the IEEE 802.16e standard specifies several advanced techniques. For instance, H-ARQ can be enabled on
a per-connection basis for fast recovering from channel errors at an intermediate
level between the MAC and physical layers [10]. A H-ARQ data region consists of
a set of H-ARQ sub-bursts, each containing one or more MAC PDUs followed by
a Cyclic Redundancy Check (CRC). The latter is used by the recipient to determine
2
This is only true provided that variable-length fragmentation of MAC SDUs into multiple MAC
PDUs is allowed. While the latter is an optional feature of the IEEE 802.16 MAC, it can be effectively employed to reduce the MAC overhead due to padding the unused portion of data regions,
and is thus specified as a mandatory feature by the WiMax compliance datasheets.
36
A. Bacioccola et al.
whether the MAC PDUs have been received correctly, in which case it sends a
positive indication to the sender. Otherwise, the H-ARQ sub-burst is retransmitted, employing the same MCS, until either it is received correctly or the maximum
number of retransmissions is exceeded. Unlike classical ARQ schemes employed at
the MAC layer of wireless MAC protocols (e.g. IEEE 802.11), the H-ARQ recipient
keeps a copy of all the failed transmissions, and it combines them together to infer
the correct sequence of bytes transmitted. Furthermore, acknowledgments of the
correct/incorrect reception of the H-ARQ sub-bursts are sent via a dedicated logical
channel in the MAC frame, which ensures fast convergence of the H-ARQ process,
and hence low transmission latencies.
From the frame allocation point of view, H-ARQ adds to major changes with
respect to non-H-ARQ data transmissions. First, H-ARQ sub-bursts must be transmitted as a whole, that is, they cannot span over two data regions. Second, in the
downlink direction only, H-ARQ sub-bursts that are addressed to MSs with different MCSs can be packed into a single downlink H-ARQ data region. In fact, each
H-ARQ downlink data region is advertised in the DL-MAP by means of a specific
IE, which specifies the starting point (top-left corner), width (number of OFDMA
symbols), height (number of logical sub-channels), and number of H-ARQ subbursts. Each H-ARQ sub-burst is then advertised within the downlink H-ARQ data
region IE by means of the length (in number of slots), the MCS, and the recipient.
3.3 OFDMA Frame Allocation
An IEEE 802.16e BS is in charge of allocating capacity in both downlink and uplink,
by advertising maps on a frame-by-frame basis. We call this process frame allocation. Since the IEEE 802.16e standard specifies neither a mandatory nor a reference
algorithm to perform such task, it is assumed to be manufacturer-specific. However,
the standard specifications impose a number of constraints and/or requirements on
the candidate algorithm to be implemented, which makes its definition an extremely
complex task.
More specifically, three main issues may be identified as follows. First, the BS
has to ensure that admitted connections are provided with the negotiated QoS guarantees [7]. MAC frame allocation could significantly impact the QoS of a given
connection. Therefore, the issue of determining which MSs are granted capacity in
the next frame, and how many bytes they are allowed to transmit or receive, must
be based on the QoS requirements of every admitted connection.
Second, the capacity available for data transmission in a frame cannot be granted
arbitrarily, but rather it must obey to a number of constraints derived straightforwardly from the standard specification of the OFDMA MAC frame structure. In
fact, grants must be organized into a set of data regions in order to transmit (receive) data to (from) the scheduled MSs. Furthermore, downlink data regions must
have rectangular shape and must be allocated in the sub-frame without overlapping
with each other and without spanning over multiple zones. Finally, use of H-ARQ
introduces an additional constraint to data regions, in that they cannot be split into
3
A Downlink MAC Frame Allocation Framework
37
smaller data regions. It is easy to see that to satisfy all these constraints is a very
challenging task. Note that, although in principle one could think of granting capacity on a slot-by-slot basis, this immediately proves to be unfeasible in practice in an
IEEE 802.16 OFDMA system, due to the unbearable cost in terms of the resulting
map overhead.
Third, signaling in IEEE 802.16 is in-band, i.e. the overall capacity of the downlink sub-frame is shared between control messages, including maps, and data messages, i.e. MAC PDUs transporting user data. As mentioned above, each downlink
(uplink) data region is advertised by a different IE in the DL-MAP (UL-MAP).
Therefore, when performing frame allocation, one desirable objective would be
that of minimizing the MAC control overhead (map overhead hereafter) so as to
maximize the capacity available to users.
The complexity of the frame allocation task comes from the fact that the above
mentioned issues are often in contrast one to each other. On the one hand, to satisfy
the QoS constraints that a given user may require, e.g. real-time traffic with strict
deadlines, the BS may be forced to grant bandwidth to any MS in certain frames.
Yet, should each MS receive a small amount of capacity in every frame, for the
sake of service timeliness, this would very likely cause an unacceptable loss of
capacity due to the map overhead. On the other hand, one could follow the simplistic approach of scheduling only one MS per sub-frame, which minimizes the map
overhead. However, this would lead to an increased latency between two consecutive
capacity grants to the same MS. While such an approach would be fairly acceptable
for elastic best-effort applications, such as File Transfer Protocol (FTP), it is very
unlikely to fit the maximum delay requirements of real-time interactive applications
envisaged for IEEE 802.16 networks, such as Voice over IP (VoIP). Finally, given
a number of PDUs to be transmitted in a given sub-frame, not all their possible
arrangements into a set of data regions are equivalent from the point of view of
the corresponding map overhead, thus calling for data region arrangement strategies
which aim at minimizing the map overhead. Matters are further complicated by the
fact that a data region arrangement which would minimize the map overhead can
possibly entail no feasible frame allocations complying with the frame structure
constraints.
3.3.1 A Modular Framework
In order to tackle the complexity of the frame allocation problem, a general framework can be assumed, which is based on a pipeline approach: each of the above
issues is basically solved independently of each other, i.e. forcing when necessary
the breaking of mutual dependencies, and the corresponding solutions are then combined in sequence in order to provide the final allocation.3
3 A similar approach has been followed in [18], where frame allocation constraints came from
the Subscriber Stations being half-duplex transmission capable only, while the system works in
Frequency Division Duplex mode.
38
A. Bacioccola et al.
In particular, we envisage the frame allocation task as being split into three separate and sequential sub-tasks, namely grant scheduling, data region arrangement,
and data region allocation. The grant scheduling sub-task takes as input the connections’ QoS requirements, their current traffic load and the available frame capacity,
and determines how many MAC PDUs must be transmitted to each MS to satisfy the
requirements of its admitted connections. Provided that a given MCS is associated
to each MS, this turns into an amount of capacity, in slots, to be granted to each
MS, irrespective of its assignment to a specific data region and frequency and time
domain allocation in the MAC frame. The data region arrangement sub-task takes
as input the output of the grant scheduling sub-task, and arranges the selected grants
into different groups according to specific arrangement strategies, which aim at, e.g.,
minimizing the map overhead or providing better service in terms of packet delay
to the MS. Such groups are tentatively targeted to being mapped one-to-one to as
many data regions to be allocated in the frame. These data regions are then fed to the
last sub-task, i.e. data region allocation, which is responsible for defining the final
contents of maps, possibly re-arranging data regions to fit them into the OFDMA
frequency and time domains, and re-sizing scheduled grants to make the allocation feasible. So far we have not distinguished between uplink and downlink in our
discussion. However, in the uplink sub-frame, the IEEE 802.16e standard explicitly
defines the procedures for the data region arrangement and the data region allocation sub-tasks, whereas grant scheduling is left up to manufacturers. Conversely, in
the downlink sub-frame, all the three sub-tasks are left unspecified. Therefore, in
the following, we will mainly refer to the downlink sub-frame allocation procedure
unless otherwise specified.
A schematic representation of the modular framework with a numerical example
is reported in Fig. 3.2. Grant scheduling selects a list of MSs and a number of slots
for each MS that will be transmitted in the forthcoming downlink sub-frame. The
data region arrangement module groups the list of grants into a set of data regions,
according to a data region arrangement strategy (described in Section 3.3.2). In the
example, we assume that data addressed to the MSs employing the same MCSs are
grouped together so as to form a single data region (e.g. grants addressed to MS
1 and MS 8 are grouped together into a data region with area equal to 30 slots).
Finally, the data region allocation module is in charge of defining the final layout
Fig. 3.2 Modular pipelined approach
3
A Downlink MAC Frame Allocation Framework
39
of the downlink sub-frame. Note that, in the example of Fig. 3.2, the data region
allocation module is not able to allocate all the data regions as they are received from
the data region arrangement module. Thus, the area of data region 4 is allocated into
two distinct data regions.
It is evident that such a modular approach may result in sub-optimal solutions,
even though the optimal solution to each sub-problem is found, because constraints
are considered separately. However, we argue that it has substantial advantages,
which are outlined in the following. On the one hand, with this approach, QoS provisioning only depends on the algorithm which is implemented by the grant scheduling sub-task. Therefore, the task of scheduling bandwidth for QoS support can be
confined to a well-identified functional sub-module, and is naturally abstracted from
the details originating from grant allocation within the MAC frame. On the other
hand, such isolation allows for implementing scheduling algorithms as a result of
simple adaptation of well-known algorithms already proposed for wired networks,
where this discipline has been extensively studied [11–13].
Assuming that the available literature on scheduling algorithms is able to provide
adequate solutions to the issue of supporting QoS, we dedicate the next two subsections to discuss in detail those issues which are more specific to IEEE 802.16e,
i.e. the data region arrangement and allocation sub-tasks, respectively.
3.3.2 Data Region Arrangement
As mentioned above, different data region arrangement strategies, both in downlink and uplink sub-frames, may impact differently on the MAC control overhead.
Since the control signaling is in-band, reducing the size of maps is beneficial as it
allows more data to be conveyed into the same downlink sub-frame, thus possibly
increasing the overall throughput while preserving QoS guarantees. We investigate
separately how the different data region arrangement strategies affect the MAC control overhead in the downlink and the uplink sub-frame, respectively. We focus on
the downlink direction first.
IEEE 802.16e provides standard mechanisms for the purpose of reducing the
DL-MAP overhead. First, data addressed to MSs with the same MCS can be packed
into a single data region. In fact, as mentioned in Section 3.2, for each IE, the BS is
allowed to omit the list of MSs to which the PDUs are addressed, provided that the
latter are all transmitted with the same MCS. While this may result in a considerable
reduction of the DL-MAP size, it has the drawback that each MS is forced to decode
all data regions transmitted with its own MCS4 , due to the lack of information with
regard to the actual receivers of the data contained into the data region. Therefore,
on average, an MS incurs greater energy consumption than needed. This might be a
problem especially with mobile terminals, due to their limited energy capabilities.
4 Note that this does not violate the security functions of the IEEE 802.16 to ensure privacy of
data transmitted over-the-air, since the payload of MAC PDUs can be encrypted so that only the
intended recipient is able to retrieve the original data sent by the BS.
40
A. Bacioccola et al.
On the other hand, energy wastage can be mitigated by explicitly specifying the
lists of data region recipients in the IEs, which reduces the chance that an MS unnecessarily decodes the data region, at the cost of increasing the overall map overhead.
In fact, in this case, an MS only decodes those data regions actually containing data
addressed to it. However, an MS can still incur some energy wastage, due to the fact
that a data region may also convey data addressed to other MSs with the same MCS.
Yet, having exactly one MS for each data region completely avoids waste of energy,
though at the cost of the highest overhead.
To evaluate the relevance of such overhead, we define the DL-MAP size theoretical lower bound (TLB), with respect to a set of data regions, as the size of the
minimum DL-MAP needed to allocate them. Specifically, TLB is computed assuming that each data region never needs to be split. However, this assumption is in
general over-optimistic, since there might not be any feasible allocation of all data
regions without splitting one or more of them.
In Fig. 3.3 we show the DL-MAP overhead, in terms of the ratio between TLB
and the downlink sub-frame duration against the total number of MSs served in
the downlink and uplink sub-frames. We assume that each MS is provided with
one connection. Numerical results have been obtained with the following system
parameters: the frame duration is 10 ms with an FFT size of 1024 and a channel
bandwidth of 10 MHz; the downlink and uplink sub-frames consist of 28 and 18
OFDMA symbols, respectively; the number of sub-channels is 30; and MSs employ
four different MCSs. The curves reported in Fig. 3.3 are related to three different
strategies for the definition of the DL-MAP: (i) MSs are grouped per MCS without
Fig. 3.3 DL and UL map overhead
3
A Downlink MAC Frame Allocation Framework
41
specifying the list of the downlink data region recipients; (ii) same as (i), but the list
of the downlink data region recipients5 is specified; (iii) each MS is assigned to only
one downlink data region.
As shown in Fig. 3.3, with strategy (i) the overhead remains constant with the
number of MSs. In fact, the size of the DL-MAP does not depend on the number
of MSs served in the downlink sub-frame, but it only depends on the number of
different downlink MCSs currently used, i.e. four in this scenario. On the other
hand, strategy (iii) exhibits an increasing overhead with the number of MSs per
frame which severely affects the downlink sub-frame capacity by consuming 34%
of the sub-frame with 23 MSs. Intermediate results have been obtained with strategy
(ii), where the list of the downlink data region recipients is also advertised within
the IE relative to a specific MCS.
With regard to the uplink direction, the IEEE 802.16e standard explicitly requires
the BS to add an IE to the UL-MAP for each MS served in the uplink sub-frame,
regardless of the MCS of the MS. In other words, the UL-MAP size only depends
on the number of MSs served in the uplink sub-frame. Therefore, unlike downlink, the BS cannot count on any mechanism of the standard to reduce the control
messages overhead. Note that the UL-MAP overhead affects the capacity available
for transmission in the downlink sub-frame, although it depends on the number of
MSs served in the uplink sub-frame. For the sake of completeness, we also reported
the UL-MAP overhead in Fig. 3.3, which confirms that the UL-MAP overhead increases linearly with the number of MSs due to the presence of one IE for each MS.
We stress the fact that the frame allocation procedure of the uplink sub-frame is
explicitly defined by the standard. Therefore, the UL-MAP curve only depends on
the number of MSs actually scheduled to transmit data in the uplink sub-frame since
no data region arrangements are permitted, except that specified by the standard.
We can conclude that, in an IEEE 802.16e system, the overhead due to maps
can significantly reduce the capacity available for transmitting data. This problem
can be mitigated by employing a data region arrangement strategy which limits the
number of IEs to be advertised.
3.3.3 Downlink Data Region Allocation
We now describe the downlink data region allocation sub-task, which consists of
selecting both the shape, i.e. width and height, and the position, i.e. the OFDMA
symbol and sub-channel offsets, of each data region. These two problems are discussed separately.
With regard to data region shaping, in general, there are several ways to shape
the same number of scheduled slots into a data region. For example, assume that
the BS has to transmit eight slots of data to an MS. If only one data region is used,
5 Note that since we assume that each MS has only one connection, the number of the data region
recipients is equal to the number of MSs per frame.
42
A. Bacioccola et al.
there are four shapes available: 2×4, 4×2, 1×8 or 8×1. Still, it is possible for the
BS to employ multiple data regions, e.g. two data regions of four slots each. Finally,
the BS can inflate the data regions so that more than eight slots are used, e.g. a
single 3 × 3 data region, in which case part of the inflated data regions remains
empty. However, not all alternatives are equivalent, since the MAC overhead varies
depending on the fragmentation of MAC PDUs over various data regions, and the
padding of slots that are not completely used for user data.
As far as positioning of data regions is concerned, this problem can be viewed as
a bi-dimensional bin packing problem, where a number of items (i.e. data regions)
with a specified width and height have to be packed into a fixed-size bin (i.e. the
downlink sub-frame). This problem is well known in the literature of operations
research and has been proved to be NP-hard [14]. Therefore it is not feasible to
implement exact methods at the BS, since positioning of data regions is a hard
real-time task, with a deadline comparable to the frame duration. Additionally, no
efficient heuristics to solve general bin packing problems are known. We thus argue
that simple, yet effective, heuristics should be envisaged, by taking into account the
inherent properties of IEEE 802.16. For instance, a joint approach between shaping and placing data regions might be employed, so that the shape of items to be
allocated is modified to broaden the space of solutions.
Furthermore, the use of H-ARQ introduces an additional constraint when shaping
data regions because H-ARQ data regions cannot be split at arbitrary boundaries.
For example, assume that the BS decides to split an H-ARQ data region consisting
of two H-ARQ sub-bursts each consisting of four slots into two data regions. The
only feasible configuration is {4, 4}, while {5, 3}, {6, 2}, {7, 1} are not allowed since
they would require H-ARQ sub-bursts to be fragmented.
3.3.3.1 A Sample Data Region Allocation Algorithm
In this section, we propose an algorithm, that we name Sample Data Region
Allocation (SDRA) algorithm, as a solution to the data region allocation problem.
According to our modular framework, SDRA works independently of the specific
grant scheduling algorithm and the data region arrangement strategy adopted. Without loss of generality, we describe our algorithm in the case where data addressed to
MSs which employ a common MCS are grouped into a single data region (strategy
(i) in Section 3.3.2). The SDRA algorithm is then extended to support H-ARQ as
described at the end of this section. The performance of SDRA is assessed by means
of Monte Carlo analysis in Section 3.4.
For the ease of readability, we describe the SDRA algorithm in the case of data
transmitted in the FUSC zone only. Since the IEEE 802.16e standard specifies that
the DL-MAP is always transmitted in the PUSC zone, the slots that lie “below” it,
if any, are left unallocated. The extension to the more general case of combined
allocation of data into the PUSC and FUSC zones is straightforward. Likewise, we
omit the procedure to allocate the UL-MAP, which must be transmitted as a single
data region in the PUSC zone, because its size does not depend on the process of
downlink data region allocation.
3
A Downlink MAC Frame Allocation Framework
43
In the following a slot is said to be allocated if the DL-MAP defines a data region
which covers it. More formally, slot (i, j) is allocated if there is at least one IE such
that x ≤ i ≤ x + w ∧ y ≤ j ≤ y + h, where x, y are the time, sub-channel
upper-left coordinates of the data region, respectively, and w, h are the width, height
data region dimensions, respectively. Note that an allocated slot might not contain
any data actually. Moreover, we define the number of slots in a row of the downlink
sub-frame as W; likewise, the number of slots in a column of the downlink subframe is H. Lastly, we assume without loss of generality that columns and rows are
numbered starting from 1.
SDRA is based on the following key concepts: (i) the order in which the data
regions are passed to SDRA is preserved when they are allocated into the downlink
sub-frame; (ii) allocation proceeds backwards in column-wise order, i.e. any slot
of column i is not allocated until all the slots of columns j, i + 1 < j ≤ W
are allocated. These design choices are motivated as follows. Because of (i) the
scheduler is free to decide the priority of the downlink MAC PDUs that have to be
transmitted, which can be exploited to assign to certain MAC PDUs a higher priority
than others. Examples of MAC PDUs which may need a higher priority than others
include: the UL-MAP (in the PUSC zone) and other MAC management messages;
data that have not been allocated in previous frames; data belonging to admitted
connections with strict QoS requirements, e.g. UGS connections. Additionally, a
(partially) opportunistic approach could also be devised, where MAC PDUs of MSs
enjoying higher transmission efficiency (i.e. less robust MCS) are more likely to
be placed than the others. The impact of this choice on the network utilization is
investigated in the performance analysis at the end of this section. Furthermore,
choice (ii) is motivated by the implementation concern that the DL-MAP grows in
column-wise order starting from the beginning of the downlink sub-frame, according to the standard specifications. Therefore, by letting data filling up the sub-frame
from the opposite direction, any grant needs only be allocated once and for all by
the allocation procedure, as described below.
We first describe the procedure to allocate a set of non-H-ARQ data regions,
which are called pending data regions, while those actually placed into the downlink
sub-frame are called allocated data regions. The procedure for H-ARQ data regions
is described afterwards. Note that these procedures are described separately for the
clarity of illustration, but they can be seamlessly integrated into a single allocation
procedure to jointly allocate both non-H-ARQ and H-ARQ data regions.
As already discussed in Section 3.2, we assume that any non-H-ARQ data region
can be split into smaller data regions arbitrarily, though at slot boundaries. Thus,
since data regions are allocated in column-wise order, each data region can be split
at most into three smaller data regions. The scheduler, thus, must overprovision the
amount of slots requested for each data region so as to include the MAC overhead
due to (up to) two fragmented MAC SDUs. However, the quantitative impact on the
network utilization is negligible. An example of the resulting allocation of four data
regions, labeled A, B, C, and D, is depicted in Fig. 3.4.
As can be seen, the four data regions input produces eight data regions: A is split
into two data regions, C into three, D into two, while B is allocated as a whole. Under
44
A. Bacioccola et al.
Fig. 3.4 Example of
non-H-ARQ allocation via
SDRA, with FUSC
the assumption of employing FUSC as the sub-carrier permutation, no more data
can be allocated into the downlink sub-frame, because the free room that lies below
the DL-MAP (column 3 in Fig. 3.4) cannot be exploited. The detailed allocation
procedure is described by means of the pseudo-code in Appendix A of this paper.
With H-ARQ, the allocation procedure described above is modified according to
the fact that H-ARQ data regions can only be split at H-ARQ sub-bursts boundaries.
To achieve this, each data region is always allocated as a rectangle with height equal
to the number of rows available. The number of columns is then set to the minimum
value such that the sum of the sizes of all the H-ARQ sub-bursts contained into the
data region is smaller than or equal to the data region size. This way, up to H – 1
slots can remain unused in each data region. A sample allocation of three H-ARQ
data regions, A with three sub-bursts, and B and C with two sub-bursts, is depicted
in Fig. 3.5.
Fig. 3.5 Example of H-ARQ
allocation via SDRA
3
A Downlink MAC Frame Allocation Framework
45
There is a major difference between the non-H-ARQ and the H-ARQ versions
of SDRA. With H-ARQ, each input data region produces at most one allocated data
region, while non-H-ARQ data regions can be split into up to three data regions.
However, the latter can always be allocated provided that there is free room in the
downlink sub-frame left by the DL-MAP. On the other hand, a H-ARQ data region
can contain a sub-burst that does not fit into the remaining space, and thus needs
to remain unallocated, while some sub-bursts of other H-ARQ data regions may
be successfully allocated. Therefore, the allocation procedure with H-ARQ must
proceed even when one or more sub-bursts are discarded, which is never the case
with non-H-ARQ. The detailed allocation procedure is described by means of the
pseudo-code in Appendix A of this paper.
3.4 Performance Evaluation
The performance evaluation is carried out by means of Monte Carlo analysis.
Specifically a set of input numerical instances is defined based on the system and
network configuration parameters reported below. An input numerical instance is
defined as a list of data regions, each with a specified size and MCS; with H-ARQ,
the data region also contains the list of H-ARQ sub-bursts. The procedure used to
generate a numerical instance is described in Appendix B.
The parameters are classified into static and dynamic parameters: static parameters
are set in a deterministic manner and are used to derive the dynamic parameters;
dynamic parameters are sampled from a random distribution during the numerical
instance generation, based on the set of static parameters. Any combination of static
parameters is defined as a snapshot. The allocation procedure is then fed with several
variations of the snapshot, by initializing the random number generator functions with
different seeds. Performance metrics, defined in Section 3.4.1, are estimated for a given
snapshot by averaging their respective values over all the numerical instances of that
snapshot. No weighting is applied; therefore all numerical instances are assumed as
equally probable states of the system, and confidence intervals can be derived using the
standard method of independent replications [15]. Confidence intervals are however
not drawn whenever negligible with respect to the estimated average.
The system and network configuration parameters are reported in Table 3.1.
As outlined in Section 3.2, a slot consists of a two-dimensional time/sub-channel
rectangle, whose exact dimensions depend on the sub-carrier permutation, i.e. PUSC
or FUSC. This difference accounts for the varying size of the downlink sub-frames
reported in Table 3.1. Additionally, the greater downlink sub-frame sizes, i.e. 17×30
and 34×16, correspond to the case of 10 MHz physical bandwidth, with a frame
duration equal to 5 ms, and ratio between the downlink and uplink sub-frames set
to 35/12. The same profile is used for the cases 17×10 and 34×5, respectively for
PUSC and FUSC, where a physical re-use of three is assumed.
In any case, the downlink sub-frame size includes the slots used to transmit the
DL-MAP, which is computed according to the standard specifications as a function
46
A. Bacioccola et al.
Table 3.1 Numerical instance parameters
Parameter name
Symbol
Type
Possible values
Sub-carrier permutation
H-ARQ support
Downlink sub-frame size (slots)
h
s
static
static
static
PUSC, FUSC
enabled, disabled
17 × 30, 17 × 10 (PUSC)
34 × 16, 34 × 5 (FUSC)
seven, three
random (RND),
More Robust First (MRF),
Less Robust First (LRF)
[0, 1]
0.2, 0.4, 0.6, 0.8
72
192
Seven MCSs
QPSK-1/2 (6),
QPSK-3/4 (9),
16QAM-1/2 (12),
16QAM-3/4 (18),
64QAM-1/2 (18),
64QAM-2/3 (24),
64QAM-3/4 (27)
Three MCSs
QPSK-1/2 (6),
16QAM-1/2 (12),
64QAM-1/2 (18)
VoIP, BE
1, 2, 4
Number of MCSs
Data region order
static
static
Target offered load
Target percentage of VoIP users
Size of VoIP PDUs, bytes
Size of BE PDUs, bytes
MCS (number of bytes/slot)
tol
v
Sv
Sb
mcs
static
static
static
static
dynamic
User type
Average number of BE PDUs per user
u
1/ pbe
dynamic
dynamic
of the number of data regions (both non-H-ARQ and H-ARQ) and H-ARQ subbursts (H-ARQ only).
For the purpose of analysis, we define the offered load (in slots, ol S ) as the fraction of the overall downlink sub-frame size s required to be allocated as user data:
n
ols =
j=1
s
aj
,
where a j is the size of the j-th data region provided as input to the allocation procedure, and n is the number of data regions. On the other hand, the target offered load
for a given numerical instance is the reference value used as a stopping criterion
during the numerical instance generation (see below). It is worth noting that the
offered load associated to a given instance may differ from the target offered load,
due to the integer nature of the numerical instance generation process. Finally, the
offered load (in bytes, ol B ) is computed as the sum of the bytes conveyed by the
data regions provided as input to the allocation procedure.
As far as data region arrangement is concerned, we assume that all MAC PDUs
directed to users with the same MCS are combined into the same data region. The
number of MCSs employed depends on the static parameter specified in Table 3.1.
3
A Downlink MAC Frame Allocation Framework
47
Specifically, if seven MCSs are used, this means that each user is served with the
MCS that best fits its current channel conditions, as reported by the MSs [16]. On the
other hand, with three MCSs we simulate a system where the BS can transmit data
to some MSs, i.e. the ones that would be served with the MCSs that are unavailable
in the three MCSs case, using a more robust MCS. This approach leads to a slightly
lower transmission efficiency for some MSs, but reduces the number of IEs that are
advertised on average in the DL-MAP, and hence the map overhead.
Lastly, the order in which data regions are fed to the allocation algorithm is specified as a static parameter. Three possible approaches are defined:
r
r
r
Random (RND): Data regions, each related to a different MCS, are shuffled in a
random fashion.
More Robust First (MRF): Data regions are sorted in decreasing robustness order.
In other words, data that have the least transmission efficiency, in terms of the
number of bytes conveyed per slot, have the highest chance of being allocated.
Less Robust First (LRF): This is opposite approach than MRF, i.e. data regions
are sorted in increasing robustness order.
The impact on the performance of both the ordering approach selected and
the number of employed MCSs is evaluated in the performance analysis in Section 3.4.2.
3.4.1 Metrics
The following performance metrics are defined. The carried load (in slots, cl S ) is
defined as the fraction of the downlink sub-frame size s that is allocated as user
data by the allocation algorithm. Note that the slots formally allocated, but not used
for data transmission, are not included in this computation. On the other hand, the
carried load (in bytes, cl B ) is defined as the number of bytes that can be conveyed
by the data regions resulting from the output of the allocation algorithm, depending
on their MCSs.
Then, the success probability is defined as the probability that the carried load
is equal to the offered load. It measures the capability of the algorithm to find a
solution that satisfies all the specified constraints.
The map overhead is defined as the fraction of the downlink sub-frame size s that
is allocated to transmit the DL-MAP message.
The unused slots per frame is defined as the fraction of the downlink sub-frame
size s that is not allocated for any transmission.
The padding overhead is defined as the fraction of the downlink sub-frame size
s that is allocated in any data region, as a result of map definition, but is not actually
used for data transmission. This accounts for slots that are allocated so as to define
data regions as rectangles, but are not needed to accommodate transmission foreseen
in that data region. This metric is only meaningful when H-ARQ is enabled, as
discussed in Section 3.3.3.1.
48
A. Bacioccola et al.
3.4.2 Results
In order to evaluate the impact of the system and network configuration parameters on the performance of the downlink MAC frame allocation alone, the results
in this section have been obtained without taking into account the MAC overhead
due to the management messages other than the DL-MAP, including the UL-MAP.
Furthermore, in all the evaluated scenarios, we verified that the performance improvement with PUSC is negligible with respect to FUSC. In other words, the gain
due to the number of slots that lie below the DL-MAP, which cannot be allocated in
FUSC mode, is quantitatively small in terms of the metrics defined in Section 3.4.1.
Therefore, we only report the results with FUSC for clarity of illustration.
We start with the analysis of the downlink MAC frame allocation procedure without H-ARQ support, by evaluating the carried load (in slots, cl S ), the map overhead,
and the success probability when the offered load (in slots, ol S ) increases from 0.2
to 1. For the ease of presentation, the carried load plotted also includes the map
overhead.
In Fig. 3.6 we first compare the results with different downlink sub-frame sizes,
i.e. 34 × 16 and 34 × 5. As can be seen, a large portion of the downlink sub-frame
(i.e. about 20% with a 34×16 sub-frame) is consumed by the transmission of the
DL-MAP. Furthermore, this overhead does not depend significantly on the offered
load. In fact, the size of the DL-MAP only depends on the number of IEs contained,
i.e. data regions allocated, which varies in a narrow interval, i.e. between 1 and 7,
Fig. 3.6 FUSC mode without H-ARQ. Carried load (in slots), map overhead, and success probability vs. the offered load (in slots), with different downlink sub-frame size, i.e. 34 × 16 and 34 × 5,
seven MCSs and data regions randomly passed to the allocation algorithm
3
A Downlink MAC Frame Allocation Framework
49
which is the maximum number of MCSs. Note that the map overhead does not decrease linearly with the sub-frame size, because of the fixed amount of information
that needs to be conveyed in the DL-MAP, regardless of the number of data regions
allocated. As far as the carried load is concerned, both the 34 × 16 and the 34 × 5
curves increase when the offered load increases until there is enough room in the
downlink sub-frame to allocate the input data completely. On the other hand, when
the success probability becomes smaller than one, the carried load saturates to a
constant value. In other words, after some value of the offered load that depends
on the size of the sub-frame, the latter is always completely allocated (i.e. the sum
of the carried load and the map overhead is one), but some input bursts are still
discarded (i.e. the offered load is greater than the carried load). Since this effect
is due to the DL-MAP transmission overhead, the actual value of the offered load
that saturates the sub-frame depends on the sub-frame size: the offered load with
a 34×16 sub-frame saturates earlier than that with a 34×5 sub-frame. Note that
there is a transient interval of the success probability where most, but not all, the
numerical instances fail to be allocated.
In the results above, all seven MCSs have been considered. This case is compared
to that with three MCSs only in Fig. 3.7, with a 34 × 16 sub-frame.
As can be seen, having a smaller number of MCSs reduces the map overhead,
which in turn improves the success probability. In fact, with three MCSs the latter
drops below one at a value of the offered load about 6% greater than that with
seven MCSs.
Fig. 3.7 FUSC mode without H-ARQ. Carried load (in slots), map overhead, and success probability vs. the offered load (in slots), with different number of MCSs employed, i.e. seven and three,
34 × 16 downlink sub-frame size, and data regions randomly passed to the allocation algorithm
50
A. Bacioccola et al.
Fig. 3.8 FUSC mode without H-ARQ. Carried load (in bytes) vs. offered load (in bytes), with
different number of MCSs employed, i.e. seven and three, 34 × 16 downlink sub-frame size, and
data regions randomly passed to the allocation algorithm
However, the lower overhead due to maps does not improve significantly the
performance, in terms of the carried load (in bytes) conveyed in the allocated regions, which is reported in Fig. 3.8 against the offered load (in bytes). This can be
explained as follows. With three MCSs only, some PDUs that can be transmitted
with a less robust MCS (e.g. 16-QAM-2/3) are allocated instead by means of a less
efficient MCS (e.g. 16-QAM-1/2). While this reduces the number of data regions
allocated on average, and hence the map overhead, the average transmission efficiency is also lessened. Specifically, the plot in Fig. 3.8 exhibits three phases. First,
when the offered load can be entirely allocated (i.e. when it is smaller than ∼3500
bytes), the carried load with both seven and three MCSs coincide with the former.
Then, there is a phase (i.e. with the offered load between ∼3500 bytes and ∼4500
bytes) where the carried load does not increase in a linear manner anymore. In this
interval having seven MCSs yields a higher carried load, in terms of bytes, due to
the higher transmission efficiency.
Finally, when the offered load is greater than ∼4500 bytes, the effect due to the
map overhead reduction with three MCSs overruns that of the transmission efficiency, which leads to improved performance with three MCSs only. Thus, while
the number of slots allocated per sub-frame, reported in Fig. 3.7, is always greater
with a smaller number of MCSs, the performance in terms of bytes carried shows a
trade-off depending on the input rate, in bytes, to the allocation algorithm.
We now investigate the performance in the cases where the data regions, before
being fed to the allocation algorithm, are sorted according to the MRF and the LRF
strategies described above. In this scenario, we consider seven MCSs.
3
A Downlink MAC Frame Allocation Framework
51
Fig. 3.9 FUSC mode without H-ARQ. Carried load (in slots), map overhead, and success probability vs. the offered load (in slots), with different ordering of data regions depending on their
MCSs, i.e. MRF and LRF, 34 × 16 downlink sub-frame size, and seven MCSs employed by the BS
As can be seen in Fig. 3.9, the specific ordering strategy does not affect significantly the performance in terms of carried load (in slots). In fact, with both the
MRF and the LRF strategies all the curves (almost) overlap. However, beyond the
value of about 0.8 of the offered load, the map overhead curves exhibit a divergent
trend. Specifically, the MRF strategy entails an increasing smaller map overhead
than the LRF one. This can be explained as follows. When the offered load is such
that the success probability is smaller than one, i.e. the allocation algorithm fails
to allocate all the data regions, the number of data regions allocated on average,
and thus the map overhead, is greater with LRF than with MRF. In fact, the greater
the transmission efficiency of an MCS, the smaller the size of the data region to
convey the same amount of data. Therefore, allocating the data regions in decreasing
robustness of MCS produces, on average, a smaller number of data regions which
are actually allocated. This accounts for the overhead reduction in the MRF case
when the value of the offered load is greater than 0.8. Conversely, the higher the
transmission efficiency, the higher the carried load, in terms of bytes, which can be
achieved. This result is shown in Fig. 3.10 where the carried load (in bytes) versus
the offered load is reported. With an offered load greater than ∼3500 bytes the MRF
and LRF curves no longer overlap. The higher transmission efficiency obtained by
the LRF strategy yields a carried load up to ∼5300 bytes while the MRF strategy
reaches ∼4200 bytes at most.
So far we have analyzed scenarios where the H-ARQ is not considered. We now
extend our analysis to the case of FUSC sub-carrier permutation with H-ARQ.
52
A. Bacioccola et al.
Fig. 3.10 FUSC mode without H-ARQ. Carried load (in bytes) vs. offered load (in bytes), with
different ordering of data regions depending on their MCSs, i.e. MRF and LRF, 34×16 downlink
sub-frame size, and seven MCSs employed by the BS
Again, in Fig. 3.11, we report the carried load (in slots), the map overhead and
the success probability versus the offered load (in slots) with 34×16 downlink subframes and seven MCSs. The padding overhead is also reported as a measure of the
capacity wasted due to the H-ARQ allocation algorithm. The same considerations of
the results described earlier without H-ARQ still hold. However, remarkable is the
impact of the padding overhead. The latter is comparable with the map overhead,
reaching the value of about 0.3. As an effect of the padding overhead, note that the
point in which the success probability starts dropping to zero is when the offered
load reaches the value of about 0.5 which is actually much less than the value of
about 0.75 obtained when H-ARQ is disabled (see Fig. 3.6).
The padding overhead also impacts on the carried load (in bytes), which is plotted
in Fig. 3.12 against the offered load (in bytes). The results with both seven MCSs
and three MCSs are reported. While the curves exhibit a similar trend to the case
with H-ARQ disabled (see Fig. 3.8), the quantitative results are much different.
Specifically, the maximum value of carried load obtained with H-ARQ is ∼4000
bytes whereas it is ∼5000 bytes when the H-ARQ is disabled. Furthermore, as the
offered load increases beyond the value of ∼3000 bytes, the combined effect of the
transmission efficiency and the map overhead described in Fig. 3.8 is smoothed by
the presence of the padding overhead. Therefore, it is no longer possible to precisely identify the phases in which the curve with seven MCSs lies above the one
with three MCSs and vice-versa. We can thus conclude that H-ARQ yields poorer
performance, in terms of the carried load, due to the padding overhead.
3
A Downlink MAC Frame Allocation Framework
53
Fig. 3.11 FUSC mode with H-ARQ. Carried load (in slots), map overhead, padding overhead, and
success probability vs. the offered load (in slots), with 34 × 16 downlink sub-frame size, seven
MCSs and data regions randomly passed to the allocation algorithm
Fig. 3.12 FUSC mode with H-ARQ. Carried load (in bytes) vs. offered load (in bytes), with different number of MCSs employed, i.e. seven and three, 34 × 16 downlink sub-frame size, and data
regions randomly passed to the allocation algorithm
54
A. Bacioccola et al.
Fig. 3.13 FUSC mode with H-ARQ. Carried load (in bytes) vs. offered load (in bytes), with different ordering of data regions depending on their MCSs, i.e. MRF and LRF, 34 × 16 downlink
sub-frame size, and seven MCSs employed by the BS
Finally, in Fig. 3.13 we compare the carried load (in bytes) with the MRF and
LRF strategies versus the offered load (in bytes). The results obtained are similar
to those without H-ARQ, which have been reported in Fig. 3.10. In particular, note
that the LRF curve lies above the MRF curve as soon as the offered load becomes
greater than ∼3000 bytes.
3.5 Conclusions
In this work we have studied the frame allocation problem in IEEE 802.16e with
the OFDMA air interface. Through a detailed analysis of the standard we have identified the constraints and requirements that need to be met by the BS, which are
related to both complying with the QoS guarantees of the admitted connections and
satisfying the MAC and physical layer specifications. Since addressing all the issues
together is an overly complex task, the frame allocation problem has been split into
three separated sub-tasks, namely grant scheduling, data region arrangement, and
data region allocation. A solution for data region arrangement and allocation, called
SDRA, is proposed. SDRA is designed to work with both non-H-ARQ and H-ARQ
data regions.
An extensive performance evaluation of SDRA has been carried out by means of
Monte Carlo analysis under varied system and network configuration parameters,
3
A Downlink MAC Frame Allocation Framework
55
with both VoIP and BE users. The following conclusions can be drawn from the
results obtained. First, the smaller the MAC frame, the smaller the impact of the
map overhead on the overall frame capacity, which anyway consumes a significant
amount of the available bandwidth (i.e. up to 20%), and therefore the higher the
probability that SDRA completely allocates the set of input data regions. Second,
employing a reduced set of MCSs, i.e. three instead of the full set of seven MCSs,
greatly reduces the map overhead, as well. However, there is a trade-off between
the number of slots that are allocated per frame and the number of bytes that can
be actually conveyed by them. In fact, lessening the set of available MCSs reduces
the average transmission efficiency. Finally, the performance of SDRA has been
shown to greatly depend on the order in which data regions are fed to the algorithm.
For instance, ordering the data regions in increasing robustness order achieves the
highest amount of data actually carried per frame, while ordering the data regions
in decreasing robustness order produces the least amount of map overhead. While
the same conclusions hold both for non-H-ARQ and H-ARQ data regions, the latter
exacerbates the trade-off between transmission efficiency and map overhead.
Appendix A: SDRA Algorithm Pseudo-Codes
In this section we report and describe the pseudo-codes of the SDRA algorithm both
in the non-H-ARQ and the H-ARQ cases which have been informally introduced in
Section 3.3.3.1.
Figure 3.14 reports the pseudo-code of SDRA without H-ARQ support. Data
structures are initialized by creating an empty map (1) and a list of allocated data
regions (2), and by setting the working variables w and h to the dimensions of
the downlink sub-frame, respectively width and height (3–4). These variables will
keep, at each step of the procedure, the coordinates of the next slot to be allocated. The allocation procedure is performed by placing one of the data regions
in list pending at each iteration of the main loop (7). The iteration terminates
when either there are no more data regions to be allocated (7) or adding a new
IE to the DL-MAP would make the latter overlap with already allocated data regions (12, 23, 32), whichever comes first. The size of the DL-MAP is updated
via the add harq region() function. Newly allocated data regions are added
to the list allocated data structures, which consists of a list of data region
coordinates, expressed in terms of upper-left corner (i.e. starting column and row,
respectively, in slots) and dimensions (i.e. width and height, respectively, in slots).
After the data region currently under allocation is extracted from the pending list
(9), the allocation consists of (up to) three steps:
r
The first step (11–19) allocates a data region upwards starting from h into the
remaining portion of the current column, i.e. w. The number of slots allocated is
thus equal to h, provided that there are enough slots in the data region, otherwise
the whole data region is allocated (e.g. B in Fig. 3.4). This step is skipped if the
next slot to be allocated is at the bottom of downlink sub-frame, i.e. h is equal to H.
56
A. Bacioccola et al.
Fig. 3.14 Pseudo-code of SDRA, without H-ARQ support
r
r
The second step (22–29) allocates a data region that spans over multiple columns
(cols) (e.g. the second data region resulting from the allocation of C in
Fig. 3.4). This step is skipped if the amount of remaining slots to be allocated for
the data region is smaller than a full-height column.
The third step (32–36) allocates the remaining portion of the data region, which
is by construction smaller than a full-height column (e.g. the third portion of C
3
A Downlink MAC Frame Allocation Framework
57
in Fig. 3.4). This step is skipped only if the number of slots of the data region
before the second step is a multiple of H.
The detailed allocation procedure of H-ARQ data regions is described by means
of the pseudo-code in Fig. 3.15. Data structures are initialized by creating an empty
map (1) and a list of allocated data regions (2), and by setting the working variable
width to zero (3). This variable will keep, at each step, the number of columns
allocated so far. Unlike with non-H-ARQ data regions, there is no need to store the
number of rows allocated so far, since the size of H-ARQ data regions is enforced
to be a multiple of the downlink sub-frame height. The allocation procedure is performed by placing one of the data regions in list pending at each iteration of
the main loop (5). The iteration terminates when there are no more data regions to
be allocated. The size of the DL-MAP is updated via the add harq region()
function (8). As for the non-H-ARQ case, newly allocated data regions are added to
the list allocated data structure (12), which consists of a list of data region
coordinates, expressed in terms of upper-left corner (i.e. starting column and row,
respectively, in slots) and dimensions (i.e. width and height, respectively, in slots).
After the data region currently under allocation is extracted from the pending list
(6), the number of columns needed to fully allocate it are computed and stored into
new w (7). Then, there are two cases:
r
The data region fits into the remaining space, after the size of the DL-MAP has
been updated (8). In this case the variable width is updated (11), a new data
region is added to list allocated (12), and the current data region is removed
from the pending list (13). Allocation then restarts with the next data region in
list pending.
Fig. 3.15 Pseudo-code of SDRA, with H-ARQ support
58
r
A. Bacioccola et al.
Otherwise, a sub-burst is removed from the current data region (18) and the allocation procedure restarts. If the sub-burst removed is the only one of the data
region, then the latter is removed, as well (19). Note that the size of the DL-MAP
must be also restored to its previous value (17) since no data region was allocated
in this step.
To conclude this section we now compute the computational complexity of
SDRA. With both non-H-ARQ and H-ARQ, the procedure is run as a single iteration, each of which only includes simple constant time operations (e.g. addition
to/removal from the head of a list, elementary mathematical operations with integer
values). Therefore, we can state that the worst-case computational complexity is
O(n), where n is the number of data regions or the number of sub-bursts, respectively
in the non-H-ARQ and H-ARQ cases.
Appendix B: Numerical Instance Generation
A numerical instance is generated as follows. Starting from an empty list, the input
list of data regions is produced iteratively according to the following steps:
1. Initialize the offered load in slots (ol S ) and bytes (ol B ) to 0.
2. Consider a new SDU to be transmitted to a new user.
3. Determine the associated MCS mcs according to a probability distribution reflecting a typical MSs’ deployment scenario [17].
4. Determine the SDU type (i.e. application) according to the corresponding probability distribution: the SDU is VoIP with probability v, BE with probability
1 – v.
5. Determine the number and size (in bytes) of PDUs used to transmit the SDU:
6. If VoIP was selected at point 3), then only one PDU is needed, of size v;
7. Otherwise, if BE was selected, the number n be of PDUs is drawn from a geometric distribution with average 1/ pbe ;
8. Determine the number and size (in slots) to transmit the above PDUs according
to mcs. Each PDU is added to the data region reserved for MCS mcs. Moreover,
in H-ARQ enabled snapshots, the PDUs are appended to the list of H-ARQ
sub-bursts of data region mcs.
9. Update the offered load, both in bytes and slots. If ol S < tol restart from step
1.
10. As the final step, the set of data regions is sorted according to the ordering
approach described above. There are three cases:
a) RND: Data regions are permuted according to a random uniform distribution.
b) MRF: Data regions are sorted deterministically in decreasing robustness
order.
c) LRF: Data regions are sorted deterministically in increasing robustness
order.
3
A Downlink MAC Frame Allocation Framework
59
References
1. IEEE 802.16e-2005 (February 2006), IEEE Standard for Local and metropolitan area networks – Part 16: Air Interface for Fixed Broadband Wireless Access Systems – Amendment
2: Physical and Medium Access Control Layers for Combined Fixed and Mobile Operation in
Licensed Bands and Corrigendum 1.
2. IEEE 802.16-2004 (October 2004), IEEE Standard for Local and metropolitan area networks –
Part 16: Air Interface for Fixed Broadband Wireless Access Systems.
3. A. Ghosh, D. R. Wolter, J. G. Andrews, and R. Chen, Broadband Wireless Access with
WiMax/802.16: Current Performance Benchmarks and Future Potential, IEEE Comm. Mag.
43(2), 129–136 (2005).
4. WiMax forum (June 2006), Mobile WiMax: A technical overview and performance evaluation.
5. H. Holma and A. Toskala, HSDPA/HSUPA for UMTS: High Speed Radio Access for Mobile
Communications (John Wiley & Sons, Hoboken, NJ, 2006).
6. A. Bacioccola, C. Cicconetti, A. Erta, L. Lenzini, E. Mingozzi, A Downlink Data Region Allocation Algorithm for IEEE 802.16e OFDMA, Proc. Information, Communications & Signal
Processing (ICICS), Singapore (China), Dec. 10–13, 2007.
7. C. Cicconetti, L. Lenzini, E. Mingozzi, and C. Eklund, Quality of Service Support in IEEE
802.16 Networks, IEEE Network (20)2, 50–55 (2006).
8. L. J. Cimini, Analysis and Simulation of a Digital Mobile Channel Using Orthogonal Frequency Division Multiplexing, IEEE Trans. Comm. (33)7, 665–675 (1985).
9. R. Van Nee and R. Prasad, OFDM for Wireless Multimedia Communications (Artech House,
Norbrook, MA, 2000).
10. H. Yaghoobi, Scalable OFDMA Physical Layer in IEEE 802.16 WirelessMAN, Intel Tech. J.
(8)3, 201–212 (2004).
11. C. Cicconetti, A. Erta, L. Lenzini, and E. Mingozzi, Performance Evaluation of the IEEE
802.16 MAC for QoS Support, IEEE Trans. Mobile Comput. (6)1, 26–38 (2007).
12. M. Shreedhar and G. Varghese, Efficient Fair Queueing Using Deficit Round Robin,
IEEE/ACM Trans. Networking, (4)3, 375–385 (1996).
13. D. Stiliadis and A. Varma, Latency-rate Servers: A General Model for Analysis of Traffic
Scheduling Algorithms, IEEE/ACM Trans. Networking, (6)5, 675–689 (1998).
14. S. Martello and P. Toth, Knapsack Problems: Algorithms and Computer Implementations
(John Wiley & Sons, Hoboken, NJ, 1990).
15. A. M. Law and W. D. Kelton, Simulation Modeling and Analysis (McGraw-Hill, Columbus,
OH, 2000).
16. C. Eklund, R. B. Marks, S. Ponnuswamy, K. L. Stanwood, and N. J. M. Van Waes, WirelessMAN: Inside the IEEE 802.16 Standard for Wireless Metropolitan Area Networks (IEEE
Press, 2006).
17. J. Moilanen, OFDMA Allocation Numerical Guidelines, Technical Report, 2006 (unpublished).
18. A. Bacioccola, C. Cicconetti, A. Erta, L. Lenzini, and E. Mingozzi, Half Duplex Station Scheduling in IEEE 802.16 Wireless Networks, IEEE Trans. Mobile Comput. (6)12,
1384–1397 (2007).
Chapter 4
Scheduling Techniques for WiMax
Aymen Belghith and Loutfi Nuaymi
Abstract This chapter proposes a state-of-the-art of scheduling techniques for
WiMax. We first summarize the practical considerations of a WiMax scheduling
algorithm in order to make a link between a scheduling algorithm and its implementation in WiMax. Then, we analyze the proposed use of some known algorithms
for WiMax and then some scheduling algorithms specifically proposed for WiMax.
Finally, we draw a comparison between the different possible scheduling methods
and highlight the main points of each of them.
Keywords Scheduling · WiMax
4.1 Introduction
The Worldwide Interoperability for Microwave Access (WiMax) [1] system is
based on the IEEE 802.16-2004 standard [2] and its amendment IEEE 802.16e [3].
The IEEE 802.16 standard defines the physical (PHY) and medium access control
(MAC) layer of fixed and mobile broadband wireless access system. The use of the
(2–11 GHz) frequency band for WiMax allows this technology to perform a non line
of sight (NLOS) propagation. WiMax is a technology that promises high throughput
and spectrum efficiency and provides powerful Quality of Service (QoS) support.
The QoS support in wireless networks is a difficult task due to the characteristics of
the wireless link and, in the case of a multimedia system such as WiMax, the high
variability of the traffic. The IEEE 802.16-2004 MAC specifies four scheduling services, also known as QoS classes, in order to fulfil QoS requirements: Unsolicited
Grant Service (UGS), real-time Polling Service (rtPS), non-real-time Polling Service (nrtPS), and Best Effort (BE). The IEEE 802.16e MAC added a fifth service
class: extended real-time Polling Service (ertPS).
The radio resources have to be scheduled according to the QoS requirements.
The WiMax/IEEE 802.16 standard does not define a mandatory scheduling algorithm. Only the framework is given in the standard. Therefore, the choice of the
A. Belghith (B)
TELECOM Bretagne
M. Ma (ed.), Current Technology Developments of WiMax Systems,
C Springer Science+Business Media B.V. 2009
DOI 10.1007/978-1-4020-9300-5 4,
61
62
A. Belghith and L. Nuaymi
Fig. 4.1 Packets Scheduling in BS and SS. The uplink scheduler may have different scheduling
classes depending on the service type
algorithm is left to the vendor or the operator. The choice of a scheduling algorithm
for WiMax/IEEE 802.16 is an open question. There are many known scheduling
techniques. There are also scheduling techniques that are specifically proposed for
WiMax. The scheduling must be applied to the downlink or the uplink direction in
the Base Station (BS). Only uplink scheduling is applied in subscribers stations (SS)
(see Fig. 4.1). Since the scheduling is a very active field, we cannot describe all the
algorithms proposed for WiMax and then we have selected some of them.
The rest of the chapter is organized as follows. Section 4.4.2 presents the considerations to take into account in the design of a scheduling technique. Section 4.4.3
describes some known scheduling methods and the performance evaluation of the
deployment of some schedulers in WiMax. Section 4.4.4 presents schedulers specifically proposed for WiMax as well as their performance evaluations. Section 4.5
presents a synthesis of the deployment of different schedulers in WiMax. The conclusion is in Section 4.4.6.
4.2 WiMax practical Scheduling Considerations
4.2.1 The BS Announces its Scheduling Decisions
In WiMax, the MAC architecture is centralized at the BS. The BS scheduler is
responsible for the whole control access for the different wireless subscribers. In
order to indicate the assignment of the downlink and uplink transmission intervals
4
Scheduling Techniques for WiMax
63
Fig. 4.2 Time Division Duplexing (TDD) frame structure in IEEE 802.16
(or bursts) in each frame, the BS transmits the downlink map (DL-MAP) and uplink map (UL-MAP) MAC management messages, respectively. These messages
are transmitted at the beginning of the downlink subframe (see Fig. 4.2).
When it receives an UL-MAP management message, the SS determines if it can
access to the uplink channel during the current frame. Since the SS may have different connections, an uplink scheduler is required in each SS.
4.2.2 The WiMax Scheduling Classes
The scheduling algorithm is not specified by the standard. However, the IEEE
802.16-2004 document [2] defines four scheduling service classes in order to fulfil
QoS requirements:
r
r
r
r
Unsolicited Grant Service (UGS): designed to support real-time applications.
The packets have a fixed size and are generated periodically. An UGS connection
never requests bandwidth.
real-time Polling Service (rtPS): designed to support real-time applications. The
packets have a variable size and are generated periodically. An rtPS connection
requests bandwidth by responding to unicast polls which are transmitted periodically by the BS. The most important QoS parameters are the minimum reserved
traffic rate and the maximum latency.
non-real-time Polling Service (nrtPS): designed to support applications that do
not have delay requirements. An nrtPS connection requests bandwidth by responding to broadcast polls which are transmitted periodically by the BS. Each
nrtPS connection has a minimum reserved traffic rate parameter. This parameter
determines the minimum amount of bandwidth to reserve.
Best Effort (BE): designed to support applications that have not delay requirements. A BE connection requests bandwidth by responding to broadcast polls
which are transmitted periodically by the BS.
The 802.16e [3] added a fifth scheduling service class, called extended real-time
Polling Service (ertPS). An ertPS connection benefits from the advantages of both
UGS and rtPS connections. This kind of connection is designed to support real-time
64
A. Belghith and L. Nuaymi
applications. The packets have a variable size and are generated periodically like in
an rtPS connection. Unicast grants are provided in an unsolicited manner like in an
UGS connection. However, the ertPS allocations are dynamic and the BS must not
change the size of the allocations until receiving a new bandwidth change request
from the subscribers.
4.2.3 Link Adaptation and Scheduling
In the IEEE 802.16 standard, the frame has a fixed number of OFDM symbols. The
number of symbols depends on some parameters such as the frequency bandwidth
and Cyclic Prefix (CP). However, the number of useful data bits is variable and
depends on the used Modulation Coding Scheme (MCS). The MCS to be used is
defined by the link adaptation procedure. The choice of the appropriate MCS depends on the value of the receiver Signal-to-Noise Ratio (SNR). The IEEE 802.16
standard proposes some thresholds of the SNR (see Table 4.1) only as indicative
values. For example, when the SNR is equal to 7.0 dB, the station uses QPSK 1/2.
The different MCS that are defined by the standard are the following: BPSK 1/2,
QPSK 1/2, QPSK 3/4, 16QAM 1/2, 16QAM 3/4, 64QAM 1/2, and 64QAM 3/4. In
general, the subscriber switches to a more energy efficient MCS if the SNR is good.
The SS can also switch to a more robust MCS if the SNR is poor. Once the MCS is
defined, the number of bits per symbol, and then the useful number of bits per frame,
can be computed. Therefore, the BS must take into account the link adaptation in its
scheduling considerations.
Table 4.1 Receiver SNR thresholds (values proposed by the IEEE 802.16e standard)
Modulation
Coding
Receiver SNR (dB)
BPSK
QPSK
QPSK
16-QAM
16-QAM
64-QAM
64-QAM
1/2
1/2
3/4
1/2
3/4
2/3
3/4
3.0
6.0
8.5
11.5
15.0
19.0
21.0
4.3 Well-Known Scheduling Methods
Some well-know scheduling methods are presented in this section. The list of
the presented schedulers is not exhaustive. It contains the most used schedulers
such as the Round Robin (RR), Maximum Signal-to-Interference (mSIR), Prorate,
Weighted Round Robin (WRR), and Deficit Round Robin (DRR) schedulers.
4.3.1 Round Robin (RR) Scheduler
The Round Robin scheduler, also called cyclic scheduler, equitably distributes the
channel resources to the multiplexed packet data calls. This technique is suitable if
4
Scheduling Techniques for WiMax
65
the subscribers have the same traffic and radio characteristics. Indeed, the radio characteristics permit the determination of the Modulation and Coding Scheme (MCS)
to use. Therefore, when all the subscribers use the same MCS and have the same
traffic, they need the same resources and then the RR scheduler is suitable in these
conditions. Nevertheless, these conditions are generally not applicable in a WiMax
context.
4.3.2 Maximum Signal-to-Interference (mSIR) Scheduler
The maximum Signal-to-Interference (mSIR) scheduler allocates the radio resources
to subscriber stations (SS) having the highest Signal-to-Interference Rate (SIR).
Then, this scheduler offers high spectrum efficiency. Nevertheless, subscribers having a SIR that is always small may never be served.
4.3.3 Prorate Scheduler
The resources allocation in the Prorate scheduler depends on the number of symbols
that are required by the different connections. The allocated portion of symbols (of
the total number of available symbols) for the connection i is equal to the number
of required symbols by the connection i divided by the total number of symbols
required by all the connections.
The higher the demand of a subscriber is, the more symbols are allocated to this
subscriber. However, there are no considerations for the SIR or the MCS used.
4.3.4 Weighted Round Robin (WRR) Scheduler
The weighted round robin scheduler is an extension of Round Robin scheduler based
on the static weight.
An example of WRR algorithm execution is represented in Fig. 4.3. In this example, there are:
r
r
Three queues: A, B, and C.
The weight of the queues A, B, and C are equal to 2, 1, and 3, respectively.
Fig. 4.3 Packets queues for Weighted Round Robin (WRR) scheduling algorithm
66
A. Belghith and L. Nuaymi
In WiMax, the connections have different QoS parameters and the subscribers
use different MCS. In another hand, the subscribers have not generally the same
traffic. Therefore, the connections do not need the same resources. The use of the
WRR scheduler can be suitable for WiMax because different values of weights can
be assigned to the different queues to take into account the different requested resources.
4.3.5 Deficit Round Robin (DRR) Scheduler
The Deficit Round Robin scheduler associates a fixed quantum (Q i) and a deficit
counter (DC i) with each flow i. At the start of each round, DC i is incremented
by Q i for each flow i. The head of the queue Queue i is eligible to be dequeued if
DC i is greater than the length of the packet waiting to be sent (L i). In this case,
DC i is decremented by L i. At each round, one packet at most can be dequeued for
each flow.
An example of DRR algorithm execution is represented in Fig. 4.4. In this example, there are three queues: A, B, and C:
r
r
r
A contains three packets: a1 (200), a2 (750), and a3 (280).
B contains two packets: b1 (500), and b2 (300).
C contains four packets: c1 (100), c2 (900), c3 (300), c4 (250), and c5 (900).
Fig. 4.4 Packets queues for Deficit Round Robin (DRR) scheduling algorithm
4
Scheduling Techniques for WiMax
67
The DDR scheduler requires a minimum rate to be reserved for each packet flow
before being scheduled. This characteristic can be useful in WiMax because the
subscribers usually require an allocation of a minimum of resources.
4.3.6 DRR and WRR Schedulers Evaluated for WiMax
4.3.6.1 Choice of Schedulers for the BS and the SS
Three schedulers must be chosen for the BS and SS; an uplink and downlink schedulers for the BS and an uplink scheduler for the SS. Authors in [4] make the following choice. To use the DRR scheduler, a station must have the knowledge of
the packet size of each queue. Since the BS and SS have all the information about
their downlink and uplink queues, respectively, they can use the DRR scheduler
as a downlink and uplink schedulers, respectively. It remains to choose the uplink
scheduler in the BS because the BS does not have the knowledge of the packet length
of the different subscribers. However, the BS can estimate the amount of backlog of
each connection through the bandwidth requests. Then, the WRR scheduler can be
selected as the uplink scheduler in the BS (see Fig. 4.5).
Fig. 4.5 Use of DRR and WRR schedulers
4.3.6.2 Performance Evaluation
The performance of IEEE 802.16 is analyzed by simulation in [4]. The main parameters of the simulation are the following: the frequency band is 2–11 GHz, the
air interference is the WirelessMAN-OFDM (using orthogonal frequency-division
multiplexing), the channel bandwidth is 7 MHz, the duplexing mode is Frequency
Division Duplexing (FDD), and the frame duration is 10 ms.
68
r
r
r
A. Belghith and L. Nuaymi
The metrics to evaluate are:
Maximum achievable throughput: represents the maximum amount of data that
a station can send successfully.
Packet-transfer delay: represents the time between the arrival of the packet at the
MAC layer of the source of the traffic and the time of the arrival of this packet at
the upper layer of the destination of the traffic.
Delay variation: represents the difference between the maximum packet-transfer
delay and the packet transmission delay.
Two scenarios are considered: residential scenario and Small and Medium-sized
Enterprises (SME) scenario.
In the first scenario, the BS provides Internet access to SS by means of BE
(Best Effort) connections. The results of the average delay and maximum achievable
throughput depending on the offered load and number of subscribers are represented
in Table 4.2.
In the second scenario, the BS provides three types of services:
r
r
r
Voice over Internet Protocol (VoIP) service: each station has four VoIP sources
multiplexed into an rtPS connection.
Videoconference service: each station has two videoconference sources multiplexed into an nrtPS connection.
Data service: each station has a data source provided by a BE connection.
Table 4.2 Performance evaluation of the residential and SME scenario
Metric/Results
Residential scenario: Average
delay
Results for downlink traffic
r Constant at low cell load
r Sharply increase at high
cell load
r Downlink delay < uplink
delay
Residential scenario:
Maximum achievable
throughput
Small and Medium-sized
Enterprises scenario:
Average delay
Small and Medium-sized
Enterprises scenario: Delay
variation
r Decrease when number of
SS increases (because
BS transmits higher
MAC overhead)
r Constant for voIP service
r Smoothly increase at low
Results for uplink traffic
r Constant at low cell load.
r Sharply increase at high
cell load.
r Uplink delay > downlink
delay
r Decrease when number of
SS increases (because
SSs transmit higher
number of physical
preambles)
r Constant for voIP service
r Smoothly increase at low
cell load for videoconfercell load for videoconference and data service
ence and data service
r Sharply increase at high
r Sharply increase at high
cell load for videoconfercell load for videoconference and data service
ence and data service
r Delay variation of VoIP
service = delay variation
of videoconference
service
Downlink scheduler is DRR and uplink scheduler is WRR.
r Delay variation of VoIP
service < delay variation
of videoconference
service
4
Scheduling Techniques for WiMax
69
The BS, periodically, grants a unicast poll to each VoIP and videoconference
services in order to allow SS to send bandwidth request.
The results of the average delay and delay variation depending on the offered
load, number of subscribers, and service types are represented in Table 4.2.
4.4 Schedulers Specially Proposed for WiMax
4.4.1 Temporary Removal Scheduler (TRS)
The temporary removal scheduler (TRS) [5] is described as follows. The TRS identifies the packet calls under power radio conditions. These packet calls are temporarily removed from the scheduling list for a certain adjustable time period TR .
The scheduling list contains all the SSs that can be served at the next frame.
If TR expires, the temporarily removed packet is checked again. If the radio conditions are still poor, this packet is temporarily removed for another time period TR .
The whole process is repeated up to L times. When the packet is removed for a period of L × TR , it is included in the scheduling list independently of the current radio
conditions. Then, a penalty time TP prevents the packet call from being immediately
selected once more. If an improvement is observed in the radio channel, the packet
could be topped up in the scheduling list again.
The temporary removal scheduling can be combined with a common scheduler.
It can be combined with the RR, and mSIR schedulers.
4.4.1.1 Temporary Removal Scheduler + Round Robin
The temporary TRS can be combined with the RR scheduler. The combined scheduler is called TRS+RR. For example, if there are k packet calls and only one of
them is temporary removed, each packet call has a portion, equal to 1/(k − 1), of
the whole channel resources.
4.4.1.2 Temporary Removal Scheduler + Maximum Signal
to Interference Ratio
The TRS can be combined with the mSIR scheduler. The combined scheduler
is called TRS+mSIR. This scheduler assigns the whole channel resources to the
packet call that has the maximum value of the Signal to Noise Ration (SNR). The
station to be served has to belong to the scheduling list.
4.4.1.3 Performance Comparison
The performance analysis TRS applied to WiMax is performed by simulation. The
main parameters of the simulation are the following: the frequency band is 3.5 GHz,
the air interference is the WirelessMAN-OFDM, the channel bandwidth is 3.5 MHz,
and the frame duration is 2 ms. The schedulers to evaluate are the following: the RR,
70
A. Belghith and L. Nuaymi
mSIR, TRS+RR, and TRS+mSIR schedulers. The results for File Transfer Protocol
(FTP) 300 kByte download are represented below:
r
r
r
r
The mSIR and TRS+mSIR schedulers provide the highest throughput whereas
RR provides the worst results.
The mSIR, TRS+mSIR, and TRS+RR schedulers provide the lowest download
time whereas the RR scheduler provides the worst results.
The TRS+mSIR and TRS+RR schedulers provide the lowest channel utilization
whereas the RR and mSIR schedulers provide the worst results.
The TRS+mSIR and TRS+RR schedulers provide the lowest packet call blocking whereas the RR and mSIR schedulers provide the worst results.
4.4.2 Opportunistic Deficit Round Robin (O-DRR) Scheduler
4.4.2.1 O-DRR Scheduler Description
In [6], the Opportunistic Deficit Round Robin (O-DRR) scheduler is used as an
uplink scheduler. The O-DRR scheduler works as follows. The BS polls all the subscribers periodically, every k frames. After each period, called a scheduling epoch,
the BS determines the set of subscribers that are eligible to transmit as well as their
bandwidth requirements. This set is called eligible set. A subscriber is eligible to
transmit when:
r
r
the subscriber has a non empty queue, and,
the signal-to-interfernece-plus-noise ratio (SINR) of its wireless link is above a
minimum threshold, called SINRth .
A scheduled subscriber is a subscriber that:
r
r
the subscriber is eligible at the start of the current scheduling epoch, and,
the subscriber is eligible during a given frame of the current scheduling epoch.
The scheduled set is changed dynamically. This changing depends on the wireless link state of each eligible subscriber. At the beginning of a new scheduling
epoch, the BS resets the eligible and scheduled set and performs the above process
again.
4.4.2.2 Determination of the Polling Interval k
The BS polls all the subscribers every k frames. A low value of k causes a polling
overhead; thus, the efficiency will be low. Furthermore, a high value of k causes an
unfair traffic and a non satisfaction of QoS requirements. Therefore, the BS objective is to minimize the worst-case relative fairness in bandwidth and the normalized
delay.
4
Scheduling Techniques for WiMax
71
4.4.2.3 Bandwidth Assignment Using the O-DRR Scheduler
It is considered that the BS knows the SINR of each channel. During a scheduling
epoch, if the SINR of the wireless link of the subscriber i is above SINRth , then:
r
r
r
The quantum Qi of the subscriber i is distributed among the scheduled subscribers.
The lead/lag counter of the subscriber i is incremented by Qi .
The lead/lag counter of the scheduled subscriber j is decremented by the amount
that the subscriber j receives above its quantum Qj .
4.4.2.4 Performance Evaluation of the O-DRR Scheduler
The results of the number of slots assigned depending on the number of subscribers
and k value show that the number of slots assignment increases when k increases. In
fact, when k increases, the SINR becomes more variable for the different subscribers
and the lead/lag counter has more influence on the bandwidth assignment.
The results of the fairness in bandwidth using Jain’s Fairness Index [7] depending
on the number of subscribers and k value show that Jain’s Fairness Index remains
above 90%. This gives more choice to the provider to choose an appropriate value
of k at which the fairness and the bandwidth requirements are both satisfied.
4.4.3 Uplink Packet Scheduler with Call Admission Control (CAC)
Mechanism
In [8], an uplink packet scheduler with Call Admission Control (CAC) is proposed.
The CAC mechanism is based on the token bucket principle. The token bucket is a
mechanism used to control network traffic rate.
The uplink packet scheduler algorithm works as follows (see Fig. 4.6). First, All
the UGS connections are granted. Then, the CAC is applied to the rtPS packets.
The different deadlines of these packets are computed. Once the deadlines are determined, the Earliest Deadline First (EDF) scheduler is applied for the attribution
of the priorities for the rtPS connections. The EDF scheduler attributes priorities
to different packets according to their deadlines. The closer is the deadline of a
packet; the higher is its priority. After the allocation of resources for the UGS and
the the rtPS connections, resources for the nrtPS connections are allocated if there
are remaining bandwidth and the bandwidth requirements of these connections are
below a threshold, called TnrtPS . Then, resources for the BE connections are allocated if there are remaining bandwidth and the bandwidth requirements of the BE
connections are below a threshold, called TBE . If there are still remaining bandwidth,
the nrtPS connections and then BE connections are granted until the use of the whole
available bandwidth.
The simulation is used to validate the CAC. The main parameters are the following: the frame duration is 1 ms, the size of the bandwidth request is 48 bits, the size
72
A. Belghith and L. Nuaymi
Fig. 4.6 Main steps of the uplink packet scheduler with CAC
of the UGS, rtPS, nrtPS, and BE packets are 64 bits, 256 bits, 256 bits, and 128 bits,
respectively, and the number of flows are 1000. The simulation results show that the
proposed uplink packet scheduler can receive a high number of rtPS connections
and guarantee their delay requirements.
4
Scheduling Techniques for WiMax
73
4.4.4 Cross-layer Scheduling Algorithm with QoS Support
4.4.4.1 Cross-Layer Scheduler Description
In [9], a novel scheduling algorithm is proposed for WiMax networks. This scheduler is based on affecting a priority to each connection.
For the UGS connections, the scheduler must guarantee a fixed quantum of radio
resources. The UGS connections are characterized by a constant number of time
slots allocated. Therefore, the transmission mode is selected and remains the same
during the whole service time. For the rtPS and nrtPS connections, the scheduler
must guarantee the latency and the minimum reserved rate respectively. For the BE
connections, there is no QoS guarantee but a Packet Error Rate (PER) should be
maintained.
After serving all the UGS connections, the scheduler allocates all the residual
time slots to the rtPS, nrtPS, then BE connections that have the maximum value of a
defined Priority Function (PFR). The PRFs, for the rtPS, nrtPS, and BE connections
consequently depends on the delay satisfaction indicator, the rate of the average
transmission rate over the minimum reserved rate, and the normalized channel quality. The PRFs details are presented in [9].
4.4.4.2 Performance Evaluation
When there is sufficient available bandwidth, the simulation results show that the
delay outage probabilities of the rtPS connections are always below 5%. Therefore the latency constraints are guaranteed. The results also show that the average
reserved rate of each nrtPS connection is greater than its minimum reserved rate.
However, the average transmission rates of the BE connections have large variations
and sometimes are null. This behaviour is expected since there is no guarantees for
the BE connections.
When the residual slots decrease, the performance of the BE connections (then
the nrtPS connections) degrades. This is due to the insufficient available bandwidth
and the fact that the nrtPS connections have higher priority than the BE connections.
4.4.5 Hybrid Scheduling Algorithm
4.4.5.1 Hybrid Scheduler Description
The hybrid scheduling algorithm for QoS in WiMax in [10] works as follows. The
Earliest Due Date (EDD) scheduler is used for the real time services while the
Weighted Fair Queue (WFQ) scheduler is used for the non-real time services. This
is then a hybrid scheduling algorithm.
The EDD scheduler is based on dynamic priority. In an EDD queue, the packets
are classified in order of their deadline values. The expected deadline time of a
packet is calculated by adding the packet arrival time and maximum service time of
this packet.
74
A. Belghith and L. Nuaymi
The WFQ scheduler provides a required throughput rate for each service. The
delay in WFQ for a service is computed as follows:
DWFQ =
i=1..n
wi
(R ∗ wi )
Where:
r
r
r
n: represents the number of services.
wi : represents the weight given to the queue i.
R: represents the link transmission rate.
In [11], the same hybrid scheduler is proposed; the EDD scheduler is used for
the UGS QoS class and the WFQ scheduler is used for nrtPS and BE QoS classes.
The only difference is that the nrtPS QoS class has more priority than that of the BE
QoS class.
4.4.5.2 Performance Evaluation
In [10], the hybrid scheduler is compared with the EDD scheduler employed for
the real and non-real time services. The simulation results show that the hybrid
scheduler provides, for real time services, less delay than the EDD scheduler. This
is due to the competition of the non-real time packets for channel access when the
EDD scheduler is used. However, the non-real packets wait for more time when the
hybrid scheduler is used. Since the real time services have delay requirements, it is
recommended to use the hybrid scheduler in WiMax.
In [11], the number of contention slots is investigated using the same hybrid
scheduler. The contention slots are used by the SSs to send their bandwidth requests
through contention. The simulation results show that the throughput increases when
the number of contention slots increases without exceeding the half BE connections.
This is due to the decrease of the probability of bandwidth request collisions. If
the number of contention slots is grater than the half of the BE connections, the
throughput decreases when the number of contention slots increases. This is because
less radio resources are reserved for the data transmission.
4.4.6 Frame Registry Tree Scheduler (FRTS)
4.4.6.1 Frame Registry Tree Scheduler (FRTS) Description
The Frame Registry Tree Scheduler (FRTS) scheduler [12] contains three operations: packet/request arrival, frame creation, and subscriber’s modulation type
change or connection QoS service change. The basic idea of the packet/request operation is to distribute packet transmissions in time frames, based on their deadline.
For UGS and rtPS services, the packet deadline is equal to the arrival time plus
4
Scheduling Techniques for WiMax
75
the latency of this packet. The subtree of the last time frame where this packet can
be transmitted is updated, if it exists. Otherwise, it is created. For nrtPS and BE
services, the packet deadline does not need to be calculated. Then, the subtree of
the last existing time frame is updated. The frame creation procedure decides on the
frame contents. There are three cases:
r
r
r
If the subtree of the first time frame contains a number of packets equal to one
time frame, all these packets fill up the frame content.
If the subtree of the first time frame contains a number of packets less than one
time frame, the empty slots are occupied by packets from the next time frame
subtrees and/or will be left for contention.
If the subtree of the first time frame contains a number of packets more than one
time frame, packets for BE service are moved to the next time frame subtree. If
there are still excess packets to transmit, first nrtPS packets, then rtPS packets
and finally UGS packets are deleted until the number of packets fit exactly into
one time frame.
A change in a subscriber’s modulation type or connection QoS service causes a
moving of the corresponding subtree to the right modulation substructure or service
substructure.
4.4.6.2 Performance Evaluation
The FRTS scheduler is compared with a simple scheduler that serves higher priority before lower priority traffic (UGS has the highest priority, then rtPS, nrtPS,
and finally BE). Simulation results show that the FRTS scheduler provides better
throughput. This is due to the less lost packets. Indeed, FRTS takes into account the
deadline of the real time packets (UGS and rtPS).
Simulations results also show that the FRTS scheduler can serve nrtPS and BE
connections even if the load is high. This is because this scheduler profits from the
latency tolerance of the real time packets.
4.4.7 Adaptive rtPS Scheduler
4.4.7.1 Adaptive rtPS Scheduler Description
The adaptive rtPS scheduler [13] is used only for the rtPS QoS class. It is based
on the prediction of the rtPS packets arrival. As defined in the IEEE 802.16 standard, the BS allocates bandwidth for rtPS traffic after receiving a bandwidth request.
When the request is granted by the BS, the subscriber may receive from upper layers
new rtPS packets. These packets will wait for the next grant to be sent and, therefore,
suffer from extra delay. The basic idea of the adaptive rtPS scheduler is to propose
an rtPS bandwidth request process in which the subscriber requests time slots for the
data present in the rtPS queue and also for the data which will arrive. The authors
of [13] define a stochastic prediction algorithm in order to estimate the data arrival.
76
A. Belghith and L. Nuaymi
4.4.7.2 Performance Evaluation
The adaptive rtPS scheduler is compared with the weighted scheduler. The simulation results show that the adaptive rtPS scheduler provides better average delay
in low and medium load. This is because this scheduler also considers the data
generated between the time of the bandwidth request sending and the time of the
bandwidth allocation by the BS. Therefore, the adaptive rtPs scheduler requires less
buffer size for the rtPS data queue.
In high load, the adaptive rtPS and weighted scheduler have the same performance. This is due to the saturation of the network.
4.4.8 Scheduler Ensuring QoS Requirements
4.4.8.1 Description of the Scheduling Proposal
In [14], a simple scheduler that ensures the QoS requirements for the different QoS
service classes is proposed. This scheduler consists of the allocation of the minimum
bandwidth requirements to all the connections and then the allocation of free slots to
the rtPS, nrtPS, and BE connections without exceeding their maximum bandwidth
requirements (see Fig. 4.7).
The number of slots to allocate to the UGS and ertPS is constant since the minimum and maximum bandwidth requirements of these connections are the same.
The minimum and maximum number of slots to allocate to the rtPS and nrtPS
connexions depends on the minimum and maximum bandwidth requirements, respectively. Since BE connection has no QoS requirements, its minimum number
of slots to allocate is null and its maximum number depends on its bandwidth
request.
After satisfying the minimum bandwidth requirements of all the connections, the
unused slots are allocated to the rtPS and nrtPS connections and then distributed
between the BE connections.
4.4.8.2 Performance Evaluation
When the system contains different type of QoS service classes, the simulations
results show that the proposed scheduler allocates the whole requested bandwidth
of the UGS and erTPS connections, provides a bandwidth greater than the minimum bandwidth requirements of the rtPS and nrtPS connections and the remaining
bandwidth is allocated to the BE connections.
The simulations results show that the proposed scheduler fairly distributes the
bandwidth between the different BE connections. The simulation results also show
that the throughput decreases when the number of the served connections increases.
This is due to the increase of the overhead size.
Despite of the change of the MCS used and therefore the number of slots to
reserve, the proposed scheduler provides the bandwidth requirements.
4
Scheduling Techniques for WiMax
77
Fig. 4.7 Main steps of a scheduler ensuring QoS requirements
4.4.9 Adaptive Bandwidth Allocation Scheme (ABAS)
4.4.9.1 Adaptive Bandwidth Allocation Scheme (ABAS) Description
An Adaptive Bandwidth Allocation Scheme (ABAS) for 802.16 TDD systems is
defined in [15]. It aims to dynamically determine the suitable downlink-to-uplink
bandwidth ratio. In fact, the IEEE 802.16 standard specifies the frame structure
but it is up to operators to choose the downlink-to-uplink bandwidth ratio. ABAS
78
A. Belghith and L. Nuaymi
performs as follows. The BS determines the different information of the downlink
and uplink connections such as their bandwidth requests and the number of downlink and uplink connections. Then, the BS determines the number of slots allocated
to the downlink and uplink subframe and adjusts the split between the two parts
of the frame. Finally, the BS informs the different SSs about its decision using DLMAP and UL-MAP MAC management messages. The mechanism is repeated at the
beginning of each frame.
4.4.9.2 Performance Evaluation
ABAS is compared with a static downlink to uplink bandwidth ratio mechanism.
Only Transmission Control Protocol (TCP) transfers and BE QoS service class are
considered. The results of the throughput of the downlink connections depending
on the number of TCP transfers show that ABAS provides better throughput. This is
because that ABAS determines the most appropriate value of the downlink to uplink
bandwidth ratio. On the other hand, the static downlink to uplink bandwidth ratio
mechanism can degrade the throughput if the initial static ratio is not suitable with
the traffic characteristics. Moreover, the number of subscribers in the system as well
as their connections characteristics can change every time.
The results of the throughput of the downlink and uplink connections depending
on the ratio of downloading to uploading TCP transfers show that ABAS also provides better throughput. This is due to the tacking into account the traffic characteristics in the determination of the suitable value of the downlink to uplink bandwidth
ratio.
4.4.10 Adaptive Polling Service (aPS)
4.4.10.1 Adaptive Polling Service (aPS) Description
A novel adaptive Polling Service (aPS) for WiMax system is defined in [16]. The
main idea of the proposed mechanism is to adjust the polling period based on the
reception of bandwidth request. The BS initializes the polling period with Tmin .
Tmin is determined using the average packet arrival rate. If the BS does not receive
bandwidth request after N polls, it exponentially increases the polling period until
reaching Tmax . Tmax is determined using the tolerable delay of the connection since
the aPS mechanism is defined for real-time applications. When the BS receives a
bandwidth request, it resets the polling period to Tmin .
4.4.10.2 Performance Evaluation
The aPS mechanism is compared with the rtPS mechanism defined in the IEEE
802.16 standard. The simulation results of an ON/OFF TCP traffic show that the
aPS mechanism reduces the signalling overhead by 50% to 66%. This reduction
comes from the increase of the polling period during the OFF periods. On the other
4
Scheduling Techniques for WiMax
79
hand, the aPS mechanism provides higher delay than the rtPS mechanism. However,
the delay is still acceptable for almost of the applications.
The simulations results of a TCP-based application show that the aPS mechanism
reduces the signalling overhead by 66%. Like for the ON/OFF traffic, the increase
of the delay is still acceptable.
The simulation results of an online game application working over User Datagram Protocol (UDP) shows that the aPS mechanism reduces the signalling overhead by 50–75%. However, the delay increases and becomes not suitable with all
the applications.
The increase of delay depends on the parameters of the aPS mechanism. In the
different scenarios, the authors investigates only Tmax and show that when Tmax
increases, the reduction of the signalling overhead and delay increase. Then, we can
choose the suitable value of Tmax depending on the tolerate delay.
4.4.11 Modified Maximum Signal-to-Interference Ratio
(mmSIR) Scheduler
4.4.11.1 Modified Maximum Signal-to-Interference Ratio (mmSIR)
Scheduler Description
In [17], a problem that may exist with the rtPS QoS class is highlighted. If the BS
allocates unicast request opportunities and resource grants for rtPS connections in
the same frame, the BS cannot immediately take into account the new length of
the uplink data connection of the subscriber. The reason is that the BS allocates
symbols for rtPS connections before receiving the latest unicast bandwidth request
(see Fig. 4.8).
Moreover, the mSIR scheduler serves those subscribers having the highest SIR
at each frame. So, subscribers having a slightly smaller SIR may be not served and
then the mean delay to deliver data increases. The proposed scheduler is based on the
Fig. 4.8 Allocation of symbols for rtPS connection
80
A. Belghith and L. Nuaymi
Fig. 4.9 Main steps of the
proposed mmSIR scheduler
modification the mSIR scheduler in order to decrease the mean time of sojourn and
called modified maximum Signal-to-Interference Ratio (mmSIR) scheduler. The
main idea of the mmSIR scheduler is that the BS only serves the subscribers that
do not have unicast request opportunities in the same frame. The main steps of this
proposed scheduler are shown in Fig. 4.9.
4.4.11.2 Performance Evaluation
The mmSIR scheduler is compared with the mSIR scheduler. Simulation results
show that the mmSIR provides a decrease in the mean sojourn time. This is mainly
due to the non freezing of the SSs having a small SIR. Indeed, the BS serves these
SSs when it has already allocated unicast request opportunities to SSs having a
higher SIR.
The simulation results also show that the mmSIR scheduler provides better
throughput. Indeed, the mmSIR scheduler, like the mSIR scheduler, favors those
4
Scheduling Techniques for WiMax
81
SSs having the highest SIR. If it does not serve an SS having unicast request
opportunities, it gives priority to other SSs having higher SIR. Furthermore, the
mSIR scheduler cannot immediately benefit from the unicast request opportunities
of SSs since it has already reserved resources for rtPS connections before receiving
the bandwidth requests. Moreover, the mmSIR scheduler serves fewer SSs than the
mSIR scheduler. As a preamble is added to each uplink burst (see Section 8.3.5.1
of Ref. [2]), the BS schedules more useful symbols when it serves fewer SSs per
frame.
4.5 Synthesis of Different Schedulers Deployed in WiMax
After presenting different scheduling methods as well as their performance evaluations, a synthesis of deployment of different schedulers is presented in Table 4.3.
If the BS can use a scheduler in downlink traffic, the SS can use the same kind of
scheduler in the uplink direction between its connections. In fact, in the two situations, the queues contents are well known. Therefore, the synthesis table contains
only the downlink and uplink schedulers in the BS (and not the uplink scheduler in
the SS).
Further to this synthesis, we can identify some schedulers that can be used for
the downlink or/and the uplink traffic.
The RR, mSIR, and Prorate scheduler are not suitable to use in a WiMax context
for most of the cases. Indeed, the RR scheduler is only suitable for subscribers that
have the same characteristics such as the SNR and the traffic load. The mSIR and
Prorate schedulers may block the traffic that is generated by subscribers having a
poor SIR value or less data, respectively.
The DRR scheduler can be used only in the downlink traffic because the BS does
not know the queue length of the subscribers. This prevents the BS to perform the
DRR scheduler for the uplink traffic.
The CAC is performed to control the connections that are transmitted by the
subscribers. So, the uplink scheduler with CAC mechanism is only proposed for the
uplink traffic.
The WRR, TRS, O-DRR, cross-layer, hybrid, and FRTS schedulers can be used
in the downlink and uplink traffic. An important research topic is the performance
evaluation intended to determine adequate values to the different parameters of these
schedulers. A use of the WRR or the hybrid (EDD+WFQ) schedulers requires the
determination of the suitable weights. The removal time, penalty time, and maximum number of repetitions are the main parameters of the TRS scheduler. Different
values of these parameters completely change the behaviour and performance of the
TRS scheduler. For the O-DRR scheduler, the polling interval and minimum threshold of the SINR parameters have an immediate impact on the delay and throughput,
respectively.
The adaptive rtPS and mmSIR are proposed for the rtPS QoS class in the uplink
direction. The parameters of the stochastic algorithm defined for the adaptive rtPS
scheduler.
82
A. Belghith and L. Nuaymi
Table 4.3 Synthesis of some WiMax schedulers
Scheduler
Possibility of
use for
WiMax
Comments
Algorithm parameters
Round Robin
No
–
Maximum SIR
Usually not
Prorate
Usually not
Not suitable. Subscribers do
not have the same traffic,
radio characteristics, and
QoS requirements.
Subscribers having a poor SIR
may be scheduled after an
excessive delay.
Subscribers, having less data,
may be scheduled after an
excessive delay.
Can be used for the downlink
and uplink traffic.
Can be used only for the
downlink traffic; BS does not
know the packet sizes at the
SS queues.
Can be used for the downlink
and uplink traffic.
Weighted Round
Yes
Robin
Deficit Round Robin Yes
Temporary Removal
Scheduler
Yes
Opportunistic Deficit Yes
Round Robin
Can be used for the downlink
and uplink traffic.
Uplink scheduler
with CAC
mechanism
Yes
Was proposed for the uplink
traffic.
Cross-layer
Yes
Hybrid
(EDD+WFQ)
Frame Registry Tree
Scheduler
Adaptive rtPS
Yes
Yes
Modified mSIR
Yes
Can be used for the downlink
and uplink traffic.
Can be used for the downlink
and uplink traffic.
Can be used for the downlink
and uplink traffic.
Was proposed for rtPS QoS
class in the uplink direction.
Was proposed for rtPS QoS
class in the uplink direction.
Yes
–
–
Static weights.
Fixed quantum.
Removal time (TR ),
number of repetitions
(L), and penalty time
(TP ).
Polling interval, and
minimum threshold
of the SINR (SINRth ).
Parameters of token
bucket, thresholds of
the AC used for the
nrtPS and BE
connections (TnrtPS
and TBE ).
–
Weights for WFQ
scheduler.
–
Stochastic prediction
algorithm.
–
4.6 Conclusion
In this chapter, we propose a state-of-the-art of WiMax Scheduling. We first present
the scheduling framework of WiMax and then describe different proposed trends
for WiMax scheduling algorithms. The choice of the scheduling algorithm is highly
dependent on the transmission service type and the traffic shape in addition to other
4
Scheduling Techniques for WiMax
83
QoS requirements. We propose a synthesis table for some of the proposed scheduling algorithms. Evidently, all the proposed WiMax scheduling algorithms could not
be studied in this chapter. The efficiency of a scheduling algorithm can be estimated
through simulations. We propose an NS-2 (Network Simulator) Module for WiMax
scheduling in [18]. The details of our WiMax module are presented in [19].
References
1. WiMax forum, http://www.wimaxforum.org/home/, last visited in 17-07-2008.
2. IEEE Std 802.16-2004, Part 16: Air interface for Fixed Broadband Wireless Access Systems,
1 October 2004.
3. IEEE Std 802.16e, Part 16: Air interface for Fixed and Mobile Broadband Wireless Access
Systems, 28 February 2006.
4. C. Cicconetti, L. Lenzini, E. Mingozzi, C. Eklund, “Quality of Service in IEEE 802.16 Networks”, IEEE Network – Special Issue on Multimedia Over Broadband Wireless Network,
Vol. 20, No. 2, pp. 50–55, March/April 2006.
5. C.F. Ball, F. Treml, X. Gaube, A. Klein, “Performance Analysis of Temporary Removal
Scheduling applied to mobile WiMax Scenarios in Tight Frequency Reuse”, The 16th Annual IEEE International Symposium on Personal Indoor and Mobile Radio Communications,
PIMRC’2005, Berlin, 11–14 September 2005.
6. H. K. Rath, A. Bhorkar, V. Sharma, “An Opportunistic DRR (O-DRR) Uplink Scheduling
Scheme for IEEE 802.16-based Broadband Wireless Networks”, IETE, International Conference on Next Generation Networks (ICNGN), Mumbai, 9 February 2006.
7. R. Jain, D. Chiu, W. Hawe, “A quantitative Measure Of Fairness And Discrimination For Resource Allocation In Shared Computer Systems”, DEC Research Report TR-301, September
1984.
8. T. Tsai, C. Jiang, C. Wang, “CAC and Packet scheduling Using Token Bucket for IEEE 802.16
Networks”, Journal of Communications, Vol. 1, No. 2, May 2006.
9. Q. Liu, X. Wang, G. B. Giannakis, A. Ramamoorthly, “A Cross-Layer Scheduling Algorithm With QoS Support in Wireless Networks”, IEEE Transactions on Vehicular Technology,
Vol. 55, No. 3, May 2006.
10. K. Vinay, N. Sreenivasulu, D. Jayaram, D. Das, “Performance Evaluation of End-to-end Delay
by Hybrid Scheduling Algorithm for QoS in IEEE 802.16 Network”, Wireless and Optical
Communications Networks, 2006 IFIP International Conference on, 11–13 April 2006.
11. D. Tarchi, R. Fantacci, and M. Bardazzi, “Quality of Service Management in IEEE 802.16
Wireless Metropolitan Area Network”, International Conference Communications, ICC’06,
Istanbul, Turkey, 11–15 June 2006.
12. S. A. Xergias, N. Passas, and L. Marekos, “Flexible Resource Allocation in IEEE 802.16
Wireless Metropolitan Area Networks”, the 14th IEEE Workshop on Local and Metropolitan
Area Networks, LANMAN 2005, Chania, Greece, 18–21 September 2005.
13. R. Mukul, P. Singh, D. Jayaram, D. Das, N. Sreenivasulu, K. Vinay, and A. Ramamoorthly,
“An Adaptive Bandwidth Request Mechanism for QoS Enhancement in WiMax Real Time
Communication”, Wireless and Optical Communications Networks, 2006 IFIP International
Conference on, Bangalore, India, 11–13 April 2006.
14. A. Sayenko, O. Alanen, J. Karhila, and T. Hämäläinen, “Ensuring the QoS Requirements in
802.16 Scheduling”, the 9th ACM international symposium on Modeling analysis and simulation of wireless and mobile systems, MSWiM 06, Malaga, Spain, 2–6 October 2006.
15. C. Chiang, W. Liao, and T. Liu, “Adaptive Downlink/Uplink Bandwidth Allocation in IEEE
802.16 (WiMax) Wireless Networks: A Cross-Layer Approach”, Global Telecommunications
Conference, 2007, GLOBECOM 07, Washington, USA, 26–30 November 2007.
84
A. Belghith and L. Nuaymi
16. C. Nie, M. Venkatachalam, X. Yang, “Adaptive Polling Service for Next-Generation IEEE
802.16 WiMax Networks”, Global Telecommunications Conference, 2007, GLOBECOM 07,
Washington, USA, 26–30 November 2007.
17. A. Belghith, L. Nuaymi, “Comparison of WiMax scheduling algorithms and proposals for
the rtPS QoS class”, 14th European Wireless 2008, EW2008, Prague, Czech Republic, 22–25
June 2008.
18. Design and implementation of a QoS included WiMax module for NS-2 simulator:
https://perso.enst-bretagne.fr/aymenbelghith/tools/, last visited in 17-07-2008.
19. A. Belghith and L. Nuaymi, “Design and implementation of a QoS included WiMax module for NS-2 simulator”, First International Conference on Simulation Tools and Techniques
for Communications, Networks and Systems, SimuTools 2008, Marseille, France, 3–7 March
2008.
Chapter 5
QoS Provision Mechanisms in WiMax
Maode Ma and Jinchang Lu
Abstract This chapter presents QoS support mechanisms in WiMax networks. Existing proposals with the state-of-the-art technology have been classified into three
main categories: QoS support architecture, Bandwidth management mechanism and
Traffic management mechanism. Representative schemes from each of the categories have been evaluated with respect to major distinguishing characteristics of
the WiMax MAC layer and PHY layer as specified in the IEEE 802.16d standard.
Future research issues and trends are also highlighted.
Keywords QoS Provisioning · WiMax · Traffic Scheduling · Admission Control
5.1 Background
Broadband Wireless Access (BWA) systems, e.g. IEEE 802.16d standard [1], provide fixed-wireless access between the subscriber station and the Internet service
provider (ISP) through the base station. BWA systems have been deployed not only
to be complement and expansion of existing last mile wired networks such as cable
modem and xDSL but also to be competitor to wired broadband access networks.
Due to the upcoming air interface technologies, which promise to deliver high transmission data rates, BWA systems become an attractive alternative.
The MAC Layer of IEEE 802.16d was designed for PMP broadband wireless
access applications. It is designed to meet the requirements of very-high-data-rate
applications with a variety of quality of service (QoS) requirements. The MAC
layer is composed of three sub-layers. From bottom to top: the Security Sub-layer
(PS), the MAC Common Part Sub-layer (CPS), and the Service Specific Convergence
Sub-layer (CS). The former deals with security and network access authentication
procedures. CPS carries out the key MAC functions. The CS sub-layer provides the
interface to the upper layer; decides the MAC service class for the specific connection and initializes the resource allocation requests of the CPS.
M. Ma (B)
Nanyang Technological University, Singapore
M. Ma (ed.), Current Technology Developments of WiMax Systems,
C Springer Science+Business Media B.V. 2009
DOI 10.1007/978-1-4020-9300-5 5,
85
86
M. Ma and J. Lu
The bandwidth request and grant mechanism has been designed to be scalable,
efficient, and self-correcting. The 802.16d does not lose efficiency when presented
with multiple connections per terminal, multiple QoS levels per terminal, and a
large number of statistically multiplexed users. It takes advantage of a wide variety
of request mechanisms, balancing the stability of contentionless access with the
efficiency of contention-oriented access.
The IEEE 802.16d PHY specifies 4 different PHY specifications, namely,
WirelessMAN-SC PHY specification, WirelessMAN-SCa PHY specification, WirelessMAN-OFDM PHY specification, WirelessMAN-OFDMA PHY specification.
IEEE 802.16d supports both frequency division duplex (FDD) and time division
duplex (TDD) PHYs.
The standard defines three different modulation schemes. On the uplink, support
for QPSK is mandatory, while 16-QAM and 64-QAM are optional. The downlink
supports QPSK and 16-QAM, while 64-QAM is optional. In addition to these modulation schemes, the 802.16d PHY also defines various forward error correction
(FEC) schemes on the uplink as well as the downlink. These include Reed-Solomon
(RS) codes, RS concatenated with inner Block Convolution Codes (BCC), and turbo
codes. Support for such a wide variety of modulation and coding schemes permits
vendors to tradeoff efficiency for robustness depending on the channel conditions.
The advanced technology of the 802.16d PHY requires equally advanced radio link
control (RLC), particularly the capability of the PHY to transition from one burst
profile to another. The RLC must control this capability as well as the traditional
RLC functions of power control and ranging.
Figure 5.1 [2, 3] shows the existing QoS architecture of IEEE 802.16d. Uplink
Bandwidth Allocation scheduling resides in the BS to control all the uplink packet
transmissions. The communication path between SS and BS has two directions:
uplink channel (from SS to BS) and downlink channel (from BS to SS). On the
downlink (from BS to SS), the transmission is relatively simple because the BS is
the only one that transmits packets during the downlink sub-frame.
The data packets are broadcasted to all SSs and an SS only picks up the packets destined to it. The uplink channel is shared by SSs. Time in the uplink channel is usually slotted (mini-slots) called by time-division multiple access (TDMA),
whereas on the downlink channel BS uses a continuous time-division multiplexing
(TDM) scheme. The BS dynamically determines the duration of these sub-frames.
Each sub-frame consists of a number of time slots. SSs and BS have to be synchronized and transmit data into predetermined time slots. On the uplink (from SS to
BS), the BS determines the number of time slots that each SS will be allowed to
transmit in an uplink sub-frame. This information is broadcasted by the BS through
the uplink map message (UL-MAP) at the beginning of each frame. UL-MAP contains information element (IE), which includes the transmission opportunities, i.e.
the time slots in which the SS can transmit during the uplink sub-frame. After receiving the UL-MAP, each SS will transmit data in the predefined time slots as indicated
in IE. The BS uplink-scheduling module determines the IEs using bandwidth request
PDU (BW-request) sent from SSs to BS.
5
QoS Provision Mechanisms in WiMax
87
Fig. 5.1 Existing QoS architecture of IEEE 802.16d
The 802.16d MAC provides QoS differentiation for different types of applications that might operate over 802.16d networks. The 802.16d standard defines the
following types of services:
Unsolicited Grant Services (UGS): UGS is designed to support Constant Bit
Rate (CBR) services, such as T1/E1 emulation, and Voice Over IP (VoIP) without
silence suppression.
Real-Time Polling Services (rtPS): rtPS is designed to support real-time services that generate variable size data packets on a periodic basis, such as MPEG
video or VoIP with silence suppression.
Non-Real-Time Polling Services (nrtPS): nrtPS is designed to support nonreal-time services that require variable size data grant burst types on a regular basis.
Best Effort (BE) Services: BE services are typically provided by the Internet
today for Web surfing.
Since IEEE 802.16d MAC protocol is connection oriented, the application first
establishes the connection with the BS as well as the associated service flow (UGS,
rtPS, nrtPS or BE). BS will assign the connection with a unique connection ID
(CID). The connection can represent either an individual application or a group
of applications (all in one SS) sending data with the same CID. All packets from
the application layer in the SS are classified by the connection classifier based on
CID and are forwarded to the appropriate queue. At the SS, the Scheduler will
retrieve the packets from the queues and transmit them to the network in the appropriate time slots as defined by the UL-MAP sent by the BS. The UL-MAP
is determined by the Uplink Bandwidth Allocation Scheduling module based on
the BW-request messages that report the current queue size of each connection
in SS.
88
M. Ma and J. Lu
IEEE 802.16d defines the required QoS signaling mechanisms such as BWRequest and UL-MAP, but it does not define the Uplink Scheduler, i.e. the mechanism that determines the IEs in the UL-MAP.
IEEE 802.16d defines the connection signaling (connection request, response)
between SS and BS but it does not define the admission control process. IEEE
802.16d medium access control, which is based on the concepts of connections and
service flows, specifies QoS signaling mechanisms (per connection or per station)
such as bandwidth requests and bandwidth allocation. However, IEEE 802.16d standard left the details of the QoS based packet-scheduling algorithms and reservation
management that determine the uplink and downlink bandwidth allocation, undefined. IEEE 802.16d PHY gives AMC and the conceptually power control. It also
left details of AMC and adaptive power control algorithm, undefined.
5.2 Overview of the Quality of Service
in WiMax Network
The QoS term can be interpreted in different ways. In general, QoS can be described from two perspectives: user perspective and network perspective. In user
perspective, QoS refers to the application quality as perspective by the user. In
network perspective, QoS refers the service quality that the network offers to applications or users in term of network QoS parameters that include: latency or delay of packets traveling across the network, reliability of packet transmission and
throughput.
From the network perspective, the networks’ goal is to provide the QoS services that adequately to meet the users’s needs while maximizing the network
resources’ utilization. To achive this goal, the networks analyze the application
requirements, manage the network resources and deploy various network QoS
mechanisms.
QoS parameters quantitatively represent the applications’s QoS requirements.
They are:
1.
2.
3.
4.
5.
Throughput
Delay
Delay jitter
Error rate
Packet loss rate
Networks may use a combination of QoS services, i.e., per-flow and quantitative, per-class and quantitative. Some networks may include multiple types of QoS
services in order to support a wide range of applications.
In recently years, QoS support architecture and QoS support algorithms for
WiMax system have been proposed [4–36]. They can be classified according to the
following taxonomy as shown in Fig. 5.2.
5
QoS Provision Mechanisms in WiMax
89
QoS Support Mechanisms in WiMAX
QoS Support Architecture
QoS Support Schemes
Traffic Handling
Bandwidth management
Cross
Layer
Approach
MAC - Higher layer
Bandwidth/
Resource
Reservation
Admission
Control
Cross layer
APA
Holonomic
Link Adaptation
Congestion
Avoidance
Scheduling
Buffer
tuning
Traffic
Policing
Cross layer
Hierarchical
Channel
access
Classification
Explicit congestion
notification
Tail-drop
Fig. 5.2 Hierarchical taxonomy of QoS mechanisms that support different level Quality of Service
in IEEE 802.16d
5.3 QoS Support Architecture in WiMax Networks
Downstream
Paper [4] proposed an inclusive architecture to support QoS mechanisms in IEEE
802.16 standard as shown in Fig. 5.3. Authors developed some compatible methods
for specific modules such as Scheduler, Traffic Shaper, and Request and Grant Manager to optimize Delay, Throughput and Bandwidth Utilization metrics.
In paper [5], authors proposed MAC layer cross to network upper layer QoS
framework in the downlink mode and uplink mode to provide QoS support in
WiMax networks as shown in Figs. 5.4 and 5.5. The proposed cross-layer QoS
framework integrated L3 and L2 QoS in the IEEE 802.16 network. Main functional
blocks in the framework include: QoS mapping from L3 to L2, Admission control,
Fragment Control, and Remapping. Fragment Control handles the data frames from
the same IP datagram as a group in L2 operations to reduce useless transmission.
Remapping is designed for more flexible use of L2 buffers by changing the mapping
rules from IP QoS to L2 service type under congested situation of the rtPS queue.
Base Station
Upstream
Upstream Analyzer
Downstream Analyzer
Connection
Establishment
Request
Data
Service
Specification
Total Grant
UpLink
Service
Flow Data
Base
Data
Subscriber Station
Call Admission Control
Classifier
Bandwidth
Request
Shaper and Policer
UpLink
Service
Flow Data
Base
DownLink
Service
Flow Data
Base
Grant
Allocator
UGS
rPS
nrtPS
Classifier
Shaper and Policer
UGS
BE
rPS
nrtPS
BE
Polling
Manager
Downlink
Scheduler
Uplink
Scheduler
Request Generator
Connection
Requests
Request
Selector
UP Stream
Generator
Upstream
Fig. 5.3 The proposed architecture to provide QoS in IEEE 802.16 standards
Downstream
Generator
Downstream
90
M. Ma and J. Lu
Fig. 5.4 Cross-layer QoS
framework in the downlink
mode in WiMax
Fig. 5.5 Cross-layer QoS
framework in the uplink
mode in WiMax
Paper [6] proposed cross-layer design frameworks for 802.16e OFDMA systems
that are compatible with WiBro based on various kinds of cross-layer protocols
for performance improvement: a cross-layer adaptation framework and a design
example of primitives for cross-layer operation between its MAC and PHY layers as shown in Fig. 5.6. In the proposed model, the MAC layer contains a user
grouper, scheduler, and resource controller. Each functional entity exploits physical layer information to increase system throughput. The physical layer consists
of a diversity channel PPDU controller, AMC channel PPDU controller, control
information controller, and HARQ functional blocks. AMC subchannel users and
diversity subchannel users are classified by the user grouper. Since the properties
of AMC subchannels and diversity subchannels are quite different, the grouping of
users into two channel types is essential if system throughput is to be increased.
5
QoS Provision Mechanisms in WiMax
91
Fig. 5.6 Cross layer adaptation scheme for efficient resource allocation in WiMax
The scheduler determines the scheduling of users and the quantity of packets that
should be scheduled in the current frame. For cross-layer optimization, the scheduler
should be designed to exploit not only PHY information but also application layer
information.
5.4 Bandwidth Management QoS Mechanisms
in WiMax Networks
Bandwidth management mechanisms are mechanisms that manage the network resources by coordinating and configuring network devices’ traffic handling mechanism. The main mechanisms are:
1. Resource reservation
2. Connection admission control
3. Cross layer approach bandwidth management mechanisms
92
M. Ma and J. Lu
5.4.1 Resource Reservation Mechanisms
Resource reservation mechanisms inform the network entities on the QoS requirements of the applications using the network resources. The network devices will
use this information to manage the network resources in order to meet such requirements. The resource reservation mechanisms include the following functions:
1. provision of resource reservation signaling that notifies all devices along the
communication path on the mulitimedia application’s QoS requirements.
2. Delivery of QoS requirements to the connection admission control mechanism
that decides if there are available resoureces to meet the new request QoS requirements.
3. Notification of the application regarding the admission result.
The representive proposal tailored for WiMax is Dynamic Resource Reservation
(DRR) scheme [7] as shown in Fig. 5.7. The basic principle of DRR [7] is: the
reserved bandwidth will vary between a minimum and a maximum value as per the
bandwidth utilized by the clients. The proposal is able to optimize reservation and
utilization of bandwidth for Committed Bandwidth (CB) type traffic. However, it is
very difficult to select parameters Cm and T. And the fluctuations of the reserved
bandwidth from CM to Cm will increases signaling costs.
Fig. 5.7 The amount of
reserved bandwidth varies
according to the number of
active flows
5.4.2 The Connection Admission Control Mechanism
Admission control is a network Quality of Service (QoS) procedure. Admission
control determines how bandwidth and latency are allocated therefore need to be
implemented between network edges and core to control the traffic entering the
network. The role of CAC is to control the number of connection flows into the
network. A new connection request is progressed only when sufficient resources are
available at each successive network element to establish the connection through
the whole network based on its service category, traffic contract, and QoS, while
5
QoS Provision Mechanisms in WiMax
93
the agreed QoS of all existing connections are still maintained. Admission control
is useful in situations where a certain number of connections may all share a link,
while an even greater number of connections causes significant degradation in all
connections to the point of making them all useless such as in congestive collapse.
The proposed CAC schemes [8–13, 30] can be classified mainly into two strategies. The first one based on service degradation. It would consist in gracefully degrading existing connections to make room for the new one [8–13]. The second
strategy is without degradation strategy. It would maintain the QoS provided for ongoing connections and simply reject the new service flow if no sufficient resources
are available [30].
This first category of CAC schemes include all the CAC algorithms based on
service degradation [8], bandwidth borrowing [9–12], or bandwidth stealing [13]
strategies. The main idea of these policies is to decrease—when necessary and
possible—the resources provided to ongoing connections in order to be able to accept a new service flow. The strategy could be combined by a threshold-based capacity sharing approach in order to avoid starvation [13] or a guard channel strategy that
reserves a dedicated amount of bandwidth for more bandwidth-sensitive flows [12].
The second category [30] has no graceful service degradation of existing connections to accept a new flow. Thus, a new connection is accepted only if (1) it
will receive QoS guarantees in terms of both bandwidth and delay—for real-time
flows—and (2) the QoS of existing connections is maintained.
Paper [11] proposed R-CAC which is characterized by defining thresholds of
allocated bandwidth at BS for each class of service based on the priority of the
service. The proposal introduced two parameters, denoted as Cu and Cr as shown
in Fig. 5.8. Cu is the bandwidth exclusively reserved for UGS service, which is
allocated with the highest priority in the four service classes supported in IEEE
802.16d networks. Cr is the bandwidth exclusively reserved for UGS and rtPS to
mitigate the bandwidth competition coming from the other two types of service.
The residual bandwidth (i.e., C – Cu – Cr) is the only part that a BS can assign
to the nrtPS connection requests to meet their minimum bandwidth requirements,
while it can also be assigned to UGS and rtPS services.
C: total bandwidth of the system
Cu: Bandwidth that only can be used by UGS connections
Cr: Bandwidth that only can be used by UGS and rtPS connections
C – Cu – Cr: bandwidth that can used by UGS, rtPS and nrtPS connections
Fig. 5.8 Proposed R-CAC
bandwidth allocation scheme
94
M. Ma and J. Lu
D-CAC [12] is a Priority Support-based CAC. The proposed scheme can give the
highest priority for UGS flows and maximizes the bandwidth utilization by bandwidth borrowing and degradation. Token bucket based CAC [13] is to control each
connection. The connection is controlled by two token bucket parameters: token rate
ri (bps) and bucket size bi (bits). When a traffic flow wants to establish a connection
with BS, it sends these two parameters to BS and waits for response from BS. An
extra parameter, delay requirement di , will be sent by rtPS flow.
The proposed call admission control algorithm is detailed as followings:
Step 1. Calculate the remainder uplink capacity Cremain : Cremain = Cuplink -CUGS CrtPS -CnrtPS -CBE .
Step 2. Compare Cremain to the bandwidth requirement of the new connection.
If there is enough capacity, accept it. If not, go to Step 3.
Step 3. First look at the connections that belong to lower classes than this new
connection. If there is a class that uses more capacity than its threshold, calculate CL, which means how much capacity can be stolen from it. If the sum
of CL and Cremain is greater than or equal to the bandwidth requirement of
this new connection, accept it. If not, look at if the capacity occupied by the
class of the new connection is less than its threshold. If not, deny it.
In order to avoid starvation of some classes, the proposal suggested that a threshold is set for each class. Combining with a proper scheduler, Token bucket based
CAC can reserve bandwidth needed by real-time flows and thus delay requirements
of rtPS flows can be promised.
Other CAC schemes like Binary search approach fairly allocating bandwidth
CAC [14] used Gaussian model for aggregated traffic in large network and Chernoff
bound method to obtain upper bound blocking probability. Based on the analysis
result, binary search approach was applied to solve the problem that given a total bandwidth, fairly allocating bandwidth to each class of multimedia traffic in
802.16d MAN. The total bandwidth (C) is completely portioned for four classes
of traffic, and the partition value Ci(i = 1, 2, 3, 4) is calculated by above binary
search algorithm using Chernoff bound. If a new connection of UGS and BE arrives
at SS, it send request to BS for bandwidth. It is granted bandwidth if the new aggregated bandwidth including this connection is less than Ci(i = 1, 2, 3, 4). Else,
it is blocked. If a new connection of rtPS and nrtPS arrives at SS, the connection
is always admitted, but the burst within the connection will be blocked when the
total used bandwidth larger than Ci(i = 2, 3). This mechanism can guarantee the
pre-required upper bound blocking probability for UGS and BE connections, and
the burst blocking probability for rtPS and nrtPS.
5.4.3 Cross Layer Approach Bandwidth Management Mechanism
There is a few prior works that deals with MAC cross to the higher layers scheduling, i.e. the MAC to application and transport layers. Paper [15] aims at providing
5
QoS Provision Mechanisms in WiMax
95
end to end QoS guarantee using IntServ and DiffServ in connection oriented
WiMax PMP and mesh networks. The work maps the RSVP in the IP layer and
DSA/DSC/DSD in MAC layer. The author proposed that message exchange for
DSA and DSC can be deployed to carry QoS parameters of IntServ services for
end-to-end resource (bandwidth/buffer) reservation. For DiffServ services, on the
other hand, a number of per-hop behaviors (PHBs) for different classes of aggregated traffic can be mapped into different connections directly.
When a new application flow arrives in IP layer, it is firstly parsed according
to the definition in PATH message (for InteServ) or Differentiated Services Code
Point (DSCP for DiffServ); then classified and mapped into one of four types of
services (UGS, rtPS, nrtPS or BE). The proposed dynamic service model in SS
sends a request message to the BS, where the admission control determines whether
this request is approved or not. If it is not approved, the service module informs the
upper layer to deny this service; else the admission control notifies the scheduling
module to make a provision based on the parameter values in the request message.
At the same time the accepted service is transferred into a traffic grooming module.
According to the grooming result, the SS will send Bandwidth Request message to
BS. The centralized scheduling module in BS will retrieve the requests and generate
UL-MAP message carrying the bandwidth allocation results. Finally, the SS will
package SDUs from IP layer into PDUs and upload them in its allocated uplink
slots to BS.
Figure 5.9 shows the PATH, RESERV messages for IntServ. Here the sender
sends a PATH message including traffic specification (TSpec) information. Parameters such as max/min bounds for bandwidth, delay and jitter is mapped into parameters of the DSA message such as Maximum Sustained Traffic Rate, Minimum
Reserved Traffic Rate, Tolerated Jitter and Maximum Latency. According to the
response received for the DSA message, the provisioned bandwidth can also be
mapped into Reserved Specification (RSpec) in the RESV message. These parameters can be used at the MAC scheduler to allocate resources according to the QoS
requirements of flows along their path.
Fig. 5.9 Traffic classification and mapping for IntServ services
96
M. Ma and J. Lu
5.5 Traffic Handling Mechanisms QoS Support
in WiMax Networks
Traffic handling mechanisms are mechnism that classsify, handle, police and monitor the traffic across the network. The main mechanisms are:
1.
2.
3.
4.
5.
6.
7.
Classification
Channel access
Traffic policing
Buffer management
Congestion avoidance
Packet scheduling
Cross layer APC
5.5.1 Traffic Classification
The classification mechanism identifies and separates different traffic into flows or
group of flows. Therefore each flow or group of flows can be handled differently.
Application traffic is identified by the classification mechanism and is forwarded to
the appropriate queue awaiting service from other mechanism such as traffic shaping
and packet scheduling. The granularity level of the classification mechanism can be
per-user, per-flow or per-class depending on the type of QoS services provided. To
identify and classify the traffic, the traffic classification mechanism requires some
form of tagging or marking of packets.
Paper [16] proposed two- stage packet classification algorithm. Authors suggested that prefix-based fields and range-based fields should be processed separately
in two stages. In the first stage, packets are classified by a matching scheme with
their prefix-based fields, while other range-based fields are processed by a rangebased scheme in the second stage. The Prefix-Matching-Tree (PMT) used in the
first stage to handle prefix-based fields. The PMT is constructed by a prefix-based
matching scheme that can speedup the searching process by simultaneously processing multiple prefix-based fields. Each tree node of the first stage is connected to
the second stage according to protocol types (TCP or UDP). The Range-MatchingTree(RMT) is employed to deal with range-based fields in the second stage.
5.5.2 Channel Access Mechansim
In wireless networks, all hosts communicate through a shared wireless medium.
When multiple hosts try to transmit packets on the shared communication channel,
collisions can occur. Therefore, wireless networks need a channel access mechanism which controls the access to the shared channel.collision-based chanael such as
Random access and collision-free channel access such as TDMA or Polling channel
access mechanism can provide different QoS services.
5
QoS Provision Mechanisms in WiMax
97
In IEEE802.16d, there are two access protocols based on multi-channel slotted
Aloha and periodic polling. The former is a contention based access protocol, while
the latter provides periodic polling services without contention, such as unsolicited
grant service (UGS), e.g., Voice over IP and real time or non-real time services. In
addition, IEEE802.16d allows unicast-polling for a single SS or multicast-polling
for groups of SSs as periodic polling service.
In paper [17], the performance of IEEE802.16d Random Access Protocol is evaluated by using Transient Queueing Analysis. The paper derived the random access
success probability from the system equilibrium. Retransmission probability is also
derived by including a binary exponential backoff algorithm. In paper [18], authors
considered a capacity allocation scheme of periodic polling services for a multimedia traffic in an IEEE802.16d system. Considering a base station assigns a subscriber
station contiguous M uplink subframes for uplink traffic transmission and v vacation frames for saving power and opportunities for other subscriber stations, they
proposed a capacity allocation scheme for a multimedia traffic in WiMax network.
The bandwidth allocated to an SS will be returned to a BS, when the SS’s queue
is empty during M contiguous uplink subframes. The returned bandwidth will be
allocated to other types of services requested from the multichannel slotted Aloha.
5.5.3 Traffic Policing
The traffic policing is the mechanism that monitors the admitted sessions’ traffic so
that the sessions do not violate their QoS contract. The traffic policing mechanism
makes sure that all traffic that passes through it will confirm to agreed traffic parameters. In case vialation is found, a traffic poling mechanism is enforced by shaping the
traffic and dropping traffic to enforce compliance with that contract. Traffic sources
which are aware of a traffic contract sometimes apply Traffic Shaping in order to
ensure their output stays within the contract and is thus not dropped. Due to fact that
traffic policing shapes the traffic based on some known quantative traffic parameters,
multimetedia (real-time) application are naturally compatible to traffic policing.
Most multimedia application traffic (Voice, video) is generated by a standard codec
which generally provides certain knowledge of the quantitative traffic parameters.
Traffic policing can be applied to individual multimedia flows. Non-real time traffic
does not provide quantitative traffic parameters and usaually demands bandwidth
as much as possible. Therefore, traffic policing enforces non-real time traffic based
on network policy. Such policing is usually enforced on aggregated non-real time
traffic flows. Traffic policing, in cooperation with other QoS mechanisms usually,
can provide QoS support.
In [19], a new traffic shaping based on concept of “Fair Marker”(FM) was proposed to enforce fairness among distinct flows. FM controls token distribution from
the token bucket to the flows originating from the same subscriber network. The FM
explores the duality between packet queueing and token bucket utilization. Fairness
in token distribution is a function of the fair allocation algorithm used by FM. In
98
M. Ma and J. Lu
order to reach this purpose, it records information regarding the consumption of
tokens by the monitored flows.
5.5.4 Buffer Management
Buffer management refers to any particular discipline used to regulate the occupancy
of a particular queue where packets may be held (or dropped). Buffer is set to improve link utilization and system performance, but it also increases packet’s queue
delay. With the increase of user demands for service quality, providing stable and
low delay has been the primary requirement of real-time services. The most important and easy to control part of total delay is queue delay. So how to set the capacity
of the buffer, how to efficiently control buffer length while network circumstance
is dynamic, and how to achieve the tradeoff between throughput and queue delay
are the important problems to be solved in buffer management and QoS control of
whole networks. At present, support [20] for wired and wireless network is included
for drop-tail (FIFO) queueing, Random Early Detection (RED) buffer management,
class based queueing (CBQ) (including a priority and round-robin scheduler), and
variants of Fair Queueing including Fair Queueing (FQ), Stochastic Fair Queueing
(SFQ), and Deficit Round-Robin (DRR). RED is the most intensive researched class
of AQM (Active Queue Management), it selectively discards packets of some flows
based on probability determine.
In WiMax networks, the base station (BS) is a likely bottleneck for downlink
(DL) TCP connections due to difference in available bandwidth between the fixed
network and the wireless link. This may result in buffer overflows or excessive delays at the BS, as these buffers are connection-specific. In order to avoid buffer
overflows, different Active Queue Management (AQM) methods may be applied at
the BS. Paper [21] analyzed of RED; Packet Discard Prevention Counter (PDPC)
and time-to-live based RED AQM mechanisms and proved that they are indeed very
useful: AQM reduces considerably DL delays at the WiMax BS without sacrificing
TCP throughput.
5.5.5 Congestion Control
Congestion control concerns controlling traffic entry into a network, so as to avoid
congestive collapse by attempting to avoid oversubscription of any of the processing or link capabilities of the intermediate nodes and networks and taking resource
reducing steps, such as reducing the rate of sending packets. In congestion control, the packet loss information can serve as an index of network congestion for
effective rate adjustment, but in a wireless network environment, common channel
errors due to multipath fading, shadowing, and attenuation may cause bit errors
and packet loss, which are quite different from the packet loss caused by network
5
QoS Provision Mechanisms in WiMax
99
congestion. Therefore wireless packet loss can mistakenly lead to dramatic performance degradation.
If the link capacity in one system is temporarily degraded due to a high traffic
load in the WLAN system (congestion) or due to interference, two effects, leading
to inefficiency on the IEEE802.16d link, could occur:
r
r
Loss of data due to buffer overflow and therewith unnecessary retransmissions.
Waste of bandwidth due to unused reserved transmission opportunities.
To avoid the above-mentioned effects, a congestion control mechanism needs
to be worked out to dynamically adapt the QoS demands of a connection during runtime for a specifically defined period of time. Paper [22] proposed Dynamic Service Change (DSC) congestion control mechanism to support the Explicit
Congestion Notification mechanism in future deployment of TCP. The paper contributed to IEEE 802.16-REVd D1 standard by adding MAC DSC TEMP.request
and MAC DSC TEMP.indication message in MAC entity to provide the temporary
traffic reduction mechanism to overcome congestion effect.
Since network congestion is directly related to the congestion packet loss, packet
loss can be caused by either congestion loss or wireless channel errors, resulting
from mulitipath fading, shadowing, or attenuation. New approach of congestion
control over wireless network is to perform packet loss classification so that congestion control algorithms can more effectively adapt the sending rate based on
congestion loss instead of from wireless loss. Paper [23] considered two packet loss
classes, congestion loss and wireless loss and proposed packet loss classification
(PLC) method based on the trend of ROTT (relative one-way trip time) to assist
packet loss classification in the ambiguous area of ROTT distribution.
By taking advantage of the QoS features offered by one of the four proposed
WiMax service flow arrangement, paper [24] aimed at more flexible layer constructing and subscription while reliable in diverse channel conditions and fitting users’
demand. Through effective integration of packet loss classification (PLC) [23], endto-end available bandwidth probing, congestion control via layered structure and
packet level FEC, for layered multicast applications over WiMax for disseminating
scalable extension of H.264/AVC compressed video is proposed. The optimality
comes from the best tradeoff of number of video layers subscription with number of
additional FEC packets insertion simultaneously to satisfy the estimated available
bandwidth and wireless channel error condition.
5.5.6 Packet Scheduling Algorithm
Packet scheduling refers to the decision process used to choose which packets
should be serviced or dropped. Packet scheduling is the process of resolving contention for bandwidth. A scheduling algorithm has to determine the allocation of
bandwidth among the users and their transmission order. One of the most important
100
M. Ma and J. Lu
tasks of a scheduling scheme is to satisfy the Quality of Service (QoS) requirements
of its users while efficiently utilizing the available bandwidth.
Many legacy scheduling algorithms, capable of providing certain guaranteed
QoS, have been developed for wireline networks. However, these existing service
disciplines, such as fair queueing scheduling, virtual clock, and EDD, are not directly applicable in wireless networks because they do not consider the varying
wireless link capacity and the location-dependent channel state. The characteristics of wireless communication pose special problems that do not exist in wireline
networks. These include:
1)
2)
3)
4)
5)
high error rate and bursty errors;
location-dependent and time-varying wireless link capacity;
scarce bandwidth;
user mobility; and
power constraint of the mobile hosts.
All of the above characteristics make developing efficient and effective scheduling algorithms for wireless networks very challenging.
WiMax networks provide services for heterogeneous classes of traffic with different quality of service (QoS) requirements. Currently, there is an urgent need
to develop new technologies for providing QoS differentiation and guarantees in
WiMax networks. Among all the technical issues that need to be resolved, packet
scheduling in WiMax networks is one of the most important.
In this sub-section, we assess proposed scheduling algorithms for QoS support in
WiMax networks thoroughly with respect to the characteristics of the IEEE 802.16d
MAC layer and PHY layer. We classify those scheduling algorithms in WiMax into
three categories: holonomic approach [25–28]; hierarchical approach [29–34] and
cross-layer approach [35–38] with respect to the nature of scheduling algorithm
mechanism as holonomic approach uses single layer scheduling scheme, in contrast,
hierarchical approach uses several layers or stages scheduling schemes and cross
layer approach uses information from several layers in OSI model. Each of three
categories can be classified as per–flow, per-class, per-packet and hybrid scheduling
algorithms. Representative schemes in each of these categories will be discussed
next.
5.5.6.1 Holonomic Packet Scheduling Algorithm
Paper [25] applied holonomic approach and proposed one layer hybrid scheduling
scheme which combines per-flow and per-class scheduler termed as “Frame Registry Tree Scheduler” (FRTS). The proposal aims at providing differentiated treatment to data connections, based on their QoS characteristics. This approach focuses
on properly preparing future transmitted frames by using a tree based approach. The
tree consists of six levels; root, time frame, modulation, subscriber, QoS service and
connection level. First level is taken to be the root. The second level represents
time frames immediately after the current time frame. The third level represents the
available modulation types. The fourth level organizes all the connections according
5
QoS Provision Mechanisms in WiMax
101
to the SS each SS has one uplink node and one downlink node at this level. The fifth
level organizes the connections according to their QoS. The last level consists of
leaves for each active connection queue. The data structure presented achieves time
frame creation and reduces the processing needs at the beginning of each frame.
The algorithm schedules each packet at the last time frame before its deadline. This
allows more packets to be transmitted and hence an increased throughput. This
method also avoids fragmentation of transmissions to/from the same SS or same
modulation. Another good feature is its ability to handle changes in the connection
characteristics like modulation type or service type of the channel.
In [26], the authors proposed a Token Bank Fair Queueing (TBFQ) scheduling
algorithm at packet level for BWA systems as shown in Fig. 5.10. TBFQ uses the
priority index Ei/ri to keep track of the normalized service received by backlogged
flows. Ei is the number of tokens exchanged between the ‘bank’ and the flow i. Ei
is negative if the flow continues to borrow tokens from the bank to serve the traffic
that exceeds its average rate.
Ei is positive if the traffic is below its average rate. The flows are first served
based on their token generation rate to guarantee the throughput and latency, and
then the remaining bandwidth is distributed based on their priority index. The parameters (debt limit, credit burst, and creditable threshold) determine the dynamic
behavior of the algorithm. TBFQ can be adapted to operate under varying channel
error conditions. It has demonstrated its effectiveness in achieving fairness, maximizing channel utilization, and fast convergence to guaranteed throughput. Its ability to serve and isolate real-time traffic and data traffic that is under severe error
conditions makes it a suitable candidate as the wireless packet scheduling algorithm
for BWA systems.
ri
P1
λ1
Ei
D1
r2
Token
Denk
Size B
P2
λ2
E2
D2
rn
Wireless
Terminals
Pn
λ3
En
D3
Fig. 5.10 TBFQ Algorithm
102
M. Ma and J. Lu
In order to maximize throughput of non-real-time traffics with satisfying QoS
requirements of real-time traffics, paper [27] proposed urgency and efficiency based
packet scheduling (UEPS) algorithm which was designed not only to support multiple users simultaneously but also to offer real-time and non-real-time services
to a user at the same time. The UEPS algorithm uses the time-utility function
as a scheduling urgency factor and the relative status of the current channel to
the average one as an efficiency indicator of radio resource usage. The proposed
packet scheduler assigns priorities to the packets to be transmitted, based on the
channel status reported by the user equipments as well as the QoS statistics maintained by the BS. Since the scheduler works in a global timeline, a time utility
function (TUF) is used for the scheduling. Two scheduling factors, the urgency of
scheduling and the efficiency of radio resource usage, are used to schedule RT and
NRT traffic packets at the same time. The TUF is used to represent the urgency of
scheduling while the channel state is used to indicate the efficiency of radio resource
usage.
There are three steps in the UEPS scheduling algorithm. In the first step, the incoming packets are stored in the buffer corresponding to the SS and the traffic type.
The QoS profiles of each arrived packet, such as the arrival time, deadline, packet
type, head of line (HOL) delay, and packet size are also maintained. In the next step,
at each scheduling instance, the urgency factor of each HOL packet of each buffer
is calculated from the TUF. The TUF of a real-time traffic is a straight line up till
a threshold with a dead drop. Because it is a hard and discontinuous function in
delay, the unit change of utility can not be obtained directly at its delay time. Thus a
continuous TUF having straight line up till a threshold with a gradual z-shaped drop
is used instead. The gradual decay occurs in the marginal scheduling time interval
(MSTI) which is a small time window of delay jitters around the deadline. This
relaxed z-shaped function is given by U RT (t) = e−a(t−c) /(1+e−a(t−c) ) where a and c
are the parameters which determine the slope and location of the point of inflection.
The unit change of utility of a real time traffic at the inflection point (t = c) is given
by |U ’ RT (t = c)| = a/4, and this value forms the urgency factor. For non real
time traffics, the TUFs are monotonic decreasing functions in time (delay). TUF of
a non-real time traffic is f N RT (t) = 1 − ex p(at)/ex p(D) where D is the maximum
time used for normalization purpose. The resulting urgency function is |U ’N RT (t)| =
aex p(at)/ex p(D). Once the urgency has been calculated, the highest urgency factor
for an SS out of the four buffers for that SS is taken as the representative for that
user. The efficiency factor of each SS is then calculated. It is a moving average of the
channel state of the SS, given by R(t) = (1 − 1/W )R’(t − 1) + (1/W )R(t), where
R(t) is the channel state at time t, R’(t) is the scheduling priority value of each SS
is calculated by p(t) = U ’(t)∗ (R(t)/R’(t)). As a last step, based on the priorities
calculated for each SS, the top n number of packets having the highest priorities
are transmitted, where n is the number of different streams the OFDMA can send
simultaneously.
Paper [28] proposed a new per-flow based scheduling algorithm, referred as Service Criticality (SC) based scheduling scheme. SC is based on a dual of buffer occupancies at nodes and allowable latencies for a particular service. In the proposed
5
QoS Provision Mechanisms in WiMax
103
scheme, a flow would receive the service through bandwidth allocation depending
on degree of service criticality (SCindex ) computed at SS and conveyed to BS during
bandwidth request burst of UL. The core of the proposed SC scheme is the way SS
computes the SCindex for active flows existing at node. The computation of SCindex
depends on both, the buffer occupancy and latency experienced by flow. Proposed
scheme employs linear dependence on buffer occupancy and tunable sigmoid like
relation with experienced latency to compute SCindex . SCindex encompasses two service parameters, maximum allowable latency and permissible packet loss and it
is derived from two elements, referred to as Service Desperation (SD) and Buffer
Occupancy (BO). SD denotes urgency of bandwidth allocation or inversely denotes
the amount of time a flow (service) can tolerate not being provisioned. BO denotes
current level up to which flow buffer is full with respect to allocated buffer. Both of
these elements are normalized over all the different flows in the system. The normalization process ensures fairness amongst multiple flows. Normalization also implies
that SD and BO denote a ratio between 0 and 1. The maximum of SD and BO is
chosen as SCindex such that when SCindex is close to 1 the flow must be provisioned,
else it will be timed out.
5.5.6.2 Hierarchical Scheduling Scheme
In paper [29], the issue of differentiated service provisioning will be addressed
with the non-real-time polling service in WiMax systems. The proposed solution
has been designed to have an ability to accommodate integrated traffic in the networks with effective scheduling schemes. A hierarchical scheduling algorithm to
provide service differentiation to enhance the nrtPS service in WiMax systems was
proposed. In order to meet the time constraints of real-time messages as much as
possible and avoid scheduling starvation of the non-real-time messages, the data
transmission scheduling has been divided into two levels, inter-class scheduling and
intra-class scheduling as shown in Fig. 5.11.
With the objective to provide service differentiation between the real-time and
non-real-time classes of traffic, the proportional delay differentiation (PDD) model
was proposed as inter-class scheduling algorithm. Intra-class scheduling scheme
was designed as a priority assignment scheme based on tardy rate, the message with
less transmission time will have higher priority to be served. The message which
Fig. 5.11 Structure of two
levels hieratical scheduling
scheme
104
M. Ma and J. Lu
Fig. 5.12 Hierarchical
structure of bandwidth
allocation
has been delayed a longer time in the queue will also have higher priority to be
transmitted. With this scheme, the total time for messages to stay in the network
could be reduced and the starvation of the messages with longer transmission time
could be avoided.
Paper [30] proposed a hybrid scheduling algorithm that combines EDF, WFQ and
FIFO scheduling algorithms. The overall allocation of bandwidth is done in a strict
priority manner. EDF scheduling algorithm is used for SSs of the rtPS class, WFQ
is used for SSs of the nrtPS class and FIFO for SSs of the BE class. In paper [31],
authors enhanced the proposal scheduling architecture in [30], the scheduling architecture is similarly divided into two layers as shown in Fig. 5.12. The first layer is
for bandwidth requests. The authors suggested a Deficit Fair Priority Queue (DFPQ)
for scheduling at this layer. The second layer scheduling is for the data traffic. UGS
are not scheduled because they already have a reserved bandwidth. For the other
three traffic classes, a hybrid of scheduling algorithm is proposed. The authors suggested Earliest Deadline First (EDF) for rtPS traffic, where the packets with earliest
deadline are scheduled first. For nrtPS, WFQ is proposed. The bandwidth left is
allocated to each BE traffic in a round robin (RR) manner.
Compared with fixed bandwidth allocation, the proposed solution [31] improves
the performance of throughput under unbalanced uplink and downlink traffic. And
better performance in fairness can be achieved by the proposed DFPQ algorithm
than strict PQ scheduling.
Paper [32] extended the scheduling architecture in paper [31]. It proposed a preemptive DFPQ scheduling algorithm that enhances the DFPQ algorithm proposed
in [31], and improves the performance of the rtPS service flow class. The Preemptive
DFPQ defines for each non-preemptive queue a Quantum Critical (Q crit ) to give the
queue another chance to service critical packets. Q crit value is a percentage of the
original value of the queue’s quantum. Queues are allowed to use Q crit to serve
critical packets only. The processing of critical packets continues until the Q crit of
the non-preemptive queue becomes less than or equal to zero. Q crit is initialized
5
QoS Provision Mechanisms in WiMax
105
only once per frame and not at every round like the quantum Q. This algorithm
gives more chances to rtPS packets to get serviced before the expiration of their
deadlines.
The authors in [33] proposed an architecture consisting of three schedulers. The
first scheduler is concerned with UGS and rtPS flow, as well as rtPS and nrtPS
polling flow. An EDF scheduling is applied in this scheduler. The second scheduler is concerned with flows requiring a minimum bandwidth mainly nrtPS. WFQ
scheduling is used here where the weight is the size of the requested bandwidth. The
third scheduler is used for BE traffic and here too a WFQ scheduling is employed
where the weight is the traffic priority. Among the schedulers, the first level has the
highest priority, and only after all the packets have been served, is the second scheduler considered. The third scheduler comes when the first two have become free.
The delay and delay jitter character for UGS, rtPS, nrtPS and BE can be improved
simultaneously using the proposed architecture.
In Paper [34] authors considered a scheduling algorithm should possess the
following features: efficient link utilization, bounded delay, enough fairness, high
throughput, low implementation complexity, graceful performance degradation,
strong isolation, more delay/bandwidth decoupling, and flexible scalability and
proposed solution follows the framework specified in the IEEE 802.16d standard
with the following unique features as shown in Fig. 5.13. (1) The Pre-scale Dynamic Resource Reservation (PDRR) scheme is proposed to allocate bandwidth to
UL subframe and DL subframe dynamically. (2) The Priority-based Queue Length
Weighted (PQLW) scheduling algorithm was proposed for inter-class scheduling
and the Max-Min Fair Sharing (MMFS) scheduling was introduced for inter-SS
scheduling within each class of service at the BS as Tier 1 scheduling. (3) The
Self-Clocked Fair Queuing (SCFQ) and Weighted Round Robin (WRR) scheduling schemes have been applied to inter-connection scheduling within each class of
service at each SS as Tier 2 scheduling. (4) Earliest Deadline First (EDF) and Shortest Packet Length First (SPLF) scheduling have been applied to packet scheduling
within each of the connections carrying burst traffic as Tier 3 scheduling.
5.5.6.3 Cross-Layer QoS Scheduling for WiMax Networks
Wireless communication systems have unique characteristics – namely, timingvarying channel conditions and multi-user diversity. New MAC design and new
scheduling solutions need to be developed that are specifically tailored for this Wireless communication environment [35]. Opportunistic MAC (OMAC) is the modern
view of communicating over spatiotemporally varying wireless link. The cross-layer
nature embeds OMAC with the potential to revolutionize the design of wireless data
networks from physical to data link layers.
The wireless resources (bandwidth and power) are more scarce and expensive
than their wired counterparts, because the overall system performance degrades dramatically due to multi-path fading, Doppler, and time-dispersive effects caused by
the wireless air interface. Unlike wired networks, even if large bandwidth/power is
allocated to a certain wireless connection, the loss and delay requirements may not
106
M. Ma and J. Lu
Fig. 5.13 Proposed 3-tier scheduling framework
be satisfied when the channel experiences deep fades. In this scenario, the scheduler
plays extremely important role. An OMAC seeks to pick among competing users
the one who is currently experiencing the relatively best channel conditions in each
scheduling instant. The judicious schemes should be developed to support prioritization and resource reservation in wireless networks, in order to enable guaranteed
QoS with efficient resource utilization.
Cross-layer MAC designs tailored for WiMax have been proposed [36–38]. Some
researchers have considered cross layer scheduling using the MAC scheduler and
the PHY resource allocator. In paper [36], authors proposed a cross layer design
of packet scheduling and resource allocation in OFDMA wireless networks which
concentrates on downlink scheduling in the BS. In OFDMA systems, each carrier
is subdivided into a number of sub-carriers which can be controlled or allocated
separately making the PHY very robust. In the proposed system, the sub carriers are
grouped into allocation units (AU) for allocation so that overheads are minimized.
The BS estimates the sub channel condition of each user and allocated resources
to the users on a frame-by-frame basis. The authors considered a system where
some SS have real time traffic and other systems have non-real time traffic, i.e. real
time and non-real time traffic do not co-exist in the same SS. The BS can estimate
the channel gain of each user on a sub channel and an AU can be independently
allocated to a particular user. The aim is to maximize the overall utilization while
satisfying the rate requirements of individual users. To do this, author in [36] formulates a linear programming method and subsequently obtain a sub-optimal solution
which reduces the computational time. The scheme also proposes a packet scheduler
5
QoS Provision Mechanisms in WiMax
107
at the BS MAC layer which provides equal priority to both real time and non-real
time traffic except if the ratio of the waiting time of a real time packet in the MAC
queue and the delay constraint of the packet exceeds a certain threshold. Associated with cross-layer packet scheduler, the paper [36] proposed a 3-stage resource
allocation algorithm where the first stage schedules the urgent packets. The second
stage schedules the non-real time packets and the real-time packets which are not
urgent, higher priority is given to users whose channel quality is better regardless
of the traffic type. The third stage allocates the unallocated AU’s if any. After the
packet scheduler decides the rate requirements of each user, the actual resources
are allocated in the PHY layer. This is carried out by using a sub-optimal heuristic
algorithm which first allocates the sub-channels (or subcarriers) constraints in order
to maximize the utilization (or minimize the transmission power). After that, the
algorithm relocates (or swaps) sub-channels so as to satisfy the rate requirements of
each user. Though this kind of cross layer scheme can be followed in the downlink
at the BS, it cannot be adopted for uplink scheduling since individual nodes cannot
decide the channel condition and place request for those particular channels.
A priority-based scheduler [37] was proposed at the medium access control
(MAC) layer for multiple connections with diverse QoS requirements, where each
connection employs adaptive modulation and coding (AMC) scheme at the physical
(PHY) layer. The priority-based scheduler is termed as priority function (PRF) for
each connection admitted in the system and update it dynamically depending on the
wireless channel quality, QoS satisfaction, and service priority across layers. Thus,
the connection with the highest priority is scheduled each time. The connection with
the highest priority is scheduled each time.
Efficient bandwidth utilization for a prescribed PER performance at the PHY
can be accomplished with AMC schemes, which match transmission parameters
to the time-varying wireless channel conditions adaptively and have been adopted
by WiMax networks. Authors defined Transmission Mode(TM) through the information of adaptive modulation and coding scheme according to wireless channel
condition abstracted from IEEE802.16d standard as shown in Table 5.1.
To simplify the AMC design, authors approximated the PER expression in
AWGN channels as
P E Rn (γ ) ≈
1, i f γ ≤ γ pn
an exp(−gn γ ), i f
γ ≥ γ pn
(5.1)
where n is the mode index and γ is the received SNR. Parameters an , gn are modedependent. With packet length N b = 128 bytes/packet, the fitting parameters for
transmission modes in TM are provided in Table 5.1.
AMC design guarantees that the PER is less than or equal to Minimum PER by
determining minimum SNR required boundary and updating the transmission mode
as in Table 5.1.
Authors further developed a cross-layer opportunistic scheduling algorithm
termed as priority function (PRF) to schedule rtPS, nrtPS, and BE connections.
108
M. Ma and J. Lu
Table 5.1 Transmission modes in the IEEE 802.16D standard
Mode n
1
2
3
4
5
6
Modulation
RS Code
CC Code Rate
Coding Rate Rc
Rn (bits/symbol)
an (dB)
gn
γ pn (dB)
QPSK
(32,24,4)
2/3
1/2
1.0
232.9242
22.7925
3.7164
QPSK
(40,36,2)
5/6
3/4
1.5
140.7922
8.2425
5.9474
16QAM
(64,48,8)
2/3
1/2
2.0
264.0330
6.5750
9.6598
16QAM
(80,72,4)
5/6
3/4
3.0
208.5741
2.7885
12.3610
64QAM
(108,96,6)
3/4
2/3
4.0
216.8218
1.0675
16.6996
64QAM
(102,108,6)
5/6
3/4
4.5
220.7515
0.8125
17.9629
Each connection i, where i denotes the connection identification (CID) of rtPS,
nrtPS, and BE services, adopts AMC at the PHY. Given a prescribed PER ξ i, the
SNR thresholds γ pn (1), for connection i are determined by setting P0 = ξ i. Thus,
the possible transmission rate (capacity), i.e., the number of packets that could be
carried by Nr time slots for connection i at time t (frame index), can be expressed as
Ci(t) = Nr Ri(t)
(5.2)
where Ri(t) is the number of packets that can be carried by one time slot and is
determined by the channel quality of connection i via AMC as in Table 5.1. Either
Ri(t) or Ci(t) indicates the channel quality or capacity, which is accounted for by the
scheduler.
At the MAC, the scheduler simply allocates all Nr time slots per frame to the
connection
i = arg max ϕi(t)
(5.3)
where ϕi(t) is the PRF for connection i at time t, which is specified differently for
rtPS and nrtPS and BE service classes. If multiple connections have the same value
max {ϕi(t)}, the scheduler will randomly select one of them with even opportunity.
For each rtPS connection, the scheduler timestamps each arriving packet according to its arrival time and defines its timeout if the waiting time of such a packet in
queue is over the maximum latency (deadline) Ti. The PRF for a rtPS connection i
at time t is defined as:
⎧ R (t)
1
i
⎪
⎨βr t R N Fi (t) , If Fi (t) ≥ 1, Ri (t) = 0
ϕi(t) = βr t ,
If Fi (t) < 1, Ri (t) = 0
⎪
⎩
0
Ri (t) = 0
(5.4)
ε where βr t ε[0, 1] is the rtPS-class coefficient and Fi(t) is the delay satisfaction
indicator, which is defined as:
Fi (t) = Ti − ⌬Ti − Wi (t) + 1
(5.5)
5
QoS Provision Mechanisms in WiMax
109
With ⌬Ti ε[0, Ti ] denoting the guard time region ahead of the deadline Ti and
W i(t)ε[0, Ti ] denoting the longest packet waiting time, i.e., the head of the line
(HOL) delay. If Fi(t) ≥ 1, i.e., W i(t)ε[0, T i − ⌬T i], the delay requirement is
satisfied, and the effect on priority is quantified as 1/Fi(i)ε[0, 1]: Large values of
Fi(t) indicate high degree of satisfaction, which leads to low priority. If Fi(t) < 1,
i.e., W i(t)ε[T i − ⌬T i, T i], the packets of connection i should be sent immediately
to avoid packet drop due to delay outage, so that the highest value of PRF βr t is set.
Parameter R N = max{Ri(t)}, and the factor Ri(t)/R N ε[0, 1] quantifies the normalized channel quality because high received SNR induces high capacity, which
results in high priority. When Ri(t) = 0, the channel is in deep fade and the capacity
is zero, so that connection i should not be served regardless of delay performance.
The value of ϕi(t) for rtPS connection i lies in [0, βr t ].
For each nrtPS connection, guaranteeing the minimum reserved rate ηi means
that the average transmission rate should be greater than ηi. In practice, if data of
connection i are always available in queue, the average transmission rate at time t is
usually estimated over a window size tc based on (5.3) and (5.4) as:
η̂i (t + 1) =
η̂i (t)/(1 − 1/tc )
η̂i (t)/(1 − 1/tc ) + Ci (t)/tc
If i = i ∗
If i = i ∗
(5.6)
In order to guarantee η̂i(t) ≥ ηi during the entire service period. The PRF for an
nrtPS connection i at time t is defined as:
⎧
Ri (t) 1
⎪
⎪
, If Fi (t) ≥ 1,
⎪βnr t
⎪
⎪
R N Fi (t)
⎨
Ri (t) = 0
ϕi(t) =
(5.7)
⎪
⎪
,
If
F
(t)
<
1,
R
(t)
=
0
β
⎪
nr
t
i
i
⎪
⎪
⎩0
Ri (t) = 0
where βnr t ε [0, 1] is the nrtPS-class coefficient, and Fi(t) is the ratio of the average
transmission rate over the minimum reserved rate.
Fi(t) = η̂i(t)/ηi.
(5.8)
Quantity Fi(t) here is the rate satisfaction indicator. If Fi(t) ≥ 1, the rate requirement is satisfied, and its effect on priority is quantified as 1/Fi(t)ε [0, 1]. If
Fi(t) < 1, the packets of connection i should be sent as soon as possible to meet
the rate requirement; in this case, the upper-bound value βnrt is set for ϕi(t). Once
again, the value of ϕi(t) lies in [0, βnrt].
For BE connections, there is no QoS guarantee. The PRF for a BE connection i
at time t is
φi (t) = β B E
Ri (t)
RN
(5.9)
110
M. Ma and J. Lu
where βBEε [0, 1] is the BE-class coefficient. Notice that ϕi(t) varies in [0, βBE],
which only depends on the normalized channel quality regardless of delay or rate
performance. The role of βrtPS, βnrtPS, and βBE is to provide different priorities
for different QoS classes. For example, if the priority order for different QoS classes
is rtPS > nrtPS > BE, the coefficients can be set under the constraint βrtPS >
βnrtPS > βBE; e.g., βrtPS = 1.0 > βnrtPS = 0.8 > βBE = 0.6. Thus, the QoS
of connections in a high-priority QoS class can be satisfied prior to those of a lowpriority QoS class because the value of ϕi(t) for QoS unsatisfied connections will
equal the upper-bound βrtPS, βnrtPS, and βBEforrtPS, nrtPS, and BE connections,
respectively.
The purpose of normalizing ϕi(t) in [0, βrtPS], [0, βnrtPS], and [0, βBE], respectively, is to provide comparable priorities among connections with different
kinds of services, which enable exploiting multiuser diversity among all connections
with rtPS, nrtPS, and BE services.
In paper [38], authors enhanced the proposal in [6] by proposing an optimal
resource allocation scheme and an opportunistic scheduling rule similar as in paper
[37] that can satisfy the QoS requirements of the application layer and optimize
MAC-PHY cross-layer performance. The main concept of the proposed Optimal
Resource Allocation is to solve optimization problem.
Assume that a downlink OFDM system with N subchannels and M time slots.
There are K users, J connections and L packets in the system. The objective of the
resource allocation is to maximize the overall system throughput while guaranteeing
the provision of QoS, which is formulated into the following constrained optimization problem:
arg
max
Ci (m,n),g( j)
M
N
L
Ci (m, n)Ri (m, n)
(5.10)
i=1 m=1 n=1
subject to
Ci (m, n) − 1 ≤ 0,Ci (m, n) ∈ {0, 1}∀m, n
(5.11)
i
Wi ≤ T j ∀i, i → j
g( j) ≥
Cmin ( j)
, P j (t) , ∀ j
d( j)
(5.12)
(5.13)
where Ci (m, n) identifies whether packet i is allocated to slot (m, n) and Ci (m, n)
is equivalent data rate packet i can obtain on this slot. Since CSI is usually assumed
to keep constant per frame, it simplifies as Ri (n). (5.11) is to ensure one slot can
only be allocated to one packet while (5.12) and (5.13) correspond to the QoS requirements in terms of delay and throughput. Here Tj and Cmin ( j) are maximum
latency of rtPS connection and minimum reserved data rate of nrtPS connection
respectively with d(j) being connection j’s packet length and Pj(t) being number of
5
QoS Provision Mechanisms in WiMax
111
packets present in connection j. Moreover, Wi denotes waiting time of packet i and
g(j) is number of connection j’s scheduled packets.
5.5.7 MAC-PHY Cross Layer Approaches with APA and CAC
Appropriate power control can not only reduce power consumption, but also improve system capacity by adjusting coverage ranges and improve spatial reuse efficiency. Higher transmission rates require higher SINR to maintain the same bit
error rate. Due to this close relationship between rate and channel condition, incorporating transmission rate selection into MAC design is another promising way to
increase the system performance.
Paper [39] considered Adaptive Power Allocation (APA) emphasizes how to
share the limited power resource of base station among different WiMax subscribers
and further influences the access bandwidth of each subscriber; CAC highlights how
to assign a subscriber’s access bandwidth to different types of applications. Authors
suggested that APA and CAC have to work cooperatively to provide cross-layer
resource management to build a WiMax access network. A power allocation scheme
that produces optimal revenue and this is known as the optimal revenue criterion was
studied. In order to investigate the APA revenue of a certain scheme, the revenue rate
of each type of service as the revenue generated by a bandwidth unit was defined.
Let rerUGS , rerrtPS , rernrtPS , and rerBE be the revenue rates of the following,
respectively:
r
r
r
r
Unsolicited Grant Service
Real-Time Polling Service
Non-Real-Time Polling Service
Best-Effort Service
Obviously, different services have different prices due to their specific QoS requirements. As a result, r er U G S , r er r t P S , r er nr t P S , and r er B E always take distinct
values. To maximize the APA revenue, the potential revenue of each subscriber,
which is defined as the revenue that could be achieved if all arriving traffic is served,
must be investigated. The potential revenue of a given subscriber k is determined by
the amount of UGS, rtPS, nrtPS, and BE traffic load in its local network and the price
of service (i.e., r er U G S , r er r t P S , r er nr t P S , and r er B E ). Let T Lk D denote the arriving downlink traffic load in subscriber k’s local network, and suppose this traffic load
can generate potential revenue R Dk . Then, the revenue-to-bandwidth ratio of the kth
subscriber is defined as RBRkD = RDk /TLk D . Since different WiMax subscribers can
have different amount of UGS, rtPS, nrtPS, and BE traffics in their local networks,
they hold distinct revenue-to-bandwidth ratios. The optimal revenue-criterion-based
APA optimization has inherent preference to allocate more power resource to the
sub-carriers that belong to the subscriber of high revenue-to-bandwidth ratio.
112
M. Ma and J. Lu
5.6 Summary
This chapter presents various QoS support mechanisms in WiMax networks. Existing proposals with state-of-art technology have been classified into three main categories: QoS support architecture; Bandwidth management mechanism and Traffic
handling mechanism. Representative schemes from each of the categories have been
evaluated with respect to major distinguishing characteristics of the WiMax MAC
layer and PHY layer as specified in the IEEE 802.16d standard.
Since scheduling algorithms provide mechanisms for bandwidth allocation and
multiplexing at the packet level. Admission control and congestion control policies
are all dependent on the specific scheduling disciplines used. For the uplink traffic,
the scheduling algorithm has to work in tandem with Call Admission Control (CAC)
to satisfy the QoS requirements. The CAC algorithm ensures that a connection is
accepted into the network only if its QoS requirements can be satisfied as well as
the performance of existing connections in the network is not deteriorated.
The computational complexity of a proposed algorithm strongly influences its
scalability. We suggest that the QoS support framework in WiMax network could
be hierarchical structure.
Since opportunistic MAC (OMAC) is the modern view of communicating over
spatiotemporally varying wireless link whereby the multi-user diversity is exploited
rather than combated to maximize band width efficiency or system throughput. The
cross-layer nature embeds OMAC with the potential to revolutionize the design of
wireless data networks from physical to data link layers.
We suggest that cross-layer opportunistic scheduling can combine with adaptive
power control scheme to provide QoS support in WiMax.
Different mechanisms can address different issues in QoS support in WiMax
network. How to combine Bandwidth management mechanisms; Traffic handling
mechanisms in a cross-layer struture to provide new QoS support scheme in WiMax
are open issues.
References
1. “IEEE Standard for Local and Metropolitan Area Networks Part 16: Air Interface for
Fixed Broadband Wireless Access Systems,” IEEE Std 802.16–2004 (Revision of IEEE Std
802.16-2001), pp:1–857, 2004.
2. A. Ghosh, David R. Wolter J. G. Andrews and Runhua Chen, “Broadband Wireless Access
with WiMax/802.16: Current Performance Benchmarks and Future Potential,” Communications Magazine, IEEE Volume 43, Issue 2, Feb. 2005, pp:129–136.
3. Dong-Hoon Cho, Jung-Hoon Song, Min-Su Kim, and Ki-Jun Han, “Performance Analysis of
the IEEE 802.16 Wireless Metropolitan Area Network,” First International Conference on Distributed Frameworks for Multimedia Applications, 2005, DFMA ’05, pp:130–136, Feb. 2005.
4. Alavi, H.S.; Mojdeh, M., Yazdani, N. “A Quality of Service Architecture for IEEE 802.16Standards,” Asia-Pacific Conference on Communications, pp:249–253, Oct. 2005.
5. Yi-Ting Mai; Chun-Chuan Yang; Yu-Hsuan Lin, “Cross-Layer QoS Framework in the IEEE
802.16 Network,” The 9th International Conference on Advanced Communication Technology,
Volume 3, pp:2090–2095, Feb. 2007.
5
QoS Provision Mechanisms in WiMax
113
6. T. Kwon, H. Lee, S. Choi, J. Kim, and D. Cho, “Design and Implementation of a Simulator
Based on a Cross-Layer Protocol between MAC and PHY layers in a WiBro Compatible
IEEE802.16e OFDMA System,” IEEE Communication Magazine, Dec. 2005, Vol. 43, no.12,
pp:136–146.
7. K. Gakhar, M. Achir, A. Gravey, “Dynamic Resource Reservation in IEEE 802.16 Broadband
Wireless Networks,” IWQoS 2006, Jun. 2006, pp:140–148.
8. Y. Ge and G.-S. Kuo, “An Efficient Admission Control Scheme for Adaptive Multimedia Services in IEEE 802.16e Networks,” In IEEE 64th Vehicular Technology Conference, VTC-2006,
pp: 1–5, Sept. 2006.
9. D. Niyato and E. Hossain, “Radio Resource Management Games in Wireless Networks:
An Approach to Bandwidth Allocation and Admission Control for Polling Service in IEEE
802.16,” IEEE Wireless Communications, 14(1), Feb. 2007.
10. L. Wang, F. Liu, Y. Ji, and N. Ruangchaijatupon, “Admission Control for Non-preprovisioned
Service Flow in Wireless Metropolitan Area Networks,” In Fourth European Conference on
Universal Multiservice Networks, ECUMN ’07, pp:243–249, Feb. 2007.
11. H. Fen; H. Pin-Han; S. Xuemin; “WLC17-1: Performance Analysis of a Reservation Based
Connection Admission Scheme in 802.16 Networks,” IEEE GLOBECOM’06, Nov. 2006,
pp:1–5.
12. H. Wang; W. Li; D.P. Agrawal, “Dynamic admission control and QoS for 802.16 wireless
MAN,” Wireless Telecommunications Symposium, April, 2005, pp:60–66.
13. C.-H. Jiang; T.-C. Tsai, “Token bucket based CAC and packet scheduling for IEEE 802.16
broadband wireless access networks,” Consumer Communications and Networking Conference, CCNC 2006, Volume 1, pp:183–187, 2006.
14. H. Wang; B. He; D.P. Agrawal, “Admission control and bandwidth allocation above packet
level for IEEE 802.16 wireless MAN,” Parallel and Distributed Systems, 2006. ICPADS 2006,
Jul. 2006.
15. J. Chen, W. Jiao, and Q. Guo, “An integrated QoS control architecture for IEEE 802.16 broadband wireless access systems,” in Proc. Global Telecommunication Conf., (Globecom) 2005,
Vol. 6 pp:3330–3335, 2005.
16. W.T. Chen; S.B. Shih; J.L. Chiang, “A Two-Stage Packet Classification Algorithm,”
Advanced Information Networking and Applications, 2003. AINA 2003, Mar. 2003,
pp:762–767.
17. S. Jun-Bae; L. Hyong-Woo; C. Choong-Ho, “Performance of IEEE802.16 Random Access
Protocol - Transient Queueing Analysis,” IEEE Global Telecommunications Conference,
2006, GLOBECOM’06, pp:1–6, Nov. 2006.
18. J.-B. Seo; S.-J. Kim; H.-W. Lee; C.-H. Cho, “An Efficient Capacity Allocation Scheme of
Periodic Polling Services for a Multimedia Traffic in an IEEE802.16 System,” Mobile Adhoc
and Sensor Systems (MASS) 2006, pp:11–20, Oct. 2006.
19. Luı́s Felipe M. de Moraes and Paulo Ditarso Maciel Jr,” An Alternative QoS Architecture for
the IEEE 802.16 Standard,” www.ravel.ufrj.br/arquivosPublicacoes/conext06.pdf.
20. Y. Chen; L. Li “A Random Early Expiration Detection Based Buffer Management Algorithm
for Real-time Traffic over Wireless Networks,” Computer and Information Technology, 2005,
CIT 2005, pp:507–511, Sept. 2005.
21. J. Lakkakorpi; A. Sayenko; J. Karhula; O. Alanen; J. Moilanen. “Active Queue Management
for Reducing Downlink Delays in WiMax,” IEEE Vehicular Technology Conference, 2007,
VTC-2007, 66th Volume, pp:326–330 , Fall 2007.
22. M. Engels, P. Coenen (IMEC). Christian Hoymann, “Congestion control mechanism for
interworking between WLAN and WMAN,” IEEE C802.16d-03/83. Congestion Control.
wirelessman.org/tgd/contrib/C80216d-03 83.pdf.
23. H.-F. Hsiao; A. Chindapol; J.A. Ritcey; Yaw-Chung Chen; Jenq-Neng Hwang, “A new
multimedia packet loss classification algorithm for congestion control over wired/wireless
channels,” Acoustics, Speech, and Signal Processing, 2005. ICASSP ’05, Volume 2, pp:ii/1105
- ii/1108, Mar. 2005.
114
M. Ma and J. Lu
24. C.-W. Huang; J.-N. Hwang; D.C.W. Chang, “Congestion and error control for layered scalable video multicast over WiMax,” IEEE Mobile WiMax Symposium, 2007, pp:114–119,
Mar. 2007.
25. S.A. Xergias; N. Passas; L. Merakos “Flexible resource allocation in IEEE 802.16 wireless
metropolitan area networks,” Local and Metropolitan Area Networks, 2005. LANMAN 2005,
pp:6pp, Sept. 2005.
26. W.K. Wong; H. Tang; Shanzeng Guo; Leung, “Scheduling algorithm in a point-to-multipoint
broadband wireless access network,” Vehicular Technology Conference, 2003. VTC 2003, Volume 3, pp:1593–1597. Fall 2003.
27. S. Ryu; B. Ryu; H. Seo; M. Shi, “Urgency and efficiency based wireless downlink packet
scheduling algorithm in OFDMA system,” IEEE Vehicular Technology Conference, 2005, 61st
Volume 3, pp:1456–1462, May. 2005.
28. A. Shejwal; A. Parhar, “Service Criticality Based Scheduling for IEEE 802.16 WirelessMAN,”
The 2nd International Conference on Wireless Broadband and Ultra Wideband Communications (AusWireless 2007), pp:12–12, Aug. 2007.
29. M. Ma, B.C. Ng, “Supporting Differentiated Services in Wireless Access Networks,” Communication systems, ICCS 2006, pp:1–5. 2006.
30. K. Wongthavarawat, A. Ganz, “Packet scheduling for QoS support in IEEE 802.16 broadband
wireless access systems”, International Journal of Communication Systems, vol. 16, issue 1,
pp:81–96, Feb.2003.
31. J. Chen, W. Jiao, H. Wang, “A service flow management strategy for IEEE 802.16 broadband
wireless access systems in TDD mode,” IEEE International Conference, ICC 2005. Volume:
5, pp:3422–3426, 2005.
32. H. Safa.; H. Artail.; M. Karam.; R. Soudan.; S. Khayat, “New Scheduling Architecture for
IEEE 802.16 Wireless Metropolitan Area Network,” IEEE/ACS International Conference on
Computer Systems and Applications, 2007. AICCSA07, pp:203–210, May. 2007.
33. N. Liu; X. Li; C. Pei; B. Yang, “Delay Character of a Novel Architecture for IEEE 802.16
Systems,” Proceedings of the Sixth International Conference on Parallel and Distributed Computing, Applications and Technologies (PDCAT’05), pp:293–296, Dec. 2005.
34. M. Ma, J. Lu, Sanjay Kumar Bose, and Boon Chong Ng. “A Three-Tier Framework and
scheduling to Support QoS Service in WiMax,” Information, Communications & Signal Processing, 2007, 6th International Conference, pp:1–5, Dec. 2007.
35. X. Liu, “Optimal Opportunistic Scheduling in Wireless Networks”. IEEE 58th Vehicular Technology Conference, 2003, Vol. 3, pp:1417–1421, Oct. 2003.
36. J. Sang, D. Jeong, and W. Jeon, “Cross-layer Design of Packet Scheduling and Resource Allocation in OFDMA Wireless Multimedia Networks,” in Proc. 63r d Vehicular Technology Conf.
(VTC) 2006, pp:309–313, 2006.
37. Q. Liu, X. Wang and G. B. Giannakis, “A Cross-Layer Scheduling Algorithm With QoS Support in Wireless Networks,” IEEE Transactions on Vehicular Technology, May. 2006, Vol. 55,
no.3, pp:839–847.
38. L. Wan, W. Ma, Z. Guo, “A Cross-layer Packet Scheduling and Subchannel Allocation Scheme
in 802.16e OFDMA System,” Wireless Communications and Networking Conference, 2007,
WCNC 2007, pp:1865–1870, Mar. 2007.
39. B. Rong Y. Qian Hsiao-Hwa Chen , “Adaptive power allocation and call admission control in
multiservice WiMax access networks,” IEEE Wireless Communications, Feb. 2007, Volume:
14, Issue: 1, pp:: 14–19.
Chapter 6
Mobile WiMax Performance Optimization
Stanislav Filin, Sergey Moiseev and Mikhail Kondakov
Abstract The Mobile WiMax system is a promising solution for delivering broadband wireless access services to mobile users. Radio resource management (RRM)
algorithms play a key role in the Mobile WiMax network. The Mobile WiMax network has a number of distinct features that complicate the use of conventional RRM
algorithms. We propose load-balancing approach to RRM in the Mobile WiMax network. To illustrate the advantages of the load-balancing approach, we present RRM
algorithms, including call admission control, adaptive transmission, horizontal handover, and dynamic bandwidth allocation algorithms. These algorithms jointly maximize the network capacity and guarantee users quality-of-service requirements.
Keywords Mobile WiMax · OFDMA · Performance optimization · Loadbalancing · System load · Quality-of-service · Radio resource management · Call
admission control · Adaptive transmission · Handover · Dynamic bandwidth
allocation
6.1 Introduction
IEEE standards 802.16 [1] and 802.16e [2] specify the requirements for the medium
access control (MAC) and physical (PHY) layers of the WiMax and Mobile WiMax
systems. These systems are attracting huge interest as a promising solution for delivering fixed and mobile broadband wireless access services. The standards have
incorporated such key technologies as quality-of-service (QoS) mechanisms, adaptive coding and modulation, power control, selective and hybrid automatic repeat
request, orthogonal frequency division multiplexing (OFDM) and orthogonal frequency division multiple access (OFDMA), support of adaptive antenna systems
and multiple-input multiple-output transmission. This provides great potential for
satisfying users and operators needs.
S. Filin (B)
National Institute of Information and Communications Technology, 3-4, Hikarino-oka, Yokosuka,
239-0847, Japan
M. Ma (ed.), Current Technology Developments of WiMax Systems,
C Springer Science+Business Media B.V. 2009
DOI 10.1007/978-1-4020-9300-5 6,
115
116
S. Filin et al.
From a user’s perspective, a wireless system should deliver his/her data with the
required QoS level, while an operator aims at maximizing network capacity and
revenue [3]. These two goals are achieved by radio resource management (RRM)
algorithms. These algorithms play a key role in the Mobile WiMax system but their
complexity is high due to a lot of degrees of freedom and optimization opportunities.
RRM in the OFDMA-based Mobile WiMax network includes call admission
control, adaptive transmission, handover, and dynamic bandwidth allocation
algorithms. Call admission control algorithm handles system overloading and satisfies users QoS by limiting the number of users in the system [4]. Adaptive transmission algorithms enable QoS-guaranteed opportunistic data transmission over a
wireless medium [5]. They include scheduling, adaptive coding and modulation,
power control, and time-frequency resource allocation. Seamless horizontal handover guarantees continuous service by assigning new serving base stations to a user
during his/her mobility and system load variations. Dynamic bandwidth allocation
algorithm distributes signal bandwidth within a group of sectors to balance their
load.
The Mobile WiMax network has a number of distinct features that complicate
the use of conventional RRM algorithms. Users may have multiple service flows
with different traffic and QoS requirements, be in different receiving conditions,
and use different coding and modulation schemes and transmission power values.
Consequently, it is difficult to determine the time-frequency and power resources
required for the given number of users. This is the main challenge of the call admission control algorithm. In adaptive transmission algorithms, the key problems
are computational intensity due to a large number of degrees of freedom, complicated frame structure, and complex MAC and PHY layers processing procedures.
Traditional horizontal handover algorithms are based on the received signal level
or signal-to-interference-plus-noise ratio (SINR). However, such handover algorithms neither guarantee QoS requirements nor maximize the capacity in the Mobile
WiMax OFDMA network. In the Mobile WiMax network several sectors may form
a group of sectors sharing the same signal bandwidth by using different groups of
subcarriers. This provides additional degree of freedom for optimizing network capacity and QoS. Therefore, RRM algorithms taking into account the distinct features
of the Mobile WiMax OFDMA network should be provided.
We describe load-balancing approach to RRM in the Mobile WiMax OFDMA
network, which is based on our system load model [6]. This model takes into account different traffic, QoS requirements, and receiving conditions of the users and
efficiently combines time-frequency and power resources, as well as downlink and
uplink resources in the expression for the system load. To illustrate the advantages of
the load-balancing approach, we present RRM algorithms, including call admission
control, adaptive transmission, horizontal handover, and dynamic bandwidth allocation algorithms. We demonstrate the advantages of our algorithms over the conventional ones by means of system level simulation. Each algorithm individually and all
algorithms as a whole satisfy QoS requirements and maximize the network capacity.
We define the network capacity as the maximum achievable network throughput
when QoS requirements are satisfied for all the users served.
6
Mobile WiMax Performance Optimization
117
First, we describe our system load model for the Mobile WiMax OFDMA network. Then, based on this system load model we present call admission control,
adaptive transmission, horizontal handover, and dynamic bandwidth allocation algorithms for the Mobile WiMax OFDMA network.
6.2 System Load Model
A system load model is traditionally used in call admission control algorithms.
System load characterizes the degree of system resources consumption. When all
system resources have been consumed, new users are not admitted to the system.
We have proposed a system load model for the Mobile WiMax OFDMA network
in [6].
We consider the Mobile WiMax network comprising some sectors and some
users. The sectors transmit data to the users in the downlink and the users transmit
data to the sectors in the uplink. Each user may have several downlink service flows
and several uplink service flows, where a service flow is a flow of data packets from
an application. Different service flows may have different traffic arrival rates.
The network uses the OFDM technology, the OFDMA multiple access, and the
time division duplex. Each sector uses frames for the downlink and uplink data
transmission, where a frame comprises a downlink subframe and an uplink subframe
(see Fig. 6.1). The frame boundary between the downlink and uplink subframes
may be adaptively adjusted. In the time domain the frame comprises OFDM symbols, while in the frequency domain it comprises subcarriers. In the frame, the time
resource is equal to the number of OFDM symbols and the size of the frequency
resource is defined by the number of subcarriers in one OFDM symbol.
In the OFDMA, each subcarrier can be assigned to any user. When a subcarrier
is assigned to a user, a coding and modulation scheme and a transmission power
value are selected for this user on this subcarrier. In addition, sectors in the downlink and users in the uplink have the maximum transmission power constraints. The
adaptation parameters available in the Mobile WiMax network are frame boundary
Fig. 6.1 OFDMA frame structure in Mobile WiMax network
118
S. Filin et al.
position, subcarriers assignment, coding and modulation schemes, and transmission
power values.
Data packets of a service flow should be transmitted with the required QoS. The
set of QoS requirements includes the minimum average data rate, the maximum data
block reception error probability, and the maximum average data block transmission
delay. All these QoS requirements can be satisfied by selecting an appropriate transmission power value for the given coding and modulation scheme and the given
receiving conditions [7–9].
The system load model of the Mobile WiMax network should satisfy the following requirements:
r
r
r
The Mobile WiMax network has shared and individual resources. For example,
transmission power of a sector is a shared system resource, because it is concurrently used by several users. Transmission power of a user is its individual
resource. The system load model should include shared system resources only.
When adaptive coding and modulation and power control are employed, different
adaptive transmission algorithms having different target functions may be used,
which leads to different amount of the consumed system resource. Consequently,
the amount of currently consumed system resource cannot characterize the system load. The system load should be equal to the minimum amount of the system
resources needed to satisfy QoS requirements for all the users served.
The amount of the available system resource may be different in different sectors.
To compare system load values of different sectors, the system load should be
normalized to the available system resource. In addition, normalization simplifies RRM algorithms.
Our system load model includes uplink load, downlink load, sector load, and
network load. To calculate each system load, we use the following approach. First,
we write an expression for the amount of the normalized shared system resources,
consumed by all users, as a function of adaptation parameters. Then, we find the
system load by minimizing this expression over adaptation parameters under the
constraint on the individual system resources, while satisfying the QoS requirements
for all users.
In the uplink, the shared system resource is the time-frequency resource of the
uplink subframe. Transmission power of each user is an individual system resource.
Adaptation parameters are the set of the assigned uplink subcarriers, coding and
modulation schemes, and transmission power values.
In the downlink, the shared system resources are the time-frequency resource of
the downlink subframe and the downlink transmission power. Adaptation parameters are the set of the assigned downlink subcarriers, coding and modulation schemes
and transmission power values.
In a sector, the shared system resources are the uplink resources and the downlink
resources. A new adaptation parameter, that is, the frame boundary position between
the downlink and uplink subframes is added to the uplink and downlink adaptation
parameters.
6
Mobile WiMax Performance Optimization
119
The proposed system load model takes into account all distinct features of
the Mobile WiMax network, including time-frequency and power resources, QoS
requirements, adaptive coding and modulation and power control, time division
duplex and adaptation of the frame boundary between the downlink and uplink
subframes, different users with different traffics and receiving conditions.
6.3 Call Admission Control
Any wireless network has constrained resources and can serve a limited number of
users with a given QoS level. Hence, a call admission control algorithm that decides
whether new users should be admitted to the network is required. The admission
criteria may be different. The known call admission control schemes are based on
SINR, interference, bandwidth, load, or system capacity [10].
In the Mobile WiMax network the most suitable scheme is the one maximizing
network capacity while satisfying QoS requirements for all admitted users. Such
scheme maximizes operator’s revenue and guarantees user’s satisfaction. This call
admission control algorithm admits a new user in the sector, if the sector load remains less than one when a new user and all previous users are served by the sector.
Since the system load is equal to the minimum required system resources in our
model, this call admission control algorithm maximizes the sector capacity. More
details on the call admission control algorithm in the Mobile WiMax OFDMA network can be found in [11].
6.4 Adaptive Transmission
Adaptive transmission algorithms include scheduling, adaptive coding and modulation, power control, and adaptive resource allocation. A scheduler guarantees QoS
and fairness and can also handle user priorities by making a decision, how much
data and of which service flows will be transmitted in the current frame. To satisfy
the required QoS level, different pairs of coding and modulation scheme number and
transmission power value can be used. The selection of a pair for data transmission
is based on the target function. For example, when the total transmission power
is minimized, a coding and modulation scheme with the minimum transmission
rate and a corresponding transmission power are selected. However, when the total
allocated time-frequency resource is minimized, a coding and modulation scheme
with the maximum transmission rate and a corresponding transmission power are
selected. In the OFDMA, adaptive resource allocation algorithm plays an important
role. Receiving conditions are different for different users on the same subcarrier.
Moreover, they are different for the same user on different subcarriers. Users can
be assigned to the subcarriers with the best receiving conditions, thereby multi-user
diversity gain is obtained. To enable opportunistic data transmission over a wireless
medium a cross-layer approach should be used [5]. In this case, scheduling, adaptive
120
S. Filin et al.
coding and modulation, power control, and adaptive resource allocation algorithms
should have the same target function and should be jointly optimized.
Optimization of the OFDMA systems is a subject of a considerable literature.
Time-frequency resource minimization, transmission power minimization, throughput maximization, and utility function optimization are traditionally performed.
However, most of the known algorithms do not consider the distinct features of
the Mobile WiMax network.
First, MAC and PHY layers processing is not taken into account. Data blocks of a
service flow arrive from the upper layers at the MAC layer, where they are converted
into data packets using fragmentation and packing operations (see Fig. 6.2). Also,
cyclic redundancy check and automatic repeat request mechanisms can be used. The
set of data packets of the service flow arrives at the PHY layer, where it is converted
into coding blocks. Each coding block is coded and decoded independently. QoS requirements are specified for the data blocks, while the coding blocks are transmitted
and received. Hence, MAC and PHY layers processing should be taken into account
to enable QoS-guaranteed data transmission [7–9].
Moreover, most of the known algorithms do not perform joint downlink and uplink optimization. A common problem for all the adaptive transmission algorithms
in the OFDMA networks is their computational complexity due to a large number
of degrees of freedom.
Using our system load model results in an efficient and fast adaptive transmission
algorithm. We proposed the adaptive transmission algorithm maximizing the sector
capacity while satisfying the QoS requirements for all service flows scheduled for
transmission in the current frame in [12].
In our algorithm, we consider such adaptation parameters as a position of the
frame boundary between the downlink and uplink subframes, coding and modulation schemes, transmission power values, and positions of the service flows within
the frame.
Our algorithm includes selecting the optimal position of the frame boundary
and maximizing the downlink and uplink capacity. The initial position of the frame
boundary is selected in such a way that the available downlink and uplink resources
are proportional to the downlink and uplink loads. In most cases, the initial position is very close to the optimal one. Then, we search for the optimal position
in the vicinity of the initial position. When we maximize the downlink and uplink
capacities, we place the service flows into the frame in a load-balancing manner. We
Fig. 6.2 MAC and PHY
layers processing in Mobile
WiMax network
6
Mobile WiMax Performance Optimization
121
sequentially place the service flows starting from the ones with the best receiving
conditions. When a service flow is placed, we minimize the consumed shared system
resources. Consequently, using our algorithm we maximize the sector capacity.
The system level simulation results show the efficiency of the load-balancing
adaptive transmission algorithm. The simulation topology includes seven cells each
having three sectors, where six cells surround the central cell. We collect the statistics for the sectors of the central cell. The surrounding sectors are the sources of
interference. Each cell has three sectors and frequency reuse factor is three. Cell
radius is 1000 m.
Sector bandwidth is 10 MHz, carrier frequency is 2.3 GHz. Maximum transmission power of each sector is 10 W, while maximum transmission power of each
terminal is 1 W. Each sector has 120-degree antenna, each terminal has omnidirectional antenna. We use Vehicular B propagation channel model [13]. Propagation channel components are transmit and receive antenna gains, median path loss,
and fast fading.
In each interfering sector we pseudo-randomly distribute 10 users. We select
traffic load of each interfering user such that frame load in each interfering sector is
approximately 75%. In each central sector we pseudo-randomly distribute 5, 10, . . .,
100 users. Each central user has one downlink and one uplink service flow, each
carrying Video traffic [14]. QoS requirements for these service flows of central users
are the same. Minimum average data rate is 32 kb/s, maximum average data block
delay is 200 ms, and maximum data block reception error probability is 0.001.
Figure 6.3 shows the sector throughput as a function of the traffic load for the
load-balancing algorithm and for two known algorithms, that is, total consumed
time-frequency resource minimization and total transmission power minimization
[7–9]. The known algorithms also take into account the distinct features of the Mo-
Fig. 6.3 Sector throughput as
a function of traffic load for
load-balancing and known
total consumed
time-frequency resource
minimization and total
transmission power
minimization adaptive
transmission algorithms in
Mobile WiMax network
122
S. Filin et al.
Fig. 6.4 Simulation time as a
function of traffic load for
load-balancing and known
total consumed
time-frequency resource
minimization and total
transmission power
minimization adaptive
transmission algorithms in
Mobile WiMax network
bile WiMax network, but they are not load-balancing. The load-balancing algorithm
has a 0.3 b/s/Hz spectral efficiency gain when the sector is almost fully loaded.
Figure 6.4 shows the simulation time as a function of the traffic load for three
algorithms considered. The load-balancing algorithm has a considerable computational efficiency gain of several orders.
Although the system load model is not traditionally employed in the adaptive
transmission algorithms its usage results in a very efficient algorithm that provides
a spectral efficiency gain and is considerably less computationally intensive.
6.5 Horizontal Handover
Handover algorithms first appeared in cellular networks with mobile users. When
moving, a user passes from the serving sector’s coverage area to the coverage area of
another sector. As the receiving conditions of this user in the serving sector degrade,
we come to a point when the user can no longer maintain a connection in his/her
serving sector. Therefore it appears reasonable to hand over this user to the sector,
to the coverage area of which he/she currently belongs. The receiving conditions are
characterized by the received signal level or SINR. Consequently, traditional handover algorithms are based on the received signal level or SINR. The user is handed
over to the sector with the maximum signal level or SINR value. This scheme may
be expanded by adding thresholds to decrease the number of ping-pong events and
signaling load and to keep the call dropping probability low. [15]
In the Mobile WiMax network the horizontal handover should be seamless.
Seamless horizontal handover is a handover that continuously guarantees the required QoS for all user’s service flows while he/she is active in the network. To guarantee QoS requirements, downlink and uplink receiving conditions and the sector
load of the serving sector should be taken into account. The horizontal handover
6
Mobile WiMax Performance Optimization
123
algorithm guarantees QoS requirements by assigning a new serving sector to the
user when the receiving conditions or the sector load change. Traditional horizontal
handover algorithms do not take the load into account. Hence, they cannot guarantee
QoS requirements in the Mobile WiMax network.
We have proposed the load-balancing QoS-guaranteed horizontal handover algorithm that maximizes the capacity of the Mobile WiMax network in. [16] Our
algorithm provides the capacity maximization by distributing the load of the overloaded sectors among other sectors and by balancing the load of the sectors that are
not overloaded. In other words, we minimize the maximum sector load in all sets of
sectors of the Mobile WiMax network.
We use the optimization procedure consisting of K-1 steps, where K is the number of sectors in the Mobile WiMax network. During the first step we select the
serving sectors for all network users to minimize the maximum sector load among
all K sectors. Then, for the users of the sector with the maximum sector load this
sector becomes a new serving sector. This sector and all its users are excluded from
further optimization. During the second step the remaining users and K-1 sectors
are optimized in the same way. During the last step we minimize the maximum
sector load for two remaining sectors. After this optimization procedure we initiate
a horizontal handover procedure for the users, whose serving sector number has
been changed.
The proposed horizontal handover algorithm maximizes the network capacity
and guarantees QoS requirements when the network is not overloaded. We show
the efficiency of our algorithm using the system level simulation. The simulated
network includes seven cells. Six cells surround the central cell. The frequency reuse
factor is seven and the cell radius is 300 m. The carrier frequency is 2.4 GHz and the
signal bandwidth is 10 MHz in each cell. Each sector has the maximum transmission
power value of 20 W and the omni-directional antenna. Each user has the maximum
transmission power value of 1 W and the omni-directional antenna. We have used
the Vehicular B propagation channel model [13].
Figures 6.5, 6.6 and 6.7 illustrates the advantages of our algorithm compared to
the traditional SINR-based algorithm in the Mobile WiMax network.
Fig. 6.5 Maximum sector
load as a function of frame
number for load-balancing
and SINR-based horizontal
handover algorithms in
Mobile WiMax network
124
S. Filin et al.
Fig. 6.6 Load of the central sector as a function of traffic load for load-balancing and SINR-based
horizontal handover algorithms in Mobile WiMax network
Fig. 6.7 Network throughput as a function of traffic load for load-balancing and SINR-based horizontal handover algorithms in Mobile WiMax network
Figure 6.5 shows the maximum sector load among seven sectors as a function
of frame number. Figure 6.4a indicates that the traditional handover algorithm occasionally leads to overloading, that is, to the network condition when the QoS
requirements are not satisfied for the users. Our load-balancing handover algorithm
keeps the maximum sector load less than one, thus guarantees meeting the QoS
requirements.
6
Mobile WiMax Performance Optimization
125
Figure 6.6 shows the load of the central sector as a function of the network traffic
load. The SINR-based handover algorithm leads to overloading under the network
traffic load value of about 22 Mb/s, whereas our load-balancing algorithm results in
the overloading condition under the network traffic load value of about 70 Mb/s.
Figure 6.7 shows the network throughput, that is, the throughput of seven sectors as a function of the network traffic load. The SINR-based handover algorithm
reaches the maximum throughput value of about 22 Mb/s, while our load-balancing
algorithm gains the maximum throughput value of about 70 Mb/s.
Therefore, the load-balancing approach enables development of the efficient horizontal handover algorithm in the Mobile WiMax network. This algorithm guarantees QoS requirements and maximizes network capacity. Our load-balancing algorithm provides a considerable gain in the network capacity over the traditional
SINR-based algorithm.
6.6 Dynamic Bandwidth Allocation
In the Mobile WiMax network several sectors may form a group of sectors, where
sectors within the group share the same signal bandwidth using different groups of
subcarriers within this signal bandwidth. Time-frequency resources of these sectors
do not overlap, but they may be adaptively distributed among the sectors on the
frame-by-frame basis by changing groups of subcarriers used in each sector. This
introduces the dynamic bandwidth allocation feature in the Mobile WiMax network.
Serving sectors may be selected for the users in such a way that the total consumed system resources are minimized. If several sectors become overloaded, they
may take system resources from the non-overloaded sectors. These are the key ideas
of the joint handover and dynamic bandwidth allocation algorithm in the Mobile
WiMax network.
We proposed the load-balancing QoS-guaranteed joint dynamic bandwidth allocation and horizontal handover algorithm that maximizes the capacity of the Mobile
WiMax network in. [17] This algorithm is similar to the horizontal handover algorithm described in previous section. It also intends to minimize the maximum sector
load in all sets of sectors of the Mobile WiMax network. However, it has one more
degree of freedom for optimization compared to the horizontal handover algorithm.
In the horizontal handover algorithm, we can change consumed system resources
of sectors only. In the joint dynamic bandwidth allocation and horizontal handover
algorithm we can additionally adapt available system resources in each group of
sectors sharing the same signal bandwidth. This is done by adaptive distributing of
subcarriers used by each sector in a group.
We evaluate the proposed joint handover and dynamic bandwidth allocation algorithm using system level simulation of the Mobile WiMax network. The simulated network includes seven cells, each having three sectors. Six cells surround the
central cell. The frequency reuse factor is three and the cell radius is 300 m. The
carrier frequency is 2.4 GHz and the signal bandwidth is 10 MHz in each cell. Three
126
S. Filin et al.
sectors of each cell forms a group of sectors. They share 10 MHz bandwidth. Each
sector has the maximum transmission power value of 20 W and 120-degree sectored
antenna. Each user has the maximum transmission power value of 1 W and the
omni-directional antenna. We use the Vehicular B propagation channel model [13].
Within the coverage area of the Mobile WiMax network we distribute 3 high-rate
Internet users and 21, 42, . . . low-rate Internet users. Each high-rate user has one
downlink and one uplink service flows, each having traffic arrival rate 512 kb/s. Each
low-rate user has one downlink and one uplink service flows, each having traffic
arrival rate 128 kb/s. All these users pseudo-randomly move within the coverage
area of the network during the simulation.
For the described scenario, we simulated two cases. In the first case, we perform
handover only using the algorithm described in the previous section. In the second
case, we perform joint handover and dynamic bandwidth allocation.
Figure 6.8 shows network throughput as a function of network traffic load for
handover algorithm (“HO” curve) and for joint handover and dynamic bandwidth
allocation algorithm (“HO & DBA” curve).
When handover algorithm is used, the maximum network throughput is equal to
95 Mb/s. When joint handover and dynamic bandwidth allocation algorithm is used,
the maximum network throughput is equal to 115 Mb/s. In other words, we have
20% network capacity gain.
This network capacity gain may be interpreted as follows. When dynamic bandwidth allocation is enabled, a part of the users may switch to higher transmission
rates due to better receiving conditions. Consequently, a part of the system resources
becomes available for the additional users.
Fig. 6.8 Network throughput as a function of network traffic load for handover algorithm and for
joint handover and dynamic bandwidth allocation algorithm
6
Mobile WiMax Performance Optimization
127
6.7 Conclusions
We have described optimization of the Mobile WiMax OFDMA network using the
load-balancing approach to RRM. To illustrate the advantages of the load-balancing
approach, we have presented RRM algorithms, including call admission control,
adaptive transmission, horizontal handover, and dynamic bandwidth allocation algorithms. These algorithms jointly maximize the network capacity and guarantee
users QoS.
References
1. IEEE Standard 802.16–2004, IEEE Standard for Local and Metropolitan Area Networks –
Part 16: Air Interface for Fixed Broadband Wireless Access Systems, (2004).
2. IEEE Standard 802.16e–2005, Amendment to IEEE Standard for Local and Metropolitan Area
Networks – Part 16: Air Interface for Fixed Broadband Wireless Access Systems – Physical
and Medium Access Control Layers for Combined Fixed and Mobile Operation in Licensed
Bands, (2005).
3. S. Frattasi, H. Fathi, F.H.P. Fitzek, R. Prasad, and M.D. Katz, Defining 4G Technology from
the User’s Perspective, IEEE Network 20(1), 35–41 (2006).
4. D. Niyato and E. Hossain, Call Admission Control for QoS Provisioning in 4G Wireless Networks: Issues and Approaches, IEEE Network 19(5), 5–11 (2005).
5. V. Srivastava and M. Motani, Cross-Layer Design: A Survey and the Road Ahead, IEEE Communications Magazine 43(12), 112–119 (2005).
6. S.N. Moiseev et al, System Load Model for the OFDMA Network, IEEE Communications
Letters 10(8), 620–622 (2006).
7. S.A. Filin et al, QoS-Guaranteed Cross-Layer Adaptive Transmission Algorithms for the
IEEE 802.16 OFDMA System, IEEE Wireless Communications and Networking Conference
(WCNC 2006) 2, 964–971 (2006).
8. S.A. Filin et al, QoS-Guaranteed Cross-Layer Adaptive Transmission Algorithms with Selective ARQ for the IEEE 802.16 OFDMA System, IEEE Vehicular Technology Conference
(VTC 2006 Fall) (2006).
9. S.A. Filin et al, QoS-Guaranteed Cross-Layer Transmission Algorithms with Adaptive Frequency Subchannels Allocation in the IEEE 802.16 OFDMA System, IEEE International
Conference on Communications (ICC 2006) 11, 5103–5110 (2006).
10. M.H. Ahmed, Call Admission Control in Wireless Networks: A Comprehensive Survey, IEEE
Communications Surveys 7(1), 50–69 (2005).
11. S.N. Moiseev and M.S. Kondakov, Call Admission Control in Mobile WiMax Network, International Journal of Communication Systems, (unpublished).
12. S.A. Filin et al, Fast and Efficient QoS-Guaranteed Adaptive Transmission Algorithm in
Mobile WiMax System, IEEE Transactions on Vehicular Technology, 2008 (unpublished).
13. Recommendation ITU-R M.1225, Guidelines for Evaluation of Radio Transmission Technologies for IMT–2000, (1997).
14. 3GPP2 Contribution C.P1002-C-0, cdma2000 Evaluation Methodology, (2004).
15. A.V. Garmonov et al, QoS-Oriented Intersystem Handover between IEEE 802.11b and Overlay Networks, IEEE Transactions on Vehicular Technology 57(2), 1142–1154 (2008).
16. S.N. Moiseev et al, Load-Balancing QoS-Guaranteed Handover in the IEEE 802.16e OFDMA
Network, IEEE Global Communications Conference (GLOBECOM 2006), (2006).
17. S.N. Moiseev and M.S. Kondakov, Joint Handover and Dynamic Bandwidth Allocation in
Mobile WiMax Network, IEEE Transactions on Mobile Computing, (unpublished).
Chapter 7
A Comparative Study on Random Access
Technologies of 3G and B3G Mobile
Communications Systems
Jungchae Shin and Ho-Shin Cho
Abstract This chapter introduces and compares the various random access (RA)
technologies designed for 3G and beyond 3G mobile communication systems including Mobile WiMax, IEEE 802.20, cdma2000, WCDMA, and 3G LTE. In terms
of fundamental design issues of RA, such as multiplexing, RA procedures, backoff
algorithm, power control and priority schemes, the competing systems are compared. Furthermore, the performances of ranging for Mobile WiMax are numerically
evaluated by both link- and MAC (Media access control)-level simulations in terms
of throughput, delay time, and ranging success probability.
Keywords Random access · Ranging · Mobile WiMax · IEEE 802.20 · Cdma2000 ·
WCDMA · 3G LTE
7.1 Introduction
Various kinds of 3rd generation (3G) and 3G plus mobile communication systems
have been introduced such as cdma2000, WCDMA (Wideband code division multiple access), HSDPA (High speed downlink packet access), and Mobile WiMax
(Worldwide interoperability for microwave access). Recently, the advanced versions
of 3G and 3G plus systems called beyond 3rd generation (B3G) systems such as
WiMax Evo, and 3G long-term evolution (LTE) are being intensively developed
and are anticipated to start the services near 2010 [1–6]. These endeavors to evolve
the systems are ultimately directed toward fourth generation (4G) mobile communication system which is characterized by global mobility, higher data rate up to
1 Gbps when stationary, and lower error probability.
One of the crucial requirements to reach 4G era is to enhance random access
(RA) performance. The RA is the first step for a mobile station (MS) to enter a
mobile communication network. At the initial access stage, MS is out of synchronization to base station (BS) and thus, has no acquisition of system parameters and
J. Shin (B)
School of Electrical Engineering and Computer Science, Kyungpook National University,
Daegu, Korea
M. Ma (ed.), Current Technology Developments of WiMax Systems,
C Springer Science+Business Media B.V. 2009
DOI 10.1007/978-1-4020-9300-5 7,
129
130
J. Shin and H.-S. Cho
signaling/data channels. At this state, a preliminary procedure called RA is required
to ready for communication with BS.
In general, the RA follows the two steps [7]:
1. Uplink time/frequency/power synchronization with a BS.
2. Uplink resource acquisition for bandwidth requests.
Being turned on, MS first searches the best BS to be connected and tries to find
downlink information on time/frequency/power of the selected BS using a pilot signal. Then, MS tries to acquire uplink synchronization by sending an access probe.
Receiving an acknowledgment (ACK) message which includes the modified uplink
synchronization values, MS can adjust uplink synchronization. After that, the access
probe may be retransmitted to obtain uplink channel on which bandwidth request
message is sent.
As explained above, RA plays fundamental roles at initial state of network entrance and affects the system performance, especially the ones related to users’ own
experience such as the service starting time and the deliverable service quality. Thus,
the mobile communication systems have made efforts competitively to enhance the
RA performances. The main issues in RA are how long the access waiting time is,
how fast and efficiently RA collision can be resolved, and how the quality of service
can be differentiated according to the users’ priority, etc.
This chapter introduces and compares the various RA technologies which have
been developed for 3G and beyond 3G mobile communication systems including
Mobile WiMax, IEEE 802.20, cdma2000, WCDMA, and 3G LTE. In terms of
fundamental design issues of RA, such as multiplexing, RA procedures, backoff
algorithm, power control and priority schemes, the competing systems are compared. Furthermore, the performances of ranging for Mobile WiMax are numerically
evaluated by link- and MAC (Media access control)-level simulations in terms of
throughput, delay time, and ranging success probability.
7.2 Initialization – Procedures Prior to Random Access
A main function of RA is to acquire uplink synchronization and uplink resources.
Before RA is executed, several steps called the initialization are required in order to
synchronize timing and frequency on downlink with the serving BS. In Table 7.1,
various initialization schemes of 3G and B3G systems are summarized.
7.2.1 Mobile WiMax
A downlink preamble located at the first in a frame is used to search the most
preferable radio access station (RAS) which is equivalent to BS and to acquire time
and frequency synchronization. Then, a portable subscriber station (PSS) which
is equivalent to MS decodes downlink channel descriptor (DCD) and downlinkmap (DL-MAP) in order to acquire the information on downlink channel configuration such as downlink subframe structure, burst profile, and physical layer
7
A Comparative Study on Random Access Technologies
131
Table 7.1 Initialization procedures and required information for various 3G and B3G systems
Procedure
Detect cell & sector
Downlink
synchronization
Downlink & uplink
channel parameters
acquisition
Mobile
WiMax
Downlink
preamble
DCD,
DL-MAP,
UCD,
UL-MAP
IEEE 802.20
cdma2000
WCDMA
3G LTE
Superframe
preamble
pilots
(TDM1,
−2, −3)
Superframe
preamble
(pBCH0, -1),
Data channel
(ExtendedChannelInfo
message)
F-PICH
F-SCH
SCH (Primary &
secondary
synchronization
code), CPICH
SCH
F-BCCH
F-CCCH
PCCPCH, BCH
BCH
characteristics. PSS subsequently tries to obtain uplink access information from uplink channel descriptor (UCD) and uplink-map (UL-MAP); inhere, uplink access information includes uplink subframe structure, ranging region, the number of accessible ranging codes, and backoff contention window size, etc [8–10]. Finally, PSS
gets ready for RA which is especially called a ranging in IEEE 802.16 standards.
7.2.2 IEEE 802.20
IEEE 802.20 system has the similar initialization procedure as Mobile WiMax. The
noticeable feature of IEEE 802.20 is only that access terminal (AT) which is equivalent to MS employs a hierarchical scan of three pilot signals named time division
multiplexing 1 (TDM1), TDM2, and TDM3 in superframe preamble; superframe is
comprised of multiple frames and superframe preamble is located at the first in superframe. This hierarchical scan is similar to the three-step cell search procedure in
WCDMA and significantly reduces the searching complexity [11]. After searching
a sector, AT achieves time and frequency synchronization with the serving access
point (AP) and then decodes two primary broadcast channels (p-BCH0, p-BCH1)
to obtain physical channel configuration information. After that, AT can finally obtain access information from ExtendedChannelInfo messages such as access cycle
duration, maximum number of the access probes per access sequence, and ramping
power step size [11, 12].
7.2.3 cdma2000
AT starts initialization procedures with a network determination through which the
AT selects the best AP and the available frequency band based on predetermined
access information [13]. Then, the AT needs to acquire the forward pilot channel
(F-PICH) within a limited time duration (specified by 15 seconds). If it fails in
the timely acquisition, the AT goes back to the network determination state. If it
succeeds, the AT gets initial timing information such as PILOT PN (i.e. PN code
offset) and 37-bit CDMA SYS TIME from synchronization message in forward
132
J. Shin and H.-S. Cho
synchronization channel (F-SCH). After synchronization, the AT monitors two
types of messages; page message and system parameter message transmitted on
forward common control channel (F-CCCH) and forward broadcast control channel
(F-BCCH), respectively. Then, the AT is now ready to access the system [3, 13].
7.2.4 WCDMA
User equipment (UE) which is equivalent to MS obtains the downlink scrambling
code and the common channel frame synchronization during a downlink synchronization procedure named a cell search. The cell search in WCDMA consists of
three steps; slot synchronization, frame synchronization and code-group identification, and scrambling-code identification [14]. In the first step, UE exploits synchronization channel (SCH) and obtains primary synchronization code for the purpose of slot-synchronization. The primary synchronization code is same for all
Node-Bs which are equivalent to BSs. In the second step, UE achieves the framesynchronization using secondary synchronization code in SCH and determines the
code-group of the BS [15]. In the third step, UE finds the primary scrambling code
through common pilot channel (CPICH). Finally, UE obtains access information
such as available RA codes and RA slots from primary common control physical channel (PCCPCH) corresponding to the broadcast channel (BCH) in transport
layer. And then UE can also determine the radio frame timing of all common physical channels [2, 15].
7.2.5 3G LTE
Synchronization channel (SCH) and broadcast channel (BCH) are utilized in the
initialization procedure of 3G LTE. UE acquires the primary information such as
downlink symbol timing and frequency from SCH and the remaining cell/systemspecific information such as overall transmission bandwidth of the cell, cell ID, and
radio frame timing information from BCH [7]. SCH and BCH are allocated one or
multiple times in every 10 msec radio frame. For the purpose of the fast acquisition,
the position of SCH and BCH in time and frequency domain is predetermined. Especially, the frequency band for SCH and BCH is fixed by 1.25 MHz and is located
at the center of the total transmission bandwidth [7].
7.3 RA Procedures
7.3.1 Mobile WiMax
In Mobile WiMax, RA is called ranging which is categorized into 4 types according
to the purpose such as initial, handover, periodic, and bandwidth request. Initial
and periodic ranging are designed to finely adjust the timing synchronization and
7
A Comparative Study on Random Access Technologies
133
transmission power. Handover ranging is to continue current service in a new cell.
Uplink channel request is performed by bandwidth request ranging [8–10].
PSS starts ranging process with transmitting a 144-bit length ranging code via
ranging region which is located at first 3 OFDM symbols in uplink subframe. A
144-bit length ranging code is generated from pseudo random binary sequence
(PRBS) generator using the cell ID as a seed value [8] and is transmitted by 144
subcarriers modulated by binary phase shift keying (BPSK). Since the total number of subcarriers is 864, the maximum 6 ranging codes can be transmitted in an
OFDM symbol duration. However, the ranging regions are shared by non-ranging
signaling such as channel quality indicator (CQI), and acknowledgement (ACK).
Moreover, initial and handover ranging are repeated 2 times over 2 OFDM symbols
for reliable transmission in unstable channel conditions. Thus, the available room
for ranging [16] becomes much smaller than the maximum of 6.
Upon receiving ranging codes from users, RAS operates parallel auto-correlations
upon the received ranging codes with candidate PN codes, in order to recognize
which ranging code is transmitted. The ranging code yielding the highest correlation
value is selected. If the synchronization agreement and the power level of received
ranging code are both acceptable, RAS notifies the ranging success by sending a
control message named RNG-RSP carrying “success”. If some modifications are
needed in synchronization and transmitting power level, RAS sends the adjustment
values through RNG-RSP. If no ranging code yields auto-correlation output over a
certain threshold level, then RAS cannot even recognize the ranging, and thus cannot
give any ranging response. PSS waiting the ranging response retries a ranging when
a timer named T3 is expired
Figure 7.1. shows procedures of 4 different types of ranging. In cases of initial
and handover ranging, afterward downlink synchronization and acquisition, PSS
should take an initial backoff to transmit a ranging request (RNG-REQ) code. RAS
has 3 types of ranging response; no response, “continue” message on RNG-RSP, and
“success” message on RNG-RSP. If PSS does not receive any ranging response from
RAS until T3 timer is expired, it makes decision on the access as failure, and then
takes an additional random backoff with binary exponential random backoff algorithm [8]. Meanwhile, if PSS receives a “continue” message with adjustment values
on time and power levels, PSS corrects the timing and power level and resends an
RNG-REQ code. Otherwise, if PSS receives a “success” message on RNG-RSP and
CDMA Allocation IE (i.e. information on uplink-channel allocation), PSS sends
RNG-REQ message carrying its MAC address. Then, RAS binds the MAC address
with a connection identifier (CID) and assigns the CID to PSS.
The procedures of periodic and bandwidth request ranging are much shorter and
simpler than those of initial and handover ranging because PSS already has his CID
and good uplink synchronization. In order to maintain the synchronization between
RAS and PSS, periodic ranging is required every expiration of T4 timer or irregularly when it is needed. In case of bandwidth request ranging, T16 timer runs in
waiting for RNG-RSP message with CDMA Allocation IE. If PSS fails in receiving
the RNG-RSP until T16 timer is expired, PSS has a random backoff from binary
exponential random backoff algorithm. Even though several random backoffs may
134
J. Shin and H.-S. Cho
PSS
PSS
RAS
UCD/UL-MAP
Timeout T4
Initial Backoff
Start T3
Initial Backoff
RNG-REQ Code
RNG-REQ Code
Start T3
Timeout T3
Random Backoff
RAS
UCD/UL-MAP
Timeout T3
RNG-REQ Code
Random Backoff
RNG-RSP Message (“continue”)
RNG-REQ Code
RNG-REQ Code
RNG-RSP Message
(“continue”)
RNG-RSP Message (“success”)
UL-MAP (CDMA_Allocation_IE)
RNG-REQ Code
RNG-REQ Message (MAC Address)
RNG-RSP Message (Management CIDs)
RNG-RSP Message
(“success”)
(b) Periodic ranging
(a) Initial and handover ranging
PSS
RAS
UCD/UL-MAP
Start T16
RNG-REQ Code
Timeout T16
Random Backoff
RNG-REQ Code
UL-MAP (CDMA_Allocation_IE)
BW-REQ Header
UL-MAP (BW Allocation)
(c) Bandwidth request ranging
Fig. 7.1 Ranging procedures of 4 types of ranging in Mobile WiMax system
happen, in the end, PSS receives CDMA Allocation IE which indicates the uplink
resources through which PSS sends the bandwidth request signaling.
7.3.2 IEEE 802.20
For RA, AT transmits an access probe named AccessSequenceID. 1024 orthogonal AccessSequenceIDs are grouped into 9 different sets according to AccessSequencePartion which is given by an access node (AN). Then, based on buffer state
and received pilot strength, AT determines an AccessSequenceID set among which
the AccessSequenceID is selected. The access probe selected by AT is transmitted
through the reverse access channel (R-ACH). If AN successfully receives the access probe, the AT will receive the Access Grant message through forward shared
signaling channel (F-SSCH). Access Grant message contains medium access control identification (MAC ID) and node ID which are scrambled with a hash of the
AccessSequenceID [11, 12].
A simple example for access probe transmission is illustrated in Fig. 7.3. First,
AT takes p-persistence test to determine the timing offset for access probe
A Comparative Study on Random Access Technologies
Access probe
power
p-persistence
Persistence
interval
AccessCycleDuration
probe
probe sequence
1
135
Access Probe sequence
Grant Timer backoff time
2
3
Np
1
p-persistence
7
AccessCycleDuration
1
2
3
Np
2
Time
Ns
Unit time: ControlSegmentPeriod[6 RL PHY frames]
AccessCycleDuration(2bits)=[1,2,3,4]
MaxProbePerSequence(4bits)=[1,2,…,16]
MaxProbeSequences=3
ProbeRampUpStepSize(4bits)=0.5*(1+n)dB
AccessRetryPersistence(3bits)=2–n
AccessGrantTimer=5 PHY frames
Fig. 7.2 Access probe transmission algorithms in IEEE 802.20 system
transmission. The inter access probes duration is specified by AccessCycleDuration
and the number of access probe transmissions is limited by Np . If the number of
access probes transmitted reaches Np , further access probe transmission is prohibited and AccessGrantTimer starts to run. A new access attempts are allowed when
the AccessGrantTimer is expired. Transmission power of the initial access probe is
determined by an open loop power control, but the power of subsequent access probe
is controlled by a power ramping scheme based on the parameter ProbeRampUpStepSize. Several important parameters of access probe transmission are described
in Fig. 7.2. More detailed information on access parameter is explained in overhead
message protocol (OMP) [12].
The algorithm for timing offset determination is explained by a flow chart in
Fig. 7.3. When RA is triggered by AN with paging, if ProbeSequenceNumber is
not equal to 1, the timing offset is generated from Geo(p) process truncated by a
MaxProbeSequenceBackoff value, where Geo(p) is a geometric random variable
with parameter p. If ProbeSequenceNumber is equal to 1 and QuickPage bit is not
equal 1, timing offset is uniformly selected between 0 and 3 times PageResponseBackoff. Specially, if both ProbeSequenceNumber and QuickPage bit are equal to 1,
AT immediately transmits access probe without delay. On the other hand, when RA
is requested by PSS not by AN paging, if ProbeSequenceNumber is equal to 1, AT
immediately sends an access probe And if not equal to 1, timing offset is determined
by Geo(p) truncated by MaxProbeSequenceBackoff value.
7.3.3 cdma2000
Figure 7.4 shows an access procedure in cdma2000. An access probe consists of
two parts; a preamble for pilot channel and a capsule for data and pilot channels as
136
J. Shin and H.-S. Cho
Response to a
paging?
No
Yes
No
ProbeSequence
Number==1?
ProbeSequence
Number==1?
No
Yes
Yes
Yes
QuickPage bit==1?
No
min[Geo(p) RV,
MaxProbeSequenceBackoff]
Uniform distribution
[0,PageResponseBackoff*3]
Persistence
interval=0
min[Geo(p) RV,
MaxProbeSequenceBackoff]
Unit time: ControlSegmentPeriod[6 RL PHY frames]
PageResponseBackoff=1
MaxProbeSequences=3
MaxProbeSequenceBackoff=8
Fig. 7.3 Timing offset determination of access probe transmission in IEEE 802.20 system
shown in Fig. 7.4. The parameters, PreambleLength and CapsuleLengthMax specify the lengths of preamble and capsule, respectively. And the unit length is 16
slots.
A persistence test is performed at every transmission of access probe in order to
effectively control a congestion on the Access channel. The maximum number of
access probes allowed at once is specified by (1+NUM STEPs). The transmission
power of every first access probe is determined by the initial power level specified
by AN or the measured power level specified by AT with open loop power control.
AT transmits repeatedly access probes with power ramped until an access acknowledgement message is successfully received from AN. In this case, the step of power
increase is determined by AN [3, 13].
7.3.4 WCDMA
After cell search and synchronization procedure, UE obtains some parameters for
RA such as the number of signatures, preamble scrambling codes and subchannels
from the BCH. The random access channel (RACH) and the physical random access
channel (PRACH) which belong to the transport channel and the physical channel
in a hierarchical WCDMA channel architecture, respectively, are used for RA. As
a response to RA, the acquisition indicator (AI) is transmitted on the acquisition
indicator channel (AICH).
Figure 7.5 shows the RA procedure on AICH and PRACH where a 20 msec
frame combined by two system frames is divided into 15 slots. Between AICH
and PRACH, a timing offset by p-a exists. That is, transmitting a preamble onto
a randomly selected slots of PRACH, UE anticipates to receive the response (AI)
from Node-B after the delay of p-a . Unlike other systems where the RA response is
...
137
persistence
...
persistence
persistence
A Comparative Study on Random Access Technologies
persistence
7
...
...
Time
Access probe sequence
Probe (1+NUM_STEPs)
Probe 3
Probe 2
Probe 1
…
Time
Data Channel
Pilot Channel
Pilot Channel
Time
PreambleLength
x 16 slots
CapsuleLength
Max x 16slots
Fig. 7.4 Access probe transmission and its structure in cdma2000 system
Radio Frame with
SFN mod 2 = 0
AICH access
slots Rx at UE
#0
#1
#2
#3
#4
Radio Frame with
SFN mod 2 = 1
#5
#6
#7
#8
#9
#10
#11
#12
#13
τp-a
τp-a
5120chips
PRACH access
slots Tx at UE
#0
#1
#2
#3
#4
#5
#6
#7
#8
#9
#10
#11
#12
#13
4096chips
τp-p, min
τp-m
Access slot set 1
Access slot set 2
10 msec
Preamble
AI
10 msec
Message part
Fig. 7.5 The timing relation between PRACH and the AICH in WCDMA system
#14
#14
138
J. Shin and H.-S. Cho
valid at any time, thus not only MS needs to keep listening the response but also the
response message should contain both the RA transmission time and the access code
number, WCDMA requires UE to listen AICH at only predetermined time points,
thus AI could be recognized by only the received signature information without the
timing information.
The transmission power of preamble is ramped up from Preamble Initial power
by the Power Ramp Step. The successive preambles should be positioned apart at
least p-p,min and the last preamble acquiring the AI could be followed by a message with a length of 10 msec or 20 msec after p-m . The preamble has 4096-chips
length composed of 256 repetitions of a 16-chips signature which is randomly
selected from a Hadamard code set. The AI has also 4096-chips length and the
dispreading output at UE has the values of +1, −1, and 0; +1 for positive acknowledgement (ACK), −1 for negative acknowledgement (NACK), and 0 for no
response.
The resources for RA such as preamble signatures (i.e. access codes) and access
slots (i.e. access time) are divided into 8 inequality groups according to Access
Service Class (ASC) ; ASC 0 is the highest priority and ASC 7 is the lowest priority
[17]. According to ASC, the probability for persistence test Pi also differs.
The RA procedure is summarized as follows [14, 17]:
1. The UE randomly selects an RA resource according to ASC.
2. Taking a persistent test with Pi , the UE transmits a preamble through a selected
uplink access slot with Preamble Initial Power.
3. The BS responds to the preamble with ACK or NACK.
4a. Receiving NACK or no AI, UE retransmits a preamble with the power ramped
up after a random backoff.
4b. Receiving ACK, UE transmits a message after the delay p-m from the last
preamble.
7.3.5 3G LTE
Both the non-synchronized RA and the synchronized RA are used. The nonsynchronized RA which is designed to acquire uplink synchronization and uplink
resource has 2 different approaches of approach-1 and approach-2 as shown in
Fig. 7.6.
In approach-1, UE sends an RA burst and a bandwidth request message together,
then, Node B responds with uplink timing information and up- and downlink channel assignments. On the other hand, in approach-2, UE sends RA burst first and then
Node B responds to the burst with uplink timing information and uplink resource
allocation for the bandwidth request. After that, UE requests a bandwidth through
the assigned time-frequency resource. The synchronized scheme may be used when
uplink synchronization has been already done. The procedure of synchronized RA
is similar to that of non-synchronized RA except that it does not need the response
of uplink timing information [7].
7
A Comparative Study on Random Access Technologies
UE
Node-B
139
UE
Node-B
Access preamble (+Message)
Access preamble
Timing information
& Scheduling request resource allocation
Timing information
Scheduling request
Uplink data resource allocation
Uplink data resource allocation
UL data transmission
Preamble part
Payload part
UL data transmission
Preamble part
RA burst
RA burst
(a) Approach-1
(b) Approach-2
Fig. 7.6 Non-synchronized RA procedures in 3G LTE system
7.4 Technologies Comparison
In this section, fundamental design issues in RA are addressed with comparison of
various mobile communication systems. Table 7.2 summarizes the RA technology
features of cdma2000, WCDMA, IEEE 802.20, 3G LTE, and Mobile WiMax. Note
that standardization of 3G LTE is now under way, and thus, it is difficult to specify
the technologies in detail at current state.
7.4.1 Multiplexing Scheme
Access probe and user’s data are transmitted by time and frequency division multiplexed (TDM/FDM) manner in OFDMA based systems such as IEEE 802.20
and Mobile WiMax. On the other hand, code division multiplexed manner is used
in CDMA based systems such as WCDMA and cdma2000. In 3G LTE, both
FDM/TDM and CDM are considered.
7.4.2 RA Procedures
In cdma2000 system, AT transmits preamble and data message together while in
the other systems the access probe and data message are separately transmitted.
The simultaneous transmission approach is being also considered in 3G LTE standard because it can reduce the latency of access time. However, if access probe is
not correctly recognized at BS due to unreliable channel conditions such as collision, faulty synchronization and busy network, the user data message is discarded
140
J. Shin and H.-S. Cho
Table 7.2 Main features of RA technologies according to mobile communication systems
Item
cdma2000
Multiplexing CDM
Procedures
Inter-probe
duration /
backoff
algorithm
Inter-probe
power
control
Priority
WCDMA
IEEE 802.20
CDM
TDM/FDM
3G LTE
Mobile WiMax
TDM/FDM, or TDM/FDM
CDM
Sequential
Sequential
The same time Sequential
The same
transmission
transmission
transmission
transmission
time trans(message
(message
(message
of preamble
mission of
after
after
after
and message
preamble
preamble)
preamble)
preamble)
Or
and
Sequential
message
transmission
(message
after
preamble)
Fixed and
Variable/
Fixed / random Under consid- Variable /
variable/
random
backoff
eration
truncated
random
backoff
binary
backoff
exponential
random
backoff
Power ramping Power ramping Power ramping Power ramping
Power
(zero step
ramping
size) or open
and open
loop power
loop power
control
control
Persistence
Persistence
Persistence
Under consid- None
test
test, 8 access
test, 9 access
eration
service
probe set
classes
selection
to follow the failed access probe, which causes unnecessary system overhead and
interference. Meanwhile, the separate transmission of access probe and user data
can save unnecessary power consumption and interference; however, it may cause
undesirable transmission delay.
7.4.3 Inter-Probe Duration and Backoff Algorithm
Variable inter-probe duration is basically employed in most systems using persistence test and backoff algorithm. However, IEEE 802.20 uses a fixed inter-probe
duration. In cdma2000, if the transmission time of access probe falls into the
silence-interval, the access probe transmission is canceled. Thus the inter-probe
duration does not maintain to be constant. In Mobile WiMax, the inter-probe duration is randomly generated by the truncated binary exponential random backoff
algorithm [18].
7
A Comparative Study on Random Access Technologies
141
7.4.4 Inter-Probe Power Control
The initial power of access probe is predetermined and open-loop power control follows based on the received downlink pilot strength. If an access probe transmission
fails, the next probe transmission power is ramped with fixed step size in cdma2000,
WCDMA, Mobile WiMax, and IEEE 802.20 systems (Fig. 7.7 (a)). Especially,
cdma2000 system adopts open-loop power control together. Meanwhile, 3G LTE
system has not determined the power control scheme for access probe transmission
but the per-burst open loop power control and zero-step power ramping schemes [7]
are being studied as shown in Fig. 7.7.
Initial power level
Initial power level
Per-burst open loop power control
Power ramping
Power
Step
size
RA bursts
(a) Equal-step-size
power ramping
Power ramping
(zero step size)
RA bursts
(b) Zero-step-size
power ramping
RA bursts
Time
(c) Per-burst open
loop power control
Fig. 7.7 Inter-probe power control schemes addressed in 3G LTE system
7.4.5 Priority
In cdma2000, the priority of RA is controlled by the persistent test where the probability value, p is given according to the priority level. If the persistent test fails
successively 4/p times, then access probe is immediately transmitted without the
persistent test. Similarly, WCDMA uses the persistent test where the probability, p
has different 8 values according to access service class (ASC). And RA resource
including preamble signatures (i.e. code) sub-channel (i.e. access slot) are allocated
according to ASC by using the overlapping and the non-overlapping schemes [19].
In cdma2000 and WCDMA, the persistent test is required at every transmission of
access probe. If the test fails, the next test is postponed by a backoff time in order
to control the system traffic load and reduce the multiple access interference (MAI)
caused by RA [20, 21]. In IEEE 802.20, the persistent test plays similar load control
function where the retrial number of test is determined by geometric distributed random variable. Moreover, different 9 orthogonal-code sets are used for access probe
according to buffer state of MS and received pilot strength. Meanwhile, Mobile
WiMax manages 4 ranging code sets according to the ranging purpose, however,
has not adopted any priority scheme. Standardization on RA priority of 3G LTE is
in progress.
142
J. Shin and H.-S. Cho
7.5 Performance Evaluation of Ranging in Mobile WiMax
In this section, the performance of ranging in Mobile WiMax system is evaluated
by link- and MAC-level simulations.
7.5.1 Link-Level Simulation
Figure 7.8 shows the link-level model for Mobile WiMax system. Each MS selects
and transmits an OFDM modulated access code. The BS receives an aggregated
signal r (t) from all users and it is demodulated by FFT (Fast Fourier transform).
Then, BS operates parallel auto-correlations upon the received access codes with G
candidate access codes. The g-th auto-correlation value between the received signal
r (t) and g-th access code cg is given by
Ag =
L
r (l)cg (l)
(7.1)
l=1
where L is an access code length. An access code is recognized at BS if the autocorrelation value exceeds a decision threshold. Thus, the detection successibility of
access code is mainly dependent on threshold values and decision strategies [21]. In
this work, we introduce a modified auto-correlation like
G·
Bg =
L
r (l)cg (l)
l=1
L
G
r (l)cg (l)
,
g = 1, 2, · · · , G.
(7.2)
g=1 l=1
If the modified auto-correlation is larger than a threshold denoted by Bth , the
access code is successfully detected. Otherwise, it fails in detection.
MS 1
Access
code
selection
AWGN
OFDM
(IFFT)
Fading
Code
detection
MS 2
Access
code
selection
OFDM
(IFFT)
Fading
r(t)
Base station
MS N
Access
code
selection
OFDM
(IFFT)
Fading
Fig. 7.8 Link-level simulation structure
OFDM
(FFT)
Autocorrelation
process
7
A Comparative Study on Random Access Technologies
143
7.5.2 MAC-Level Simulation
Figure 7.9 shows the ranging procedure of Mobile WiMax. An MS transmits a
randomly selected ranging code which was referred as access code in previous
subsection. Then, the BS takes the detection process and broadcasts the result. If the
detection fails due to deterioration of received signal or ranging collision, MS retries
a ranging after a random backoff delay. Conversely, if the detection succeeds, MS
transmits a response message to specify the detailed requests and the identification
(i.e. MAC ID). Finally, BS allocates subchannels to MS based on MSs’ requests. In
this procedure, three time entities are defined:
(a) Response recognition time: the elapsed time from transmission of a ranging
code to reception of detection result.
(b) Success recognition time: the elapsed time from transmission of a ranging code
to recognition of raging success by receiving a channel allocation message to
specified MAC ID
(c) Collision recognition time: the elapsed time from transmission of a ranging
code to collision detection (MS is not able to recognize the ranging failure
until it receives the erroneous channel allocation message with another MS’s
MAC ID).
As shown in Fig. 7.10, a retrial queuing model with a finite population is used
for ranging traffic model with potential arrival rate λ p and population size M. The
potential arrival rate λ p is defined by the ratio of new arrivals to population size in
every frame. And the effective arrival rate λe is defined by the sum of new arrival
rate λn and retrying rate λr . The ranging failure MSs should enter a buffer and
retry ranging after a random backoff delay. Thus, only (M − m) λ p MSs newly try
ranging where m represents the number of MSs waiting for retrying in buffer.
Mobile WiMax system employs the truncated binary exponential random backoff
time between 1 and backoff window Wn as shown in Fig. 7.11. The backoff window
Wn doubly (binary) increases up to maximum backoff window Wmax (truncated).
Detection success
Detection failure
Ranging code
transmission
Backoff_time
Response_recognition_time
BS
Retrials
time
MS
Response_recognition_time
Success_recognition_time
Collision_recognition_time
Ranging success
Ranging failure:
random backoff
Fig. 7.9 Simplified ranging procedure and three time entities in Mobile WiMax system
144
J. Shin and H.-S. Cho
λn = (M − m ) ⋅ λ p
Population: M
Success
New arrival rate
Server
Potential arrival rate ( λ p )
Retrying rate
Failure
λr
Source
Effective arrival rate
λe = λn + λ r
Size: m
Buffer
Fig. 7.10 Finite population arrival model
Arrival, Set n=0
Transmitting
ranging codes
Success?
Yes
Departure
No
n=n+1
Backoff timer randomly generated
between [1, min(Wmax, Wmin*2^(n))]
No
Yes
Backoff timer
expired?
Waiting
Fig. 7.11 Truncated binary exponential random backoff generation
7.5.3 Numerical Results
Table 7.3 summarizes link-level simulation parameters referring to the Mobile
WiMax standard [8]. It is assumed that frequency, time, and power are perfectly
synchronized and the number of access codes is 60. And only one ranging region
is used, thus, every MS transmits a ranging code to the common access region.
Ranging codes are generated by the PN code generator 1 + x 1 + x 4 + x 7 + x 15 .
Monte Carlo simulation method is used to obtain the detection success probability that an access code is correctly detected when the number of MSs is n, which is
simply given by
7
A Comparative Study on Random Access Technologies
145
Table 7.3 Link-level simulation parameters
Parameter
Value
Number of access codes (G)
Length of an access code (L)
Size of FFT
Sub-carrier spacing
Duration of OFDM symbol
Physical frame length
Eb/No
Center frequency
Velocity
Wireless channel model
60
144 bits
1024
9.765625 kHz
115.2 usec
5 msec
20 dB
2.3 GHz
3 km/h
ITU-R pedestrian A [22]
PH I T (n) =
The number of MSs correctly detected
The number of MSs transmitting an access code
(7.3)
Figure 7.12 shows the detection success probability where it is assumed that the
threshold value Bth for successful detection is 2. It is easily shown that PH I T (n)
seriously goes down if the number of MSs becomes higher. This is because the
MAI severely deteriorates as the number of MSs increases. Especially, when 6 MSs
simultaneously try a ranging, the detection success probability PH I T (6) becomes
below 50%.
Fig. 7.12 Detection success probability
146
J. Shin and H.-S. Cho
Table 7.4 MAC-level simulation parameters
Parameter
Value
Response recognition time
Collision recognition time
Success recognition time
Backoff algorithm
4 frames
8 frames
8 frames
Truncated binary exponential
random backoff
8 frames
64 frames
Minimun backoff window size
Maximum backoff window size
Table 7.4 shows MAC-level simulation parameters. It is assumed that Response
recognition time, Collision recognition time, and Success recognition time take 4,
8, and 8 frames, respectively. The retransmission timing is generated by truncated
binary exponential random backoff algorithm [18, 23]. Minimum and maximum
backoff window sizes are 8 and 64 frames, respectively.
Figure 7.13 shows the throughput for the various population size and potential
arrival rate λ p . To fix the number of potential arrivals under changing population,
we define a potential arrival rate index as (λ p /0.01) × (M/200). That is, the average
potential arrivals when the index is i is equal to i × 0.01 × 200. The throughput is
defined by the average number of RA successes in a frame. As the λ p increases, the
throughput increases. In general, a throughput in traffic theory increases up to a cer-
Fig. 7.13 Throughput
7
A Comparative Study on Random Access Technologies
147
Fig. 7.14 Effective arrival rate λ p
tain level and then turns to decrease as arrival traffic increases due to abrupt increase
of collision and interference [24]. In the observation range of our simulation where
the arrival rate is sufficiently large, for example, arrival rate index 7 and population
600 corresponds to the number of MSs larger than 20 per 5 msec (Fig. 7.14), the
throughput decrease does not appear.
Figure 7.15 shows the average delay time elapsed from the first RA trial until RA
success. The delay time is normalized by the frame size of 5 msec. As the λ p index
and the population size M increases, the delay time asymptotically increases to a
certain level. Figure 7.16 shows the ranging success probability at the first try. The
larger λ p and M lead to the lower success probability because the higher effective
arrival rate λe causes more collisions and severer MAI [20, 21]. In order to improve
the performance, the collisions and MAI reduction methods such as enlargement of
resource for ranging, priority scheme, and persistent test prior to ranging are needed.
7.6 Summary
This chapter has introduced a comparative study on the initialization and RA
schemes of 3G and B3G systems. The initialization procedure commonly includes,
a cell search using pilot signal, downlink synchronization and system parameter
acquisition in a sequence. Following the initialization, RA tries the uplink syn-
148
Fig. 7.15 Average delay time till RA success
Fig. 7.16 Success probability at the first try
J. Shin and H.-S. Cho
7
A Comparative Study on Random Access Technologies
149
chronization and the bandwidth request through access probe transmission and the
response from BS. The fundamental design issues for RA such as inter-probe power
control, backoff algorithm, and priority have been addressed to compare the various
mobile communication systems. Especially, random access performance of Mobile WiMax has been evaluated with link- and MAC-level simulation in terms of
throughput, delay time, and success probability.
Acknowledgments This research was supported by Electronics and Telecommunications Research Institute (ETRI), Korea. We would like to thank Dr. Chulsik Yoon and Dr. Sungcheol Chang
in WiBro Standardization Team, ETRI for their valuable comments and discussions.
References
1. Rahim Tafazolli, Technologies for the Wireless Future – Wireless World Research Forum
(WWRF), Wiley, 2005.
2. Harri Holma and Antti Toskala, WCDMA for UMTS, Wiley, 2004.
3. Samuel C. Yang, 3G CDMA2000 Wireless System Engineering, Artech House, 2004.
4. WiMax Forum, White Paper v2.8, “Mobile WiMax – Part I: A Technical Overview and Performance Evaluation,” August 2006.
5. WiMax Forum, White Paper v3.3, “Mobile WiMax – Part II: A Comparative Analysis,” May
2006.
6. 3GPP, TR 25.913 V7.2.0, “Requirements for Evolved UTRA (E-UTRA) and Evolved UTRAN
(E-UTRAN),” March 2006.
7. 3GPP, TR 25.814 V1.3.0, “Physical Layer Aspects for Evolved UTRA,” May 2006.
8. TTA, TTAS.KO-06.0082/R1, “Specifications for 2.3GHz band Portable Internet Service,” December 2005.
9. IEEE, Std 802.16-2004, “IEEE Standard for Local and Metropolitan Area Networks Part 16:
Air Interface for Fixed Broadband Wireless Access Systems,” October 2004.
10. IEEE, Std 802.16e-2005 and Std 802.16-2004/Cor 1-2005, “IEEE Standard for Local and
Metropolitan Area Networks Part 16: Air Interface for Fixed and Mobile Broadband Wireless
Access Systems-Amendment 2: Physical and Medium Access Control Layers for Combined
Fixed and Mobile Operation in Licensed Bands and Corrigendum 1,” February 2006.
11. IEEE, C802.20-05/68, “QFDD and QTDD: Technology Overviews,” October 2005.
12. IEEE, C802.20-06/04, “MBFDD and MBTDD: Proposed Draft Air Interface Specification,”
January 2006.
13. 3GPP2, C.S0024-A. Version 2.0, “cdma2000 High Rate Packet Data Air Interface Specification,” July 2005.
14. 3GPP, TS 25.214 V7.0.0, “Physical layer procedures (FDD),” March 2006.
15. 3GPP, TS 25.211 V7.0.0, “Physical channels and mapping of transport channels onto physical
channels (FDD),” March 2006.
16. Jisang You, Kanghee Kim, and Kiseon Kim, “Capacity Evaluation of the OFDMA-CDMA
Ranging Subsystem in IEEE 802.16-2004,” in Proceedings Wireless and Mobile Computing,
Networking and Communications 2005, vol. 1, pp. 100 – 106, August 2005.
17. 3GPP, TS 25.321 V7.0.0, “Medium Access Control (MAC) protocol specification,” March
2006.
18. Robert M. Metcalfe and David R. Boggs, “Ethernet: Distributed Packet Switching for Local Computer Networks,” Communications of the ACM, vol. 19, no. 7, pp. 395 – 404,
July 1976.
19. 3GPP, TS 25.922 V6.3.0, “Radio Resource Management Strategies,” March 2006.
150
J. Shin and H.-S. Cho
20. Jens Muchenheim and Urs Bernhard, “A Framework for Load Control 3rd Generation CDMA
Networks,” in Proceedings Global Telecommunications Conference 2001, vol. 6, pp. 3738 –
3742, November 2001.
21. Ki-Nam Kim, et al., “The Scheme to Improve the Performance of Initial Ranging Symbol
Detection with Common Ranging Code for OFDMA Systems,” in Proceedings ICACT2006,
pp. 183–188, February 2006.
22. ITU-R, M.1225, Guidelines for Evaluation of Radio Transmission Technologies for IMT2000, 1997.
23. Byung-Jae Kwak, et al., “Performance Analysis of Exponential Backoff,” IEEE/ACM Transactions on Networking, vol. 13, no. 2, April 2005.
24. Alberto Leon-Carcia and Indra Widjaja, Communication Networks: Fundamental Concepts
and Key Architectures, 2nd edition, McGraw-Hill, 2004.
Chapter 8
An Improved Fast Base Station Switching
for IEEE 802.16e with Reuse Partitioning
I-Kang Fu, Hsiang-Jung Chiu and Wern-Ho Sheen
Abstract FBSS (fast base station switching) is an important handover mechanism
in IEEE 802.16e whose OFDMA (orthogonal frequency division multiple access)
mode has been adopted as the mobile WiMax technology. By using one radio-link
connection and multiple network connections for the handover user, FBSS strikes a
good balance between complexity and handover performance, as compared to the
hard handover and macro diversity handover in IEEE 802.16e. In this paper, an
FBSS with reuse partitioning cell structure is proposed to improve the performance
of the traditional FBSS. By reserving some of the radio resource for use of high
reuse factor, and using that radio resource to accommodate those handover users
with bad radio-link performance, packet loss rate of FBSS can be reduced by a ratio
from 38.33 to 84.08%, at the slight expense of 1.67–4.21% cost on average cell
throughput.
Keywords Fast base station switching · Reuse partitioning · IEEE 802.16e · Mobile
WiMax
8.1 Introduction
Broadband mobile communication is targeted to support multimedia services over
a variety of environments such as indoors, outdoors, low-mobility, high-mobility,
etc. Data rate up to several tens Mbps is essential in order to support a multitude of
services and QoS requirements [1].
OFDM (orthogonal frequency division multiplexing) is an effective modulation/multiplexing scheme for broadband communication for its ability to overcome
severe inter-symbol interference (ISI) incurred by high-data-rate transmission [2].
By using parallel orthogonal sub-carriers along with cyclic-prefix, ISI can be removed completely as long as the cyclic-prefix is larger than the maximum delay
I-K. Fu (B)
Department of Communication Engineering, National Chiao Tung University, Hsinchu,
300 Taiwan, ROC
e-mail: apatch.cm91g@nctu.edu.tw
M. Ma (ed.), Current Technology Developments of WiMax Systems,
C Springer Science+Business Media B.V. 2009
DOI 10.1007/978-1-4020-9300-5 8,
151
152
I.-K. Fu et al.
spread. OFDM can also be employed as an effective multiple access scheme in a
multi-cell environment [2]. In particular, OFDMA (orthogonal frequency division
multiple access), a form of OFDM in combination with FDMA, has been recognized
as one of the most promising multiple access schemes for broadband mobile communication [3]. In fact, the OFDMA mode of IEEE 802.16e [4] has been adopted as
the mobile WiMax technology [5].
There are three kinds of handover defined in IEEE 802.16e: hard handover, macro
diversity handover (MDHO) and fast base station switching (FBSS). In hard handover, the system maintains only one connection in both the network and radio-link
sections for the mobile station (MS), and therefore the network and radio-link connections to the target base station (BS) will be established only after breaking the
existing ones. Hard handover is very simple, but services will be disrupted for a
period of time needed for the establishment of the new connections. Contrary to
hard handover, the system maintains multiple network and radio-link connections
at the same time for the MS in MDHO. Therefore, both the network and radio-link
connections to the target base stations can be established before breaking the existing ones. Since MDHO is essentially a soft handover, the service disruption can be
eliminated by having multiple network and radio-link connections simultaneously.
MDHO needs more than one receiver in the MS and hence increases its complexity.
In addition, two copies of radio resource are needed for handover users and that
leads to lower system spectrum efficiency and higher downlink interference.
FBSS, on the other hand, takes advantage of the low service disruption time from
MDHO and low MS complexity from hard handover [4, 6]. At network section,
FBSS establishes connections with potential target BSs before breaking the existing
one, so that the service disruption time can be reduced like in MDHO. Meanwhile,
only one connection will be maintained at the radio-link section so as to keep low
MS complexity as in hard handover. By switching between BSs fast enough, the MS
can maintain its link performance and explore macro diversity gain.
In FBSS, the radio-link will not be switched to the target BS before the establishment of the new network connection to the target BS; otherwise, packets might
be lost and/or become obsolete. This is especially important for real-time services.
Unfortunately, the time needed for the establishment of a network connection is
uncertain (a random variable) and cannot be known in advance [7]; to initiate the
establishment of network connection too early will waste the network resource, but
too late the radio-link performance might be degraded to an unacceptable level and
that incurs packet loss.
In this paper, an improved FBSS with reuse petitioning (RP) cell structure is
proposed for IEEE 802.16e. By reserving some of the radio resource for use of high
reuse factor, and using that radio resource to accommodate those handover users
with bad radio-link performance, the packet loss rate can be substantially reduced,
at the slight expense on average cell throughput.
The rest of this paper is organized as follows. The FBSS in IEEE 802.16e is
presented in Section 8.2. The new FBSS with reuse partitioning is proposed in Section 8.3. Simulation results are given in Section 8.4, and the paper is concluded in
Section 8.5.
8
An Improved Fast Base Station Switching
153
8.2 Fast Base Station Switching in IEEE 802.16e
In the IEEE 802.16e system, an FBSS handover begins with a decision for an MS to
transmit/receive data to/from the Anchor BS that may change within the diversity set
[4]. Diversity set is a set containing a list of active BSs that are informed of the MS
capabilities, security parameters, service flows and full MAC context information,
and the Anchor BS is the BS in the diversity set that is designated to transmit/receive
data to/from the MS at a given frame. Based on the received signal quality, the MS
in FBSS handover can fast switch the Anchor BS so as to obtain the macro diversity
gain. For good performance, the MS can scan the neighbor BSs and select those
suitable ones to be included in the diversity set (diversity set selection/update), and
the MS shall select the best BS from its current diversity set to be the Anchor BS
(Anchor BS selection/update) [4].
Figures 8.1 and 8.2 are used to explain the FBSS operation in IEEE 802.16e
in details. For simplicity only two BSs are considered. Assume the MS is moving
from B S1 toward B S2 , and B S1 is the Anchor BS at the beginning. In IEEE 802.16e,
the parameter H Add, a threshold used to trigger diversity set selection/update, is
broadcasted through DCD (Downlink Channel Descriptor), and the characteristics
of neighbor BSs (B S2 in this case) including BSID, PHY Profile ID, Preamble
Index, etc. through the MOB NBR-ADV message. Base on the information, the
MS may send MOB SCN-REQ to B S1 and get response from MOB SCN-RSP for
requesting a period of time to facilitate scanning and/or association (an optional
Fig. 8.1 Cell structure, received radio-link signals, diversity set membership and Anchor BS selection of an MS involved in FBSS in IEEE 802.16e
154
I.-K. Fu et al.
Fig. 8.2 The message flow of FBSS in IEEE 802.16e
initial ranging) of B S2 , as shown in Fig. 8.2. When the CINR (Carrier to Interference plus Noise Ratio) difference of B S1 and B S2 is less than H Add, the MS
sends MOB MSHO-REQ with a recommended BS list including B S2 . If B S2 is also
in the recommended list in MOB BSHO-RSP, which is replied by B S1 , then the
MS sends MOB HO-IND to request to add B S2 to the diversity set, i.e., to initiate
the diversity selection/update procedure. In Fig. 8.1, this first happens at the time
instant A. After that, B S1 sends HO-Request to B S2 through wire-line network to
establish the network connection, and B S2 will reply HO-Response to B S1 if the
establishment is complete. Accordingly, B S1 can update the MS new diversity set
members through MOB BSHO-RSP.
When the MS keeps moving and if CINR B S2 is higher than CINR B S1 , for example
at the time instant B in Fig. 8.1, the MS may send MOB MSHO-REQ to request to
8
An Improved Fast Base Station Switching
155
change Anchor BS from B S1 to B S2 (initiation of the Anchor BS selection/update
procedure). The request, however, will not be granted in this example until the time
instant C because the network connection to B S2 is not yet established (for some
reason) before that instant, and B S2 will not be included in the diversity set. If
the request is granted, through MOB BSHO-RSP, the MS will send MOB HO-IND
to terminate the existing radio link connection and then perform fast ranging with
B S2 , see Fig. 8.2. Note that B S2 needs to reserve an uplink contention-free ranging
sub-channel for the MS and place Fast Ranging IE in the extended UIUC (Uplink
Interval Usage Code) in a UL-MAP IE (Information Element) to inform the MS this
ranging opportunity. The fast ranging process can be accomplished in two frames,
where the uplink ranging opportunity is indicated by the downlink MAP in the first
downlink sub-frame, and then the MS sends RNG-REQ in the successive uplink
sub-frame based on the radio parameters recorded in the scanning interval. Then
B S2 replies RNG-RSP along with the correction commends encoded in TLV formats
in the second frame. After that, the MS begins to transmit/receive data to/from B S2 .
As is mentioned, the MS is not able to change its Anchor BS to B S2 until the
time instant C, although CINR B S2 is already higher than CINR B S1 at the time instant
B. During the time period between B and C, the MS still talks toB S1 but with a
degraded link performance, and that may result in packet loss. One simple remedy
to this problem is to use a larger H Add; in other words, the request for diversity set
update is initiated earlier. This, however, may waste network resource if B S2 is put
into the diversity set too early. In the next section, an FBSS with reuse partitioning
cell structure is proposed to improve the handover performance at the expense of
slight loss in average cell throughput.
8.3 The Improved FBSS with Reuse Partitioning
Reuse partitioning (RP) is a cell structure in which a regular cell is divided (ideally)
into two or more concentric cell-regions, each with a different frequency reuse factor
[8, 9]. This also implies that the radio resource of a cell has to be divided into the
same number of resource-regions. A smaller reuse factor (small reuse distance) is
allowed for the inner cell-regions because of the smaller transmit power, and a larger
reuse factor is needed for the outer cell-regions so as to maintain the required signal
quality. By allowing the inner regions to use a smaller reuse factor leads to a higher
system capacity, as compared to the regular cell structure where the same reuse
factor is used for the entire cell [9]. In this paper, the concept of reuse partitioning
is used to increase the handover performance.
8.3.1 Reuse Partitioning in IEEE 802.16e
Figure 8.3(a) shows a simplified TDD frame structure in IEEE 802.16e. Preamble,
FCH (Frame Control Header), downlink MAP and uplink MAP are control signals
156
I.-K. Fu et al.
Fig. 8.3 A simplified IEEE 802.16e TDD frame structure with (a) regular K = 4 resource zone,
and (b) regular K = 4 resource zone and K = 7 RP zone
of the frame. The cell-specific Preamble is mainly used for downlink synchronization. FCH contains DL Frame Prefix that indicates the length and coding scheme of
the DL MAP message. DL MAP and UL MAP are MAC messages that define the
starting point of the downlink and uplink bursts, respectively.
In IEEE 802.16e, frequency reuse with factor K can be achieved by dividing
the radio resource in a frame into K resource-regions and each one of them is allocated to different BS. In Fig. 8.3(a), K is equal to 4 so that the radio resource (both
downlink and uplink) is divided into 4 resource-regions. Note that BSs need to be
synchronized and follow the same sub-carrier permutation rule for this scheme to
work [4].
In order to design a reuse partitioning scheme, we adopt the concept of resource
zone in IEEE 802.16e [4]. As an example, in addition to the regular resource-zone
for K = 4, a reuse partitioning (RP) zone is defined for K = 7, as shown in
8
An Improved Fast Base Station Switching
157
Fig. 8.3(b). Again, within each respective zone, the radio resource is divided into K
resource-regions and each one of them is allotted to different BS.
8.3.2 FBSS with Reuse Partitioning
The concept of reuse partitioning is used here to increase the performance of FBSS
handover. The basic idea is as follows. Under the reuse partitioning cell structure,
the handover users who are in a bad channel condition are scheduled to a resourceregion with a large reuse factor so that a better CINR can be maintained, and therefore the packet loss rate is reduced. This method is very effective for the handover
users who are waiting for the target BS to establish the network connection, as
discussed in the previous section.
Figure 8.4 shows the RP cell structure and the received radio-link signals, diversity set membership and Anchor BS of an MS involved in FBSS. K = 4 for the
Fig. 8.4 Reuse partitioning cell structure, received radio-link signals, diversity membership, Anchor BS selection and scheduled zones of an MS in FBSS with reuse partitioning
158
I.-K. Fu et al.
inner cell-region and K = 7 for the outer one with the resource-regions given in
Fig. 8.3(b). In the K = 7 resource-region, since a large reuse factor is used, the received CINR of an MS is higher as compared to the K = 4 resource-region. Initially,
the MS talks to B S1 by using resource in the K = 4 resource-region. As discussed
in the previous section, during the time between B and C, although CINR B S2 is
higher than CINR B S1 , the MS still talks to B S1 since the network connection to B S2
is not ready yet. In the case of using reuse partitioning, the difference from Fig. 8.1
is that now we have K = 7 resource-zone, and the handover users going through
this period of time can be re-scheduled to that region to improve the radio-link
performance if its CINR is less than the threshold ρr eq . Therefore, the packet loss
during this period will be mitigated and the packet loss rate can be substantially
reduced.
8.4 Simulation Results
In this section, simulation results are given to illustrate the handover performance
of FBSS with and without reuse partitioning.
8.4.1 Simulation Model
The IEEE 802.16e downlink OFDMA system is simulated in a multi-cell urban
environment, where cells are assumed to be synchronized to each other. Total of 19
cells is simulated with 1 km cell coverage under 15 Watts transmit power. K = 4
for the regular resource-zone and K = 7 for the RP resource-zone. Each cell has
three sectors. The OFDM PHY parameters are given in Table 8.1.
Table 8.1 Parameters for system-level simulation
Parameter
Value
Channel bandwidth
FFT size
OFDM symbol duration (including cyclic-prefix)
Cyclic-prefix
Sub-carrier frequency spacing
Frame duration
Downlink sub-frame duration
Sub-carrier permutation rule
Number of bins
Number of sub-carriers in a bin
Number of sub-carriers for data transmission
Number of sub-carriers for guard band
Sub-channel definition
Maximum diversity set size
Threshold to schedule MS into the RP zone, ρr eq .
Time to establish network connection
6 MHz
2048
336 s
37.333 s
3.348 kHz
20 ms
10 ms
Adjacent sub-carrier permutation
192
9
1728
320 (2048–1728)
2 adjacent bins × 3 adjacent symbols
3
6 dB
Uniform distributed between 200 ms
∼ 700 ms [7]
8
An Improved Fast Base Station Switching
159
At the beginning of the simulation, MSs are generated by Poisson processes
and located randomly in a cell. The path loss to every BS is calculated for each
MS, and the log-normal shadow fading (with de-correlation distance of 50 m) and
frequency-selective fading are generated according to the models given in [10]. An
MS will send a service request to the BS with the highest effective CINR, and the
request will be granted if there is radio resource available. Otherwise, the MS will
be blocked and removed in the simulator. The effective CINR is evaluated on the
received preamble signal part by the EESM (Exponential Effective SIR Mapping)
criterion [11]. The location of an MS is periodically updated based on ITU vehicular mobility model [12] with mobility of 50km/hr. According to the mechanism
proposed in Section 8.3, the diversity set of an MS may be updated according
to the CINR variation. Moreover, the anchor BS is the BS in diversity set with
the highest CINR, and the MS only transmits/receives the radio signal to/from the
anchor BS.
The G.729 VoIP traffic model is adopted in the simulation. The VoIP packet
arrives every 20 ms with a packet size of 640 bits. The packet error rate is determined
by the received SINR of the data traffic part and can be obtained by looking up table
given in [4].
8.4.2 Simulation Results
The performances of FBSS are given in Fig. 8.5, where PR P is the percentage of
radio resource allotted to the K = 7 resource-region. Three sets of results are given
including packet loss rate, average diversity set size and cell throughput. In all of
the results PR P = 0 represents the case of traditional FBSS; that implies no RP
resource-region is reserved. Figure 8.5(a) shows the result of packet loss rate. As
can be seen, PR P should be large enough, says more than 5%, in order to obtain a
sizable reduction on packet loss rate. More specifically, 38.33% to 84.08% reductions are achievable by increasing PR P from 7.29% to 21.88%, with respect to the
case PR P = 0. Note that the packet loss rate reduction becomes saturated if PR P
is larger than around 21.88%. In addition, for a PR P , a lower packet loss rate is
obtained with a larger H Add.
Figure 8.5(b) shows the average diversity set size, which is an indicator on the
network resource usage. As expected, the diversity set size is unchanged with different PR P for a specific H Add. On the other hand, when increasing H Add, the
neighbor BSs might be added to the diversity set too early before the MS really
needs to change its Anchor BS. Therefore the average diversity set size is larger and
more network resource is consumed.
The cell throughput is shown in Fig. 8.5(c). Since frequency reuse factor is larger
in RP zone, the larger PR P , the lower the cell throughput. The results show that less
than 4.21% cell throughput will be lost even when PR P is increased to 21.88%. It is
because the reduction on packet loss rate can increase the effective packets received
by the MS, which can increase the cell throughput.
160
Fig. 8.5 The performances of
FBSS with reuse partitioning
I.-K. Fu et al.
8
An Improved Fast Base Station Switching
161
8.5 Conclusions
In this paper, an FBSS with reuse partitioning cell structure is proposed to improve
the performance of the traditional FBSS in IEEE 802.16e. By reserving some of
the radio resource for use of high reuse factor, and using that radio resource to
accommodate those handover users with bad radio-link performance, the packet loss
rate of FBSS can be reduced by 38.33% to 84.08%, at the slight expense of 1.67% to
4.21% cost on cell throughput. Compared with the traditional method, using reuse
partitioning cell structure can achieve more significant reduction on packet loss rate
for FBSS in the IEEE 802.16e system.
References
1. Recommendation ITU-R, “Framework and overall objectives of the future development of
IMT-2000 and systems beyond IMT-2000,” International Telecommunication Union, June
2003.
2. R. Van Nee and R. Prasad, “OFDM for Wireless Multimedia Communications,” Boston:
Artech House, 2000.
3. H. Yang, “A road to future broadband wireless access: MIMO-OFDM-based air interface,”
IEEE Communications Magazine, Vol. 43, Issue. 1, pp. 53–60, January 2005.
4. IEEE 802.16e-2005, “IEEE standard for Local and Metropolitan Area Networks, Part 16: Air
interface for fixed and mobile broadband wireless access systems, amendment for physical
and medium access control layers for combined fixed and mobile operation in licensed bands,”
February 2006.
5. WiMax Forum, “Mobile WiMax Part I: A Technical Overview and Performance Evaluation,”
August 2006. http://www.wimaxforum.org/news/downloads/
6. S. Choi, G-H Hwang, T. Kwon, A-R Lim, and D-H Cho, “Fast Handover Scheme for RealTime Downlink Services in IEEE 802.16e BWA System,” IEEE Vehicular Technology Conference, Vol. 3, pp. 2028–2032, June 2005.
7. F. Feng and D. S. Reeves, “Explicit Proactive Handoff with Motion Prediction for Mobile
IP,” IEEE Wireless Communications and Networking Conference, Vol. 2, pp. 855–860, March
2004.
8. 3GPP R1-05-0407, “Interference Coordination in new OFDM DL air interface,” 3GPP TSG
RAN WG1 #41, May 2005.
9. T-P Chu and S. S. Rappaport, “Overlapping Coverage with Reuse Partitioning in Cellular Communication Systems,” IEEE Transactions on Vehicular Technology, Vol. 46, No. 1,
pp. 41–54, February 1997.
10. I-K Fu, W. Wong, D. Chen, P. Wang, M. Hart and S. Vadgama, “Path-loss and Shadow Fading
Models for IEEE 802.16j Relay Task Group,” IEEE C802.16j-06/045, July 2006.
11. WiMax Forum, “WiMax System Evaluation Methodology V1.0,” January 2007.
12. UMTS 30.03, “Universal Mobile Telecommunications System (UMTS); Selection Procedures
for the Choice of Radio Transmission Technologies of the UMTS,” TR 101 112 V3.2.0, April
1998.
Chapter 9
Fast Handover Schemes in IEEE 802.16E
Broadband Wireless Access System
Qi Lu, Maode Ma and Hui Ming Liew
Abstract IEEE 802.16e is a promising system to provide broadband wireless access
for wide area mobile communications. As the enhanced version of IEEE 802.16,
with the mobility support, it becomes a potential candidate to satisfy the requirements of high data rate and wide coverage in the next generation wireless communication system. However, the handover procedures specified by the standard may
cause large handover delay, which would not be suitable for the service of real-time
applications. To improve the system performance and reduce the handover delay,
several fast handover schemes have been proposed. In this chapter, an overview of
the basic handover modes and the handover procedure defined in the standard IEEE
802.16e is presented. Some fast handover schemes, which have been proposed to
reduce the handover latency, are reviewed. A more complex relay system and the
corresponding new MAC frame structure to support the network relay are discussed.
A handover scheme to reduce the handover latency in the WiMax relay system
is summarized. The concept to construct a moving network and the fast handover
scheme to support the network mobility is discussed.
Keywords Handover · IEEE 802.16e · WiMax · Network mobility
9.1 Introduction
IEEE 802.16e wireless metropolitan area networks support combined fixed and mobile broadband wireless access. As the enhanced version to previous IEEE 802.16
system, IEEE 802.16e can provide services for subscriber stations moving at vehicular speeds within the licensed bands below 6 GHz [1]. The standard specifies
the Physical (PHY) and Medium Access Control (MAC) layers for system operation to support wireless services. Based on the orthogonal frequency division
multiple access (OFDMA) technology, IEEE 802.16e system is designed to target
Q. Lu (B)
School of Electrical and Electronic Engineering, Nanyang Technological Unversity,
Singapore
M. Ma (ed.), Current Technology Developments of WiMax Systems,
C Springer Science+Business Media B.V. 2009
DOI 10.1007/978-1-4020-9300-5 9,
163
164
Q. Lu et al.
non-line-of-sight (NLOS) communications with features such as high data transmission rate, wide coverage and mobility support.
In such wireless systems, to support mobile users, the handover scenarios should
be fully considered. Here, the handover is defined as a Mobile Station (MS) migrates
from the air interface provided by one Base Station (BS) to the air interface provided
by another BS [1]. Which means the MS is moving across the boundaries of air
interfaces of two BSs, and the area of this air interface is usually called as a cell.
As defined in IEEE 802.16e standard, three basic handover modes are supported
to enable continuous data transmission and services when a MS moves across the
cell boundaries of BSs, and they are: Hard Handover (HHO), Macro Diversity Handover (MDHO) and Fast Base Station Switching (FBSS). Among these handover
modes, HHO is mandatory in IEEE 802.16e system, while MDHO and FBSS are optional. HHO adopts a break-before-make approach, which is less complex and easier
to implement than MDHO and FBSS. However, it may introduce a long handover
delay and affect the performance of delay sensitive services. To solve this problem,
several fast handover schemes are proposed. In [2], a target BS selection strategy
was suggested, which only selects one neighbor BS for scanning or association,
and it can reduce the redundant scanning and association processes. In [3], a fast
handover scheme for real-time downlink (DL) services was proposed, which defines
a Fast DL MAP IE message to support DL traffic during handover process. In [4],
a solution named as “Passport Handover” scheme was introduced, which enables
data transmission during handover and shortens the service interruption with the
proposed connection identity (CID) handling mechanism.
As the enhancement to the basic system structure, the concept of Relay Stations
(RSs) has been introduced into the WiMax network design to achieve the coverage
extension or the capacity increment. To realize the idea to support RSs in the IEEE
802.16 networks, new MAC frame structures have been proposed in [5] for both
distributed control of relays and central control of relays. Since a handover can
also happen in the relay networks, one handover scheme to reduce the handover
latency was proposed in [6], which reduces the occurrence of inter-cell handovers
and tries to perform intra-cell handovers when two types of handovers are available.
Different from the generic handover scenario with an individual MS moving which
is regarded as node mobility, a more complex architecture with a group of MSs
moving simultaneously is called network mobility, which has also received a lot
of attention recently. For the handover processes in the WiMax relay networks, the
concept of an Multi-hop Relay architecture has been introduced in [7], where a mobile RS is essentially to be connected by other MSs to construct a moving network
and achieve the network mobility. In [7], a proposal of fast handover scheme to
reduce the handover delay has also been detailed for the network mobility in the
relay networks.
The rest of this chapter is organized as follows. Section 9.2 gives an overview
of the three basic handover modes and the standard handover procedures specified
in the standard first. Then various proposals of fast handover schemes to enhance
the standard handover operation have been described. In Section 9.3, the WiMax
relay system and corresponding MAC frame structures are investigated. The possi-
9
Fast Handover Schemes
165
ble improvement on handover to reduce handover delay in relay system is discussed.
Section 9.4 describes a system architecture of network mobility with relay structure,
and the fast handover scheme for network mobility is reviewed. Finally, a summary
and conclusion is given in Section 9.5.
9.2 Standard Handover and Improvements
In this section, the three handover modes supported in IEEE 802.16e WiMax networks are introduced. Later, the features and the differences of each mode are briefly
discussed. Then, an overview of the standard hard handover procedure is presented
to show the detailed steps by using a flow chart. The options to the standard handover steps are also discussed. Finally, the state-of-the-art fast handover schemes
proposed to speed up the handover procedure and improve the system performance
are reviewed with comparison.
9.2.1 Handover Modes in IEEE 802.16e Networks
To support a MS moving across cell boundaries of several BSs while maintaining data transmission, the handover operation is required. According to the IEEE
802.16e, the mandatory handover mode is Hard Handover. Besides this, Macro Diversity Handover and Fast Base Station Switching are also adopted by the standard,
although they are optional. These three modes are illustrated in Fig. 9.1.
In Hard Handover, the adjacent BSs use different frequencies for the information
transmission, and a MS connects to only one BS at a time. In the case that a handover
is required, the current connection with serving BS should be broken before new
connection with target BS is established. This handover process is initialized when
the signal level from neighbor BS exceeds the signal level from current serving BS
for certain threshold. It is simple and easy to implement, but high latency may be
caused and this latency may interrupt the service of delay sensitive applications.
In Macro Diversity Handover, all the BSs use only one frequency for information delivery. A Diversity Set, which includes several BSs involved in the handover
process, is maintained for the MS, which can communicate with all the BSs in this
Diversity Set simultaneously. During the handover process, some diversity techniques could also be applied. The Diversity Set is maintained and updated based on
the long-term statistical signal strength of BSs. When the long-term statistical signal
strength of an active BS is less than H Delete Threshold, this BS will be dropped
from the Diversity Set, while if long-term statistical signal strength of a neighbor BS
is greater than H Add Threshold, this BS will be added to the Diversity Set. Among
these BSs listed in the Diversity Set, one of them is selected as the Anchor BS. The
MS is only synchronized and registered to this Anchor BS for the transmission of
management messages.
166
Q. Lu et al.
Fig. 9.1 Handover modes
In Fast Base Station Switching, similar to Macro Diversity Handover, a Diversity Set for MSs is maintained. But the MSs can only connect to the Anchor BS
for data transmission and management messages transmission. The Anchor BS can
be changed during operation according to Anchor BS selection requirement. And
the new Anchor BS and Diversity Set can be updated according. The switching of
the connection from current Anchor BS to another BS in the Diversity Set can be
intialized when a handover is required.
Although the IEEE 802.16e supports these three handover modes, the MDHO
and FBSS require more complex handover procedures and special configuration of
the network architecture. In the standard system, the hard handover is mandatory
and preferred.
9.2.2 Standard Hard Handover Procedures
The standard handover process includes the following steps of cell reselection, HO
decision & initiation, termination with the serving BS and network entry/re-entry.
A brief overview of these steps is given in the following paragraphs.
In the cell reselection phase, a MS may scan or associate with its neighbor BSs
to determine the suitable one as the target BS for performing handover. This step is
carried out before the handover request is made. In the system, the serving BS broad-
9
Fast Handover Schemes
167
casts the topology information and the channel information of neighbor BSs with
Mobile Neighbor Advertisement (MOB NBR-ADV) message periodically. The MS
can acquire this information about neighbor BSs and use it for the consideration of
cell reselection before scanning process is started. Later, the MS may use Mobile
Scanning Request (MOB SCN-REQ) to request allocation of scanning intervals.
Then, these scanning intervals are allocated and acknowledged by serving BS via
Mobile Scanning Response (MOB SCN-RSP) to initiate the scanning process. During the scanning process, the MS measures the channel quality or signal strength
of each neighbor BS. Some neighbor BSs may be selected as candidate BSs for the
later actual handover. The cell reselection is performed prior to actual HO, and at
this stage, the connection to the serving BS is still maintained.
In HO decision & initiation phase, a handover process is initiated by Mobile
MS Handover Request message (MOB MSHO-REQ) or Mobile BS Handover Request message (MOB BSHO-REQ) when the conditions to perform handover are
satisfied. Both of the MS and the serving BS can request a handover activity. If
the handover is requested by the MS, the MS may send MOB MSHO-REQ and
indicates the possible target BSs based on the performance evaluation from previous
scanning or association. The serving BS may negotiate with the recommended target
BSs via backbone network, and it sends acknowledgement to the MS with Mobile
BS Handover Response message (MOB-BSHO-RSP). If the handover is requested
by the serving BS, the serving BS may send MOB BSHO-REQ to the MS, in which
the suitable neighbor BSs are recommended. The MS can conduct handover to one
of the recommended BSs, or reject this recommendation and attempt to perform
handover to some other BSs. During the message exchange, dedicated ranging opportunity may be allocated to speed up ranging process for later network re-entry.
Finally, Mobile Handover Indication message (MOB HO-IND) is issued to indicate
the releasing of serving BS.
After the exchange information of handover request and response, the MS terminates the connection with serving BS by sending MOB HO-IND, and it starts
network entry/re-entry step. The whole network re-entry process includes ranging,
re-authorization and re-registration. In this phase, the MS needs to synchronize
with downlink transmission and obtain downlink and uplink transmission parameters with target BS. Then Ranging Request message (RNG-REQ) will be sent
to start a ranging process, dedicated ranging opportunity may be available if it is
allocated in the previous step, which can avoid contention-based ranging. Later,
Ranging Response message (RNG-RSP) is transmitted, and in which the re-entry
management messages that can be omitted are indicated. After the channel parameters are adjusted, the MS can communicate with target BS to negotiate channel
capability, perform authorization and conduct registration. Some information about
the MS may be transferred from the serving BS to target BS via backbone network
to speed up this process. The handover procedure is completed thereafter, and the
data transmission between the MS and the new serving BS could be started. An
example flow chart of standard handover is shown in Fig. 9.2, and an example of
handover procedure at MAC layer is given in Fig. 9.3 [1].
168
Q. Lu et al.
Fig. 9.2 Handover flow chart
During the standard handover process, some assisting schemes are provided for
optional adoption. All of these schemes may be used to provide alternative handover
support or to speed up the handover process. In the association procedure, three
levels of association can be performed according to the system configuration, and
they are scan/association without coordination, association with coordination and
network assisted association reporting. When the scan/association without coordination is used, the target BS has no knowledge about the MS, and only contention-
Fig. 9.3 MAC layer
handover procedure
9
Fast Handover Schemes
169
based ranging can be conducted. The MS randomly picks up a contention-based
ranging code from the domain of target BS and transmits it during the contentionbased ranging interval. After the target BS receiving the ranging code, the uplink
(UL) allocation would be provided to the MS to conduct association. If the association with coordination is chosen, the serving BS would coordinate the ranging
process and provide the association parameters of target BS to the MS. By this
method, dedicated ranging code and transmission opportunity would be assigned by
the target BS, and it would be informed to the MS by serving BS. In the network
assisted association reporting, the MS only transmits the ranging code to target BSs
while the information about the channels from each neighbor BS would be sent to
the serving BS via backbone network. The required information would be aggregated and sent to the MS later by the serving BS in the form of a report message
Mobile Association Report (MOB ASC REPORT).
Other options are also available as follows. Before the ranging process in the network re-entry step, Fast Ranging IE may be used to allocate a non-contention-based
initial ranging opportunity in the case that target BS can receive handover notification from the serving BS via backbone network. And also in the network re-entry
step, some information of MS can be transferred through the backbone network,
and it allows skipping transmission of some re-entry management messages, such
as capability negotiation, authentication and etc. All of these options may be used
to improve the handover performance or to reduce the handover delay.
9.2.3 Proposed Fast Handover Schemes
Although the standard hard handover process is able to maintain data transmission
for a MS moving across cell boundaries, it still may cause serious interruption for
delay sensitive services. To further reduce the handover latency, especially to lower
the interruption for the real-time applications, several fast handover schemes are
proposed in various research publications.
In [2], a target BS selection algorithm is proposed to reduce redundant scanning
or association during the scanning process and expedite the cell reselection procedure. When scanning process starts, the data transmission would be paused during
the neighbor BS scanning or association. It may interrupt the services seriously, if
the number of neighbor BSs needs to be scanned or associated is large, the time
spent on scanning process will be long. In normal scanning process, MS needs to
scan or associate with neighbor BSs one by one, and the scanning time increases as
the increasing of the number of neighbor BSs. The proposed algorithm suggests to
acquire physical information of neighbor BSs and to estimate the mean carrier to
interference-plus-noise ratio (CINR) of each neighbor BS. And the BS with larger
mean CINR is more likely to be the target BS. Later the MS needs to conduct the
scanning process with only one selected BS. The whole scanning process would
only contain one scan or association activity and the time spent on redundant association processes is reduced. An example of the improvement by the proposed
170
Q. Lu et al.
Fig. 9.4 Single BS scanning procedure
scheme is shown in Fig. 9.4 when Neighbor BS 1 is selected as the only target BS.
The Neighbor BS 1 would be scanned or associated while Neighbor BS 2 would not
be, and the total time for scanning is approximately reduced by half.
In [3], the proposed scheme enables the DL data transmission immediately after
DL synchronization with target BS. It can reduce the service disruption for DL
applications. In normal case, the MS can receive data only in the normal operation
mode after the whole handover process is finished, and the long handover process
may cause data loss, which will impair real-time services much and degrade the system performance. A Fast DL MAP IE is defined in this suggested scheme, which
contains the MAC address of the MS and resource allocation information for DL
data transmission. During the handover procedure, the target BS can transmit data
using Fast DL MAP IE to the MS with old CID, only after the downlink synchronization without the UL synchronization until new CID is updated. The proposed
solution can shorten the delay in data transmission to MS. To maintain backward
compatibility with normal handover procedure, one reserved bit in the generic MAC
header is defined as the fast DL indication bit, which is used to indicate the existence of data that requires fast DL transmission. When a handover process occurs,
the fast DL indication bit should be set to one for the DL data, which need to be
fast transmitted. Then the data can be transmitted by the target BS using the Fast
DL MAP IE during the handover. For other data with the zero value in the fast
downlink indication bit, they would be transmitted after finishing the handover and
returning to normal operation mode. The Fig. 9.5 shows an example that handover
is performed from the serving BS to the target BS, and the target BS transmits fast
DL data to the MS after DL synchronization.
In [4], a so-called Passport Handover scheme is proposed to allow real-time
applications to start downlink transmission and uplink transmission before the
handover process is completed. Then the MS can communicate with target BS
continuously during network re-entry process without stop of the services. In this
scheme, the CID assigned by serving BS will be also accepted by target BS for
9
Fast Handover Schemes
171
Fig. 9.5 Handover procedure
for fast downlink
transmission
data transmission. Similar as [3], the downlink transmission is resumed just after
downlink synchronization using the old CID. But this scheme also allows the uplink
transmission to be continued with old CID just after ranging response and before
the authorization process. Until the handover process is over, the data transmission
is conducted using updated new CID. To avoid collision of old CID with active
CIDs used by target BS during the handover process, a CID assignment method is
provided in [4]. Since by this scheme, a group of CIDs should be reserved by both
serving BS and neighbor BS as the passport CID, the number of these available CIDs
may not enough for handling all connections so that this scheme is supposed to be
used only for delay sensitive applications. For other non-delay sensitive services, the
regular handover would be performed. An example flow of using this fast handover
scheme is shown in Fig. 9.6. The downlink data transmission is conducted just after
downlink synchronization before ranging. And the uplink transmission is carried
out only after ranging with uplink synchronization and before the network re-entry.
The first BS selection scheme is mainly to reduce delay in the scanning of neighbor BSs during the cell reselection procedure before the actual handover request is
sent. The basic idea is to reduce the redundant scanning or association processes and
select only one target BS to be scanned or associated based on the estimated CINR
from each neighbor BS. Although this strategy can reduce lots of time spent on multiple rounds of scanning or association, it has not provided a feasible way to estimate
the CINR from neighbor BSs to the MS. For the second and third schemes, both of
them are proposed to make data transmission possible during the handover process.
So they may be used to improve the performance and reduce the service interruption for real-time applications. The second fast handover scheme could only realize
downlink data transmission during the handover, therefore, it is only applicable to
the real-time downlink services such video streaming, multimedia radio, and etc.
However, the third fast handover scheme, which can achieve data transmission for
either downlink or uplink, could provide much more benefits to help different types
172
Q. Lu et al.
Fig. 9.6 Passport handover
procedure
of applications and improve performance of the networks in the handover process.
But due to limited number of CIDs could be reserved, this scheme is recommended
for mainly handling real-time applications. It is clear that the third scheme would
be much better with wider usage than the second scheme because it is applicable to
all types of real-time applications rather than only downlink services. And also the
third scheme can be implemented with the first scheme together to achieve overall
better performance in the handover process because they function at the different
stages of the handover.
9.3 Relay Systems and A Handover Scheme
In this section, the relay technique and the structure of relay system will be reviewed.
The MAC frame structures used in the relay systems are discussed. And finally, one
fast handover scheme proposed to shorten the handover process in the relay systems
is studied.
9.3.1 Relay Systems
The purposes to introduce relay topology into WiMax system are mainly to extend
the network coverage and to increase the system capacity. In such WiMax relay
systems, one or more RSs are required to serve as relay servers. Generally, a RS is
a simplified version of a BS, and it can be fixed or mobile. A fix RS is installed at a
certain position permanently while a mobile RS can move within certain region. All
of them are connected to the BS via wireless radio interface.
The scenarios that RSs are used to extend network coverage and to increase system capacity are shown in Figs. 9.7 and 9.8, respectively.
9
Fast Handover Schemes
173
Fig. 9.7 RSs to extend
network coverage
When RSs are used to extend the network coverage, a RS is usually located at the
boundary of last RS or BS. Therefore, the BS can establish connection with the MS,
which is far away and outside the BS’s own coverage. The communication between
the BS and the MS is conducted via one or more RSs in the path. In this system
relay structure, the RS can deliver data to the MSs within its coverage or forward
data to next RS.
When RSs are used to increase system capacity, a RS is placed within the coverage of the BS. The MS can connect to its local RS, and then communicates with
the BS. So the total simultaneous connections are increased. Similar as previous
scenario, the data transfer between the BS and the MS is forwarded by the RS.
To implement the relay system in the WiMax system specified by IEEE 802.16e
standard, some modifications are required. An important change on the MAC frame
structure to support the relay networks was proposed in [5]. The solution enables
multi-hop data transmission from the BS to the MS via multiple RSs. In the relay
system, handovers also exist when the MS moves across the cell boundaries of
RSs or BSs. A solution to reduce the handover delay in such relay systems was
provided in [6] by reducing the inter-cell handover events. Moreover, if a mobile
RS is installed, the solution can be further extended to construct a moving network
with several mobile devices in motion simultaneously to support network mobility
Fig. 9.8 RSs to increase
system capacity
174
Q. Lu et al.
as described in [7]. In this system, the MSs are connected to a Mobile Relay (MR),
which is regarded as a mobile RS, and the handover could happen between the MR
and BSs while the network moves across cell boundaries.
9.3.2 MAC Frame Structures for Relay Network
By the IEEE 802.16e standard, the data transmission in WiMax system is base on
a frame structure which is further divided into a DL sub-frame for the information
delivery from the BS to MSs and an UL sub-frame for the information delivery from
MSs to the BS. The DL sub-frame comprises of the bursts of control information
broadcasted and several MAC data units in following DL bursts. The UL sub-frame
comprises of contention intervals and UL bursts for transmission of data units. These
two sub-frames are separated by gaps. The generic MAC frame structure is shown
in Fig. 9.9 [1].
Based on the generic MAC frame structure, some modifications could be made
to allow the data transmission in the relay systems. Two types of relays, which are
de-centrally controlled relays and centrally controlled relays, are available, which
can be selected to implement according to the system architecture. The modified
MAC frame structure and connection management of these two relaying approaches
are both discussed in [5].
In the de-centrally controlled relays, one RS has full control of MSs connected to
it, and then it connects to the BS. The RS appears to be a BS from the view of MSs,
and it seems to be a MS from the view of BS. To enable this relaying operation, some
modifications on the MAC frame structure are needed. The new frame structure
consists of a broadcast portion, 1st hop DL bursts, a contention interval, 1st hop UL
bursts and multi-hop sub-frames. In the MAC frame, DL bursts and UL bursts of
the first hop transmission between BS and RS are specified by the BS. Later, the DL
bursts and UL bursts of second hop transmission between the RS and MS or the RS
of the next hop are built by the RS at the current hop in the multi-hop sub-frame
portion, when the frame is received by the RS. The overall frame structure needs
to be compatible with the standard generic MAC frame. During the operation, the
MSs can only observe the multi-hop sub-frame built by their RS. The MAC frame
is shown in Fig. 9.10 [5].
Fig. 9.9 MAC frame structure
9
Fast Handover Schemes
175
Fig. 9.10 Frame structure for De-centrally controlled relays
To maintain the overall connection in the de-centrally controlled relays, a RS
appears to be a regular MS to the BS, and the BS only needs to set up and maintain
the connection to the RS. At the same time, the RS appears to be a regular BS to
MSs, and it needs to set up and maintain the connection to the MSs.
In the centrally controlled relays, the BS has full control of RSs and MSs in the
network. A RS woks simply like a router to forward frames from the BS to MSs.
In the proposed frame structure, it consists of a broadcast portion, DL bursts for
multiple hops, a contention interval and UL bursts for multiple hops. In the MAC
frame, the BS constructs the DL bursts and UL bursts of first hop and the subsequent
hops in a consecutive manner. Unlike the de-centrally controlled approach, there
is no multi-hop sub-frame existed in the frame structure. The frame structure also
needs to be compatible with the standard generic MAC frame. During the operation,
the RS forwards frames between BS and MSs, and MSs can communicate with BS
like through direct connection. The MAC frame is shown in Fig. 9.11 [5].
For the centrally controlled relays, the RSs just forward packets between the BS
and the MS. The connection between the RS and the MS would correspond to the
connection between the BS and the MS. To set up and maintain overall connection
Fig. 9.11 Frame structure for centrally controlled relays
176
Q. Lu et al.
from the BS to the MS, each time the MS establishes a connection to the RS, the RS
needs to establish a corresponding connection to the BS.
With the concepts of above two implementations of the relay structure and
the MAC frame structures, the relay system could be functioned. And either one
of these two types could be selected to function by the system engineers according to the system requirements. For the de-centrally controlled relays, the
selection of the path for data transmission would be more flexible, but the BS
has less control on the MSs. While in the centrally controlled relays, the BS
has more control on the MSs, but the path for the data transmission should be
predefined.
9.3.3 Fast Handover Scheme in Relay System
In the WiMax relay systems, two types of handover may happen, and they are intracell handover and inter-cell handover. The intra-cell handover occurs when a MS
moves across the boundaries of coverage of RSs connected to the same BS. While
the inter-cell handover happens when the MS moves to another RS connected to
a different BS. Since the BS manages all the RSs connected to it, and all the RSs
can obtain the necessary information about the MS from the BS, so less information
and procedures are required for the intra-cell handover. In contrast, more complex
network re-entry process is needed for the inter-cell handover. Therefore, the intracell handover would be simpler and faster than inter-cell handover. To reduce the
handover latency in the relay system, a fast handover scheme was proposed in [6]
to abbreviate handover procedure shown in Fig. 9.12 [6]. It would reduce the occurrence of inter-cell handovers and preferably select intra-cell handover when it is
available.
To achieve the goal of reducing the inter-cell handovers, firstly, the MS should
identify which BS the neighbor RS is belonging to. Two methods are proposed to
use. The first one is called Hierarchical BS/RS ID, which changes the BSID format
to include the IDs of RSs. The new structure of full BSID which can be acquired
from the MOB NBR-ADV is shown in Fig. 9.13 [6]. The first 24 bits is used for the
Operator ID as the standard BSID format, while the last 24 bits are used for both
BS ID and RS ID. When the MS obtained this information, it can identify which BS
the RS is connected to.
Another method is to use an additional Type/Length/Value (TLV) encoding in
the MOB NBR-ADV. It would include the BS ID of a RS, when the RS is found
to be the neighbor of the MS. So during the broadcasting of MOB NBR ADV, it
could notify the MS which BS the RS is connected to. The TLV encoding is shown
in Fig. 9.14 [6].
By knowing the BS of the neighbor RS, the MS can preferably choose the RS
within the same BS, which the serving RS is connected to, to perform handover.
Therefore, when a handover is required, the MS would conduct intra-cell handover
if the signal strength from the inter-cell RS is similar. Only if the signal strength
9
Fast Handover Schemes
177
Fig. 9.12 Intra-cell handover procedure
Fig. 9.13 Hierarchical
BS/RS ID format
from the inter-cell RS is much stronger than that from the intra-cell RS by certain
threshold, the MS could conduct inter-cell handover. In the Fig. 9.15, it shows a
scenario that an intra-cell handover is performed rather than an inter-cell handover
when the MS moves to the boundary of the serving RS.
While the relay network is available, with this handover algorithm, the occurrence of inter-cell handovers may be decreased and the intra-cell handover would
Fig. 9.14 TLV Encoding for BS ID
178
Q. Lu et al.
Fig. 9.15 Intra-cell handover is preferred
be preferably selected, when both inter-cell and intra-cell handovers are possible.
Because the intra-cell RSs are connected to the same BS and all the RSs could
have knowledge about the MS, the network re-entry procedures would be simplified.
Therefore, the intra-cell handover would be relatively simpler and faster, and smaller
handover latency would be introduced into the handover process.
9.4 Network Mobility and Fast Handover Scheme
Some particular scenarios such as network mobility with a network moving can be
supported with the relay structure in WiMax networks. To construct the moving network and realize network mobility, a MR could be used to connect multiple mobile
stations and the BS. The MR in the system actually acts as a mobile RS, which
is used to establish the mobile relay system. Therefore, each MS in the moving
network can communicate with the BS via the MR. In the system, the handover may
happen between the MR and BSs while the network moves across cell boundaries.
The MSs would not perform handovers with the BSs directly but via the MR. The
network structure for network mobility is shown in Fig. 9.16 [7].
To realize the network mobility, a network mobility handover algorithm is required. In [8], a primary handover scheme was proposed. Since it doesn’t consider
link layer handover but only network layer handover, high handover latency may
be produced by using this method. In conventional handover process, the link layer
handover and the network layer handover should be conducted in series, which in
shown in Fig. 9.17 [7], and it consumes quite long time to finish the overall handover
process. To minimize the handover delay, a fast handover scheme was proposed
in [7], which integrate link layer and network layer handover procedures to shorten
this process.
9
Fast Handover Schemes
179
Fig. 9.16 Network mobility
system
In the suggested fast handover scheme in [7], two triggers: Link Going-Down
(LGD) and Link Switch Complete (LSC) are introduced to achieve concurrent handover procedures at both network layer and link layer. During the neighbor discovery, the MOB NBR-ADV would carry both the channel information of neighbor
BSs and the Access Router (AR) information. The MR would monitor the signal
strength continuously, and may initiate a handover process depending on pre-defined
threshold. When the threshold is satisfied, the MR starts the concurrent handover
procedures at both layers using LGD trigger. After that, same procedure as specified in the standard will be performed at the link layer, but different process will be
made to accelerate the process at the network layer. The MOB MSHO-REQ is sent
to the serving BS and the Fast Binding Update (FBU) would be sent to the Home
Agent (HA) at the same time. Then the HA would set up a tunnel and transmit the
Handover Initiate message (HI) to the New Access Router (NAR). The NAR checks
Fig. 9.17 Conventional handover flow
180
Q. Lu et al.
Fig. 9.18 Fast network mobility handover procedure
the validity of New Care of Address (NCoA) with the Duplicate Address Detection
(DAD) procedure and replies the Handover Acknowledge message (HACK) to the
HA. Later, the HA would send the Fast Binding Acknowledge (FBACK) to the
NAR. After receiving the MOB BSHO-RSP, the MR sends MOB HO-IND to start
the execution of actual handover. By finishing the network re-entry, the LSC trigger is used to inform transmission of FBACK and finalize the concurrent handover
process. Then the network can return to the normal operation. The detailed fast
handover scheme is shown in Fig. 9.18 [7].
For the more complex architecture that a moving network is required, the relay
concept could be used to construct such system with a mobile RS. By implementing
this fast handover scheme, handover procedures at both link layer and network layer
are allowed to be executed at the same time. Therefore, the overall handover process
would be faster, and the handover latency could be reduced significantly. From this
network mobility scenario, we can see that by using relay technique and proper
fast handover schemes, various complicated scenarios could be established and fast
handover for delay-sensitive applications also could be realized.
9.5 Summary and Conclusion
In this chapter, an overview of the three fundamental handover modes and the standard hard handover procedure specified in the IEEE 802.16e has been presented
first. Three fast handover schemes, which are used to expedite the handover process
and to reduce the handover delay, are briefly reviewed. The first handover scheme
is to reduce delay caused by redundant neighbor BSs scanning and association during the cell reselection procedure. Only one neighbor BS with highest estimated
CINR would be selected for scanning or association. Another two schemes are both
proposed to allow data transmission during the actual handover process. The third
scheme is much better than the second one because it could support both downlink
and uplink data transmission for real-time applications, while the second scheme
9
Fast Handover Schemes
181
could only make data transmission possible for downlink services. Since the first
scheme and the third scheme are proposed for different stages of handover process,
they can be incorporated and implemented as one comprehensive scheme to deal
with the entire handover process with much performance improvement.
Secondly, the WiMax relay systems and the corresponding MAC frame structures
are summarized. One handover scheme to reduce handover latency in relay network
has been presented. Finally, the method to construct a moving network with the relay
structure and one fast handover scheme to support network mobility are discussed.
In the relay systems, both de-centrally controlled relay and centrally controlled relay
structures could exist. The selection of the relay systems needs to satisfy the system
requirement and system architecture. The handover scheme in the relay systems has
been presented to reduce the occurrence of inter-cell handovers by preferring intracell handovers. Lastly, a fast handover scheme is suggested for network mobility to
attempt concurrent handovers at both link layer and network layer. By employing the
relay structure, various complex scenarios could be established. And proper use of
fast handover schemes or future design and optimization of handover process could
be carried out to achieve low latency handover and satisfy the system requirements.
References
1. IEEE Std 802.16e-2005, “IEEE Standard for Local and metropolitan area networks, Part 16:
Air Interface for Fixed and Mobile Broadband Wireless Access Systems, Amendment 2 and
Corrigendum 1”, February 2006.
2. D. H. Lee, K. Kyamakya and J. P. Umondi, “Fast Handover Algorithm for IEEE 802.16e
Broadband Wireless Access System”, Proceedings of 1st International Symposium on Wireless
Pervasive Computing, January 2006.
3. S. Choi, G.-H. Hwang, T. Kwon, A.-R. Lim and D. H. Cho, “Fast Handover Scheme for RealTime Downlink Services in IEEE 802.16e BWA System”, IEEE 61st Vehicular Technology
Conference, May 2005, Vol 3, pp. 2028–2032.
4. W. Jiao, P. Jiang and Y. Ma, “Fast Handover Scheme for Real-Time Applications in Mobile WiMax”, Proceedings of IEEE International Conference on Communications, June 2007,
pp. 6038–6042.
5. C. Hoymann, K. Klagges and M. Schinnenburg, “Multihop Communication in Relay Enhanced
IEEE 802.16 Networks”, Proceedings of IEEE 17th International Symposium on Personal, Indoor and Mobile Radio Communications, September 2006, pp. 1–4.
6. J. H. Park, K.-Y. Han and D.-H. Cho, “Reducing Inter-Cell Handover Events based on Cell
ID Information in Multi-hop Relay Systems”, Proceedings of IEEE 65th Vehicular Technology
Conference, April 2007, pp. 743–747.
7. L. Zhong, F. Liu, X. Wang and Y. Ji, “Fast Handover Scheme for Supporting Network Mobility in IEEE 802.16e BWA System”, Proceedings of International Conference on Wireless
Communications, Networking and Mobile Computing, September 2007, pp. 1757–1760.
8. V. Devarapalli, R. Wakikawa, A. Petrescu and P. Thubert, “Network Mobility (NEMO) Basic
Support Protocol”, IETF RFC 3963, January 2005.
Chapter 10
Addressing Multiservice Classes and Hybrid
Architecture in WiMax Networks
Kamal Gakhar, Mounir Achir, Alain Leroy and Annie Gravey
Abstract This work presents two different propositions which mark new advances
in WiMax. The first work addresses multiservice environment and service differentiation in WiMax networks. It argues that using only polling based priority scheduling
at subscriber stations and demand based dynamic bandwidth allocation (DBA) at the
base station it is possible to serve various traffic types in WiMax systems with only
three service classes rather than four as proposed in the standard. It reduces the complexity of scheduling mechanisms to be implemented in WiMax interface cards thus
bringing down overall capital expenditure (CAPEX) model for such system while
providing QoS to applications. Both the transfer plane QoS, in terms of latency and
jitter, and the command plane QoS, in terms of blocking probability are assessed.
In particular, a simple, multiservice call admission control (CAC) mechanism is
proposed that significantly improves on a previously proposed CAC mechanism by
favouring real-time traffic over non-real-time traffic. The second work proposes an
architecture for a hybrid system composed of WiMax (access network) and WiFi
systems. A new “tightly coupled” approach considers matching parameters at MAC
level which translates directly into the transfer of requirements from WiFi network
to WiMax. A notion of jitter in WiFi systems is also introduced.
Keywords WiMax · WiFi · Interoperability · Admission control · Scheduling
techniques · Network simulation
10.1 Introduction
This work presents the research work accomplished on the network architecture and
the mechanisms to facilitate quality-of-service (QoS) for applications within project
IROISE. It was conceived at Réseau National de Recherche en Télécommunications
(RNRT), which is a national entity in France, including various industrial and academic partners. The project aims to demonstrate an uninterrupted wireless coverage
permitting access to network (for example Internet) for a diverse population having
K. Gakhar (B)
68 Rue Gallieni; 92100 Boulogne Billancourt, France
e-mail: kamal.gakhar@gmail.com
M. Ma (ed.), Current Technology Developments of WiMax Systems,
C Springer Science+Business Media B.V. 2009
DOI 10.1007/978-1-4020-9300-5 10,
183
184
K. Gakhar et al.
different application requirements. We discuss the transfer plane QoS, in terms of
latency and jitter, and the command plane QoS, in terms of blocking probability
are assessed. It also includes a simple, multiservice call admission control (CAC)
mechanism that significantly improves on a previously proposed CAC mechanism
by favouring real-time traffic over non-real-time traffic. The problematic was classified into various objectives which are discussed as follows.
10.1.1 IROISE Objectives
The goal of project IROISE is to demonstrate a seamless wireless coverage in a diverse geographic zone for applications, being used by various kinds of users, having
some minimum acceptable quality. Our research goal within the project is to propose
an architecture and associated services which could support QoS for applications
being served in a wireless hybrid network based on current standards. This work
has aimed to accomplish the above-mentioned goal by:
r
r
r
carrying out a study of the state-of-art of similar works and the existing techniques to support QoS in a wireless network specifically in the domain of computer networks in order to understand existing interworking techniques.
demonstrating feasibility of uninterrupted network access aided by network architecture operating in wireless mode inspired from current broadband wireless
access technologies, for example IEEE 802.16 [1], in addition to local wireless
access facility offered by IEEE 802.11 [2] (also popularly known as WiFi). It
was done via a small real-life demonstration of proposed techniques.
proposing novel techniques to support QoS (especially from the point of view
of different traffic types) for applications using existing and/or proffering new
techniques. This could include studying classic problems like dimensioning of
such a network to allocate bandwidth for traffic needing predefined QoS, buffer
management and scheduling techniques to support QoS for applications.
The first work addresses multiservice environment and service differentiation in
WiMax (Worldwide Interoperability for Microwave Access) networks. IEEE 802.16
defines 2–11 GHz version using OFDM, also called WirelessMAN-SC, which is
adopted by WiMax FORUM and thus 802.16 is also referred to as WiMax in literature. Since few years now networks have evolved into multiservice environments. In
any network where bandwidth is limited it is inevitable to treat various traffic types
differently. This concern goes back to early 1990s when IntServ [3] was proposed.
It was further readdressed by the proposition of DiffServ [4]. However, to minimize
technical complexity and to propose economically viable solutions, the question of
how to provide this differentiation has also been around from the same era.
To quote a question from [5]: “Is service priority useful in networks?”. Indeed the
resources needed to provide multiservice differentiation inflict hard to realize challenges like matching software performance to theoretical values. Thus for the sake
of simplicity of the system and eventually to have a practical solution, it is desirable
10
Multiservice Classes and Hybrid Architecture
185
to minimize the number of differentiations that are conceived for a system. The
multiservice environment includes the type of traffic which demands “privileged”
treatment compared to the traffic which needs only best effort (BE) scheduling.
However, a “preferential” treatment doesn’t come by default. The resources need
to be requested in advance and if enough of them are not available in the system
then specific policies need to be implemented which eventually help to achieve the
preference over less privileged traffic.
For a service provider it is important to ensure good QoS to applications in broadband wireless access (BWA) for business reasons. In BWA networks the challenge
is even more severe because of classical limitations of radio environment which
imposes restrictions on the number of users and the quality of network service that
can be attributed to them. The question is, “How could we ensure that technically
and economically the broadband wireless networks can be deployed and provide the
required QoS to the clients?”. An effective use of available bandwidth spectrum via
dynamic resource reservation handles one aspect the issue [6]. Another facet is how
better can one handle the given services in a system so as to incur minimum costs
of handling what has already been provisioned to the system. It is clear that more
the number of services to be handled in the system the higher will be the signalling
costs involved and complex it would become.
It is known that 802.16 standard proposes two different types of uplink traffic
scheduling to be implemented (periodic and polling based). The present work investigates whether a 802.16 network that only supports three polling based classes
is still capable of providing the QoS levels expected for all types of applications. Our
interest here lies in identifying policies ensuring that different traffic classes receive
the required QoS. In our work we assume that resources are scarce, and that a real
multiservice support is mandatory, which implies using the polling based classes.
The second work proposes an architecture based on “tight coupling” for a hybrid
system composed of WiMax (access network) and WiFi systems. Before moving
onto details of our work it will be interesting to see some approaches which have
been proposed earlier for the problems similar in nature. Section 10.2 discusses
some works that are related to services differentiation in networks and multiservice differentiation in WiMax with a detailed study and some novel propositions.
Section 10.3 discusses CAC in WiMax networks. Section 10.4 discusses some related works on the interworking between systems composing an hybrid network. In
Section 10.5 we propose a novel architecture for WiMax-WiFi interworking. Section 10.6 concludes the work by summarizing the contributions and highlights future
work to be accomplished.
10.1.2 Application Taxonomy
Let’s first consider Table 10.1 which gives us taxonomy of applications in a possible
multiservice environment to better visualize the problematic. We can classify such
an environment as per nature and kind of traffic involved. The elastic and interactive
traffic like on-line gaming can afford slight delays on underlying networks. Traffic
186
K. Gakhar et al.
Table 10.1 Taxonomy of applications in a multiservice network
Nature and traffic
Elastic
Non-elastic
Interactive
Traffic: Mostly VBR, QoS: slightly
time sensitive, Examples:
e-commerce, on-line gaming
Traffic: CBR, QoS: highly time and
loss sensitive, Examples: VoIP,
Video-conference
Non-interactive
Traffic: Mostly VBR, QoS: not time
sensitive, Examples: Emails, Web
browsing, downloads
Traffic: CBR or VBR, QoS: loss
sensitive, Examples: IPTV
which is non-elastic and interactive for applications such as video conferencing are
highly sensitive to delays and jitter they could experience in the networks. Applications which are elastic and non-interactive in nature such as large file downloads,
as normally seen in networks, are not sensitive to delays and their quality is not
affected. For multimedia rich content applications such as IPTV, however, it is very
important to have almost no losses as such an application though non-elastic and
non-interactive in nature are very important for user experience.
Lets see some related works to understand adjoining ideas.
10.2 Related Works
This section discusses some of the recent works which presented some ideas concerning dynamic bandwidth allocation (DBA) and service differentiation in networks.
With the development of high speed and high capacity optical networks, considered mainly for backbone traffic, the question of providing service differentiation
for a hybrid scenario of wireless network with these networks has been around for
some years [7, 8]. A recent work by Yuksel et al. [9] emphasized how service differentiation has become more and more important in recent years due to increasing
diversity of applications. The work considers two traffic classes on a single CoS
link: premium class (needs delay performance) and best-effort traffic. It proposes
to quantify the value of having differentiated service class-of-service support in
IP backbone by comparing the capacity of applications that require delay or loss
assurances in comparison to a network that provides best effort service (and still has
to meet the same performance assurances by provisioning extra capacity needed to
this effect). In wireless environment the bandwidth resources are very much limited
own to technology and regulations.
The work by Zang et al. [7] proposes a service differentiation enabling network
architecture for a hybrid system comprising 4G and wired networks. It considers factors such as error-prone behaviour, spectrum limitations, user mobility, and
packet scheduling in wireless scenario. It shows via different packet scheduling policies that differentiation among traffic types is effectively attained.
Service differentiation is more important than ever as we see many commercial
deployments of wired-cum-wireless (and vice versa) products [10]. This work uses a
generalized approach of a congestion control algorithm to differentiate between “re-
10
Multiservice Classes and Hybrid Architecture
187
liable” and “unreliable” flows. The contending flows in the same bandwidth pipe are
allocated the rates in proportion to weight associated with its service class. However,
as mentioned in the work itself the work targets flows of 100kbps or less. Moreover
modelling the system for only low rate flows won’t really go a long way to propose
anything concrete for real-time traffic where the average rate is normally higher than
the one targeted in their work.
The QoS architecture considered by Cho et al. [11] proposed probability based
analytical models for uplink bandwidth allocation scheduling and channel utilization in 802.16 systems. Even though theoretically it considered different priorities
among various traffic classes the simulations assume only Poisson type traffic which
once again does not represent all of the real network traffic characteristics. The work
by Gusak et al. [12] on the performance of 802.16 MAC studies an algorithm for
adaptive frame partitioning for data and voice flows though the packet size range
considered for voice doesn’t seem realistic as found in commercial products. Moreover, the assumptions made for the charge on a subscriber station are over simplified
(just one flow per SS).
The work by Ogawa et al. [13] presents an approach that resembles somewhat our
own policy of bandwidth allocation. It addresses service level QoS to different traffic
types in CDMA. It proposes a MAC level protocol using QoS control scheme which
is composed of two mechanisms: Dynamic Queuing Control and DBA Control. It
proposes to treat traffic as per classes, however, these classes refer to the type of
clients being served, i.e., Class C1 – industrial client and Class C2 – household
clients. The classes are served as per allowable delay time (ADT) which is a client
based choice. Though they do not make an apparent priority among classes the
methodology proposes a delay function which is strict for C1 than C2. It introduces
a notion of treating one client superior to another. DBA scheme is based on locating
optimum radio resources to a mobile terminal dynamically.
Even as wireless systems were coming into being few years ago there had already
been suggestions on differentiating services in networks, for examples, in IEEE
802.11 which only supported best-effort service [14]. The work proposes two distributed estimation algorithms for distributed coordination function (DCF) environment. It supports service differentiation, radio monitoring, and admission control. It
implements a virtual MAC (VMAC) algorithm that monitors the radio channel and
estimates locally achievable service levels. It uses an algorithm at source level to
estimate service quality that different flows get by VMAC. It goes on proposing that
by applying distributed algorithms to admission control of a radio channel it can
attain and maintain a globally stable state without the need of complex centralized
radio resource management.
Over the last few years, the need of providing service differentiation via scalable
architecture has also been highlighted by Christin and Liebeherr in [15], citing the
limitations of earlier works in IntServ and DiffServ. The work argues that classbased architectures for service differentiation have lower overheads than the ones
based on flows. It also emphasizes an urgent need of service differentiation in access networks which mostly suffer from bottle-neck problems hindering QoS for
applications.
188
K. Gakhar et al.
A recent work by Cicconetti et al. [16] assesses performance of 802.16 point to
multipoint system. It considers that as the standard advocates fixed allocation for
UGS service it is not interesting to study its performance at MAC level (which on
the other hand is vital in our analysis further in the chapter). For scheduling policies,
it uses Deficit Round Robin (DRR) on downlink from BS to SS and Weighted Round
Robin (WRR) on uplink from SS to BS.
An article by Mukul et al. [17] concerning WiMax suggested to use adaptivebandwidth scheduling algorithm at SS for rtPS traffic in which SS predicts the arrival
of packets in advance and makes the bandwidth request. The method is based on
differential time grant where it makes stochastic prediction for the additional time
needed by the rtPS traffic to serve the total packets arrived in the queue between
the moment it first makes the request and the grants received to be used. However,
there is no comparison of performance with the “average” values, that is, without
additional time added. Also, time durations considered for the simulations are so
small that “real” scenarios cannot be analysed.
After going through the above-cited approaches, over the next sections we discuss our approach towards service differentiation where we propose some simple
methodology showing how our suggestions can lead to less complex yet efficient
solutions to provide good QoS to real-time and non-real-time traffic in an IEEE
802.16 system.
10.3 System Methodology
In this section we first describe the objectives that we are going to address over the
next paragraphs:
r
r
r
The need for a simple bandwidth allocation policy at BS in a 802.16 system
which is able to achieve service differentiation for various traffic types and justifies an appropriate mapping of various traffic types to service classes.
A simple traffic management policy within SS keeping in mind that delay sensitive applications get served in time.
Addressing performance for various traffic types seen in Table 10.1 in the context
of an 802.16 system.
To address these objectives lets start by understanding the framework behind the
work.
10.3.1 Framework
Let’s revise the framework of our approach which makes the basis of analysis of
our system. We have two “guiding actors” in the form of Tables 10.1 and 10.4.
Table 10.1 presents taxonomy of applications in the networks. Table 10.4 highlights
the mandatory parameters at flow level which help addressing QoS associated with
each service class in the standard. When we analyse traffic engineering policies in
10
Multiservice Classes and Hybrid Architecture
189
802.16 systems we first have to understand how to treat well various applications.
Also as we analyse our policies, the focus needs to be on classifying the service
types which could be used to serve the applications (this is inline with the guidelines
of the standard). Though the above parameters are supposed to be associated with
different service classes, we will identify how the classification of applications may
be helpful to design policy decisions to serve various service classes. It means we
will treat various applications traffic with our policies and depending on the results
obtained on QoS we will propose an eventual mapping of applications traffic to the
respective traffic classes in which they could be served.
The analytical approach to model such a multiservice system was abandoned in
favour of simulation studies of the system. It was considered just to use existing
simulation utilities which one can use to model various traffic types more easily
and accurately to analyse elementary system behaviour. Before going into detailed
system study we describe application modelling, QoS metrics, and simulation model
for our system and the changes we had to make to the existing network simulator
(ns-2) to accomplish our algorithms [18, 19] (the reader is advised to see appendix
for details).
10.3.2 Application Modelling
Having a proper traffic profile is perhaps the most important factor to be considered before any traffic engineering policy can be deployed. It is in the best interest
of the service provider to have this knowledge beforehand so that it knows what
applications should it market.
We can refer to Table 10.1 to describe application modelling. We can see that
in general we have to model two types of applications: Elastic (on TCP) and NonElastic (on UDP). Different applications are modelled using different models of traffic, notably, Poisson, Exp-On/Off, and resource hungry applications. Poisson source
is interesting for it models superposition of multiple CBR flows in the system which,
in fact, could imitate a SS acting as an WiFi AP. The On/Off sources allow to check
the robustness as the application rate varies (inducing busrtiness inthe system), and
the resource hungry FTP corresponds to the cases when SSs are saturated (as in for
BE traffic).
Table 10.2 summarizes various applications types and the associated models we
use further for our simulations.
Let’s now understand what parameters are mainly considered to analyse QoS of
applications.
10.3.3 QoS Metrics
As it is clear from literature, QoS can mean different things for different users. Nevertheless, here we define what we are looking for while addressing QoS for various
applications traffic in 802.16 system and why the parameters (policies) discussed
190
K. Gakhar et al.
Table 10.2 Taxonomy of applications traffic and simulation parameters
Application type
Example
Simulation model
Parameters
Non-elastic
interactive
VoIP
CBR on UDP, Poisson on
UDP, On–Off
Exponential on UDP
packet-240 bytes
rate-80 kbps,
packet-240 bytes
rate-390 kbps
Non-elastic Non- IPTV streaming
interactive
On–Off exponential on
UDP
packet-240 bytes
rate-390 kbps
Elastic
interactive
On–Off exponential on TCP packet-512 bytes
Business applications
Elastic
Web browsing, email
non-interactive
On–Off exponential on
TCP, FTP on TCP
packet-512 bytes
further are important from QoS perspective. A user in any system will use its services (and be willing to pay) only if the applications run to good satisfaction. In new
BWN systems such as 802.16 it is, therefore, very important to understand what
parameters provide the best indications of QoS for such a multiservice system.
From Table 10.1 it can be understood that for applications having non-elastic
traffic the QoS parameters are the loss, delay, and jitter they experience in the network. However, for the applications traffic elastic in nature, essentially throughput
is a better indicator of application QoS. The delays of different applications traffic
are calculated as the difference between the time a packet enqueues at the source and
the instant it is received at the destination. Throughput of applications is calculated
from the bytes received at the destination.
For non-elastic traffic, it is usually necessary to implement a so-called “playout
buffer” in order to deliver correctly the successive packets to a codec. The network
induced delay is then be approximated by what is called “effective delay”, i.e., the
sum of the latency and the jitter affecting the traffic. We modelled the latency as the
mean delay, and the jitter as the difference between an upper and a lower quantile
of the delay. The jitter in the system for applications is calculated as: J itter =
(max − min)delay quantile. While real-time VBR traffic can safely suffer higher
delays, the main QoS metrics for this class also remain the same as for real-time
CBR traffic. Throughput is derived via the bytes received (and thus converted to the
bandwidth used by individual flows) as they arrive at destination.
After looking into Table 10.1 we can see that traffic which is Elastic, Interactive can experience some delays. The applications of such traffic type can afford to
suffer higher delays compared to the two traffic types discussed above. However,
throughput for such traffic types is important.
The last category of traffic which is Non-interactive, Elastic in nature fits best
to BE traffic. There are no strict QoS metrics for this class of traffic. Nevertheless,
it is in the best interest of user that such applications are being entertained in a
multiservice system as and whenever possible.
From the above discussion we can summarize that delays and jitter (hence almost no losses) are the most important QoS metrics for real-time traffic types. The
10
Multiservice Classes and Hybrid Architecture
191
eventual QoS policies have to ensure via simple or complex methods that given
some practical bounds on traffic a system gets QoS it demands. We will later propose another classification of traffic types which can serve various applications of
Table 10.1.
Now we discuss the way we conceive and model our simulation scenarios. Later,
we will discuss the scenarios accompanying with the results obtained and their
implications.
10.3.4 Simulation Modelling
Our system consists of a BS and several SSs. We assume that there are demands
for various traffic types at SS. However, here we ignore wireless conditions for
simplifying system behaviour. The physical layer conditions themselves make an
interesting topic but we rely on simple network management policy approach here
in order to understand basic system behaviour.
Figure 10.1 represents the system we consider for our simulation studies in the
section further. The sources, represented by S, generate a mix of traffic demands
to be sent on the uplink bandwidth pipe. In fact, such a model for uplink traffic
demand highlights the scenario that may arise in a zone where different types of
users are trying to access the wireless network with their applications needing diverse requirements. Also, we don’t consider any delays associated with BS due to its
own backbone traffic. The model was first tested with CBQ implementations of ns2
to have some benchmark based on which we made further simulations (we don’t,
however, indulge into the details of the results obtained with CBQ).
As presented in Fig. 10.2, real-time CBR applications generate traffic at regular
intervals of time. The standard proposes that such traffic is served by the allocations
negotiated at connection setup and are given regularly. As such, the demands for
CBR on UDP
Exp-On/Off on UDP
SS
1
Exp-On/Off on TCP
S
FTP on TCP
CBR on UDP
Exp-On/Off on UDP
BS
SS
2
n
SS
Exp-On/Off on TCP
S
FTP on TCP
CBR on UDP
Exp-On/Off on UDP
Exp-On/Off on TCP
FTP on TCP
Fig. 10.1 Simulation model representing the system under performance evaluation
S
192
K. Gakhar et al.
CoS1
CoS2
SS
CoS3
CoS4
Fig. 10.2 Traffic queues of various classes within bandwidth pipe
such traffic can easily be predicted. The real-time VBR applications sources, however, generate packets randomly as can be modelled by some available analytical
principles. It may happen, therefore, that their demands vary from time and again.
For such a service class the standard says to adopt a polling mechanism. It will be an
effective means to respond to bandwidth demands which would vary in the network
over the course of time. Within traffic queues, we treat the packets using a FIFO
approach.
The non-real-time applications generate large amount of data and are modelled
normally using large packets with random On/Off times. Last type of traffic is
considered to be that of FTP application. This kind of traffic is carried mainly by
transport protocols which influence the congestion control in the underlying network using their own policies. The standard nevertheless proposes to use polling
methodology to serve these traffic classes.
The next section presents the scenarios we looked at and the effects of the results,
and how our methodology helps to define service differentiations. This is followed
by the conclusion on what kind of traffic types could be associated with what kind
of service class of 802.16 system.
10.4 Analysis of Traffic Engineering Approach
The superframe in 802.16 is adaptive in nature and allows uplink and downlink demands to be fulfilled. The subscriber stations (SSs) in the system operate in TDMA
mode thus accessing the channel only as per the grant allocated to them. On the
downlink, the base station (BS) operates in broadcast mode and a SS responds if the
data is aimed for it. Our interest is to demonstrate the handling of applications traffic
in uplink mode where the system could inflict delays on different traffic classes
if appropriate policies are not implemented. Based on the performance of various
traffic types and guidelines in the stanadrd we would like to suggest a justified classifcations of various service classes and applications traffic.
It includes mainly an allocation policy and Intra-SS scheduling policy responsible to handle various traffic types. This section presents the detailed analysis of
10
Multiservice Classes and Hybrid Architecture
193
our system as we try and answer to adopt a simple yet effective traffic engineering
approach.
We would like to study a 802.16 system via simulations to understand how various traffic types behave when guided by a comprehensive policy of bandwidth allocation. It is reasonable to argue right from the beginning that we inevitably need
bandwidth allocation policies both at the BS and the SS in such a system where
two-hop scenarios are the natural implications. WiMax/802.16 systems are new in
broadband wireless networks domain and given the scenario of limited bandwidth
in BWNs, BS must make sure that demands from various SS are satisfied in a fair
manner therefore some decision making has to be ensured too for allocations at BS.
We, therefore, would like to check various basic questions associated with the QoS
that various applications traffic experience on the uplink following our policy. We
would like, further, to make a mapping between various traffic types and the service
classes in 802.16 which could be used to formalize the system behaviour.
We once again focus on IROISE architecture discussed in Section 10.7. In a
802.16 system we need to address uplink allocation policies at two levels. The bandwidth allocation algorithm (at BS) should be such that it does not starve a subscriber
station (which might need uplink allocations). Also, within a given SS the scheduling policy should be such that the traffic needing real-time constraints is provided
a better dealing. For now we consider only one BS and two SSs in the system. We
can easily generalize the results obtained here for a system of more than two SSs as
the uplink channel can be considered loaded, without a loss of generality, in similar
ways for demands of more than two SSs. It is assumed that admission control and/or
traffic control is performed by the operator in order to avoid congestion. However,
it is important to note that these policies have to rely on results such as given in the
remainder of this section in order to determine acceptance levels.
10.4.1 Validation for Dynamic Allocation
We gradually discuss some novel propositions while answering, with the help of
simulations, some of the basic questions linked to the objectives for our system (our
propositions came out of the observations made here). The first concern for a new
system is, “As 802.16 uses TDMA for various SSs to able to use uplink allocations,
how should BS policy make allocations to SSs in the system? Should it make fixed
allocations on the basis of number of SSs or take into considerations the demands
from each SS?”
To address this we perform the following simulation: We want to see given some
real-time VBR traffic in the system how the delays are affected based on the allocations a SS gets. The configuration of the system is as; we use real-time VBR
applications sources on different SSs. One SS sends double the amount of traffic
than the other. In our system the available bandwidth is 40 Mbps. The superframe
duration is considered to be 10 ms for our studies and should remain the same unless
specified. It is the most common value advocated for NLOS of 802.16 standard in
literature. We will also take an uplink value of about 50% of the superframe value as
194
K. Gakhar et al.
the content rich applications are supposed to make higher demands for bandwidth.
We consider in this case thus total load is about 12 Mbps (4 Mbps from one SS and
8 Mbps from another).
The basic parameters to create such traffic are the same as defined in Table 10.2
and should remain same throughout unless indicated. Thus, if a bandwidth allocation (BA) follows a fixed allocation policy it divides the uplink in proportion to the
number of SSs considered (here 2). The SSs do not implement any particular policy
on applications traffic; packets arriving at SS are forwarded to BS in FIFO mode.
Observations: We see the result in Fig. 10.3. It shows a histogram of delay observed for the SS which sends more traffic (the SS which make sends smaller amount
gets served with very small delay). We see that it suffers unacceptable delays because of the fixed allocations in the system. The packets it sends to BS don’t receive
enough time allocations in which it could send data on the uplink. This simulation
shows that, even if 10 Mbit/s is statically allocated by the system to a source sending
8 Mbit/s of on–off traffic, the delivered QoS is bad.
It means that we need an allocation policy which takes care of such a problem by
making allocations which takes traffic demands into consideration. Hence a dynamic
(adjustable) policy of bandwidth allocation is justified. We want the uplink traffic
to utilize full system bandwidth available therefore under such traffic conditions a
dynamic allocation is desirable in order to ensure QoS for real-time applications.
The grants given by DBA policy should depend on some policy of demand from
various clients. We simulate another scenario to prove our point.
Histogram - Delays of a SS in Fixed DBA
6e-05
real-time VBR traffic
Frequency Distribution
5e-05
4e-05
3e-05
2e-05
1e-05
0
0
0.2
0.4
0.6
1.2
1
0.8
Delay (seconds)
1.4
1.6
1.8
2
Fig. 10.3 Fixed grant allocations affects delays for real-time VBR traffic classes – It emphasizes
that a fixed allocation policy is not the best answer to serve applications in a 802.16 system
10
Multiservice Classes and Hybrid Architecture
195
Histogram -- Delays for real-time VBR traffic using Polling
0.003
real-time VBR - SS1
real-time VBR- SS2
Frequency Distribution (Mbps)
0.0025
0.002
0.0015
0.001
0.0005
0
0
0.1
0.2
0.3
0.4
0.5
Delay (sec)
Fig. 10.4 Proportional allocations to SS results in better treatment of applications
In simulation, one SS sends the demand of about 6 Mbps while the other demands for 8 Mbps (higher demand in the system than what was considered above).
BS makes a polling at the end of each superframe cycle in order to collect current demands of each SS. It then analyses how much demand is received from
each SS and makes respective allocation in proportion to the sum of total demands received
n(the proportion is decided from the available uplink frame as:
Demand SSi ). Figure 10.4 shows the result of the simulation. It
Demand SSi / i=1
shows the delays of each SS which sends demands for real-time VBR traffic. We can
see that with proportional allocations the delays for SSs are less than what they get
via fixed allocation policy. Thus a better allocation will be the one where available
bandwidth is used in just proportion to the demand of each SS.
Therefore, we can conclude that a dynamic policy of bandwidth allocation would
favour better treatment of applications (especially the one with bursty nature).
10.4.2 Impact of BE Traffic in the System
Next we consider that all traffic sources are sending traffic on the uplink and the
demands of each SS is considered dynamically by the BS. Given this, we would like
to understand the consequences of treating equally the BE traffic type with the rest
of the applications types – the applications which need some minimum bandwidth
guarantee.
196
K. Gakhar et al.
The simulation scenario is as: Two SSs send different applications on the uplink. One of them sends applications which need some minimum bandwidth (they
make in total demand of about 13 Mbps) and the other sends the applications
which need BE service (FTP over TCP). A SS i makes a demand for time to send
(QueueSi ze(i) ∗ 8)bits. The BS then decides grants (in time units) for each SS i as
following: Demand SS(i)/Link BW ; then the effective grant of a SS i is calculated
from the total uplink time available as:
Grant SSi
i
Grant SSi ∗ U plinkT ime.
The above calculations of grants mean that BS has a policy of allocation which
is sensitive to the demands. However, once the grants are made to SS there is no
further differentiation of these allocations within the SS.
Observations: The simulation results seen in Fig. 10.5. It shows histogram of
delay suffered by real-time applications. We see that most of the real-time applications packets are served with the delay up to 4 s. The mean delays were observed
to be more than 2.5 s. It is because of BE traffic which is in fact greedy in its nature and fills uplink demands by aggressively increasing its rate over the period of
time. BS therefore accords more allocations to SS via which BE traffic types sends
Delay for CB traffic induced due to BE traffic
0.00035
CB traffic - real-time CBR
CB traffic - real-time VBR
0.0003
Frequency Distribution
0.00025
0.0002
0.00015
0.0001
5e-05
0
0
0.5
1
1.5
2
2.5
3
3.5
4
Delay (seconds)
Fig. 10.5 Greedy BE applications traffic gets more grants as it increases its demand over time
which affects the delays with which most of the real-time applications are served – It highlights
the need of treating CB traffic and BE traffic types differently in 802.16 systems
10
Multiservice Classes and Hybrid Architecture
197
its demands. Such a result tells us that there is a clear need to treat BE and CB
bandwidth traffic separateley.
10.4.3 DBA – QoS Sensitivity
We note that untill now we do not have a notion of traffic differentiation in simulations. All traffic is being treated as if a big service class is composed of various
applications found in the system. The idea is to show how the service differentiation
in the DBA impacts on the QoS of applications. This will help us understanding the
basis of differentiation before we develop full DBA for our system.
The simulation scenario is as: We put non-elastic interactive traffic (video conference for example) on–off exp traffics on one SS. On the other SS, we put non-elastic
non-interactive (video streaming). Both of them are Exp-On/Off carried on UDP.
The first situation is to explain what happens when the DBA does not differentiate
between the classes that could carry these traffic types. Each SS makes a demand
of 8 Mbps each. The uplink allocations are made as in the above scenario, i.e., in
proportion to the demands. We take the above scenario so that the differentiation
could be noticed for delay sensitive applications.
Observations: We see that in Fig. 10.6 when no differentiation is made among
classes. Non-elastic interactive, non-elastic non-interactive traffic get their demands
satisfied without any differentiation. The average delay and jitter for non-elastic
interactive traffic were observed to be 12.6 and 7.7 ms, where as, the average delay
and jitter for non-elastic non-interactive traffic was observed to be 13.0 and 7.6 ms,
Delay Distribution for Non elastic interactive and Non elastic non interactive
1.4
non elastic interactive- SS1
non elastic non interactive- SS1
1.2
Frequency Distribution
1
0.8
0.6
0.4
0.2
0
0
0.005
0.01
0.015
0.02
Time (sec)
0.025
0.03
0.035
0.04
Fig. 10.6 DBA does not differentiate among service classes at SSs, even though the demands are
satisfied here to present a clear scenario. However, traffic would suffer delays in the absence of
differentiation when treated in another class
198
K. Gakhar et al.
Delay Distribution for Non elastic interactive and Non elastic non interactive
1.4
non elastic interactive- SS1
non elastic non interactive- SS1
1.2
Frequency Distribution
1
0.8
0.6
0.4
0.2
0
0
0.005
0.01
0.015
0.02
0.025
0.03
0.035
0.04
Time (sec)
Fig. 10.7 DBA makes a differentiation among service classes at SSs, improving service to nonelastic interactive traffic
respectively. However, as more application traffic will be mixed up in the system
these different applications will suffer in the absence of differentiation at SS level.
In another scenario, DBA favours non-elastic interactive traffic (compartively
more delay sensitive) over non-elastic non-interactive traffic. We see in Fig. 10.7
the delays experienced by these two classes. The average delay and jitter for nonelastic interactive class was observed to be 12.4 and 7.2 ms, respectively. However,
those for non-elastic non-interactive class were 14.36 and 7.8 ms, respectively. This
differentiation would be more significant when bursty conditions are introduced in
the system.
Comparing the above two scenarios we observe that effective delay for nonelastic interactive traffic improves whereas that of non-elastic non-interactive traffic
suffers more. Thus we understand that DBA differentiation is going to play an important role in servicing various applications in the system and has an important
role. We develop a full DBA algorithm to this effect in a later section.
10.4.4 Consideration for Standard Service Classes
Before moving to further simulations, we would like to adopt an approach which
will make our analysis more comprehensive. When we will be finished our results
we can justify the choice we present here. The standard proposes that UGS service
class consists of real-time CBR applications. Similarly, it proposes to use rtPS service class for real-time VBR applications; nrtPS service for serving non-real-time
10
Multiservice Classes and Hybrid Architecture
199
large data files and BE service for applications which are not delay sensitive. We,
thus, present further studies using these notions as suggested in the standard. We
will later justify this supposition to serve different applications.
From now on, unless specified, the system load is considered to be about 45% of
the available bandwidth (it means when the sources are active the sum of their mean
rates don’t go beyond 20 Mbps though we should consider BE service – FTP over
TCP – excluded from this – the sum of the rest of the sources add up to 18 Mpbs) and
the simulation parameters ensure that various applications types contribute different
percentage of traffic on the uplink load. The simulations are run for about 120 s in
which the sources start gradually in the beginning and stop gradually towards the
end. We will nevertheless highlight whenever a different configuration is used for
simulation purposes.
Now the whole scenario is set for us to further our studies. We have a DBA which
implements a policy of allocations to SSs in proportions of their demand of the total
load send on the uplink. We choose to have a simple policy of setting priorities at
SSs in the way various traffic types are dealt with in the system. We would like to
understand the kind of QoS each of the applications receive once we put the DBA
methodology we conceive and what implications such an approach might have to
define a 802.16 system.
As we made more and more observations regarding delays for different traffic
during our simulations we had to put the basic question to ourselves and which was:
“How many service classes should be sufficient to support various traffic types in
an access network comprising IEEE 802.16 (or WiMax)? [20]”. The objective of
service classes is to gather one or more traffic types present in the network so that
they can be treated in the same manner. In this way the policies related to traffic
handling can be influenced to improve over all network service. Instead of dealing
with individual traffic types it was noticed that a collection of similar performance
characteristics traffic can provide a positive influence in order to simplify traffic
handling policies in the networks.
10.4.5 DBA – Polling Based Policy and QoS for Real-Time Traffic
The next question we put to ourselves was whether we need two different service
classes within real-time traffic types, i.e., one for CBR traffic and one for VBR
traffic type? Along with this we also need to address the way in which the polling is
done for SSs.
10.4.5.1 DBA Algorithm
Our goal is to keep the system simple while proposing some efficient solution to a
WiMax network. In our approach, the DBA algorithm and hence inter-SS allocations
are based on demand proportions of each SS. The basic algorithm is shown as in
Fig. 10.8. Our methodology is equally applicable to a hybrid mapping module (that
200
1.
2.
3.
4.
K. Gakhar et al.
UGS grants are prenegotiated and are fixed within a superframe before the transmission
starts.
Then BS allocates grants to rtPS traffic in the following manner: if the sum of all demands
for real-time VBR traffic is smaller than available allocation then all demands are satisfied
otherwise the BS serves the demands as per their proportion in the total demand.
If there are remaining grants, BS then handles the nrtPS traffic demands (needing some
minimum bandwidth guarantee) in a similar manner.
BE traffic gets grants only if there are remaining grants after serving the non-real-time
traffic demands.
Fig. 10.8 DBA algorithm providing service differentiation for various traffic types in 802.16 system. It will be helpful to further differentiate traffic and map them onto corresponding service
classes
we present in further sections) within a QoS architecture and provides necessary
differentiation for traffic types.
In this algorithm the demand from each traffic source makes up a part of the
global demand of its corresponding service class at SS in the system. The SSs then
sends demands to BS. The DBA policy first makes “fixed” allocations to UGS class
which is determined as a function of uplink frame and data that can be sent in this
time.
The remaining uplink time for allcations is: T otalU plink = T otalU plink −
i U G Sgranti . If T otalU plink > 0, then rtPS class is assigned allocations (in
time units) as follows:
rtPSgranti = rtPSdemandi /LinkBW
The rest of the service classes (nrtPS and BE) are also served in the same manner
depending on the availablity of uplink time (and if they were given allocations), i.e.,
if TotalUplink > 0.
Once these allocations are decided by BS, each SS sends data on the uplink starting with UGS – SS1 is followed by SS2 on the uplink time frame. This is followed
by time frames of rtPS class – again SS1 is followed by SS2. The polling is also
accomplished during the superframe time (however, polling methodology can be
vary and might have different effects on QoS of applications). The same process
continues for other classes if only they have uplink allocations.
Our mechanism ensures that – real-time CBR traffic always gets its grants, realtime VBR traffic is served before non-real-time traffic, and BE traffic is served only
if the CB traffic does not need the grants.1
1 We need to reserve a bit more time for UGS than what is calculated in theory in order to accommodate inherent queueing delays in the system, for example, we utilize 1.2 ∗ U G StimeT heor y .
This “comfortable” value was obtained by observing delays for UGS traffic during simulations by
varying the values of fixed allocations given to traffic. We consider a distance of about 10 km thus
the propagation delay is about 40 s.
10
Multiservice Classes and Hybrid Architecture
201
10.4.5.2 Results on UGS and rtPS Classes
To answer the aforementioned concerns, first, we analyse whether it is possible to
treat real-time CBR and VBR applications traffic together. We first show that treating together two real-time service classes is possible which means that eventually
the scheduling within SSs could be much simpler. And, then we present different
results of polling in SSs showing the effects it produces on delays. Here we consider that SSs are polled each at the end of their respective allocations, i.e., a SS
is polled for its next allocation as soon as it stops sending packets on the uplink.
We consider certain percentage of each traffic type in the network, as discussed in
earlier paragraphs, which is more realistic. Figure 10.9 shows the histogram of the
delays for UGS and rtPS traffic types in the system.
We observe in Fig. 10.9 that there is no minimum delay for considered UGS
packets. As the allocations are given with priority to UGS traffic its packets get
served in the superframe with null minimum delay. We see that the majority of UGS
traffic gets served in 1 superframe (10 ms) with the maximum delays goes upto
about 2 superframes (20 ms). The rtPS packets wait at least half of a superframe
size (this is due to polling), and the majority of them have to wait between 1 and 2
superframes. The jitter for rtPS traffic is however smaller than the one for UGS
traffic although the rtPS traffic is more bursty than the UGS traffic because the
polling mechanism ensures that resources are allocated when requested, and not
Histogram - Delay
1.4
UGS-SS1
UGS-SS2
rtps-SS1
rtps-SS2
1.2
Mean-UGS1 = 6.12 ms, Jitter = 11.7 ms
Frequency Distribution
1
Mean-UGS2 = 6.26 ms, Jitter = 12.1 ms
Mean-rtPS1 = 13.39 ms, Jitter = 8.4 ms
0.8
Mean-rtPS1 = 13.25 ms, Jitter = 8.3 ms
0.6
0.4
0.2
0
0
0.01
0.02
0.03
0.04
0.05
0.06
0.07
0.08
Delay (sec)
Fig. 10.9 Histogram – Delay – UGS (real-time CBR receives fixed grants) and rtPS traffic (realtime VBR receives polling based grants) showing that the effective delays for real-time traffic are
considerably similar
202
K. Gakhar et al.
Histogram - Delay
1.4
UGS-SS1
UGS-SS2
rtps-SS1
rtps-SS2
1.2
Mean-UGS1 = 12.34 ms, Jitter = 9.6 ms
Mean-UGS2 = 12.24 ms, Jitter = 9.6 ms
Frequency Distribution
1
Mean-rtPS1 = 13.22 ms, Jitter = 8.2 ms
0.8
Mean-rtPS2 = 13.1 ms, Jitter = 8.1 ms
0.6
0.4
0.2
0
0
0.005
0.01
0.015
0.02
0.025
0.03
0.035
0.04
Delay (sec)
Fig. 10.10 Delay distribution of UGS and rtPS traffic when served by the same policy as the one
used only for rtPS traffic
periodically. Lastly, the effective delay for the two classes differs only by a few
milliseconds. This fact shows that we could try to treat these two different real-time
service classes as one single class.
Next, we move on to present the results of treating UGS and rtPS traffic types
together as single service type of rtPS traffic. In this case there is no prenegotiated
allocation for UGS traffic in the system. The allocations for all service types are
done as discussed in the algorithm (see Fig. 10.8) except Step 1. The SSs are polled
each at the end of their respective allocations. Figure 10.10 shows the histogram
of delay in the case when UGS and rtPS traffic is treated as single rtPS class in
the system (other traffic types are not shown here for clarity). Delay distributions
for both traffic types are very similar; moreover, the latency and jitter performance
for real-time traffic are similar to the one for rtPS traffic when both classes are
supported. This shows that the rtPS traffic is able to efficiently use the resources
that were previously allocated to the UGS traffic and that UGS traffic can indeed be
supported by the policy used for rtPS traffic.
In the next section we present some results on polling and also address QoS for
various application types.
10.4.6 Impact of Polling and QoS of Various Application Traffic
In this section, we present three aspects of treating various traffic types together in
802.16 systems. We first shed more light, via simulations, on the ways polling could
10
Multiservice Classes and Hybrid Architecture
203
be done in the system. This will help us understand which method of polling is more
efficient in treating traffic demands. We address this objective using the following
approach. The BS can choose to poll all SSs either at the end of each superframe or
to poll each SS at the end of its uplink allocation time for its next cycle. We see in
the following results the effects of these two different polling methods.
In the second part, we will see more analysis of our proposed DBA methodology
on QoS offered to non-elastic non-interactive, and elastic-interactive applications
while they are served by nrtPS class. We also compare QoS offered by rtPS to nonelastic non-interactive applications.
The third part presents the simulations of bursty demands in the system and its
impact for the applications analysed in the second part above thus checking the
robustness of DBA.
10.4.6.1 System Performance Under Different Polling Types
We start by describing the scenario and its ingredients. We add two different types
of nrtPS traffic from two different sources. The SS1 uses TCP (elastic) where the
SS2 uses UDP (non-elastic) as transport protocol, both carrying exponential on/off
traffic. This differentiation would allow us to see how the applications like on-line
gaming (sent on UDP) get treated if they are carried as nrtPS class. For now traffic
configurations remain the same in the system as used in Section 10.4.5 (UGS demands 2 Mbps, rtPS demands about 8 Mbps, nrtPS demands about 8 Mbps, and the
rest is BE demand).
Figure 10.11 shows the delays for various traffic types when the polling is done
at the end of each superframe (i.e., each SS finishes its allocation limited in total
by uplink allocations followed by downlink spell in the superframe and then the BS
polls each SS). One SS uses Exp-On/Off traffic on TCP whereas another SS carries
Exp-On/Off traffic on UDP, both representing nrtPS traffic. First thing which can
be seen is that the delays for UGS and rtPS traffic are not symmetric (though still
within the acceptable range where UGS is also served via polling). We can also see
that nrtps traffic gets served quite early in the system. The majority of this traffic
(both from SS1 and SS2) gets served within 2 ∗ superframe time.
There is, however, a little difference in which TCP-nrtPS traffic is served compared to UDP-nrtPS traffic. This can be explained by the basic nature of TCP traffic.
As UGS and rtPS traffic (prioritized) is served as per their demand (where rtPS
demand varies more often), many times nrtPS traffic does not get served which
eventually makes TCP to readjust its rate. Another interesting part that can be noticed is towards the tails of nrtps traffic. We see that both sorts of nrtPS traffic
exhibit long tail behaviour though there are bumps in the one being served by TCP
(which is again explained because of the readjustment of rate and thus more packets
being served towards the final phases of traffic service as there are less number of
UGS and rtPS packets, prolonging the service time and hence the delay for nrtPS
packets).
Figure 10.12 shows the simulation delay for various traffic types when the polling
is done at the end of individual allocation of each SS. This way BS takes into
204
K. Gakhar et al.
Histogram - Delay
2.5
UGS-SS1
UGS-SS2
rtps-SS1
rtps-SS2
Nrtps-SS1
Nrtps-SS2
Frequency Distribution
2
1.5
1
0.5
0
0
0.01
0.02
0.03
0.04
0.05
0.06
0.07
0.08
Delay (sec)
Fig. 10.11 Histogram – Traffic Delay – Polling is done at the end of Superframe
Histogram - Delay
2.5
UGS-SS1
UGS-SS2
rtps-SS1
rtps-SS2
Nrtps-SS1
Nrtps-SS2
2
Frequency Distribution
Mean-UGS1 = 12.42 ms, Jitter = 9.1 ms
Mean-UGS2 = 12.39 ms, Jitter = 9.2 ms
1.5
Mean-rtPS1 = 13.1 ms, Jitter = 8.2 ms
Mean-rtPS2 = 13.0 ms, Jitter = 8.1 ms
1
Mean-NrtPS1 = 16.27 ms, Jitter = 27.6 ms
Mean-NrtPS2 = 17.6 ms, Jitter = 29.0 ms
0.5
0
0
0.01
0.02
0.03
0.04
0.05
0.06
0.07
Delay (sec)
Fig. 10.12 Histogram – Traffic Delay – Polling is done at the end of allocation for each SS
0.08
10
Multiservice Classes and Hybrid Architecture
205
account, for the next demand, the packets that arrived after the first request and
during the time when the concerned SSs were being served. This method, therefore,
takes into account the packets for one SS, lined up to be served (for next cycle)
while serving the packets of another SS arrived in its last polling.
It can be seen that the delays for real-time traffic (UGS and rtPS) are symmetrical
and their packets get delayed for the periods that are well within acceptable range.
As the packets of UGS and rtPS traffic types wait for some instants of uplink, nrtPS
traffic gets served better. A sharp rise of nrtPS traffic distribution towards the end of
1 ∗ superfame time can be attributed to the fact that some TCP packets get served
very early in the allocations as the demands from UGS and rtPS traffic is relatively
low and TCP increases its demand. But, we see that over the next superframe as
more UGS and rtPS traffic demands arrive (and served with priority) TCP once
again gets served later. There is, however, no such noticeable difference of service
for nrtPS traffic being served on UDP.
We would also like to see the impact of polling on throughput of nrtPS applications. To continue with the above scenarios of traffic demands and polling based
DBA we can see nrtPS throughput in Fig. 10.13. The BS allocations were able
to serve the demands (4 Mbps for each SS) – well within what was asked. SS1
gets its demands to send Exp-On/Off traffic on TCP. We see thus elastic interactive
traffic (e.g., business applications) gets its throughput. Moreover, the effective delay
suffered by this traffic, as shown in Fig. 10.12, is of the order of 53 ms. This order
of interactivity should not be too cumbersome from a user point of view.
Throughput vs Time
10
nrtPS traffic from SS1
Bandwidth (Mbps)
8
6
4
2
0
0
20
40
60
Time (sec)
80
100
120
Fig. 10.13 Throughput demand of Elastic interactive traffic is well served in polling based DBA
206
K. Gakhar et al.
From these figures we can study the efficiency of polling schemes in providing
symmetric delays (thus efficient allocations and usage in DBA policy) to real-time
traffic and the throughput for non-real-time traffic being served as nrtPS traffic type.
We have had some interesting observations regarding the way TCP traffic delay
varied. By comparing these two we see that nrtPS traffic which can easily suffer
delays of more than 10 ms is treated differently by different polling schemes. The
more number of packets suffer longer delays when the polling is done at the end of
superframe in DBA compared to the case where each SS is polled immediately after
it finishes its previous allocations thus providing the evidence that the second option
of polling is efficient than the first one.
In totality of the observations made above, we can see that polling does not really
affect delays for UGS and rtPS traffic types when they are served with in the same
class.
10.4.6.2 QoS for Non-Elastic Non-Interactive Traffic
Keeping the above traffic configuration (there are no bursts in the system and all
rates are average with On and Off periods as 500 ms) in mind we first analyse
the QoS offered to non-elastic non-interactive applications in the system (IPTV,
streaming). This type of traffic is modelled using Exp-On/Off on UDP as seen in
Table 10.2. Figure 10.14 shows the delays suffered by these applications in the
system.
Delay Distribution for Non elsatic Non interactive traffic
1.4e-06
non elastic non interactive- SS1
non elastic non interactive- SS1
non elastic non interactive- SS2
1.2e-06
Frequency Distribution
1e-06
8e-07
6e-07
4e-07
2e-07
0
0
0.02
0.04
0.06
Time (sec)
0.08
0.1
0.12
Fig. 10.14 Delays suffered by non-elastic non-interactive applications in a system employing QoS
sensitive DBA which makes service differentiation
10
Multiservice Classes and Hybrid Architecture
207
The effective delay for traffic from SS1 (red curve) is observed to be about 22 ms
(average delay = 13.06 ms and jitter = 8.4 ms). The effective delay for traffic
from SS2 (green curve) is about 22 ms (average delay = 13.08 ms and jitter =
8.2 ms). However, when non-elastic non-interactive traffic is served by service class
for nrtPS, the effective delay is observed to be about 53.5 ms (average delay =
16.56 ms, jitter= 27.0 ms). This means that applications like IPTV though can be
served by service class for rtPS the effective delays are not so high under normal
circumstances for it being served in nrtPS class. Also, we can say that serving elastic
interactive traffic in the same class does not really poses any drastic delays for nonelastic non-interactive traffic.
10.4.6.3 QoS Under Bursty Conditions
Another interesting aspect is to judge the robustness of our DBA methodology. We
do this by analysing the system under bursty scenario. It is achieved by increasing
the Off periods and decreasing the On periods and then adjusting the peak rates
used for On/Off applications in the system. Here the On period is 200 ms where Off
period is 800 ms. This means that peak rates of applications in the system are 5 times
the mean rate in the system. Following the same DBA methodology, we obtain the
following simulation observation in Fig. 10.15.
The effective delay for traffic from SS1 (red curve) is observed to be 29.3 ms (average delay = 14.92 ms, jitter = 14.4 ms). The effective delay for SS2 non-elastic
Delay Distribution for Non elsatic Non interactive traffic in Bursty conditions
1.2
non elastic non interactive- SS1
non elastic non interactive- SS1
non elastic non interactive- SS2
Frequency Distribution
1
0.8
0.6
0.4
0.2
0
0
0.05
0.1
0.15
0.2
Time (sec)
0.25
0.3
0.35
Fig. 10.15 Delays in bursty conditions where peak rates for different on/off sources was 5 times
the mean rate
208
K. Gakhar et al.
non-interactive traffic (green curve) is 32.5 ms (average delay = 14.52 ms, jitter =
18.0 ms). However, we can see that delays for applications served by nrtPS class
are affected in this case as the effective delay is observed to be 387 ms (average
delay = 89.0 ms, jitter = 298 ms). It means that under bursty scenarios, the applications like IPTV, if served under bursty conditions will suffer greater delays than the
applications might be able to handle. A user experience will not be very satisfying
under such scenario. It will be better to provide service via the class serving rtPS.
We also take note of the effect that bursty conditions might have on throughput of elastic interactive traffic. Figure 10.16 shows the throughput of applications
(like business transactions) when served via service class for nrtPS. Though the
throughput does not suffer (demand of 4 Mb is served as clear from the figure) the
application get more “zigzag” service. When we compare it with Fig. 10.13, the service such an application gets in normal conditions, it is clear that the application
gets served in smaller bursts of times.
We saw a detailed study of different traffic types in 802.16 networks. We analysed
the necessity of having a simple yet efficient bandwidth allocation policy. With the
help of this policy we made propositions of differentiating various service classes
for different applications. Further, with the help of guidelines in the standard we
map applications traffic to various service types available. Then we move a step
further and propose an optimum number of service classes that might easily be used
to serve various applications traffic. The results from the simulations show that our
Throughput of Elastic Interactive application in bursty environment
Elastic Interactive in SS1
14
12
Bandwidth (Mbps)
10
8
6
4
2
0
0
20
40
60
Time (sec)
80
100
120
Fig. 10.16 Throughput of elastic interactive applications like online business applications under
bursty conditions
10
Multiservice Classes and Hybrid Architecture
209
propositions attain good values of QoS parameters for various applications traffic.
We see that the delays are not affected in these cases when we use our DBA scheme
associated with SS scheduling thus proving the efficiency and robustness of our
method.
10.4.7 Inferred Results on Service Classes
To refer back to Table 10.1 we can now conclude, with the help of above results
the type of service classes that can be used to serve such taxonomy of applications
(and also justify the notions of service classes used in 802.16). The scheduling is
simplified and easy to implement for different traffic classes. The delay and jitter
for UGS and rtPS traffic classes are observed to be well within the practical bounds.
The following observations can be used as guidelines by a service provider:
r
r
r
UGS and rtPS service classes should primarily be used to serve interactive and
non-elastic (e.g., VoIP and Video Conferencing services), and non-interactive
and non-elastic (e.g., IPTV) applications. We have seen that given some traffic
demands in the network, the above-stated classes can be served well within given
delay and loss constraints required by these applications. As we saw, UGS class
doesn’t have to be bounded via fixed allocations and it can be served well in
conjunction with rtPS in the same service class.
Applications which are interactive and elastic in nature, like on-line gaming and
e-commerce, could be served using nrtPS service class. However, the effective
delays suffered due to the bursty nature of other applications in the networks.
That would result into longer than expected delays for user applications.
Lastly, applications of nature non-interactive and elastic can be served using
either nrtPS or BE service classes. These applications being delay tolerant in
nature won’t be suffered in their quality of presentation though a user might
have to wait a bit longer than his/her nerves can bear for a promised fast network
service.
Next, we discuss a novel and simple CAC which improves an earlier work. We
present a detailed analysis of the system and advocates an acceptability curve for a
service provider.
10.5 Call Admission Control
Let us take a brief look on how admission control policy would work for a WiMax
(or a general network to say!) system. Admission control (as the name indicates)
implements a certain distribution of acceptance percentage among various traffic
types in a given system. For example, for given bandwidth pipe in a WiMax system,
as in Fig. 10.17, admission control has to provide a policy which, in some presumed
conditions, allows different percentages of different traffic types on to available
210
K. Gakhar et al.
Fig. 10.17 Admission
control for IEEE
802.16/WiMax system
x UGS
y rtPS
Admission
Control
z NrtPS
m BE
Bandwidth Pipe
bandwidth. However, final decision for supporting various traffic types remains to a
provider to decide.
The 802.16 networks have two characteristics that are seldom associated: the
transfer mode is connection oriented but relies on polling to implement multiplexing
in the uplink. This is why a straightforward application of existing multiclass CACs
may not be appropriate. In this section, first, the state of the art on CAC mechanisms
is presented followed by an evaluation of an existing work which forms the basis of
our analysis and a new proposition.
10.5.1 Related Works
In related works, Wang et al. [21] discussed a scheme which provides highest priority to UGS traffic, maximizing the bandwidth utilization by bandwidth borrowing
and degradation modelling. Non-UGS requests are accepted only if the bandwidth
is still available. The admission control plays an important role in networks where
multiple services such as voice and data are treated. The work by Leong et al. [22]
contributes a CAC policy for the cellular system integrating on/off voice and besteffort data services. It also develops a model to characterize the interaction of the
voice and data traffic flows which leads to better resource utilization and QoS. It,
nevertheless, proposes a CAC which is complex as it consists of two sub-parts, one
handling admissions for voice calls and another for data calls. In our own approach,
we put more emphasis on adopting a deterministic approach while trying to resolve
the admission conditions based on QoS parameters considered in the system.
A cross-layer approach for adaptive power allocation and admission control for
WiMax networks was proposed by Qian and Chen [23]. The admission control treats
all of the traffic from SS in aggregate and CAC manager treats uplink and downlink
bandwidth requirements. It argues that in a last-mile scenario the upstream traffic
could be a fraction of the downstream traffic which we consider is a simplified
assumption. For uplink CAC it assumes complete sharing thus accepting a connection if and only if there are sufficient resources for it. This approach does not
take into account any differentiation among various traffic types which can produce
unwanted results for real-time traffic. Moreover, for downlink CAC it treats traffic
as the one that needs QoS (assembling UGS, rtPS, and nrtPS) and the other one
which needs BE.
10
Multiservice Classes and Hybrid Architecture
211
An approach to mix pricing as one of the parameters for designing an admission
control policy was proposed by Hou et al. [24]. It uses dynamic network conditions
to distribute incentives and thus shaping the aggregate traffic in the network. The
performance of the system is analysed in terms of congestion prevention, achievable user utility, and earned revenues. In CDMA systems most of the CAC propositions are based on predefined levels of SIR (signal-to-interference ratio) at the
receiver [25]. The intelligent CAC proposed by Shen et al. [26] contains a fuzzy
call admission processor to make admission decision. These decisions are based
on various stochastic parameters such as forced termination probability of handoff,
the outage probability of all service types, the next step existing call interference,
the link gain, and the estimated equivalent interference of the call request. As we
know that we have four different service classes to handle in 802.16 networks so
minimum the number of parameters we need to handle simpler our system will be.
We, therefore, would rather keep our approach focus on basic traffic parameters
needed to play a role on managing admission control.
As wireless networks become prevalent the need for even complex admission
control policies would arise as argued by Niyato and Hossain [25]. This work discusses general models and basic admission control approaches and then extends
them into 4G wireless networks. It highlights the fact that in 4G networks a user
will supposedly switch between different access technologies because of mobility
hence requiring stringent controls in order to provide QoS. However, their approach
made simplified assumptions like one packet in one frame in a TDMA environment
and only voice and data packets only. The approach in [27] is multifold. CAC policy
follows simple criterion of accepting a connection if there is bandwidth left. Though
a differentiation is made for given number of connections of a given class yet only
segregation is between BE and “the rest” of traffic type. It proposes Deficit Fair
Priority Queue (DFPQ) in order to make sure that BE traffic gets served.
Heterogeneous traffic in satellite networks has been considered in a work by Qian
et al. [28] where the work proposes an integrated CAC and bandwidth on demand
(BoD) MAC algorithm. It uses a multi-frequency time division multiple access (MFTDMA) scheme for uplink multiple access in the system. It proposes the design of
CAC in conjunction with BoD. The CAC approach is based on the approach of static
allocation and booked allocation.2 The approach of having dynamic CAC to address
packet-level QoS while having constraints on connection-level QoS has been considered in [29] but it did not include traffic differentiation when applying CAC.
In recent years, the approach of network calculus, initiated by Cruz [30, 31],
advocates deterministic bounds on QoS criteria, and in particular the delay for an
application. The approach emphasizes that each source, in practice, conforms to
some traffic description. The worst case sources are studied in a system from which
delay bounds are established. Inspired from this approach, Hébuterne et al. [32]
pointed out that an admission control cannot be separated from the bandwidth
mechanism used inside the network. Their work makes a comparison of complete
2
For more details please refer to the paper directly.
212
K. Gakhar et al.
partitioning (CP), complete sharing (CS), and generalized processor sharing (GPS)
to its proposition of using a class-based partitioning (ClassP) for a CAC process.
According to this proposition, the sources are grouped in classes according to their
delay, and where classes are managed according to a CP scheme. This work, in fact,
directly validates our approach of DBA and intra-SS scheduling where we indeed
proposed class-based treatment of traffic providing delays (thus performance) which
are well within practical constraints. As we will see in later sections our own CAC
proposition (which improves an earlier proposal) advocates deterministic approach
towards “delay-based” class-oriented CAC procedure rather than adopting a traffic
rate based policy.
Another work that was similar in spirit to our own methodology was done by
Lenzini et al. [33]. The work investigates the problem of scalable admission control
for real-time traffic in sink-tree networks employing per-aggregate resource management policies, like MPLS or DiffServ. They use a network calculus approach
to define an admission control algorithm for real-time traffic in sink-tree networks.
The algorithm is based on a worst-case delay which has been derived and proved
to be tight by using network calculus approach. The algorithm proposed to admit a
new flow, following three conditions being checked, if a guarantee can be given that
the required delay bound, besides those of other already established flows are not
exceeded.
Having discussed some works of similar nature, we now present our approach
which was inspired from an existing work, discussing pitfalls of their proposition
and present a detailed analysis of our own system.
Before presenting our own proposition and analysis for CAC in the following
paragraphs, we first analyse the work which has been an inspiration for it.
10.5.2 Performance of a Multiclass CAC
In the following paragraphs we discuss a mechanism for CAC in 802.16 networks.
The proposed mechanism is based on the one presented by [34]. The admission or
the rejection is conditioned by the bandwidth availability and the maximum delay
requirement for rtPS connections. This mechanism takes into account the different
traffic classes defined in this standard. We have different admission conditions for
each traffic class. We first define the terminology used in [34]:
r
r
r
r
r
r
r
r
f : superframe duration
m i ∗ f : maximum delay requirement for connection i
Cup : total capacity allocated for uplink transmission
CU G S : current capacity allocated to UGS connection
Cr t P S : current capacity allocated to rtPS connection
Cnr t P S : current capacity allocated to nrtPS connection
ri : average bitrate for connection i
bi : leaky bucket size of connection i
10
Multiservice Classes and Hybrid Architecture
213
The admission control policy for IEEE 802.16 traffic classes are given by the
following conditions:
r
r
r
nrtPS
ri < Cup − CU G S − Cr t P S − Cnr t P S
UGS
ri < Cup − CU G S − Cr t P S − Cnr t P S
∀ k, bk + f ∗ rk < m k ∗ f ∗ (rk /Cr t P S ) ∗ (Cup − CU G S − ri )
rtPS
ri < Cup − CU G S − Cr t P S − Cnr t P S
bi + f ∗ ri < m i ∗ f ∗ (ri /Cr t P S + ri ) ∗ (Cup − CU G S )
∀ k, bk + f ∗ rk < m k ∗ f ∗ (rk /(Cr t P S + ri )) ∗ (Cup − CU G S )
For all traffic types, the first condition just checks bandwidth availability. Since
it is assumed that nrtPS traffic has less priority than UGS and rtPS, this condition is
sufficient for a new nrtPS connection. The second condition (the “delay” condition)
for a UGS connection consists in checking that the maximum delay condition shall
still be respected for each currently active rtPS connection if the new UGS connection is accepted. Indeed, the 802.16 standard states that the network should be able
to guarantee a maximum delay for each rtPS connection. We have similar conditions
for a new rtPS connection. For a given k, the delay condition ensures that every bit
arriving in a given superframe can be transmitted in less than m i frames. Indeed, the
maximum bits received in one superframe is limited by bi + ri ∗ f according to the
leaky bucket specification. Moreover, the rate factor takes account of the fact than
UGS has more priority than rtPS, and that rtPS has more priority than nrtPS, which
is translated into the scheduling policy. However, we note that accepting a new UGS
or rtPS connection involves as many tests as the number of rtPS connections already
active. This is obviously less than practical since this number may be arbitrarily
large. We address this particular point in the following paragraphs by proposing a
global condition to check maximum delay performance.
Let’s assess the performance of the CAC proposed by [34]. In this study, we
compute the dropping probabilities versus offered load ρ versus traffic profile parameters. Table 10.3 resumes the simulation parameters. The tolerated delay of an
Table 10.3 Simulation parameter values
Parameters
Values
Cuplink
ri
f
m min
m max
bi
ρ
ρU G S
ρr t P S
ρnr t P S
67 Mbps
1 Mbps
1 ms
10 ms
50 ms
30000 bits
30–70 erlang
ρ/3
ρ/3
ρ/3
214
K. Gakhar et al.
rtPS connection is taken randomly between m min and m max . As in [34], we assume
that the frame duration is 1 ms. However, the standard has evolved and a value of
10 ms is considered more appropriate for a superframe duration. We also present
and discuss results with 10 ms frame as we move on.3
Figure 10.18 shows the blocking probabilities versus the leaky bucket size (b)
for r = 1 Mbit/s. It shows clearly the influence of the burstiness (represented by
b); when b increases, the blocking probabilities for UGS and rtPS traffic sharply
increases while the blocking probability for nrtPS traffic decreases. This should
obviously be avoided; although the conditions for high priority traffic may be more
stringent, it is not desirable that low priority traffic starve high priority traffic.
As a further example of the system we see in Fig. 10.19 the dropping probability
of various traffic types as the system load increases. It is clear that with increasing
traffic load in the system real-time systems suffer much more than the non-real-time
systems.
Therefore, while the conditions proposed in [34] achieve an admission control
for various service classes in the standard their mechanism penalize the performance
of higher priority traffic while favouring low priority traffic.
0.35
P(UGS)
P(rtPS)
P(nrtPS)
0.3
Dropping probability
0.25
Cuplink = 67 Mbps
f = 1 ms
ρ = 67 erlang
r = 1 Mbps
m : random [10,50] ms
0.2
0.15
0.1
0.05
0
0
0.5
1
1.5
2
2.5
3
4
Leaky bucket size, b (bit)
x 10
Fig. 10.18 Dropping probability versus leaky bucket size b
3 Considering the WirelessMAN-SC, NLOS, using OFDM has a frame of 10 ms, 25 MHz channel
with bit rate 40 Mbps.
10
Multiservice Classes and Hybrid Architecture
215
0.35
UGS
rtPS
nrtPS
0.3
Dropping probability
0.25
0.2
0.15
Cuplink = 67 Mbps
f = 1ms
r = 1 Mbps
b = 30 Kbit
m : random [10,50] ms
0.1
0.05
0
30
35
40
45
50
55
60
65
70
Traffic load (ρ)
Fig. 10.19 The dropping probability versus the traffic load ρ when b = 30 k
10.5.3 Novel Call Admission Control
In this section we propose an improved approach of CAC. Our approach modifies
the second condition of traffic acceptance compared to what has been discussed
for UGS and rtPS traffic in [34]. Our first objective is to substitute a global condition to the set of individual conditions, one for each rtPS connection. Our second objective is to limit the unfairness of the CAC regarding UGS and rtPS traffic.
The following equations illustrate the admission control conditions for each traffic
class:
r
r
nrtPS
ri < Cup − CU G S − Cr t P S − Cnr t P S
UGS
ri < Cup − CU G S − Cr t P S − Cnr t P S
k (bk + f.r k,r t P S ) +
k ( f.r k,U G S ) + f.ri,U G S
∀k,
< f.min(m k )
Cuplink
216
r
K. Gakhar et al.
rtPS
ri < Cup − CU G S − Cr t P S − Cnr t P S
bi + f.ri,r t P S + k (bk + f.rk,r t P S ) + k ( f.rk,U G S )
∀k,
< f.min(m k )
Cuplink
For UGS traffic, the admission condition of the connection concerns the bandwidth availability: ri < Cup − CU G S − Cr t P S − Cnr t P S . It must also guarantee
a normal operation of all rtPS connections. To do this, the admission condition
must consider the worst case. It means that a new UGS connection is accepted if
the available bandwidth can be used to transmit the rtPS connection which has the
smallest maximum tolerated delay. This results in the following delay condition:
k (bk
+ f.rk,r t P S ) + k ( f.rk,U G S ) + f.ri,U G S
< f.min(m k ).
Cuplink
Finally the condition to admit an rtPS connection can be achieved if the following
condition is satisfied:
bi + f.ri,r t P S +
+ f.rk,r t P S ) +
Cuplink
k (bk
k(
f.rk,U G S )
< f.min(m k )
Figure 10.20 shows that the variation of the dropping probability versus the traffic load (ρ). The interest of this new mechanism is clearly emphasized since the
dropping probability of the rtPS traffic decreases strongly. Indeed, the bandwidth
used by the nrtPS traffic was so large with the mechanism of [34] that was having a
smaller dropping probability. With the new mechanism the bandwidth is allocated in
a better manner since the rtPS and the UGS traffic take a part of the nrtPS bandwidth,
this decreases the dropping probabilities of these two traffics (UGS and rtPS) and
increase a little the probability of the nrtPS traffic.
In this new CAC, the delay condition for a UGS connection consists in checking
that all the real-time traffic (UGS and rtPS) that arrives during a given frame should
experience a delay which is smaller than the most stringent bound f.min(m k ) currently negotiated for rtPS connections. The delay for accepting a new rtPS connection is similar.
This delay condition assumes that UGS and rtPS connections share the total
available bandwidth Cup if requested, nrtPS traffic being served with less priority.
This means that the CAC does not take into account that UGS traffic has higher priority than rtPS traffic, leaving the scheduling to the DBA and the intra-SS scheduling
mechanism.
In results, we see that the blocking probabilities for UGS and rtPS traffics are
significantly better with new CAC, while the blocking probability for nrtPS traffic
correspondingly increases. This is because we assume that UGS and rtPS traffic
together have prior access to transmission opportunities; by relaxing the delay conditions, the blocking probabilities decrease for both UGS and rtPS traffic.
10
Multiservice Classes and Hybrid Architecture
217
0.35
0.3
UGS new CAC
rtPS new CAC
nrtPS new CAC
UGS
rtPS
nrtPS
Dropping probability
0.25
0.2
CUplink = 67 Mbps
0.15
f = 1 ms
r = 1 Mbps
b = 30 Kbit
m : random [10,50] ms
0.1
0.05
0
30
35
40
45
50
55
60
65
70
Traffic load (ρ)
Fig. 10.20 The dropping probability versus the traffic load ρ (New CAC)
Moreover, since the delay conditions for UGS and rtPS traffic are now very similar, the blocking probability performance for the two traffic classes are now very
close. This implies that supporting UGS traffic within the rtPS class should not be
a problem and has not impact on the blocking performance for either rtPS or UGS
traffic; a CBR traffic has a low bucket size, which means that its impact on the delay
condition is going to be negligible.
10.5.4 System Analysis
This section takes a critical view of the proposition presented in the previous section
(Novel CAC) by evaluating 802.16 system under various traffic conditions. It is
interesting to note that CBR traffic normally needs small bucket sizes in a deployment. It means that in case of collective demands the parameters b, r and f can
play crucial role for realizing a deployment. In the following paragraphs we present
some results showing various values of traffic parameters and study its performance
for the blocking probabilities of different traffic types. The aim of this analysis is
to present a balanced view of how traffic parameters could play a significant role in
reality (for a service provider) when it comes to network management policies. We
218
K. Gakhar et al.
0.015
UGS
rtPS
NrtPS
Dropping Probability
0.01
Cuplink = 40Mbps
f = 10 ms
r = 0.1 Mbps
MaxDelay = 20 ms
b = 2700 bits
rhoUGS = rho * 0.3
rhoRtPS = rho * 0.2
rhoNrtPS = rho * 0.5
0.005
0
10
15
20
25
30
35
Traffic Load (ρ)
Fig. 10.21 Dropping probability for small r and b values with maxdelay 20 ms
also used different traffic configurations which are more apt to the standard currently
and are shown on each figure.
Figure 10.21 shows the dropping probability versus traffic load for new CAC
policy. The value of r is 0.1 Mbps and that of b is 2700 bits. Also the loads of
various traffic types are different than the values used earlier; UGS = ρ∗0.3; rtPS =
ρ ∗0.2; nrtPS = ρ ∗0.5. In this case we see that nrtPS traffic has almost no dropping
probability whereas UGS and rtPS traffic dropping probability between 1% and 2%.
The maximum delay considered for traffic types is 20 ms.
Figure 10.22 shows the dropping probabilities for different traffic types when we
increase the value of only maxdelay compared to the one in Fig. 10.21. We realize
that as the delay tolerance increases the accepted load for UGS and rtPS increases a
bit though there is also a corresponding increase in the dropping probability of UGS
and rtPS traffic (Fig. 10.23).
Next, we change the value of b and increases it to 20 kbits, that is, the bucket
size is now 20 kb. We can see a sharp increase in the dropping probabilities of UGS
and rtPS traffic which need to satisfy higher bandwidth values before they can be
accepted successfully for new connections.
The above scenario doesn’t change much even if we increase the maxdelay value
to 30 ms as we can see in Fig. 10.24. It means that such traffic profiles won’t be very
practical for a normal practical scenario as the corresponding loads of UGS and
rtPS traffic won’t be significant enough. We can see that the blocking probabilities for UGS and rtPS traffic types have higher values than those of NrtPS traffic.
The charge considered in the system consists of 50% of real-time traffic (UGS and
10
Multiservice Classes and Hybrid Architecture
219
0.025
UGS
rtPS
NrtPS
Dropping Probability
0.02
Cuplink = 40 Mbps
f = 10 ms
r = 0.1 Mbps
MaxDelay = 30 ms
b = 2700 bits
0.015
rhoUGS = rho * 0.3
rhoRtPS = rho * 0.2
0.01
rhoNrtPS = rho * 0.5
0.005
0
0
5
10
15
20
Traffic Load (ρ)
25
30
35
40
Fig. 10.22 Dropping probability for r and b values with maxdelay 30 ms
0.4
UGS
RtPS
NrtPS
Dropping Probability
0.35
0.3
Cuplink = 40 Mbps
f = 10 ms
r = 0.1 Mbps
b = 20000 bits
MaxDelay = 20 ms
0.25
rhoUGS = rho * 0.3
rhoRtPS = rho * 0.2
0.2
rhoNrtPS = rho * 0.5
0.15
0.1
0.05
0
10
15
20
25
Traffic Load (ρ)
Fig. 10.23 High dropping probability for UGS and rtPS as b size increases
30
35
220
K. Gakhar et al.
0.35
UGS
0.3
Dropping Probability
0.25
RtPS
Cuplink = 40Mbps
f = 10 ms
r = 0.1 Mbps
b = 20000bits
MaxDelay = 30ms
NrtPS
rhoUGS = rho * 0.3
0.2
rhoRtPS = rho * 0.2
rhoNrtPS = rho * 0.3
0.15
0.1
0.05
0
0
5
10
15
20
25
30
35
40
Traffic Load (ρ)
Fig. 10.24 Higher delays have almost no effect on dropping probabilities for high b values
rtPS) and 50% of NrtPS (we assumed that BE traffic gets treated as per bandwidth
availability).
Now we see the case when the value of r is increased to 1 Mbps. Figures 10.25
and 10.26 show the case when b is 2000 bits and maxdelay is 20 and 30 ms, respectively. We observe that now we have some dropping probability for nrtPS traffic in
the system.
Even though some realistic value is about 2% dropping probability in implemented systems here we want to show how the system behaves for higher values of
r . Also we want to make one comment on maxdelays considered here; in commercial products and in literature we find the values relatively higher than the values
considered here, thus we present a strict system behaviour here.
To see the worst case scenario, we check Fig. 10.27. Here the value of maxdelay
is kept to 20 ms, r is 1 Mbps whereas b is increased to 20 kb; means that traffic need
huge bursts with low values of delays to respect (that could be real-time critical situations). We see that the number of real-time connections that can be accepted with
lower dropping probabilities are very small with the above system configurations.
It is clear from these observations that we have certain limits on the number of
connections that can be entertained by a multiservice environment. This limit on the
number of connections comes into effect as soon as the required QoS for a traffic
type starts to deteriorate beyond a certain value. And, this in fact, is decided by the
admission and delay conditions used in a system as shown via [34] and our own
proposition. This means that an admission control policy plays a role of deciding
how different traffic types can be categorized in order to serve them in the system.
10
Multiservice Classes and Hybrid Architecture
221
0.4
0.35
UGS
RtPS
NrtPS
Dropping Probability
0.3
0.25
Cuplink = 40 Mbps
f = 10 ms
r = 1 Mbps
MaxDelay = 20 ms
b = 2000
0.2
rhoUGS = rho * 0.3
rhoRtPS = rho * 0.2
0.15
rhoNrtPS = rho * 0.5
0.1
0.05
0
0
5
10
15
20
25
30
35
40
Traffic Load (ρ)
Fig. 10.25 Large dropping probabilities for UGS and rtPS when r is 1 Mbps with some blocking
for nrtPS traffic
0.35
UGS
RtPS
NrtPS
0.3
Dropping Probability
0.25
Cuplink = 40Mbps
r = 1Mbps
f = 10 ms
b = 2000 bits
MaxDelay = 30 ms
0.2
rhoUGS = rho * 0.3
0.15
rhoRtPS = rho * 0.2
rhoNrtPS = rho * 0.5
0.1
0.05
0
0
5
10
15
20
25
30
Traffic Load (ρ)
Fig. 10.26 Large dropping probabilities for UGS and rtPS when maxdelay is 30 ms
35
40
222
K. Gakhar et al.
0.7
UGS
RtPS
0.6
NrtPS
Cuplink = 40Mbps
r = 1Mbps
f = 10ms
b = 20000 bits
MaxDelay = 20 ms
Dropping Probability
0.5
0.4
rhoUGS = rho * 0.3
rhoRtPS = rho * 0.2
0.3
rhoNrtPS = rho * 0.5
0.2
0.1
0
0
5
10
15
20
25
30
35
40
Traffic Load (ρ)
Fig. 10.27 Worst case: with smaller delay and high value of b
We have seen in the earlier that novel CAC favours more UGS and rtPS traffic to
NrtPS traffic thus giving better system behaviour than the one discussed in [34].
Nevertheless, this new policy depends on the system configuration.
Note that the set of individual conditions in [34] (one for each active rtPS connection) are thus replaced in this new CAC by a single one. This is obviously more
practical, while being realistic in an operational framework. Indeed, in such a framework, it is not up to the user to fix the maximum delay but up to the operator to
state what type of traffic is supported. It is very likely that network operators shall
propose limited sets of traffic classes, which fix delay conditions according to traffic
engineering capabilities. If a single delay condition m is offered, the upper bounds
in the delay conditions become f.m.
Therefore, as an example of such a system we propose a limit on the number
of connections that can be entertained. Assuming that we have rtPS and NrtPS
connections in the system then for a given traffic configuration, where the blocking
probability is 3.5%, the number of rtPS connections are limited to 22 and the number
of NrtPS connections are limited to about 32 as shown in Fig. 10.28. These values
are matched and found to be almost the same as obtained by Erlang’s formula. Thus
it is shown that an 802.16 system can very well support real-time and non-real-time
traffic given a required profile. As discussed in the above paragraphs, it is the service
provider to decide on how best he wants to configure the system.
Now we move on to the second contribution. We first discuss some related works
found on interworking in related domains. Then we present our novel proposition
of a “tight coupling” based interworking architecture.
10
Multiservice Classes and Hybrid Architecture
223
Acceptability Curve for Blocking Proba of 3.5%
35
Acceptability Curve
30
Cuplink = 40 Mbps
r = 1Mbps
f = 10 ms
MaxDelay = 20 ms
b = 20000 bits
nrtPS Charge
25
20
15
Zone of Acceptability of new
Connections
10
5
0
0
5
10
15
20
25
rtPS Charge
Fig. 10.28 Acceptability curve in 802.16 system
10.6 Related Works
In this section we look at some of the approaches which treat similar problematics.
The work in [35] discusses the interworking options among cellular networks and
WLANs arising due to business opportunities. The authors present a generic management platform suitable for WLANs interworking with other wireless systems. It
focuses on the implementation of a high-speed wireless environment and the ability
to maintain multimedia services in hotspot locations. The system is based on a common all-IP platform facilitating mobility using mobile IP. The work is an approach
that can be classified as “loose-coupling” approach wherein various management
modules are used to ensure interworking among different networks.
There have been some recent studies on interworking between UMTS and
WiMax [36, 37]. The motivation in [36] is to address ubiquitous communication
in various wireless technologies enabling easy handover among them. It focuses
on an UMTS-WiMax mobile IP based interworking architecture hiding the heterogeneity of lower-layer technologies. It describes the handover from WiMax access
networks to UTRAN and also from UTRAN access networks to WiMax with the
help of standard modules already existing in them. The work in [37] suggests an
interworking based on tight coupling with wireless access (TCWA). It improves on
their earlier work by proposing that the data traffic in inter-network communications
can be dynamically distributed as the added wireless links provide alternative routes.
224
K. Gakhar et al.
These works have been focusing more on consolidating handover aspects within a
hybrid system so as to provide the quality of network access.
One more work based on “loosely coupled” approach, integrating 3G and 802.16
networks was published in [38] and also contains many similar references. The
authors present a novel network and mobile client architecture that provides seamless roaming and mobility while maintaining connectivity across the heterogeneous
wireless networks, WiMax and 3G, and provides QoS support. By integrating the 3G
and 802.16 wireless networks, users will experience seamless and transparent wireless connectivity in more places and with better service than what can be obtained
by a single type of network. The proposed architecture incorporates the procedures
for activating a QoS session, the translation between network-specific QoS classifications, and network and session layer QoS support. They also propose a SIP-based
mobility scheme that is capable of providing QoS support across different networks.
Another work [39] for a hybrid system of 802.16 and 802.11 networks proposes
a scheme of vertical handoff between these networks while keeping the available
bandwidth as the metrics. The proposed algorithm reduces the unnecessary handoff probability because of the signal strength temporarily dropping down. It also
discusses a two hop architecture using dual-mode relay gateway (which could be
mobile) within a hybrid network also consisting of AP for WLAN. It is, once again,
can be classified as “loosely-coupled” architecture which does not address QoS at
MAC level.
Wireless mesh networks (WMNs) have also been in focus for some time now.
IEEE 802.16a [40] amends 802.16 by adding the specification for an air interface
for both point-to-multipoint and mesh systems operating in the 2–11 GHz frequency
range. We refer to some existing work and try to find some commonalities among
our objectives and the available works in mesh networks. WMNs are dynamically
self-organized and self-configured with the nodes in the network automatically
establishing an ad hoc network and maintaining the mesh connectivity. The architecture for mesh networks can be classified into three types: (a) Infrastructure
(Backbone) WMNs, (b) Client WMNs, and (c) Hybrid WMNs. Hybrid WMNs, with
their ability to combine both infrastructure and client sides, are supposed to play an
important role in coming years to propagate broadband services and provide QoS
for applications though some research challenges for capacity evaluation, security
and MAC level protocols are to be evaluated.
The work in [41] highlights the need of efficient routing combined with better scheduling to eventually achieve QoS for UDP connections (serving video and
voice) and also for data connections in WMNs of 802.16 systems. It starts by
proposing a routing algorithm which is fixed and does not vary with time as for
wireless channels. It provides a good performance for UDP and TCP connections
though it does not claim to be optimal for either of them. It considers detailed
scheduling for CBR and VBR traffic taking into account the number of slots that
have to be allocated to a connection flow given a certain dropping probability for
that traffic type. Using the similar principle it develops models to provide QoS to
TCP, first with a fixed allocation scheme and then with an adaptive fixed allocation
scheme. It further develops a detailed study to assure QoS for different TCP flows
10
Multiservice Classes and Hybrid Architecture
225
sharing the bandwidth and eventually showing that adaptive scheme provides more
than minimum required throughput to most of the flows. An analytical distributed
scheduler was proposed in [42] for 802.16 in mesh mode. The model assumes that
the transmit time sequences of all the nodes in the control subframe form statistically
independent renewal processes. It estimates distribution of the node transmission
interval and connection setup delay which have effects on throughput and delay.
The goals of IROISE have been to advocate policies to achieve and to maintain
QoS that a user is going to experience in a two hop hybrid wireless network of
802.16 and 802.11. This puts focus more on intrinsic ability of the proposed architecture to achieve the aforementioned objectives. This lead us to think about an
approach that would be more “tightly coupled” and hence won’t need much external
modules to ensure it.
The work in [43] has been partially an inspiration for our approach. It defined
interworking mechanism between WMAN and WLAN, in particular HiperMAN
(High Performance Radio Metropolitan Area Network) and HiperLAN (High Performance Radio Local Area Network), both the standards defined by the European
Telecommunications Standards Institute (ETSI). It studied the interworking between HiperLAN/2 and HiperMAN at three levels4 :
r
r
r
IP level: This option was studied using IPv6 header fields, giving even new interpretation for “Flow Label” field. However, the study itself pointed out that
implementing such approach was not possible in 802.11 networks and the proposed interpretation could not be implemented.
Ethernet level: This approach inspired from the bridging mechanism available
in [44] and its subparts. With the limitations of the number of class of services
in [44], the approach at Ethernet level has been considered practical. However, it
wouldn’t be possible to actually translate traffic requirements on parametric level
(that could be better addressed at MAC level).
Data Link Control (DLC) level: The bridging approach at this level could have
been the simplest solution but it has not been possible to map service flow parameters to QoS parameters between two standards.
It was recognized in our work that it was necessary to identify the potential parameters which could eventually be used for self-information transmission in an
hybrid system. With the advent of 802.16 and 802.11e (addressing parameters that
could support QoS) it was sensed that it could eventually be possible to establish
interworking between these two different paradigms. The work was addressed eventually in [45].
It was considered to address dynamic resource reservation policies for 802.16
systems. As the market evolves for these systems, specially in licensed band, it
will be useful for operators to have resource allocation policies which could bring
profits and also satisfy users. The subject was studied with assumptions of hysteresis
mechanism and the relevant results are published in [6]. This work also addresses
4
For details please refer to [43].
226
K. Gakhar et al.
traffic in a multiservice environment of WiMax. It is clear from current trends in
applications that multiservice networks are going to be a essential for every new
system. With that in mind, the results have been obtained which prove that instead
of supporting number of service classes recommended in the standard (infact four),
one can easily have all applications requirements fulfilled with only three service
classes. We will see the subsequent details in the following chapters.
10.7 InterWorking Architecture
This section proposes a tightly coupled architecture where MAC level mechanisms
inherently help to achieve interworking among WMAN and WLAN systems. We
address the “matching” between traffic parameters as found in IEEE 802.16 and in
IEEE 802.11e systems. In IEEE 802.16, we deal with various application flows by
handling them via various scheduling services as in Table 10.4. In IEEE 802.11e,
the access mechanisms help in achieving QoS requirements for an application. However, this similitude does not mean a direct conversion of traffic category from one
system into another and vice versa.
Our proposition for a hybrid architecture can be seen in Fig. 10.29. The radio
gateway (RG), as perceived, works as a Subscriber Station for the IEEE 802.16 network and also as a QAP for the IEEE 802.11e network. In order to address the goals
set for the project work (providing real-time audio/video, audio/video on demand,
precious data transfer) we have identified the following traffic classes which could
be made up of various traffic parameters found in the drafts/standards. These classes
are worked out depending upon a traffic type and its QoS requirements and should
not be conflicted with categorized traffic services in Table 10.4.
r
r
CBR with Real-Time Traffic (C1): Applications like real-time audio/video fall
into this class. The desirable characteristics for this class are very limited packet
losses, minimum latency delays and very little jitter.
VBR with Real-Time Traffic (C2): Examples of traffic for this class include video
on demand (streaming) and variable rate VoIP. Again, packet losses, minimum
latency delays and jitter limits apply to such traffic though their values could be
more tolerable compared to those of class C1.
Table 10.4 Mandatory QoS parameters for traffic categories
UGS
Maximum sustained traffic rate, maximum latency, tolerated jitter, and
request/transmission policy
rtPS
Minimum reserved traffic rate, maximum sustained traffic rate, maximum latency, and
request/transmission policy
nrtPS
Minimum reserved traffic rate, maximum sustained traffic rate,, traffic priority, and
request/transmission policy
BE
Maximum sustained traffic rate, traffic priority, and request/transmission policy
10
Multiservice Classes and Hybrid Architecture
Fig. 10.29 IROISE: The
proposed architecture
227
802.16
Radio Gateway
SS
MM 802.11e / WiMAX
BS
QAP
non-AP QSTA
non-AP QSTA
non-AP QSTA
BS: Base Station
SS: Subscriber Station
QAP: QoS Access Point
non-AP QSTA: QoS Stations
MM: Mapping Module
r
r
VBR with Precious Data (C3): This class addresses traffic type like large data
files. However, in this case traffic characteristics are more delay tolerant with a
need of minimum packet loss.
Unspecified Type (C4): This class contains simple best effort type traffic such as
web access, emails etc. So the traffic is purely BE.
Lets zoom-in on the radio gateway as in Fig. 10.30. The QAP module, after
receiving a request from a non-AP QSTA, forwards the traffic identifier (TID) of an
Radio Gateway (RG)
T
R
S
Subscriber
Station (SS)
MM
Mapping
Table
QoS Access
Point (QAP)
Fig. 10.30 Radio Gateway
supporting QoS
T: Transmitter
S: Scheduler
R: Receiver
T
R
S
228
K. Gakhar et al.
application flow along with the priorities/parameters that convey QoS requirements
of an application to the mapping module (MM). The MM then maps the incoming
traffic parameters to the ones that are supported for an IEEE 802.16 application flow.
Based upon the traffic priorities discussed in an IEEE 802.11e network (first 8-bits
of TID) as well as the traffic classes (per-flow traffic characteristics), we propose two
different kinds of mappings.5 The first kind of mapping is “prioritized mapping”. In
this mapping, the traffic priorities for an application flow, as in 802.1D [44], coming from a WiFi network are mapped to the corresponding traffic class in an IEEE
802.16 network and vice versa. The second kind of mapping is per-flow “parameterized mapping” as illustrated in Fig. 10.31. It depends upon optional/mandatory
traffic parameter requirements for an application flow though more optional parameters (found in the drafts/standards) could be used depending upon the technical
and/or the financial requirements of a network. However, the handling for these two
kinds of mappings remain MM implementation dependent.
Following this mapping the whole process of connection setup in an IEEE 802.16
network (as discussed in [45]) requesting QoS for an application flow is executed
by the SS module present on the RG. As discussed in [1], the QoS requirements
for an application flow can be sent in MAC CREATE SERVICE FLOW.request
along with the scheduling required. However, whether the request is served or not
depends upon the resources available to the BS. Similarly, for the downlink, once
the SS receives an application flow it is forwarded to the MM. The MM identifies
the incoming flow with its SFID and associates it with the corresponding TID that
it received with the request from a non-AP QSTA. This mapping between SFID and
TID would then be used until the completion of data transmission for an application
flow. Obviously, during this whole process we will need to buffer the incoming
traffic at the RG being used.
We now discuss the proposed mapping in detail. For this sort of mapping to
work the traffic characteristics pertaining to a class, as seen in the mapping table,
in one system (say IEEE 802.11e) should be interchangeable with the similar traffic
characteristics in the other system (say IEEE 802.16).
r
r
r
5
Both Maximum Sustained Traffic Rate and Peak Data Rate specify the peak
information rate of the service in bits per second. They do not include MAC
overhead such as MAC and PHY headers.
Maximum Latency and Delay Bound asserts the maximum latency periods
within their respective networks, representing a service commitment, starting at
the time of arrival of a packet at the local MAC sublayer till the time of successful
transmission of the MSDU to its destination.
The following terms are used in the following equations: D : Delay, max D :
Delay Bound, Dq : “Queueing” Delay, Dt : Transmission Delay, J : Tolerated
Jitter. We consider that Dq includes all types of delay (buffering, scheduling,
retransmission) except transmission delay. Note that max D and data rate are not
independent and also Dt is proportional to data rate. Indeed, we observe that:
For more details on QoS setup in IEEE 802.11e please refer to [45].
10
Multiservice Classes and Hybrid Architecture
Fig. 10.31 Parameterized
mapping
229
IEEE 802.11e
IEEE 802.16
Traffic Class C1
Traffic Class C1
Peak Data Rate
Maximum Sustained Traffic
Rate
Delay Bound
Maximum Latency
(Minimum PHY Rate +
Delay Bound)
Tolerated Jitter
Traffic Class C2
Traffic Class C2
Minimum Data Rate
Minimum Reserved Traffic
Rate
Peak Data Rate
Maximum Sustained Traffic
Rate
Delay Bound
Burst Size
Maximum Latency
Maximum Traffic Burst
Traffic Class C3
Traffic Class C3
Minimum Data Rate
Minimum Reserved Traffic
Rate
Peak Data Rate
Maximum Sustained Traffic
Rate
User Priority
Traffic Priority
Burst Size
Maximum Traffic Burst
Traffic Class C4
Traffic Class C4
Peak Data Rate
Maximum Sustained Traffic
Rate
User Priority
Traffic Priority
D = Dq + Dt
(10.1)
min D ≥ min Dq + min Dt
max D ≤ max Dq + max Dt .
(10.2)
(10.3)
max Dq ≤ max D − min Dt
(10.4)
min Dq = 0.
(10.5)
Also, we can say that
230
K. Gakhar et al.
Jitter for an application can be defined as:
J = max D − min D.
(10.6)
We introduce an upperbound for “jitter” experienced by an application in an
IEEE 802.11e network (no notion exists in [46] ). Using the above equations we
deduce an upper bound for jitter as:
J ≤ min(max D, max D + max Dt − 2 ∗ min Dt ).
r
r
r
(10.7)
Therefore from the values of Data Rate and Delay Bound of an application request from an IEEE 802.11e network, J in an IEEE 802.16 network could follow
the upperbound deduced in Eq. (10.7).
Both Minimum Data Rate and Minimum Reserved Traffic Rate are the minimum
data rates specified in bits per second and map to similar requirements of an
application flow. In this mapping MAC headers are not counted.
Traffic Priority determines the priority among two service flows identical in all
QoS parameters except priority. However, for class C3/C4 type traffic from an
IEEE 802.11e network, traffic priority is mapped onto by user priority (UP) assigned to an application flow. So UP and Traffic Priority play a similar role when
it comes to mapping.
Burst Size specifies the maximum burst of the MSDUs belonging to a TS which
arrives at the MAC SAP at peak rate. Maximum Traffic Burst describes the maximum continuous burst the system should accommodate for a service. It also
assumes that the service is not currently using any of its available resources, i.e.
the instant when an MSDU arrives at MAC.
10.8 Conclusion
In the following paragraphs we summarize our work with small discussion on future
work in sight.
This chapter discussed the multiservice nature of a WiMax network. We have
based our study on the four traffic classes as specified in the 802.16 standard. We
have shown that neither transfer plane QoS delay parameters nor command plane
blocking parameters are greatly impacted by supporting UGS traffic within the
rtPS traffic class. This leads to our proposal of offering only three traffic classes
instead of four. This may have a significant impact on the cost of Network Interface
Cards for network elements in WiMax networks since dealing with two separate
scheduling mechanisms (periodic for UGS and polling based for the other classes)
greatly increases the complexity of the design. The paper also proposes very simple
mechanisms, both in the command plane (CAC) and in the transfer plane (DBA
and intra-SS scheduling) and presents preliminary results showing that that these
mechanisms can indeed provide WiMax network with a robust multiclass support.
This implies that packet scheduling can have a very small impact on the cost of
10
Multiservice Classes and Hybrid Architecture
231
WiMax cards. Furthermore, we have shown that a simple multiservice CAC can
support real time, CB data service and BE traffic with little complexity. It is up to
the network operator to specify traffic profiles that ensure a good utilization of the
link.
In this work we also discuss various paradigms evolved these last years for interworking among different wireless technologies. To address the objectives within
the project we decided to adopt a “tightly coupled” approach for an interworking
architecture for 802.16 and 802.11. We proposed a matching among the parameters of these two different systems. The proposed mapping may evolve further in
details but is not the only factor that will count when it comes to ensure QoS. The
process of establishing data transmission including buffering, proposed mapping,
setting up of a new connection etc. will take some initial “setup” time. A synchronization should be ensured between the arrival of data at the RG and transmission
opportunity (TxOP) available to QAP module. That will largely depend upon the
behaviour of the mapping module (MM) which ensures the mapping. The role of
MM is multifold: It has to ensure the integrity of the incoming and the outgoing
traffic (in either direction). The scheduling policy for the traffic inside the RG has
to make sure that application flows are channelled to the corresponding connections
(real/virtual). Besides the traffic handling inside the RG, scheduling policies within
the individual networks should ensure that QoS sensitive applications get served in
time along with the bandwidth constraints which in turn would also depends upon
the dimensioning of such a system.
Appendix: BlocQ Implementation
Next, we briefly discuss the simulation utility that has been used to realize our scenarios before we move to detailed analysis. The basic simulation utility used in our
work was the discrete event based network simulator popularly called ns-2. At the
time we started our work, to the best of our knowledge, there was no known implementation of MAC layer of IEEE 802.16 for ns-2. Thus we needed to make certain
hypothesis for simulating TDMA mechanism of 802.16 MAC layer. We consider
that there are no losses in the system due to wireless conditions. We implemented a
buffer management technique, modifying DropTail implementation in ns-2, which
we call BlocQ.6
To achieve “polling” mechanism BS regularly calls an “update function” within
its allocation policy (which could be done at different instances). This function
then sends the sum of present number of bytes in its various queues of traffic
sources which, in fact, is translated as demand of an SS. The BS then makes uplink bandwidth allocation to a SS in proportion of the available link bandwidth as:
Demand SSi /Link BW
6
The code is available with the author.
232
K. Gakhar et al.
These demands are then redistributed internally in a SS to individual queue demands of each source (again in proportion to the demand of a source to the sum
of demands of all traffic sources). Following these allocations each source is either allowed or not to send traffic (zero allocation) on the uplink. On the downlink, BS braodcasts the allocations to all SSs. The links in this direction are FIFO
in nature and carries the downlink traffic (acknowledgements etc) to SS. In simulations each flow is identified by its corresponding number (in addition to its
source and destination) which facilitates the receptions of downlink traffic to its
destination.
It was necessary to define BlocQ because changing DropTail functions directly
had an impact on the functionality of other modules in ns2 (as we observed for
some simple CBQ examples). This extension to ns-2 enables it to simulate the
time-division multiplexing (TDMA – static and dynamic) in the upstream direction.
For the sake of simplicity, we have chosen not to explicitly simulate the control
messages (though their time duration was kept during simulations which is of order
of few sec). Instead, we have implemented two procedures, one for evaluating
the requirements of SSs, the second for controlling transmission. The transmission
windows in the next polling cycle for each SS are computed using the requirements
evaluated, e.g. by measuring the buffer size of each traffic class.
In order to implement TDM behaviour in ns2 we implemented a variant of existing DropTail scheme in the system. It is called “BlocQ” which a user can control
so as to command a queue not to send packets when it is blocked. It provides the
behaviour of “block” and “unblock” in order to introduce dynamic allocation behaviour without any impact on ns2 functioning in general. The proposed solution is
to have “BlocQ” as per its functions described in the lines above. The general view
is “Queue/BlocQ”. To use it in a program we just need to declare a link as “BlocQ”.
In fact, the code had to be adapted to ns2 in order to have a clean functioning of
allocation policy. Steps needed to implement “BlocQ” functions are as:
r
r
r
r
We keep the “virtual” option that was introduced in “queue.h” file i.e. we convert
“void resume()” to “virtual void resume()”.
We change all “DropTail” by “BlocQ” (changing class names) in “droptail.cc”
and “droptail.h”.
We make the changes introduced in “droptail.h” but the new file is reffered to
“blocq.h”.
We need to add the following lines in “nsdefault.tcl” file found in “/HomeDir/ns2.28/tcl/lib/” directory so that default values for BlocQ are set and it is
known to ns “environment”. Note that first line is a comment and all other values
are exactly the same as used for “Queue/DropTail” option.
# BlocQ
Queue/BlocQ
Queue/BlocQ
Queue/BlocQ
Queue/BlocQ
set
set
set
set
drop_front_ false
summarystats_ false
queue_in_bytes_ false
mean_pktsize_ 500
10
r
r
Multiservice Classes and Hybrid Architecture
233
We also need to add “blocq.o” option in “Makefile” found under “/HomeDir/ns2.28” directory. It is done by adding “queue/blocq.o” in a place where
other entries like “queue/droptail.o” are found.
Once these chages are made, first do “make clean” inside “/HomeDir/ns2.28/”
directory followed by “make depend” and “make” in the end. If there is no compilation error that means you are ready to use it. In case of error please check if
there are any class hierarchy changes in your version of ns compared to ns2.28
(actually used for this process) or simple compilation problems.
References
1. Part 16: Air Interface for Fixed Broadband Wireless Access Systems, IEEE Std. 802.16, 2004.
2. Part 11: Wireless LAN Medium Access Control (MAC) and Physical layer (PHY) specifications, IEEE Standard, 1999.
3. R. Branden, D. Clark, and S. Shenker, “Integrated Services in the Internet Architecture: an
Overview,” RFC 1633, Jun 1994.
4. S. Blake, D. Black, M. Carlson, E. Davies, Z. Wang, and W. Weiss, “An Architecture for
Differentiated Services,” RFC 2475, Dec 1998.
5. S. Bajaj, L. Breslau, and S. Shenker, “Is Service Priority Usefeul in Networks?” in ACM
SIGMETRICS 98, 1998, pp. 66–77.
6. K. Gakhar, M. Achir, and A. Gravey, “Dynamic Resource Reservation in IEEE 802.16 Broadband Wireless Networks,” in Fourteeth IEEE International Workshop on Quality of Service
(IWQoS 2006), Jun 2006, pp. 140–148.
7. Y. H. Zang, D. Makrakis, S. Primak, and Y. B. Huang, “Dynamic Support of Service Differentiation in Wireless Networks,” in Proceedings of the 2002 IEEE Canadian Conference on
Electrical and Computer Engineering, 2002, pp. 1325–1330.
8. S. I. Maniatis, E. G. Nikolouzou, and I. S. Venieris, “QoS Issues in the Converged 3G Wireless
and Wired Networks,” IEEE Communications Magazine, pp. 44–53, Aug 2002.
9. M. Yuksel, K. K. Ramakrishnan, S. Kalyanarama, J. D. Houle, and R. sadhvani, “Value of
Supporting Class-of-Service in IP Backbones,” in Fifteenth IEEE International Workshop on
Quality of Service (IWQoS 2007), Jun 2007.
10. T. Nandagopal, T. E. Kim, P. Sinha, and V. Bharghavan, “Service Differentiation
Through End-to-End Rate Control in Low Bandwidth Wireless Packet Networks,” in
IEEE International Workshop on Mobile Multimedia Communications (MoMuC), 1999,
pp. 211–220.
11. D.-H. Cho, J.-H. Song, M.-S. Kim, and K.-J. Han, “Performance Analysis of the IEEE
802.16 Wireless Metropolitan Area Network,” in First International Conference on Distributed Frameworks for Multimedia Applications, 2005.
12. O. Gusak, N. Oliver, and K. Sohraby, “Performance Evaluation of the 802.16 Medium Access Control Layer,” Lecture Notes in Computer Science – Proceedings of ISCIS, vol. 3280,
pp. 228–237, 2004.
13. M. Ogawa, T. Sueoka, and T. Hattori, “Dynamic Queuing and Bandwidth Allocation for
Controlling Delay Time for QoS in CDMA Packet System,” in 12th IEEE International
Symposium on Personal, Indoor and Mobile Radio Communications, vol. 2, Sep–Oct 2001,
pp. 38–42.
14. A. Veres, A. T. Campbell, M. Barry, and L.-H. Sun, “Supporting Service Differentiation in
Wireless Packet Networks Using Distributed Control,” IEEE Journal on Selected Areas in
Communications, vol. 19, no. 10, pp. 2081–2093, Oct 2001.
15. N. Christin and J. Liebeherr, “A QoS Architecture for Quantitative Service Differentiation,”
IEEE Communications Magazine, pp. 38–45, Jun 2003.
234
K. Gakhar et al.
16. C. Cicconetti, A. Erta, L. Lenzini, and E. Mingozzi, “Performance Evaluation of the IEEE
802.16 MAC for QoS Support,” IEEE Transactions on Mobile Computing, vol. 6, no. 1,
pp. 26–38, 2007.
17. R. Mukul, P. Singh, D. Jayaram, D. Das, N. Sreenivasulu, K. Vinay, and A. Ramamoorthy,
“An Adaptive Bandwidth Request Mechanism for QoS Enhancement in WiMax Real Time
Communication,” in IFIP International Conference on Wireless and Optical Communications
Networks, 2006.
18. E. Altman and T. Jiménez, NS simulator for beginners, Universidad de Los Andes, Mrida,
2003.
19. K. Fall and K. Varadhan, The ns Manual, Aug 2006.
20. K. Gakhar, M. Achir, and A. Gravey, “How many traffic classes do we need in WiMax?” in
IEEE Wireless Communications and Networking Conference, Mar 2007.
21. H. Wang, W. Li, and D. P. Agrawal, “Dynamic Admission Control and QoS for 802.16 Wireless MAN,” in Wireless Telecommunications Symposium, 2005, pp. 60–66.
22. C. W. Leong, W. Zhuang, Y. Cheng, and L. Wang, “Call Admission control for Integrated
On/Off Voice and Best Effort Data Services in Mobile Cellular Communications,” IEEE
Transactions on Communications, vol. 52, pp. 778–790, May 2004.
23. B. Rong, Y. Qian, and H.-H. Chen, “Adaptive Power Allocation and Call Admission Control
in Multiservice WiMax Access Networks,” IEEE Wireless Communication, pp. 14–19, Feb
2007.
24. J. Hou, J. Yang, and S. Papavassiliou, “Integration of Pricing with Call Admission Control to
meet QoS requirements in Cellular Networks,” IEEE Transactions on Parallel and Distributed
Systems, vol. 13, pp. 898–910, Sept 2002.
25. D. Niyato and E. Hossain, “Call Admission Control for QoS Provisioning in 4G Wireless
Networks: Issues and Approaches,” IEEE Network, vol. 19, no. 5, pp. 5–11, 2005.
26. S. Shen, C.-J. Chang, C. Y. Huang, and Q. Bi, “Intelligent Call Admission Control for Wideband CDMA Cellular Systems,” IEEE Transactions on Wireless Communications, vol. 3,
pp. 1810–1821, Sept 2004.
27. J. Chen, W. Jiao, and H. Wang, “A Service Flow Management Strategy for IEEE 802.16
Broadband Wireless Access Systems in TDD mode,” in IEEE International Conference on
Communications, vol. 5, pp. 3422–3426, May 2005.
28. Y. Qian, R. Q. Hu, and C. Rosenberg, “Integrated Connection Admission Control and Bandwidth on Demand Algorithm for a Broadband Satellite Network with Heterogeneous Traffic,”
IEICE Transactions on Communications, vol. E-89B, no. 3, March 2006.
29. L. Huang and C. C. J. Kuo, “Dynamic Call Admisson Control with Joint Connection-level
and Packet-level QoS Support in Wireless Multimedia Networks,” in IEEE Symposium on
Real-Time and Embedded Technologies and Applications, May 2004.
30. R. L. Cruz, “A Calculus for Network Delay, Part 1: Network Elements in Isolation,” IEEE
Transactions on Information Theory, vol. 37, no. 1, pp. 114–131, Jan 1991.
31. ——, “A Calculus for Network Delay, Part 2: Network Analysis,” IEEE Transactions on Information Theory, vol. 37, no. 1, pp. 132–141, Jan 1991.
32. G. Urvoy, Y. Dallery, and G. Hébuterne, “CAC procedure for Leaky Bucket-Constrained
Sources,” Performance Evaluation, vol. 41, no. 2–3, pp. 117–132, Jul 2000.
33. L. Lenzini, L. Martorini, E. Mingozzi, and G. Stea, “A Novel Approach to Scalable CAC for
Real-time Traffic in Sink-Tree Networks with Aggregate Scheduling,” in Valuetools’06, Oct.
34. K. Wongthavarawat and A. Ganz, “Packet Scheduling for QoS support in IEEE 802.16 Broadband Wireless Access Systems,” International Journal of Communication Systems, vol. 16,
no. 1, pp. 81–96, 2003.
35. D. Kouis, P. Demestichas, V. Stavroulaki, G. Koundourakis, N. Koutsouris, L. Papadopoulou,
and N. Mitrou, “System for enhanced network management jointly exploiting WLANs and
other wireless network infrastructures,” in IEE Proceedings Communications, vol. 151, no. 5,
pp. 514–520, Oct 2004.
36. Q. N. Vuong, L. Fiat, and N. Agoulmine, “An Architecture for UMTS-WiMax Interworking,”
in The 1st International Workshop on Broadband Convergence Networks (BcN 2006), 2006.
10
Multiservice Classes and Hybrid Architecture
235
37. C. Liu and C. Zhou, “An Improved Interworking Architecture for UMTS - WLAN Tight
Coupling,” in IEEE WCNC, pp. 1690–1695, Mar 2005.
38. D. Kim and A. Ganz, “Architecture for 3G and 802.16 Wireless Networks Integration with
QoS Support,” in Proceeding of 2nd Internatioanl Conference on Quality of Service in Heterogenous Wired/Wireless Networks (QShine’05), Aug 2005.
39. J. Nie, X. He, Z. Zhou, and C. Zhao, “Communication with Bandwidth Optimization in IEEE
802.16 and IEEE 802.11 Hybrid Networks,” in Proceedings of ISCIT 2005, pp. 26–29.
40. IEEE Standard for Local and metropolitan area networks–Part 16: Air Interface for Fixed
Broadband Wireless Access Systems–Amendment 2: Medium Access Control Modifications
and Additional Physical Layer Specifications for 2-11 GHz, IEEE Std. 802.16a, 2003.
41. H. Shetiya and V. Sharma, “Algorithms for Routing and Centralized Scheduling to Provide
QoS in IEEE 802.16 Mesh Networks,” in ACM Workhop on Wireless Multimedia Networking
and Performance Modeling, pp. 140–149, Oct 2005.
42. M. Cao, W. Ma, Q. Zhang, X. Wang, and W. Zhu, “Modelling and Performance Analysis of
the Distributed Scheduler in IEEE 802.16 mesh Mode,” in MobiHoc 05, pp. 78–89, May 2005.
43. “STRIKE : HIPERMAN/HIPERLAN/2 Interworking Methods,” Deliverable D3.1.1, Information Society Technologies, Jun 2003.
44. Part3: Media Access Control (MAC) Bridges, ANSI/IEEE Std. 802.1D-1998, 1998.
45. K. Gakhar, A. Gravey, and A. Leroy, “IROISE: A New QoS Architecture for IEEE 802.16 and
IEEE 802.11e Interworking,” in 2nd IEEE/Create-Net International Workshop on Deployment
Models and First/Last Mile Networking Technologies for Braodband Community Networks
BroadNETS 05, Oct 2005.
46. Part 11: Wireless LAN Medium Access Control (MAC) and Physical layer (PHY) specifications: Amendement 7: Medium Access Control (MAC) Quality of Service (QoS) Enhancements, IEEE Standard, Rev. D13.0, 2005.
Chapter 11
Energy-Efficient Multimedia Delivery
in WMAN Using User Cooperation Diversity
Ki-Dong Lee, Byung K. Yi and Victor C.M. Leung
Abstract Most previous work on cooperative cellular networks has considered homogeneous relaying architectures where all nodes act as both sources and relays or
considered heterogeneous relaying architecture where relays are fixed. In this paper, we examine the power consumption performance of heterogeneous cooperative
cellular networks with two classes of nodes: source nodes that do not act as relays,
and relay nodes that are dedicated to relaying functions with little concern about
power consumption. In this architecture, source nodes are able to reap the benefits
of cooperative communication, such as improvements in the achievable data rate
and reductions in the transmit power, while reducing the overall power consumption
since they do not act as a relay. We consider geometry of a cell. Then we consider
random locations of the source node and relay node, respectively, to analyze the
average power consumption over the region of interest under the assumption that
the source node and relay node are distributed uniformly over the cell region.
Keywords Cooperative diversity · Energy efficiency · Multihop cellular network ·
Wireless MAN
11.1 Introduction
It is very common that the complexity in wireless networks is increasing as the
source nodes (SN’s; or subscriber stations, SS’s) become increasingly smaller in
size and numerous in number. However, the large number of nodes will enable such
networks to benefit from space diversity, or multiantenna diversity. The advantages
of multiple-input multipleoutput (MIMO) systems have been intensively studied
recently. In wireless metropolitan area networks (WMANs), a typical example of
user node is a laptop computer where MIMO can be implemented. However, in the
case of palm computers which has better portability because of the small size, even
K.-D. Lee (B)
LG Electronics Mobile Research, San Diego, CA 92131, USA
e-mail: kdlee@ieee.org
M. Ma (ed.), Current Technology Developments of WiMax Systems,
C Springer Science+Business Media B.V. 2009
DOI 10.1007/978-1-4020-9300-5 11,
237
238
K.-D. Lee et al.
though space diversity is known advantageous, it may not be feasible [1, 2] to take
good advantage of the known MIMO benefits. To overcome this problem and to
reap some of the benefits introduced by MIMO systems, the concept of cooperative
communications has been introduced and several cooperative diversity techniques
have been studied [1–4].
The benefits of cooperative communications result from cooperative diversity
[3], which can be achieved by relaying, i.e., the diversity at the receiver side: one
from the source node (SS) and the other from the relay node (or relay station, RS).
Although both cooperative communication networks and multihop networks employ
data relaying by network nodes, the former are distinguished from the latter through
the use of cooperative diversity realized from multiple virtual links established in
the process of relaying.
The Gaussian relay channel was introduced by van der Meulen [5] and intensively analyzed by Cover and El Gamal [6], where the achievable rates for three
coding schemes were evaluated. This work have been extended to the case of multiple relays by Schein and Gallager [4] who considered two parallel relays between
source and destination, and Gupta and Kumar [7] who considered multi-level relays.
Cooperative diversity in cellular systems was introduced by Sendonaris et al. in [1]
and [2]. In the papers, the authors implemented a two-user cooperative CDMA cellular system, where both users (or SS’s) are active at the same time and use orthogonal
codes to avoid multiple access interference. Also, for ad hoc networks, Laneman et
al. proposed various cooperative diversity protocols and analyzed their performance
in terms of outage probability [3].
It is commonly considered that a SS needs to be small in size (e.g., it is preferred
to have as small a handset as possible). However, it is not necessary that RS’s should
be small in size. As mentioned above, this is because we may have different kinds of
RS’s such as dedicated devices that have little concern about power consumption.
Such RS’s can be installed in vehicles, as mobile relays, or on top of buildings,
as fixed relays. Assuming that RS’s are available in a cellular network, the SS’s
can potentially save a lot of power because they can take advantage of cooperative
diversity offered by RS’s to reduce their own transmit power, and they need not act
as relays. This heterogeneous cooperative cellular architecture is not only useful to
improve the average achievable rate and reduce power consumption at SS’s, but the
reduction of SS power emission may also offer benefits in allaying health concerns
with regard to electromagnetic radiations, and reducing probability of interception
of signals by unintended receivers. Figure 11.1 presents the proposed cooperative
cellular network architecture with the two types of nodes mentioned above. Based
on this network architecture, we consider a general case where the cooperation
chance depends on the situation that there is a candidate RS around the SS. Thus,
we take probabilistic approach to evaluate the power consumption in this situation.
The objective of this paper is to evaluate the performance of a cooperative diversity technique in a Wireless MAN environment [8] with mobile cooperative relays,
focusing on the average achievable rate and power consumption. When a SS is connected to the base station (BS) through one RS, the BS may receive the signals from
both the cooperating RS and the SS, resulting in a performance gain via cooperative
11
Energy-Efficient Multimedia Delivery
239
RS
BS
(D)
SS
(S)
cell
Fig. 11.1 Illustration for the cooperative network architecture. Source node (SS) has a typical
concern about power consumption whereas relay node (RS) has very little concerns. We consider
a series of time-frames each of which consists of the 1st timeslot, where SS transmits and RS and
BS receive separately, and the 2nd timeslot, where RS transmits (relays) and BS receives: then, BS
can combine those two signals to get diversity
diversity. In most previous studies, the characteristics of nodes are assumed identical, or homogeneous, and it is considered that nodes act as both sources and relays;
or when the relays and source nodes are heterogeneous, relays are usually assumed
to be immobile. However, in practice, different kinds of nodes with diverse mobility
characteristics, battery lifetime, and so on, may exist in the network. For example,
a portable handset has a relatively short battery lifetime whereas a radio transceiver
onboard a vehicle has a much longer battery lifetime and vehicles are moving around
the service coverage area.
We investigate how much power can be saved through the use of cooperative
diversity when both SS’s and RS’s are mobile and, then, they are randomly located
over the cell region. Also, we study how the population density of RS’s affect the
power saving performance.
11.2 The Relaying Mechanism
11.2.1 The Model
We consider a two-hop cellular network, such as point-to-multipoint (PMP) mode
[8], employing orthogonal frequency division multiple access (OFDMA) over the
air interface. OFDMA is one of the most promising transmission technologies that
are gaining popularity in wireless networks [9]. In each cell, we consider uplink
transmissions from the SS’s to the BS via RS’s acting as relays if available. In
cooperative networks, it is usually assumed that SS’s and RS’s have full channel
state information (CSI) so that SS’s and RS’s can be synchronized [10]. We consider
the decode-and-forward scheme. Figure 11.2 depicts an example of frame structure
through which the BS can reap the benefit of the cooperative diversity. As already
used in IEEE 802.16j [13], a two zone frame structure is considered. During the
first zone called access zone the SS transmits and the RS and BS receives. During
the second zone called relay zone the RS relays what it has received during the first
zone. Then the BS can combine both signals.
240
K.-D. Lee et al.
R
S
1st
2nd
Frame
Time
Fig. 11.2 An example of frame structure for a cooperative relaying mechanism. The SS transmits
on the 1st timeslot (during access zone) whereas the RS relays the overheard signal from the SS,
to the BS on the 2nd timeslot (during relay zone). The BS may combine the two signals
11.2.2 Description of the Relaying Mechanism
Figures 11.1 and 11.4 illustrate the relaying mechanism for the aforementioned
relaying architecture with two heterogeneous classes of nodes. Consider a user
(SS) as shown in Fig. 11.4 where the transmission range of this SS is shown.
If there exists at least one RS in the transmission range, the SS may ask the
RS for relaying. We consider a series of time frames each of which consists of
two timeslots: in the first timeslot, SS transmits its data whereas RS and BS receive it; in the second timeslot, RS relays SS’s data to BS. In this case, the BS
needs to receive signals from both the SS and the RS to achieve cooperative
diversity.
The procedure of the relaying mechanism is detailed in Fig. 11.3. If a SS needs
a new action, such as handover or new call setup requests, then the SS checks both
the pilot signal(s) coming from the associated BS(s) and the pilot signals including
channel gain information coming from RS’s. BS’s periodically broadcast the pilot
signal so that SS’s and RS’s can estimate the channel gains. After estimating the
channel gain, RS’s broadcast the pilot signal with the channel gain information so
that SS’s can estimate the channel gain. Each SS takes advantage of the information
to make decisions required in the relaying architecture.
If the distance between a SS and its best BS is small enough, then the SS may be
connected to the BS directly without any relaying. The cell region excluding such a
region is called candidate region in this paper.
The SS selects the best BS and best RS (selection is completed by handshaking).
If RS’s are unavailable (i.e., relay = 0), the SS sends capacity request (CR) to the
BS directly. Otherwise, the SS checks if one RS is available (i.e., relay = 1), the SS
sends CR to the BS.
Once the BS received the CR, the BS checks if the required capacity is available
according to the admission control policy it uses. If there is no capacity available
for the SS that has originated the CR, then the BS rejects the request. Otherwise, the
SS is allocated a certain amount of capacity and starts transmitting information in
accordance with the relay mode. Before transmitting information, the SS determines
the transmission power level.
11
Energy-Efficient Multimedia Delivery
241
SS
(user)
RS
BS
pilot (periodic)
broadcast
estimate channel gain
b/w BS and user
estimate channel gain
b/w BS and RS
pilot + gain info (periodic)
broadcast
estimate channel gain
b/w RS and user
select best BS; select one RS
in transmission region
transmission
via this rs better
than direct
transmission
N
relay = 0
relay = 1
send “relay”
relay > 0?
N capacity request
Cooperation handshaking
ACK
capacity request
(rejected)
end
relay > 0?
(accepted)
N
capacity
available?
capacity allocation
N
power mode=NORMAL
traffic
power mode=SAVING
traffic
broadcast
traffic
multiple access
Fig. 11.3 The flow of relaying mechanism
242
K.-D. Lee et al.
11.2.3 Transmission Power Modes of SS
The transmission power of an SS (or mobile SS, MSS) needs to be continuously
adjusted according to channel conditions. However, the transmission power of a SS
in the relaying mechanism is roughly divided into two modes: NORMAL mode and
SAVING mode. In the event of relaying, the SS needs not transmit information at
the normal power level (NORMAL mode). This is because cooperative diversity can
be achieved. In this case, the SS may reduce its power level as far as its signal may
reach both RS and BS (SAVING mode) given that the transmit power of RS, say p2 ,
is less than or equal to a given threshold.
11.3 Evaluation of the Average Achievable Rate and Average
Power Consumption
We have the following notation in the evaluation.
r
r
r
r
r
r
r
r
R: radius of a circular cell
L: radius of a transport range of an SS (relaying case)
α: path-loss exponent
p: transmit power of an SS (mW)
σ 2 : thermal noise power (mW)
BER: desired bit-error rate
δ: population density of RS (or relaying SS) (RSs/m2 )
f p : fraction of the average power consumption through the use of relay relative
to the average power consumption without using it
11.3.1 The Average Power Consumption for Transmission
Consider a SS located at (a, θ ), 0 ≤ θ < 2π (see Fig. 11.4). Suppose that the
relaying mechanism is not used (single relaying or no relaying), then the average
power consumed to achieve the transmission rate of x per subcarrier is given by
P0 (a) =
2x/W − 1
κ · G(a)
and, by unconditioning with respect to a, the average power per subcarrier of an
arbitrary SS without using the relaying mechanism is given by
R
P0 =
0
P0 (a) · d
a2
R2
.
Following a similar procedure as in the previous section for rate analysis, we
consider an RA whose relative location with respect to the location of the SS is
11
Energy-Efficient Multimedia Delivery
Fig. 11.4 The evaluation
model. O(0, 0), U (a, 0),
∠O M1 U = ∠O M2 U = π/2,
L ≡ M1 U .
∠M1 U O = cos−1 La .
θ1 ≡ ∠ M 3 U M 1 ,
θ2 ≡ ∠M3 U M2
243
transmission range
(related to relaying)
transmission
range (nominal)
R
M1
d
R0
r
x
O
a
L
U
(r, θ ). The required transmission power is given by
P(r, θ ; a) = inf p1 : 0.5 · min{log2 (1 + κ p1 G(r )),
log2 (1 + κ p1 G(r ) + κ p2 G(d))} = x, p2 ≤ p M
√
where d ≡ d(r, θ ; a) = a 2 + r 2 + 2ar cos θ and p M is a given threshold.
From this, the average transmission power of a SS in the case of using the relaying mechanism (parallel dual agent relaying) is given by
L
P1 (a) =
θ2
θ1
0
P(r, θ : a) ·
r
dθ dr
Ae (a)
When the relaying mechanism is used, the average transmission power of a SS
located at (a, θ ), 0 ≤ θ < 2π is given by
P(a) = P0 (a) · φ0 + P1 (a) · (1 − φ0 ).
By unconditioning with respect to a over the candidate region, we can obtain the
average power per subcarrier of a SS residing in the candidate region as
R
P=
P(a) · d
R0
a2
R 2 − R02
and that of a SS in the inner co-center circle is given by
P1 =
0
R0
P0 (a) · d
a2
R02
244
K.-D. Lee et al.
Finally, the average power per subcarrier of an arbitrary SS is given by
P = P · 1−
R02
R2
+ P1 ·
R02
.
R2
The (relative) improvement in the average power consumption per subcarrier is
obtained by
fp =
P0
P
,
where f p is greater than unity if the relaying mechanism saves the power
consumption.
11.3.2 Experimental Results
We consider the OFDMA-based PMP mode system with infrastructure [8], where
there are 128 subcarriers over the 3.2-MHz band. Each transmitter is synchronized
with respect to the receiver’s clock reference to make the tones orthogonal. The
transmission power of a SS per subcarrier is p = 50 mW, the thermal noise power
is σ 2 = 10−11 W, and the desired BER is 10−2 . The path loss exponent α is three.
Figure 11.5 presents the probability that a randomly chosen SS has no relays
around itself. Here, we can observe how small the probability is in normal urban
environments: 0.0015 RAs/m 2 in San Diego, 0.00037 RAs/m 2 in Montreal.
Under the condition that the power consumption amounts are the same, we compare two different cases for achievable rate. For the purpose of relative comparison,
we define f c as the fraction of the achievable rate by the relay mechanism, relative
to the achievable rate without relaying. In Fig. 11.6, the average achievable rates
1
pr{no RS available}, φ0
R = 500m
L = 100m
Fig. 11.5 The probability
that a SS cannot find any
relay around it vs. the density
of relay population (RAs/m 2 )
0.1
0.01
1E–3
1E–4
1E–5
1E–6
1E–5
1E–4
1E–3
population density (RAs/m 2)
0.01
Energy-Efficient Multimedia Delivery
245
2.5
200
180
2.0
160
1.5
140
120
100
1.0
w/o relay
w/ relay
increase in rate (%)
increase in rate, fc
Fig. 11.6 The average
achievable rate of a user per
subcarrier vs. p (3.2-MHz
band with 128 subcarriers,
σ 2 = 10−11 W, BER = 10−2 ,
R = 500 m, L = 50 m,
α = 3, δ = 0 : 01)
average rate (Kbps)
11
0.5
80
60
1E–6
1E–5
1E–4
1E–3
0.0
0.01
bit error rate, BER
per subcarrier versus transmission power are shown. It is observed that the average achievable rates of both mechanisms are increasing with a decreasing speed of
increase, i.e., concave increasing, with respect to power increase. For small transmission power levels, even though the amount of rate increase is small, the relative
increase f c is very large. As the transmission power increases, the relative increase
f c decreases, slowly approaching 200%. Figure 11.7 shows the power consumptions versus the desired BER. A steady improvement in power consumption for the
test values of BER is observed. A remarkable reduction in power is observed. The
relative improvement in power f p is approximately 518 (51800%).
Figure 11.8 shows the average achievable rates per subcarrier for both mechanisms versus the desired bit-error rate (BER). Theoretically, the average achievable
rate increases if the desired BER increases and this phenomenon is observed in the
figure. In addition, it is observed that the relative increase f c is very large when
the desired BER is small. As the desired BER increases, the relative increase f c
500
average power (mW)
Fig. 11.7 The average power
consumption of a user per
subcarrier vs. BER (3.2-MHz
band with 128 subcarriers,
σ 2 = 10−11 W, BER = 10−2 ,
R = 500 m, L = 50 m,
α = 3, δ = 0 : 01)
400
10
w/o relay
w/ relay
saving in power, fp
300
200
1
100
0.1
1E–6
1E–5
1E–4
bit-error rate, BER
1E–3
0
0.01
saving in power consumption, fp
100
246
300
2.5
average rate (Kbps)
250
2.0
w/o relay
w/ relay
increase in rate (%)
200
1.5
150
1.0
100
increase in rate, fc
Fig. 11.8 The average
achievable rate of a user per
subcarrier vs. BER (3.2-MHz
band with 128 subcarriers,
σ 2 = 10−11 W, BER = 10−2 ,
R = 500 m, L = 50 m,
α = 3, δ = 0 : 01)
K.-D. Lee et al.
0.5
50
0.0
0
1E–3
0.01
0.1
transmission power, p (mW)
decreases with a decreasing rate, i.e., convex decreasing, slowly approaching 217%.
This demonstrates that the relaying mechanism is much more useful for such traffic
that requires a low BER. Figure 11.9 shows the power consumptions versus required
rates. The required power is increasing with respect to the required transmission
rate. However, the relative improvement in power by using the relaying mechanism
f p is steady around 518. This demonstrates that the relaying mechanism can reduce
a lot of amount in power in the case of transmitting traffic at a high rate.
In Fig. 11.10, the effect of the density of RS’s in the cell site on the average
achievable rates per subcarrier is shown. We test the effect with RS densities ranging
from 0.0001 to 0.01 (RAs/m 2 ). The density of 0.01 is chosen for representing the
situation of population density in urban area (For example, the population density
in New York City is approximately 0.01/m 2 ). Under the assumption that everyone
has an auto that can act as a relaying agent, this value represents densely populated
situations. On the other hand, the value 0.0001 (RAs/m 2 ) is used for representing
the rural population situation. In the figure, it is observed that the average rate of
500
w/o relay
w/ relay
saving in power, fp
1E8
400
300
10000
200
1
100
1E–4
1
10
100
required rate (Kbps)
0
1000
saving in power consumption, fp
Fig. 11.9 The average power
consumption of a user per
subcarrier vs. required rate
(3.2-MHz band with 128
subcarriers, σ 2 = 10−11 W,
BER = 10−2 , R = 500 m,
L = 50 m, α = 3, δ = 0 : 01)
average power (mW)
1E12
Energy-Efficient Multimedia Delivery
247
2.0
200
w/o relay
w/ relay
increase in rate (%)
1.5
150
1.0
fraction = 1.0 (no increase)
increase in rate, fc
Fig. 11.10 The average
achievable rate of a user per
subcarrier vs. δ (3.2-MHz
band with 128 subcarriers,
σ 2 = 10−11 W, BER = 10−2 ,
R = 500 m, L = 50 m,
α = 3)
average rate (Kbps)
11
0.5
100
0.0
1E–4
1E–3
0.01
0.1
density of relaying agent, δ (RAs /m 2)
the relaying mechanism steeply increases as the density of RS’s increases and satiates around 0.002. Also, for population densities 0.00017/m 2 , 0.00032/m 2 , and
0.01000/m 2 , the relative increase f c is 115%, 135%, and 217%, respectively. This
demonstrates that the relaying mechanism is much more useful for most cases of
population density. Even though the subscription ratio is considered, we believe
that the performance has practical meaning for financial and/or shopping districts,
where the density is much higher than any other area. Figure 11.11 shows the power
consumptions versus the density of RS’s in cell. It is observed that the relative improvement in power f p is rapidly increasing until δ approaches 0.004. According
to the results, the relative improvement in power in a site of population density
0.00037/m 2 , such as in Montreal, is 140% whereas that of density 0.01/m 2 , such as
in New York City, is 500. These results demonstrate that the relaying mechanism
can provide a remarkable power saving effect in urban areas.
1000
100
average power (mW)
Fig. 11.11 The average
power consumption of a user
per subcarrier vs. δ (3.2-MHz
band with 128 subcarriers,
σ 2 = 10−11 W, BER = 10−2 ,
R = 500 m, L = 50 m,
α = 3)
100
60
w/o relay
w/ relay
saving in power, fp
40
10
20
0
1E–4
1
1E–3
0.01
density of relaying agents, δ (RAs/m2)
0.1
saving in power consumption, fp
80
248
K.-D. Lee et al.
11.4 Conclusions
In this paper, we have examined the average achievable rate and the average power
consumption in a cooperative diversity based wireless metropolitan area networks
with two classes of nodes. Unlike previously proposed architecture employing homogeneous nodes that function as both sources and relays, we propose a functional
differentiation between source and relay nodes so that source nodes may save power
while relay nodes have little concern about power consumption. In addition to the
benefits of cooperative communication, such as increasing the achievable rate and
transmit power reductions, SS’s can achieve substantially greater power savings by
not performing relay functions. The heterogeneous cooperative cellular network architecture proposed in this paper is both feasible and practical. According to analysis
results, the proposed architecture achieves a good amount of increase in the average
rate and a huge amount of reduction in the average power consumption, compared
to the situation where no RS’s are available between each SS and the BS.
References
1. A. Sendonaris, E. Erkip, and B. Aazhang, “User cooperation diversity Part I: System description,” IEEE Trans. Commun., vol. 51, no. 11, pp. 1927–1938, Nov. 2003.
2. A. Sendonaris, E. Erkip, and B. Aazhang, “User cooperation diversity Part II: Implementation
aspects and performance analysis,” IEEE Trans. Commun., vol. 51, no. 11, pp. 1939–1948,
Nov. 2003.
3. J.N. Laneman, D. Tse, and G.W. Wornell, “Cooperative diversity in wireless networks: Efficient protocols and outage behaviour,” IEEE Trans. Info. Theory, vol. 50, no. 12, pp. 3062–
3080, Dec. 2004.
4. B. Schein, and R. Gallager, “The Gaussian parallel relay network,” in IEEE ISIT, June 2000,
p. 22.
5. E.C. van der Meulen, “Three-terminal communication channels,” Adv. Appl. Prob., vol. 3, pp.
120–154, 1971.
6. T. Cover, and A. El Gamal, “Capacity theorem for relay channel,” IEEE Trans. Info. Theory,
vol. 25, no. 5, pp. 572–584, Sep. 1979.
7. P. Gupta, and P.R. Kumar, “Towards an information theory of large networks: an achievable
rate region,” IEEE Trans. Info. Theory, vol. 49, no. 8, pp. 1877–1894, Aug. 2003.
8. IEEE Standard for Local and Metropolitan Area Networks – Part 16: Air Interface for Fixed
and Mobile Broadband Wireless Access Systems, oct, 2004.
9. Z. Han, Z. Ji, and K.J.R. Liu, “Fair multiuser channel allocation for OFDMA networks using
Nash bargaining solutions and coalitions,” IEEE Trans. Commun., vol. 53, no. 8, pp. 1366–
1376, Aug. 2005.
10. A. Goldsmith, “Rate limits and cross-layer design in cooperative communications,” in WICAT
Workshop on Cooperative Communications, Polytechnic University, Brooklyn, New York,
Oct. 2005.
11. K.-D. Lee, Byung K. Yi, and V.C.M. Leung, “Power consumption evaluation in a wireless
MAN using cooperative diversity when both sources and relays are randomly located,” in
Proc. ACM QShine ’07, Vancouver, BC, Aug. 2007.
12. K.-D. Lee, and V.C.M. Leung, “Evaluations of achievable rate and power consumption in
cooperative cellular networks with two classes of nodes,” IEEE Tran. Veh. Technol., to appear,
2008.
11
Energy-Efficient Multimedia Delivery
249
13. IEEE P802.16j/D1 “Multihop Relay System,” Part 16: Air Interface for Fixed and Mobile
Broadband Wireless Access Systems, Aug. 2007.
14. IEEE C802.16m-07/080r3 Draft IEEE 802.16m Evaluation Methodology Document, Aug.
2007.
15. IEEE 802.16m-07 = 002r2, “Draft TGm Requirements Document,” IEEE 802.16m Task
Group Draft Document, June 11, 2007.
Chapter 12
Game Theory Modeling of Social Psychology
Principle for Reliable Multicast Services
in WiMax Networks
Markos P. Anastasopoulos, Athanasios V. Vasilakos and Panayotis G. Cottis
Abstract A major challenge in operation of WiMax network is to provide largescale reliable multicast and broadcast services. The main cause limiting the scalability of such networks is Feedback Implosion, a problem arising when a large
number of users transmit their feedback messages through the network, occupying
a significant portion of the system resources. Inspired from social psychology, and
more specifically from the phenomenon of bystander effect, a novel scheme for the
provisioning of large-scale reliable multicast services is proposed. The problem is
modeled using game theory. Through simulations of the proposed scheme carried
out to evaluate its performance, it is found that the novel approach suppresses feedback messages very effectively, while at the same time, it does not degrade the data
transfer timeliness.
Keywords Wi-Max Networks · Reliable multicast · Feedback suppression ·
Bystander effect · Game theory
12.1 Introduction
As the demand for high-speed ubiquitous Internet access is increasing at a rapid
pace, Broadband Wireless Access (BWA) networks are gaining increased popularity as an alternative to DSL last-mile technology with a constantly growing market potential [1]. WiMax [2], the industry consortium associated with the IEEE
802.16 family of standards, poses as an interesting addition to current broadband
options, such as DSL, cable and Wi-Fi (IEEE 802.11), offering both prospects of
rapid broadband access provisioning in areas with under-developed infrastructure
and a technology capable of competing for urban market share. Already, deployment of large-scale WiMax networks capable of providing broadband connectivity
M.P. Anastasopoulos (B)
Wireless & Satellite Communications Group, School of Electrical & Computer
Engineering National Technical University of Athens, Greece
M. Ma (ed.), Current Technology Developments of WiMax Systems,
C Springer Science+Business Media B.V. 2009
DOI 10.1007/978-1-4020-9300-5 12,
251
252
M.P. Anastasopoulos et al.
to millions of users in different parts of the world has initiated, making this technology a fast-rising wireless access solution with lucrative commercial prospects.
BWA networks, as described in the IEEE 802.16 standard [3], were initially
designed to operate on a Line of Sight (LOS) cellular basis providing backhaul
and high speed communication services to fixed subscribers in the 11-66GHz spectral range. Driven by the need to accommodate increasing numbers of users, the
non-LOS operation was mandated in the 802.16a/d which defined aspects of the
utilization of the 2-11GHz spectrum [4]. The IEEE 802.16e standard for Mobile
WiMax initiates a new era in BWA systems, as focus is shifted from fixed subscribers to subscribers moving in up to vehicular speeds [5]. Mobile WiMax, aiming
at providing bit rates up to 15 Mbps at 5MHz utilization and adopting state-of-theart technologies such as HARQ and MIMO, emerges as an exciting new technology with commercial prospects as a competitor of CDMA mobile networks (3G,
HSDPA).
Although WiMax networks offer significant advantages, they are also hampered
by restrictions imposed by the specific phenomena of the wireless channels. Radio
channels introduce high error rates, correlated losses and dynamically varying propagation conditions, all of which affect the performance of the wireless applications.
Radio resource management and system-specific protocol design are two critical
challenges to be met in the attempt to both satisfy the Quality of Service requirements for network agnostic applications and efficiently utilize the available network
bandwidth. In second generation BWA networks, it is assumed that propagation, in
the non LOS cell areas is dominated by shadowing effects [6], whereas the LOS
communication between Base Stations (BSs) and Subscribers (S) at frequencies
above 10GHz is primarily degraded by rain fading [6]. Mobile WiMax is expected
to be further affected by phenomena linked to user mobility such as multipath and
Doppler shift.
The current trend in modern wireless networks is the integration of communication applications over a common IP infrastructure. The investigation of performance issues concerning the TCP/IP protocol stack over wireless links that suffer
from propagation losses is a topic of great significance, in order to provide seamless
connectivity to the access network. In the case of large-scale multicast applications
over WiMax networks the main challenge arising, is QoS provisioning, in terms of
reliability, and efficient uplink spectrum utilization, taking into account accurately
the impact of propagation phenomena.
12.2 Providing Reliable Multicast Services
To provide reliable large-scale multicast services, the main problem to be solved
is feedback implosion [7], which is arisen whenever a large number of subscriber
terminals transmit feedback messages through the uplink channel. Those messages
increase linearly with the number of users and may lead to congestion of the
network.
12
Game Theory Modeling
253
Feedback suppression is a well studied problem and many approaches exist in
the literature. In general, solutions to the feedback implosion problem are classified
as structure-based or timer-based [7]. In the first classification, structure-based approaches rely on a designated site to process and filter feedback information. They
organize multicast group members into some structure in order to filter the amount
of feedbacks generated by the group. Timer-based solutions rely on probabilistic
feedback suppression to avoid implosion at the source. Receivers delay their retransmission requests for a random interval, uniformly, exponentially or beta distributed
between the current time and the one-way trip time to the source.
It is evident that the problem of feedback implosion could be confronted, if a limited number of users, on behalf of all multicast receivers, sent negative acknowledgments (NACKs). Hence, the question that is arisen, is how the feedback suppression
problem should be modeled in such a way so that, as the number of users increase,
their incentive for sending feedback messages, is reduced? An answer to this question may be found in social psychology and more specifically in the phenomenons
of bystander intervention and bystander effect [8].
In bystander intervention, psychologists found out that, solitary individuals will
typically intervene if another person needs help. However, in case where more people are present, help is less likely to be given. The latter, is known as bystander
effect or bystander apathy. In this phenomenon persons are less possible to intervene
in an emergency situation when others are present than when they are alone. Both
bystander intervention and bystander effect may be the solution for the problem of
providing large scale reliable multicast services.
In particular, in case where a limited number of users participate in the multicast
services, there is no need to their suppress feedback messages. Their impact in the
performance of the network is low, due to the fact that a small number of NACKs
do not demand high network resources, bandwidth and computational cost. On the
contrary, if the number of users is high, rather than being conscientious, it is preferable for a user to act with unscrupulousness, avoiding feedback sending. Due to the
fact that, even one feedback message can help all multicast users to recover from
losses, the contribution of apathetic users to the performance of network is much
more important in comparison with scrupulous who send NACKs instantly.
In this paper, game theory is employed to formulate the feedback suppression
problem. All users would like that the lost or corrupted packets to be retransmitted, but neither of them is willing to send a feedback message because this action
requires energy consumption. This factor becomes more important, especially in
case of mobile terminals, where energy issues are critical for the survivability of the
system. In the game under consideration, the optimal strategy is investigated.
In the current approach, the problem will be modeled using classical game theory,
which predicts that users will assign their strategy according to a Nash Equilibrium
(NE), i.e., in a way such no player has an incentive to change their routing strategy
unilaterally. Even though NE are interesting from a practical point of view as they
represent stable and fair allocations, however, the lack of a dynamic theory, imposes
classical game theory inappropriate for modeling real wireless networks that face
time dependent fading conditions and users mobility. To overcome those difficulties
254
M.P. Anastasopoulos et al.
the application of Evolutionary Game Theory [9], in the same problem is a subject
of future work.
The rest of the chapter is organized as follows. In Section III a brief description
of the preliminaries of game theory is presented, while in Section IV the problem
of feedback suppression is being modelleed employing game theory. Then description of the channel model employed along with the numerical results is provided in
Section 12.6.7. Finally, important conclusions are drawn in Section 12.7.
12.3 Preliminaries of Game Theory
Game theory is a branch of applied mathematics, which deals with multiperson
decision making situations. For example, when the only two electronic equipment
sellers choose prices for their products, aware that their sales are determined jointly,
they both participate in a game. Many applications of game theory are related to
economics, but it has been applied to numerous fields ranging from law enforcement and voting decisions in European Union to biology, psychology and recently
engineering.
In this paper, the analysis is restricted in games where players act individually
without exchanging information among them and contributes to the public good.
These games are called non-cooperative.
12.3.1 Definitions
The basic elements of a game are players, strategies and payoffs. Players are individuals who decide their movements. Based on the information that has arrived at
each moment they pick up actions in order to maximize their profit. An action, or
move by player i, denoted ai , is a choice he may make. The rule that tells him which
action to choose at each instant of the game is called strategy si , while the set of all
available strategies is called strategy profile Si = {si }. Hence, the Cartesian product,
S = ×i Si , sometimes called strategy space of the game [9], is the set of strategy
profiles of all players.
For any strategy profile s ∈ S, πi (s) denotes the associated payoff to player i.
The term payoff is referred to the expected utility that a player receives as a function
of the strategies chosen by himself and the other players. In economics the payoffs
are usually profits or consumers utility, while in biology payoffs usually represent
the expected number of surviving offspring. Often, in the literature a game is written
in normal form that may be summarized as a triplet G = (I, S, π ), where I is its
players set, S its strategy space, and π its payoff function.
12.3.2 Equilibrium and Dominant Strategies
A
concept in game theory is that of equilibrium. Equilibrium s ∗ =
∗very important
∗
s1 , . . . , sn is a strategy combination consisting of a best (optimum) strategy for
12
Game Theory Modeling
255
each of the N players in the game [10]. The equilibrium strategies are the strategies
players pick in trying to maximize their individual payoff. Discussing equilibrium
concepts it is useful to define a metric that describes the strategies that all the other
players use. If s = (s1 , . . . , s N ) is the strategy set of all players, then notation
s−i = (s1 , . . . si−1 , si+1 , . . . , s N ) denotes the combination of strategies for every
player except i. Vector s−i is of utmost importance because helps player i to choose
the best available strategy. Player i ’s best response or best reply to the strategies s−i ,
chosen by the other players, is the strategy si∗ that yields him the greatest payoff.
The strategy si∗ is a dominant strategy if it is a player’s strictly best response to
any strategies the other players might pick, in the sense that whatever strategies
they pick, his payoff is highest with si∗ . It deserves to be noted that, all his inferior
strategies are called dominated strategies. Finally, dominant strategy equilibrium is
a strategy combination consisting of each player’s dominant strategy.
Unfortunately, few games have dominant strategy equilibrium.Nevertheless, dominance can be useful even when it does not resolve things quite so neatly. In those
cases, the idea of iterated dominance equilibrium is used. Let us first define the
concept of weakly dominance. Strategy si is weakly dominated if there exists some
other strategy si for player i for which is possibly better and never worse, yielding a
higher payoff in some strategy profile and never yielding a lower payoff. An iterated
dominance equilibrium is a strategy combination found by deleting a weakly dominated strategy from the strategy set of one of the players, recalculating to find which
remaining strategies are weakly dominated, deleting one of them, and continuing
the process until one strategy remains for each player [10].
However, the majority of games lack even iterated dominance equilibrium. In
those cases, modelers use Nash Equilibrium (NE). NE is one of the cornerstones of
economic theory. In essence NE requires of a strategy profile s that not only should
each component strategy si be optimal under some belief on behalf of the ith player
about the others strategy, it should be optimal under the belief that s itself will be
played. In terms of best replies, a strategy profile s is a Nash Equilibrium if it is
best reply to itself [9]. When a game is in NE no player has incentive to change his
strategy given that the other players do not deviate.
Concluding, every dominant strategy is a NE, but not every NE is dominant strategy equilibrium. If a strategy is dominant, it is the best response to any strategies
the other players pick, including their equilibrium strategies. If a strategy is part of
a NE, it needs only to response to the other players equilibrium strategies.
12.3.3 Pure and Mixed Strategies
So far, the analysis has been limited in the case where the action set of the players is
finite. It is often useful and realistic to expand the strategy space to include random
strategies. Those random strategies are called mixed, while finite are called pure
strategies. In other words, a mixed strategy for player i is a probability distribution
over his set of pure strategies.
256
M.P. Anastasopoulos et al.
12.3.4 Existence of Equilibrium
The first basic feature of a game that favours existence of Nash Equilibrium is continuity of the payoffs in the strategies. A payoff is continuous if a small change in
a player’s strategy causes a small or zero change in the payoffs. The second feature
promoting existence is a closed and bounded strategy.
12.4 Feedback Suppression Game
The bystander effect in this Section, is being modelled by applying game theory.
As a typical example imagine an event where several people are eye-witness in
a crime. Each one would like someone to call the police and stop the illegal action, because having it stopped add x units to his payoff. Unfortunately, none of
them wants to make the call himself because the effort subtracts y units (x > y).
Strongly inspired from this, a new approach for the solution of feedback implosion is
presented.
12.4.1 Two Players Game
The problem of feedback suppression is modeled using game theory. The problem
belongs to the general category of contribution games [10]. This term is used in
the literature to describe games in which each player has a choice of taking some
action that contributes to the public good, but would prefer another player to take
the rap. In feedback suppression game, each player that has lost a packet would like
to send a feedback message asking for packet retransmissions, because replacing
the lost or corrupted packets helps him to satisfy the QoS constraints for data transmission. However, nobody wants to send the acknowledgment because this is an
energy consuming action. Table 12.1 shows the feedback suppression game between
player 1 and player 2 that have lost the same packet. If player 1 can be assured that
player 2 will send a feedback message, then there is no reason for him to send an
acknowledgment. In this circumstance, the payoff for player 1 is a, while for player
2 is a −d E, where dE denotes the energy squandering due to feedback transmission.
Table 12.1 The feedback suppression game
Player 1
Don’t send FBM(p)
Player 1
Send FBM (1-p)
Don’t send FBM(p)
0, 0
a, a − d E
Send FBM (1-p)
a − d E, a
a − d E, a − d E
12
Game Theory Modeling
257
The above game has two asymmetric pure strategy, (a − d E, a) (a, a − d E), and a
symmetric mixed-strategy equilibrium.
12.4.2 N-Players Game
Then, we are interested in solving the N-player version of the above game. Let p,
denote the probability for player i not to send a feedback message. In the problem
under consideration, if nobody sends a feedback message the payoff for player i is
0. In case he himself sends a message the payoff is a − d E, and, if at least one
of the other N-1 players send, the payoff is a. In accordance with the two players,
this game also has an asymmetric pure-strategy and a symmetric mixed-strategy
equilibrium. If all players use the same probability p, the probability that all players
except player i not to send feedbacks is p N −1 . Therefore, the probability at least
one to send a feedback message is 1 − p N −1 . Thus, equating players i pure strategy
payoffs using the payoff-equating method of equilibrium calculation yields
π playeri (send
f eedback)
= π playeri (not
send f eedback)
(12.1)
or equivalently
(a − d E) p N −1 + (a − d E) 1 − p N −1 = p N −1 · 0 + 1 − p N −1 · a
(12.2)
Thus yields,
p∗ =
dE
a
1/N −1
(12.3)
It is obvious that the probability, PF B , a user to send a feedback message is given by
PF B = 1 −
dE
a
1
N −1
(12.4)
From Eq. (12.4) it is obvious that if the number of users is low the probability
to send a feedback is high. In this occasion, multicast receivers react with conscientiousness according to the phenomenon of bystander intervention. However,
increasing N, PF B is reduced, and the users are gradually becoming unscrupulous,
hence, feedback suppression efficiency is increased. The above concept is clearly
illustrated in Figure 12.1.
258
M.P. Anastasopoulos et al.
Probability for feedback
transmission
PFB
1–dE/a
0
2
N(Number of Users)
Unscrupulousness
(Symptom of bystander
apathy)
Scrupulousness
(Symptom of bystander
intervention)
Fig. 12.1 Impact of users’ population in feedback message transmission probability
12.5 Syndrome of Genovese: The Need for Backup Mechanisms
Even though bystander effect may be effectively used for feedback suppression,
sometimes turns out to be insufficient. Its main weakness is that when the number
of multicast receivers is very high, the nodes are becoming so unscrupulous where
it is possible no-one to send a feedback.
This event took place in 1964 where Kitty Genovese was stabbed to death by
a mentally ill serial rapist and murderer. The murder took place over a period of
about thirty minutes, during which dozens of alleged “witnesses” failed to help
the victim. For this reason, the name Genovese syndrome or Genovese effect was
used to describe the phenomenon at the time. The death of Deletha Word in 1995
after witnesses failed to thwart her attackers, as well as the James Bulger murder
case, may have been other well-publicized cases of the effect. The probability the
syndrome of Genovese, PGen may be easily calculated by the following equation
PGen = (1 − PF B ) N =
dE
a
N
N −1
(12.5)
From the aforementioned it is deduced that bystander effect from its own accord
cannot ensure the reliability in data transfer. For this reason, backup mechanisms are
essential to be used. A simple implementation is that of a timer. Each user maintains
a timer and as long as the timer expires, in case he hasn’t received the lost packets,
sends a feedback message asking for retransmissions.
In this simple case, the expected number of feedback messages is given by,
E {Feedback Messages} = (PF B + PGen ) · N
12
Game Theory Modeling
259
or equivalently
E {Feedback Messages} = 1 −
dE
a
1
N −1
+
dE
a
N
N −1
·N
(12.6)
More sophisticated implementations for backup mechanisms may be found in
[7]. In these approaches the backup timers that are used are separated into two parts;
the first is a wait period and the second is a random interval. The waiting period
allows nodes to take their decisions about whether to send feedbacks or not. Besides
this, gives sufficient time to the retransmitted packets to reach all multicast receivers
and to suppress their feedback. It is obvious that the waiting period must be slightly
greater than the round trip time (RTT). The random interval accounts for feedback
responses and reduces possible packet collisions.
12.6 Simulation Environment and Numerical Results
12.6.1 Channel Modeling
The performance of the proposed algorithm was tested using a Matlab based simulation. The configuration of the cellular topology under consideration is depicted
in Fig. 12.2. The network is a typical IEEE 802.16 consisting of base stations and
Fig. 12.2 Simulation
topology – A typical 802.16
cellular configuration
network with fixed subscriber
terminals
260
M.P. Anastasopoulos et al.
static subscriber stations. In the proposed model, the layout of the network consists
of the rectangular grid of cells, with 90◦ sectors. The operational frequency of the
system is 40 GHz. At frequencies above 10 GHz, the dominant factor impairing the
performance of LOS wireless links is rain attenuation. For this reason, a dynamical
rain rate field has been implemented [11–14].
Protocols underlying channel exhibits both spatial and temporal characteristics.
The spatial characteristics of rain were simulated using HYCELL, a model for rain
fields and rain cells structure developed at ONERA [11,12]. HYCELL is used to produce typical two-dimensional rain rate fields, R (x, y), over an area corresponding
to the size of a WiMax network, where R (x, y) denotes the rainfall rate at a point
(x, y). These rain fields follow the properties of the local climatology. In addition,
the temporal characteristics of the wireless channel, R (t), were simulated using
the methodology described in [13], where R (t) denotes the rainfall rate at time t. A
typical rain rate field generated using the above model for two different time instants
(t, t + 15 min), concerning the province of Attica-Greece, is depicted in Fig. 12.3.
Having implemented an accurate model for R (x, y; t), the next step is to determine A Ri j (t) that is the attenuation caused by rain at link (i, j) between base station
i and multicast receiver j, at time t. This is achieved by integrating the specific rain
attenuation A0 , (dB/km) over the path length L i j of the link (i, j) within the rain
medium.
L i j
A Ri j (t) =
A0 dl
(12.7)
0i
with
A0 = a R b
(12.8)
Where R is the rainfall rate (mm/h) and a, b are parameters depending on frequency, elevation angle, incident polarization, temperature and raindrop size distribution [15].
Fig. 12.3 A random generated dynamic rain rate field for a 100 × 100 surface in Attica-Greece
12
Game Theory Modeling
261
12.6.2 Numerical Results
In Fig. 12.4 the average number of feedback messages versus (d E/a), for various
numbers of users, is depicted. First of all it is obvious that the curves show dependence of the expected feedback messages on (d E/a) and are convex with minimums
at (d E/a)∗ . For values of (d E/a) less than (d E/a)∗ it is observed that the number
of feedback messages is increased due to the fact that the cost for a user to send an
acknowledgement is negligible. In this case, users have more to earn, in terms of
QoS, from sending an acknowledgment by their self, rather than waiting from the
others to do it for them. The above is daily confirmed in the social life. For example,
why should someone stay apathetic in an illegal event that is taking place in front of
his him, when he has nothing to lose? Equivalently, why should a node act according
to the social welfare, suppressing his feedback messages and probably risking his
QoS, when he has nothing to earn?
On the other hand, for values of (d E/a) greater than the (d E/a)∗ the cost for
sending feedback messages is significant. In this circumstance, users have no incentive to send feedback messages and the syndrome of Genovese appears.
Then, in Fig. 12.5 the proposed feedback suppression game is compared with the
method of exponential timers, described analytically in 0. In this approach, when a
subscriber is informed that a feedback message of another receiver will suppress its
own feedback sending. Feedback messages are sent on a multicast feedback channel in order to be received also by the other receivers. If every receiver delays its
multicast feedback sending by a random time, feedback implosion can be avoided.
Furthermore, it is proved that optimum suppression is achieved if timers are chosen
to follow exponential distribution [16].
Fig. 12.4 Impact of payoff function in feedback transmission
262
M.P. Anastasopoulos et al.
Fig. 12.5 A comparison between timer based and bystander effect feedback suppression
algorithms
In case no feedback suppression algorithm is applied, every user sends a feedback
message asking for packet retransmission. It is observed that the proposed algorithm
achieves almost the same performance with the case where T = 6c and = 10. Note
that, T is the time interval where exponential timer is applied, c is the RTT and λ is
a parameter of exponential distribution. The parameters a and dE of the bystander
effect algorithm are 1 and 10−2 , respectively.
12.7 Conclusions
A game-theoretic based model for the solution of feedback suppression problem for
reliable multicast protocols in WiMax networks has been presented. The formulation of the problem was inspired from social psychology, and more specifically from
the phenomenon of bystander effect. When a high number of multicast receivers are
present, users resemble the behaviour of apathetic human beings, so the feedback
implosion problem is being solved satisfactorily. The Genovese syndrome is discussed and the need for back up mechanisms is investigated. The performance of the
proposed algorithm is analytically quantified and by employing a physical channel
model, extended simulations of a hypothetical WiMax network are presented.
Acknowledgments Markos P. Anastasopoulos thanks Propondis Foundation for its financial
support.
12
Game Theory Modeling
263
References
1. T. Kwok, “Residential broadband Internet services and application requirements,” IEEE Commun. Mag., p. 76, June 1997.
2. The WiMax Forum. http://www.wimaxforum.org
3. H. Sari, “Broadband radio access to homes and businesses: MMDS and LMDS”, Comput
Networks, vol. 31, pp. 379–393, 1999.
4. A. Ghosh, D. R. Walter, J. G. Andrews, R. Chen, “Broadband wireless access with
WiMax/8O2.16: Current performance benchmarks and future potential”, IEEE Comm. Mag.,
vol. 43, pp. 129–136 Feb. 2005.
5. J. Yun, M. Kavehrad, “PHY/MAC cross-layer issues in mobile WiMax”, Bechtel Telecomm.
Tech. J., vol. 4, no. 1, pp. 45–56 Jan. 2006.
6. ITU-R, P 1410–2, “Propagation data and prediction methods for the design of terrestrial broadband millimetric radio access systems operating in a frequency range of about 20–50 GHz,”
in Propagation in Non-Ionized Media, Geneva, 2003.
7. K. Obraczka, “Multicast transport protocols”, IEEE Commun. Mag., vol. 36, pp. 94–102, Jan.
1998.
8. B. Latane, J. Darley, Bystander “Apathy”, Am. Scientist, vol. 57, pp. 244–268, 1969.
9. J. W. Weibull, “Evolutionary game theory”, The MIT Press, Cambridge, Massachusetts, London, 1995.
10. E. Rasmusen, “Games and information”, Blackwell Publishing, Oxford, 2006.
11. L. Féral, H. Sauvageot, L. Castanet, J. Lemorton: “HYCELL: A new hybrid model of the rain
horizontal distribution for propagation studies. Part 1 : Modelling of the rain cell”, Radio Sci.,
vol. 38, no. 3, p. 1056, 2003
12. L. Féral, H. Sauvageot, L. Castanet, J. Lemorton, “HYCELL: a new hybrid model of the rain
horizontal distribution for propagation studies. Part 2: Statistical modelling of the rain rate
field”, Radio Sci., vol. 38, no. 3, p. 1057, 2003.
13. L. Féral, H. Sauvageot, L. Castanet, J. Lemorton, F. Cornet, K. Leconte, “Large-scale modeling of rain fields from a rain cell deterministic model”, Radio Sci., vol. 41, no. 2, Art. No.
RS2010, Apr. 29 2006.
14. A. D. Panagopoulos, J. D. Kanellopoulos, “On the rain attenuation dynamics: spatial–temporal
analysis of rainfall rate and fade duration statistics” Int. J. Satell. Commun. Network, vol. 21,
pp. 595–611, 2003, DOI: 10.1002/sat.763.
15. ITU-R P-838-2, Specific attenuation model for rain for use in prediction methods, Geneva,
2003.
16. J. Nonnenmacher, E. W. Biersack, “Scalable feedback for large groups”, IEEE/ACM Trans.
Networking, vol. 7, no. 3, pp. 375–386, June 1999.
Chapter 13
IEEE 802.16: Enhanced Modes of Operation
and Integration with Wired MANs
Isabella Cerutti, Luca Valcarenghi, Piero Castoldi, Dania Marabissi,
Filippo Meucci, Laura Pierucci, Enrico Del Re, Luca Simone Ronga,
Ramzi Tka and Farouk Kamoun
Abstract The evolution of wireless technologies allows users to be always connected to IP-based services through IP-based devices. Moreover the bandwidth
available to wireless connected users is becoming comparable to the one provided
by copper-based access technologies (e.g., xDSL). Worldwide Interoperability for
Microwave Access (WiMax) is one of the wireless technologies that potentially allows users to utilize an access capacity in the order of tens of Mb/s.
So far, WiMax (i.e., IEEE 802.16) has been exploited and investigated mainly in
the Point-to-MultiPoint (PMP) mode, while IEEE 802.16 enhanced-modes of operation are still at their early research stages. Furthermore, how to integrate Wireless
Metropolitan Area Networks (WMANs) based on IEEE 802.16 and wired/optical
MAN to guarantee seamless Quality of Service (QoS) across the two transport domains still remains an open issue.
This chapter addresses the IEEE 802.16 enhanced-modes of operation and the
wireless/wired Metropolitan Area Network (MAN) integration. The focus is on advanced physical layer technologies for wireless transmission such as Multiple Input
Multiple Output (MIMO) antennas and Adaptive Modulation and Coding (AMC),
the optional IEEE 802.16 Mesh mode of operation, and the integration of wireless
and wired/optical MANs. Current status and issues are presented and solutions are
proposed.
Keywords IEEE 802.16 · WiMax operation modes · Wired MAN · Quality of service · AMC modes · MIMO system · GMPLS · Integrated PHY-MAC simulator
13.1 Introduction
The explosive growth of communications is driven by two complementary technologies: optical transport and wireless communications. Optical fiber offers the massive
I. Cerutti and L. Valcarenghi (B)
Scuola Superiore Sant’Anna, Pisa, Italy
e-mail: isabella.cerutti@sssup.it, luca.valcarenghi@sssup.it
M. Ma (ed.), Current Technology Developments of WiMax Systems,
C Springer Science+Business Media B.V. 2009
DOI 10.1007/978-1-4020-9300-5 13,
265
266
I. Cerutti et al.
bandwidth potential that has fueled the rise in Internet traffic, whilst wireless techniques confer mobility and ubiquitous access through bandwidth-constrained and
impairment-prone wireless channels.
To overcome the bandwidth limitations and impairment susceptibility of wireless
communications, a wireless technology for broadband wireless access has been recently standardized: IEEE 802.16, also known as Worldwide Interoperability for Microwave Access (WiMax). IEEE 802.16-2004 standard [1] defines the air interface
for fixed broadband wireless access systems supporting multimedia services. IEEE
802.16 offers a wireless alternative to wired Metropolitan Area Network (MAN)
access protocols and technologies, with a potential capacity of up to 70 Mb/s.
Wired MANs are used to connect the users to the public Internet in areas in
which fixed interconnections between routers have been already deployed, such as
in densely populated cities. On the other hand, Wireless MANs (WMANs) can be
used to offer a broadband fixed wireless access to the public Internet in rural areas
or in areas in which infrastructural costs for wired metropolitan networks are too
high.
So far, wireless and wired MANs have been evolving independently but an integration between these two technologies is necessary to provide high-speed and
flexible multimedia services to wireless (possibly mobile) terminals. Thus, improvements are needed in the wireless segment, in the wired segment, and in the integrated
wireless-wired network.
In the wireless segment, the various operational modes at Physical (PHY) and
Media Access Control (MAC) layers available in the IEEE 802.16 standard can
be efficiently selected in order to provide high capacity. Multiple Input Multiple
Output (MIMO) transmission schemes can exploit wireless channel spatial properties in a Point-to-MultiPoint (PMP) context, while Adaptive Modulation and Coding (AMC), used in the flexible Orthogonal Frequency Division Multiple Access
(OFDMA) scheme, is able to mitigate the effect of the wireless channel degradation.
The joint adoption of MIMO and AMC, as explained in the following sections,
can be considered as an effective solution for future high-performance wireless
networks. In addition, MIMO and AMC schemes can benefit from exploiting also
channel status information through Network-MAC-PHY interaction (i.e., a crosslayer approach). Finally, multi-hop transmission, such as the optional IEEE 802.16
Mesh mode of operation, has the potential of improving WMAN utilization.
On the other hand, the increase in capacity and bandwidth, offered to wireless
users, requires an increasing data rate in the wired MAN and calls for the adoption
of the optical fiber based transport. Traffic engineering and advanced routing strategies provided by the Generalized MultiProtocol Label Switching (GMPLS) protocol
suite must be exploited in the wired network, to improve network utilization and
assure the required Quality of Service (QoS).
Finally, cross-domain, i.e., wireless/wired, traffic engineering schemes must be
implemented to guarantee a seamless QoS to users connected to any network
segment.
This chapter aims at indicating the enhancements that IEEE 802.16 should
accommodate for implementing high-capacity QoS-guaranteed WMANs and the
13
Enhanced Modes of Operation and Integration with Wired MANs
267
integration process toward a seamless convergence with wired networks. Open issues in the implementation of the enhanced-modes of operation and the integration
process are outlined. Solutions are proposed for the considered issues and their advantages and drawbacks are evaluated.
13.2 IEEE 802.16 PHY Layer
IEEE 802.16 standard defines four different PHY layers, each one addressing specific wireless channels. The two single carrier PHY layers (SC and SCa) are designed to operate typically in high capacity links, respectively over 11 GHz in a
line-of-sight (LoS) environment and under 11 GHz frequencies in a non-line of sight
(NLoS) environment. In the other PHY layers, Orthogonal Frequency Division Multiplexing (OFDM) and Orthogonal Frequency Division Multiple Access (OFDMA)
techniques are designed to be resistant to heavy NLoS environment.
OFDM and ODFMA are two variants of the same technology: both divide an
extremely fast signal into many slow signals, each one spaced apart at precise frequencies, referred to as subcarriers. The advantage is that multipath fading can be
mitigated: OFDM modulation offers robustness against intersymbolic interference
and thanks to the multiple narrowband subcarriers, frequency-selective fading on
a subset of subcarriers can be easily equalized. The difference between the two
variants (i.e., OFDM and OFDMA) lays in the ability of OFDMA to dynamically
assign a subset of all the subcarriers to individual users. This allows the allocation
algorithms to shape the traffic load over the available resources, while keeping into
account the channel state. Thanks to the greater flexibility, OFDMA has been selected by the WiMax Forum as the basic technology for mobile user services [2].
In addition, Scalable OFDMA (S-OFDMA) allows a variable channel bandwidth
ranging from 1.25 to 20 MHz and the deployment of networks with a frequency
reuse factor of 1, eliminating the need for frequency planning. According to the
standard [2], before transmission, the subchannels can be permuted in order to guarantee some physical related characteristics. Permutation zones, both in the DownLink (DL) or UpLink (UL), define how a part of the frame has been permuted.
The DL sub-frame or the UL sub-frame may contain more than one permutation
zone. In Fully Used Subcarriers (FUSC) and Partially Used Subcarriers (PUSC)
permutations, subchannels are pseudo-randomly spread over the bandwidth in order
to average the channel state for all the users.
In AMC permutation (adjacent permutation), each user is assigned to a set of
bins, each one composed of 9 adjacent physical subcarriers. In this case, non homogeneous channel states can be assigned to various users, thus permitting advanced
adaptive algorithms, also based on MAC-connection QoS requirements.
The OFDM/OFDMA PHY supports frame-based transmissions. The frame duration is fixed for the whole network and may range from 2.5 to 20 ms, depending
also on the available bandwidth. Each frame interval includes transmissions of BS
and SSs, gaps and guard intervals. Each frame starts with a preamble, a repetitive
268
I. Cerutti et al.
pre-defined pattern, used for synchronization and channel estimation. Uplink and
downlink transmissions can adopt frequency or time division duplex (FDD or TDD).
To have a high transmission reliability, the following channel coding procedure
must be applied to data bits before transmission:
1. Randomization. Each block of data to be transmitted in the uplink or downlink
is randomized according to a pseudo-random binary sequence.
2. Forward error correction (FEC). Randomized data are encoded with a concatenation of a Reed-Solomon outer code and a rate-compatible convolutional inner
code.
3. Interleaving. Each encoded data bit is interleaved with a block size corresponding to the number of coded bits per allocated subcarriers per OFDM symbol. The
objective of the interleaver is to ensure that adjacent encoded bits are mapped
onto nonadjacent subcarriers and alternately onto less and more significant constellations bits.
After the interleaving, the data bits are mapped into the modulation constellation
points by the constellation mapper. The modulation can be flexibly selected, among
binary phase shift keying (BPSK), 16 and 64 quadrature amplitude modulation
(QAM) or quadrature phase-shift keying (QPSK). The mandatory channel coding
per modulation are: BPSK 1/2 (i.e., BPSK with code rate 1/2), QPSK 1/2 and 3/4,
16-QAM 1/2 and 3/4, 64-QAM1 2/3 and 3/4.
13.3 Advanced Techniques: MIMO and AMC
This section highlights the advantages of applying advanced transmission and reception techniques to the IEEE 802.16 PHY layer. In wireless links, the overall
system performance degrades markedly due to multipath fading, Doppler effect,
and time dispersive effects introduced by the wireless propagation. In addition, the
limitation of the wireless resources (i.e., bandwidth and power) requires that they
have to be efficiently exploited. To enhance the spectral efficiency while adhering to
QoS, multiple antenna systems (e.g., MIMO) and adaptive resource allocation can
be applied and are considered next.
With respect to a wired network, the nature of wireless channel does not allow
the steady use of a bandwidth-efficient modulation, due to random fading fluctuations in the channel state. The idea of Adaptive Modulation and Coding (AMC)
is to dynamically adapt the modulation and coding scheme to match the transmission parameters to propagation conditions and to achieve various trade-offs between
data rate and robustness. The dynamic adaptation of the parameters must take into
account also the information coming from the higher levels, in particular from the
MAC layer. Therefore, it is important to optimize the different components jointly
across layers.
1
The 64-QAM modulation is optional for license-exempt bands.
13
Enhanced Modes of Operation and Integration with Wired MANs
269
The same goal of increasing the spectral efficiency and the coverage can be
reached by using a complementary approach based on the utilization of multiple
antennas. Some multi-antenna transmission methods, such as beamforming and
transmit diversity, have been standardized for large scale third-generation (3GPP)
systems and their evolutions, and few of them are already available on the market.
Enhanced solutions, such as Multiple Input Multiple Output (MIMO) systems, are
included in IEEE 802.16e [2] (also referred to as “Mobile WiMax”), as well as
in other broadband wireless standards, such as Wideband Code Division Multiple
Access (WCDMA), IEEE 802.11 (WiFi), and IEEE 802.20.
These advanced solutions are suitable for WiMax systems, in either PMP or Mesh
networks, and can be adopted to increase network performance. In particular, they
are expected to bring a significant improvement in the throughput of wireless networks and an adaptive robustness against wireless channel fluctuations, experienced
especially by highly mobile stations.
13.4 IEEE 802.16 AAS and MIMO Support
IEEE 802.16-2004 (also known as IEEE 802.16d) standard [1] introduces multi
antenna support. The “Amendment 2 and Corrigendum 1 to IEEE std. 802.16-2004”,
namely 802.16e version [2], adds several details about Adaptive Antenna Systems
(AAS) and MIMO [3].
The support of mulitple antenna systems by IEEE802.16d/e is summarized in
Table 13.1.
Table 13.1 IEEE802.16d/e MIMO support; Alamouti Space Time Diversity (STTD), Spatial Multiplex (SM)
PHY layer
SC
SCa
OFDM
OFDMA
802.16d
no
STTD, AAS
STTD, AAS
802.16e
no
STTD, AAS
STTD, AAS
MIMO 2-4 BS antennas TD and
SM; AAS
2-3-4 TX antenna grouping and
selection, STTD; Layered
Alamouti; SM SM Uplink
MIMO (collaborative SM);
AAS with AMC permutation
13.4.1 Adaptive Antenna Systems (AAS)
In Adaptive Antenna Systems (AAS), the signals from several antenna elements
(not necessarily a linear array) are weighted (both in amplitude and in phase) and
combined to maximize the performance of the output signal. The smart antenna’s
beams are not fixed and can place nulls in the radiation pattern to cancel interference
and mitigate fading, with the objective of increasing the spectral efficiency of the
system.
270
I. Cerutti et al.
The IEEE 802.16 standard defines a signaling structure that enables the use of
adaptive antenna system. A PMP frame structure is defined for the transmission
on downlink and uplink using directional beams, each one covering one or more
Subscriber Stations (SSs). The Base Station (BS) forms a beam based on channel
quality reported by the SSs.
The part of the frame with adaptive antenna transmission is included in an AAS
zone, which spans over all the subchannels until the end of the frame or until the
next permutation zone. AAS support for AMC permutation has been added in IEEE
802.16e version of the standard.
When a Fast Fourier Transform (FFT) size greater than or equal to 512 is used,
the BS can decide to allocate an AAS Diversity-Map Zone. The Diversity-Map
Zone is placed accordingly to the permutation used. In PUSC, FUSC, and optional
FUSC permutation, it is positioned on the two highest numbered subchannels of
the DL frame, while in AMC it is positioned on the first and last subchannels
of the AAS Zone. These subchannels are used to transmit the Downlink Frame
Prefix (AAS-DLFP) whose purpose is to provide a robust transmission of the required BS parameters to enable SS initial ranging, as well as SS paging and access
allocation.
In order to enter the network using the DLFP, an AAS-SS follows a specific procedure. The Downlink Channel Descriptor (DCD) and Uplink Channel Descriptor
(UCD) offer information useful for decoding and demodulation. A channel with
broadcast Connection Identifier (CID) is readable by every SS. The channels are
allocated accordingly to the DL/UL maps transmitted after the frame header. An SS
entering the network in AAS mode follows these steps:
r
r
r
r
r
r
the AAS-SS synchronizes time and frequency by using the DL preamble;
AAS-SS receives the necessary messages to identify used modulation and coding
(as the DCD and UCD pointed to by allocations made from the AAS-DLFP using
the broadcast CID)
the AAS-SS decodes the DCD and UCD and then it performs ranging;
the AAS-SS receives a ranging response message through a DL-MAP allocation
pointed to by an AAS-DLFP with the broadcast CID;
the AAS-SS receives initial downlink allocations through a DL-MAP allocation
pointed to by the AAS-DLFP with broadcast or specific CID;
other allocations can be managed by private DL-MAP and UL-MAP allocations.
13.4.2 Multiple Input Multiple Output System (MIMO)
Multiple Input Multiple Output (MIMO) support has been introduced since IEEE
802.16-2004. In IEEE 802.16e, several features have been added for multiple antennas at the transmitter and receiver for OFDM and OFDMA PHY layers. These
systems can be used to achieve diversity gain in a fading environment or to increase
capacity.
13
Enhanced Modes of Operation and Integration with Wired MANs
271
When transmit diversity is desired, multiple copies of the same data stream are
transmitted over independent spatial channels which are created by employing multiple antennas. Transmission is more robust to wireless channel fluctuations, since it
is unlikely that all the channels fade simultaneously.
When higher capacity is needed, spatial multiplexing is utilized to transmit various streams of data simultaneously over different antennas in the same time slot,
over the same frequencies. If statistical decorrelation among antenna elements is
available, multiple transmit and receive antennas can create independent parallel
channels and the transmitted symbol can be correctly reconstructed at the receiver.
Decorrelation condition can be satisfied by using antennas well separated (by more
than λ/2) and/or with different polarizations.
IEEE 802.16e standard defines three MIMO operation modes: Alamouti Space
Time Transmit Diversity (STTD) [4], Layered Alamouti Space Time Coding (LSTC)
[5] and Spatially Multiplexed Vertical Bell Laboratories Layered Space-Time (SM
VBLAST) [6, 7]. Switching among these modes permits to follow the channel
state [8]. In addition, adaptive spatial modulation, jointly with adaptive modulation
and coding techniques, can offer high flexibility at the physical layer and allows to
maximize data throughput and coverage.
STTD is standardized for SCa, OFDM, and OFDMA PHY Layers. The Alamouti
scheme needs two transmitting antennas at the BS and provides a transmit diversity of two. Alamouti relies on a constant channel response in two adjacent symbols: channel variations that occur during two-symbol time interval are the main
source of performance degradation. The receiver is a linear combiner [4] where
symbols can be reconstructed by using orthogonal properties of space-time coding
matrix A.
For SCa (Single Carrier for NLoS operation in frequency bands below 11 GHz),
STTD is used at a burst level. A burst is composed by a number of QAM symbols
equal to F. The bursts are arranged on a time basis as shown in Fig. 13.1. The STTD
requires the processing of a pair of time bursts.
The burst are coded accordingly to the well-known Alamouti matrix, where rows
represent the transmitting antennas and the columns represent the burst time slots:
U
Tx Ant 1
CP
N
F
U
Payload 0: s0 [n]
U
CP
Cyclic Prefix, last U symbols
U
Tx Ant 2
CP
N
F
Payload 1: s1 [(F-n)mod(F)]
Cyclic Prefix, last U symbols
Fig. 13.1 Single carrier Alamouti transmission
N
F
U
Payload 1: -s1 [n]
Cyclic Prefix, last U symbols
U
U
CP
N
F
Payload 0: s0 [(F-n)mod(F)]
Cyclic Prefix, last U symbols
U
272
I. Cerutti et al.
A=
s0
−s1∗
s1
s0∗
(13.1)
where ()∗ is the conjugate operator and sk is the burst at time k.
First antenna should transmit two sequences of F symbols while the second antenna shall not only reverse the order in which burst are transmitted but also conjugate the transmitted complex symbols and time-reverse the sequence of data within
each burst. The index n is the running position inside the burst. The time reversing
operation is realised by the (F − n)mod(F) operation, as in Eq. (13.1), where the
transmission for a pair of bursts is reported. A portion of the bursts (U symbols) is
copied to form the Cyclic Prefix (CP). The receiver using the STTD scheme in SCa
PHY layer can be found in Section 8.2.1.4.3.1 of [1].
In OFDM and OFDMA PHY layers STTD transmission operates differently.
STTD encodes information at the symbol level and not as bursts. OFDM and
OFDMA are differentiated by the minimum data unit that can be manipulated. In
OFDM PHY layer, STTD operates on two subsequent on two subsequent OFDM
symbols, while, in OFDMA, it can operate on a single group of subcarriers in the
time-frequency allocation grid.
In both cases, the symbols are coded accordingly to the matrix in Eq. (13.1),
where rows represent the transmitting antennas and columns represent OFDM symbols or subcarriers for OFDM/OFDMA PHY layer respectively. Compared to the
SCa PHY layer case, no time-reverse operation is needed, since transmitter and
receiver are performing IFFT and FFT processing.
When the BS has three or four antennas, it is not possible to achieve a fulldiversity approach, since it has been demonstrated that a full-rate, fully orthogonal
Space Time Code only exists for two antennas [9]. When a full rate transmission
is desired, LSTC schemes have to be used. Data rate is increased at the expense
of diversity gain, linearity or orthogonality. In IEEE 802.16e, the proposed scheme
for four antennas is expressed by the coding matrix B. Orthogonality is lost but the
full diversity gain and the receiver linearity are preserved. This scheme is a tradeoff
between a full-diversity STTD and SM VBLAST approach, which offers maximum
capacity gain but no diversity gain.
Layered schemes are subject to interference among symbols transmitted from
different antennas. This results in Bit Error Rate (BER) degradation with respect
to the orthogonal case. The receiver needs a number of receiving antennas Mr >
Nblocks , where Nblocks are the orthogonal blocks which have been spatially multiplexed (or layered). In the case of a 4-antenna BS, the LSTC matrix is:
⎛
s1
⎜−s ∗
1
B=⎜
⎝ s3
−s4∗
s2
s2∗
s4
s3∗
s5
−s6∗
s7
−s8∗
⎞
s6
s5∗ ⎟
⎟.
s8 ⎠
s7∗
(13.2)
Two Alamouti blocks are transmitted at the same time from a subset of the available BS antennas. This solution achieves the same transmit diversity as in the classic
13
Enhanced Modes of Operation and Integration with Wired MANs
273
2 × 1 Alamouti scheme and a spatial gain which is upper limited to two. The spatial
gain depends on the channel response: the optimum is achieved when the channel
matrix is orthogonal. In this case, contrary to the Alamouti case, no detection loss
is experienced since cross-stream interference is null.
The receiver operates as follows. Let us consider a system with a number of
transmitting antennas Mt = 4 and a number of receiving antennas Mr = 2. The
channel coefficient between the i-th transmitting element and j-th receiving element
at the n-th signaling time is h i j(n) and s = [s1 , s2 , s3 , s4 ]T .
At the receiver, the following composition of the two Mr × 1 received vectors y
at time n and n + 1 is considered:
y(n)
y∗(n+1)
⎡
=
h 11(n)
⎢ h 12(n)
⎢ ∗
⎣h 21(n+1)
h ∗22(n+1)
h 21(n)
h 22(n)
−h ∗11(n+1)
−h ∗12(n+1)
⎤
h 41(n)
h 42(n) ⎥
n(n)
⎥
s +
−h ∗31(n+1) ⎦
n(n+1)
∗
−h 32(n+1)
h 31(n)
h 32(n)
h ∗41(n+1)
h ∗42(n+1)
where n(n) is the Mr × 1 noise vector at time n.
Channel matrix H has peculiar orthogonality properties that can be exploited
in order to separate the spatially multiplexed Alamouti blocks. Let us define H =
[H1 |H2 ].
The Least-Square (LS) receiver is obtained from the Moore-Penrose pseudoinverse H+ , as follows:
⎡ H
H1 H1
ŝ = H+ y = UV y = ⎣
H2H H1
H1H H2
⎤−1 ⎡
⎦
⎣
H2H H2
H1H
⎤
⎦ y.
(13.3)
H2H
The matrix U has the auto-products of Alamouti blocks H1 and H2 on the principal diagonal and it has two cross-products representing the interferences due to
spatial multiplexing. Let ( ) H and ( )T be the hermitian and real transpose operators, respectively. Due to Alamouti orthogonality, the auto-products of Alamouti
blocks are:
H1H H1 = k1 I
H2H H2 = k2 I
where
k1 = h1 2 + h2 2
k2 = h3 2 + h4 2 .
The vector hi contains M R ×1 channel coefficients from the i th transmitting antenna.
The anti-diagonal elements of matrix U satisfy:
H1H H2 H2H H1 = ( + χ )I
2
2
where = h1H h4 − h2T h∗3 and χ = h1H h3 + h2T h∗4 .
274
I. Cerutti et al.
It can be shown [5] that a Moore-Penrose channel inversion can be attained using linear processing exploiting orthogonal properties of the STC. The estimated
transmit vector ŝ can be written as:
F2
$
⎡
ŝ =
k2 I
1
⎣
k1 k2 − ( + χ ) −H H H
1
2
F1
%&
' $ %&
⎡
⎤'
⎤
−1
H1H
−H1H H2
⎦ ⎣ ⎦y
k1 I
H2H
(13.4)
The vector hi contains M R ×1 channel coefficients from the i th transmitting antenna.
First, the receiver vertically processes two spatially multiplexed streams with matrix F1 . Then, with matrix F2 , it cancels cross-products (interferences). According to
Eq. (13.4), Signal-to-Noise Ratio (SNR) undergoes a reduction that is proportional
to ( + χ ). The SNR values for the estimation of the received symbols are:
S N R12 =
k1 − ( + χ )
k2
and
S N R34 =
k2 − ( + χ )
.
k1
(13.5)
−1
10
−2
BER
10
−3
10
−4
10
Alamouti 4X2 ant, 2 Layers 4 QAM (4 bps/Hz)
Alamouti 2X2 ant, Single Layer 16 QAM (4 bps/Hz)
VBLAST 2X2 ant, 2 Layers 16 QAM (8bps/Hz)
−5
10
0
1
2
3
4
5
6
7
8
9
10
11
12
13
14
15
SNR
Fig. 13.2 STTD, LSTC, and VBLAST
The main idea of this family of STC comes from multiuser detection strategies.
As a matter of fact, IEEE 802.16e standard offers the support for spatially multiplexed streams in multiuser scenarios. In downlink, each SS decodes the streams
directed to itself on the basis of the map broadcast at the start of each frame.
As a third MIMO option, the system can switch to a VBLAST transmission [6].
Independent data streams are spatially multiplexed, i.e., they are transmitted from
different antennas in the same OFDM symbol time; each data stream is referred to
as a layer. Since the code is operating over a single OFDM symbol, VBLAST is
13
Enhanced Modes of Operation and Integration with Wired MANs
275
a space-only coding. The coding matrix (in the case of two transmit antennas) is
reduced to a vector:
C=
s1
.
s2
(13.6)
Layers can be separated at the receiver if the number of antennas is
Mr > Nstr eams . While STTD of LSTC do not exploit all the freedom degrees of
the MIMO channel, VBLAST can extract the complete spatial gain. On the other
hand, VBLAST reaches smaller diversity gain with respect to the Alamouti 2 × 2
case.
VBLAST receiver decodes the streams in successive steps. Receiving algorithm
starts from a first signal detection. The detected symbol is then cancelled from each
one of the remaining received signals, and so on. It is evident the analogy with
the multiuser interference cancelled sequentially. The drawback of this method can
be envisaged in the sequential order of the estimation and cancellation: a wrong
decision propagates the error from one step of detection to the followings.
Optimum decoding order has been demonstrated in [10] and is achieved by detecting the highest SNR layer at each successive cancellation step. Then, linear
combinatorial nulling (Zero Forcing) is applied to remove interference caused by
undetected layers. VBLAST receiver based on Zero Forcing (ZF) linear detection
technique can be briefly summarised with the following steps:
1. compute the weight vector wki selecting entries from inverted channel matrix Gi
wki = (Gi )ki
2. find the highest SNR received signal among the Mr available signals
3. perform signal detection (weighting and slicing)
yki = wkTi ri
âki = Q(yki )
4. operate interference cancellation
ri+1 = ri − âki (H)ki
5. update channel matrix before next iteration
(+
Gi+1 = H
k
i
(ki is the matrix obtained by zeroing columns
where (Gi ) j is the j-th row of Gi , H
k1 , k2 , . . . , ki , and ( )+ denotes the Moore-Penrose Pseudoinverse. The process is
repeated until the last interference-free stream has been detected. Figure 13.2 shows
a performance comparison among STTD, LSTC, and VBLAST schemes.
In uplink transmission, an additional feature is allowed: the Collaborative SM
scheme. In a multiuser Collaborative SM context, two users may share the same
subchannel in the uplink. In this case, an SS can request an allocation in the uplink
to be used in coordination with a second SS in order to perform a Collaborative
Spatial Multiplex. SS participating at the Collaborative SM can be equipped with a
single antenna.
276
I. Cerutti et al.
13.5 Adaptive Modulation and Coding
In wireless systems, the signal transmitted to and by a station can be modified to
counter-react to the signal quality variations through a process commonly referred
to as link adaptation. This allows to improve system capacity, peak data rate, and
coverage reliability. Traditionally, wireless systems use fast power control as the
preferred method for link adaptation. In a system with power control, the power of
the transmitted signal is adjusted in order to meet a target carrier-to-interferenceplus-noise ratio at the receiver. Therefore, typically, the transmit power is low when
a user is close to the BS and it increases when the user moves away from the BS.
Adaptive Modulation and Coding (AMC) is offering an alternative link adaptation
method that promises the increase of the overall system capacity. In a system with
AMC, the power of the transmitted signal is held constant, but the modulation and
coding formats are changed to match the current received signal quality. AMC provides the flexibility to match the modulation-coding scheme to the average channel
conditions of each station. Users close to the BS are typically assigned higher-order
modulations and high code rates. The modulation-order and/or the code rate may
decrease as the distance from the BS increases.
In particular, in an OFDM/OFDMA wireless system, the inherent multi-carrier
nature of OFDM allows the use of AMC according to the behaviour of the narrowband channels (subcarriers) and different subcarriers can be allocated to different
users to provide a flexible multiuser access scheme, that exploits multiuser diversity.
Adaptive Modulation and Coding is twofold supported by IEEE 802.16 standard [2]. First, a large selection of modulation and channel coding is available at BS
and SS. All the possible combinations between the modulations QPSK, 16-QAM,
and 64-QAM and the coding rates 1/2 and 3/4 are allowed. In addition, the 64QAM modulation can be also combined with a coding rate 2/3. Then, a special
AMC permutation scheme is defined, where subchannels are composed by groups
of contiguous subcarriers.
The contiguous permutations include downlink AMC and uplink AMC and have
the same structure. A bin consists of 9 contiguous subcarriers (eight data subcarriers
and one pilot subcarrier) in the same symbol. Let N be the number of contiguous
bins and M be the number of contiguous symbols. A slot in AMC is defined as a
collection of bins of type (N x M), with (N x M) = 6. Thus, the allowed combinations are: (6 bins, 1 symbol), (3 bins, 2 symbols), (2 bins, 3 symbols), and (1 bin, 6
symbols).
In addition to power control and AMC, Dynamic Subcarrier Assignment (DSA)
schemes can be used in OFDM/OFDMA systems. In particular, due to the contiguous subcarrier allocation, each user can experience highly-variable channel conditions and may benefit from multiuser diversity by choosing the subchannel with the
best frequency response. High spectrum efficiency can be achieved with adaptive
subchannel allocation strategies.
In conclusion, there is a wide degree of flexibility for radio resource management
in the context of OFDM. Since channel frequency responses are different at different
frequencies or for different users, adaptive power allocation, AMC, and DSA, can significantly improve the performance of OFDM systems. The link adaptation algorithms
13
Enhanced Modes of Operation and Integration with Wired MANs
277
Base Station
Burst
Composer
Carriers
Permutation
IFFT and
CP insertion
AMC Decision Process
to RF
stages
CSI from SS
Subscriber Station
from RF
stages
CP removal
and FFT
CSI to BS
Carriers
De-permutation
RX Burst
Detection
Channel
Estimation
Fig. 13.3 AMC usage graph
can be designed to maximize the overall network throughput or to achieve target error
performance. The former objective may be appropriate for best-effort services but
does not meet QoS requirements in terms of error performance. The latter one may
ensure the QoS requirements, at the expense of network throughput.
Dynamic link adaptation in the downlink is obtained through SS feedback, by
providing the transmitting BS with channel state information (CSI) estimates, as
illustrated in Fig. 13.3. In the uplink the SS can change its transmission parameters
based on its own channel estimates.
The accuracy of the channel estimates and the latency of the feedback affect
the AMC algorithms performance. Another practical consideration in AMC is how
quickly the transmitter must change its constellation size. Since the constellation
size is adapted to an estimate of the channel fade level, several symbols may be
required to obtain a good estimate. These practical considerations are relevant in
a mobile context with fast varying channels and require accurate solutions such as
prediction models for the channels.
13.6 IEEE 802.16 Mesh Mode Overview
IEEE 802.16 offers a wireless alternative to “last-mile” access protocols and technologies. Using IEEE 802.16 protocol, stations connected to the wired network act
as BS and offer broadband services to the SSs, as illustrated in Fig. 13.4. The main
278
Fig. 13.4 IEEE 802.16
deployment scenario
I. Cerutti et al.
IEEE 802.16
Mesh Mode
IEEE 802.16
PMP Mode
BS
Mesh BS
Wired
Network
SS
SS
l
ca od
Lo rho
o
hb
d
ig
de d
ne
ten oo
Ex borh
h
ig
ne
Mesh SS
Mesh SS
operation mode of IEEE 802.16 is based on PMP communications from/to the BS
and thus is referred to as PMP mode. In addition, IEEE 802.16 defines an optional
operation mode, called Mesh mode. The two different operation modes of IEEE
802.16 are sketched in the Fig. 13.4.
In the PMP mode, the BS communicates directly with each SS (i.e., downlink
transmission). SSs communicate with the BS (i.e., uplink transmission) on-demand.
MAC is connection-oriented and offers the flexibility to choose among different
types of uplink scheduling depending on the required QoS (i.e., Unsolicited Grant
Service (UGS), extended real-time Polling Services (ertPS), Real-time Polling Service (rtPS), Non-real-time Polling Service (nrtPS), and Best Effort (BE)).
In the optional Mesh mode, the Mesh BS is the system directly connected to
backhaul services, such as those offered by wired networks. The Mesh SSs may
communicate to the Mesh BS either directly or through multi-hop. Unlike PMP
SSs, Mesh SSs can also communicate among themselves directly, by exchanging traffic or forwarding traffic on behalf of other Mesh SSs. The transmission
can be classified into uplink and downlink transmissions, depending on the direction of the traffic, i.e., toward to and away from the Mesh BS, respectively.
Mesh mode permits to efficiently schedule uplink and downlink transmissions,
in a centralized or distributed manner, as it will be explained in the following
sections.
Furthermore, an extension of MAC and PHY layer of PMP mode is currently
being investigated by the IEEE 802.16’s relay task group [11]. The objective is the
definition of mobile multi-hop relay (MMR) functionalities between BS and SSs,
and also between BSs and a central controller connected to the wired infrastructure.
Proposals for more complex network architectures, such as a tree of PMP networks
or a hybrid PMP/Mesh network, are also being discussed.
Mesh mode networks are limited to operate on licensed bands below 11 GHz
(typically in the 2–11 GHz range) using OFDM. Mesh mode may operate also on
license-exempt band below 11 GHz (typically in the 5–6 GHz range) using OFDM.
13
Enhanced Modes of Operation and Integration with Wired MANs
279
The next sections will further describe the PHY and MAC layers of IEEE 802.16
for the optional Mesh mode. In the rest of the paper, Mesh BS and Mesh SS will be
addressed as BS and SS, in order to simplify the notation.
13.7 Mesh Mode Physical Layer
In this section the main features of the Mesh mode physiscal layer are described.
Other features are described in Section 13.2.
In each frame, uplink and downlink transmissions are time division duplexed
(TDD). As depicted in Fig. 13.5, each frame is divided into:
r
a control sub-frame. The control sub-frame has a length that can be flexibly selected as a multiple of 7 OFDM symbols2 and it is encoded using the robust
QPSK-1/2 encoding with the mandatory coding schemes. The control sub-frame
contains opportunities for the transmission of MAC Management messages. As
time
Frame n
Frame n+1
Network
configur.
MAC PDU with
Long
MSH−NENT
preamble
Network
configur.
PHY tr. burst
from SS #j
Guard
symb.
Guard
symb.
Guard
symb.
Network
entry
Data subframe
Long
MAC PDU with
preamble
MSH−NCFG
Schedule Control subframe
PHY tr. burst
from SS # j
Long
MAC PDU with
preamble
MSH−CSCH
Guard
symb.
Guard
symb.
Guard
symb.
Distributed
scheduling
Data subframe
Long
MAC PDU with
preamble
MSH−CSCF
Guard
symb.
Guard
symb.
Guard
symb.
Centralized Centralized
scheduling configur.
PHY tr. burst
from SS #k
Guard
symb.
Guard
symb.
Guard
symb.
Network Control subframe
Frame n+2
PHY tr. burst
from SS # k
Long
MAC PDU with
preamble
MSH−DSCH
Guard
symb.
Guard
symb.
Guard
symb.
Frame n−1
Fig. 13.5 Mesh frame structure
2
The length in multiple of 7 OFDM symbols is defined by the MSH-CTRL-LEN field in the mesh
configuration message (MSH-NCFG).
280
r
I. Cerutti et al.
shown in Fig. 13.5, the control sub-frame can be further classified into two different categories: network control sub-frame and schedule control sub-frame,
depending on the type of carried information. The network control sub-frame
carries MAC Management messages for the set-up and maintenance of the mesh
topology. The schedule control sub-frame carries MAC Management messages
for the coordinated scheduling of data transmissions.
a data sub-frame. The data sub-frame is divided into minislots that are available
for either uplink or downlink data transmissions.
13.8 Mesh Mode Medium Access Control
The medium access control layer of IEEE 802.16 Mesh mode is subdivided into
a security sublayer, MAC common part sublayer (CPS) and the service specific
convergence sublayer (CS).
The security sublayer provides access control and confidentiality to MAC data
transmissions. Security associations are over a single-hop link, thus the traffic needs
to be encrypted and de-crypted at each SS. Traffic encryption keys are exchanged
by using Rivest-Shamir-Adleman (RSA) algorithm with 1024-bit keys.
The service specific convergence sublayer (CS) interfaces the MAC common
part sublayer (CPS) with various higher layer protocols. CS functions include the
mapping of external network data into service data unit (SDU) to be delivered to
MAC CPS and the reporting of process results to CS. Currently, the CS specifies
a packet convergence sublayer for the support of IPv4 and IEEE 802.3/Ethernet
packets and an ATM convergence sublayer. Only the packet convergence sublayer
is required to be supported in Mesh networks.
Next subsections describe in more details some of the MAC CPS specifications.
13.8.1 Mesh Node and Link ID
At the MAC layer, the wireless network operating in Mesh mode can be represented
as mesh topology. The nodes of this mesh topology are BSs and SSs.
Nodes of the wireless network are uniquely identified by a 48-bit universal MAC
address. However, for IEEE 802.16 operations, a 16-bit node address (Node ID) is
used. The Node ID is assigned to a candidate node by the BS upon authorization to
join the network.
A link connects two nodes when a neighbor relationship exists between the corresponding stations. Two stations (BS or SS) are defined as neighbors, when they
directly communicate through a radio channel. The local neighborhood of a node
includes all the neighboring nodes, one-hop apart from the considered node. The
extended neighborhood of a node includes the local neighborhood and the neighbors
of the local neighborhood, i.e., all the nodes that are one or two hops apart from the
considered node. The left hand side of Fig. 13.4 depicts the local and extended
13
Enhanced Modes of Operation and Integration with Wired MANs
281
neighborhood for the indicated Mesh BS. An 8-bit link identifier (Link ID) is used
for addressing the links in the local neighborhood of a node.
13.8.2 MAC PDU
LSB
MSB
The generic format of MAC PDU is illustrated in Fig. 13.6a. It contains a fixed
size (48 bits) generic MAC header, an optional extended subheader, a 16-bit Mesh
subheader, a variable size optional payload, that can carry either CS data or a MAC
Management messages, and a CRC. Thanks to the variable size, higher layer traffic
can be accommodated in the payload and tunnel through the MAC.
The generic MAC header (see Fig. 13.6b) contains information on the header
type (HT), encryption control (EC), type encodings (Type), extended subheader field
(ESF) to indicate the presence of the extended subheader, CRC indicator presence
(CI), encryption key sequence (EKS), MAC PDU length (LEN), connection identifier (CID), header check sequence (HCS) for error detection in the header. As shown
in Fig. 13.6c, depending on the unicast/broadcast nature, the CID field in Mesh networks may include service parameters such as Type (e.g., MAC Management, IP),
Extended
subheader
Generic MAC
header (48)
(optional)
Mesh
subheader
Payload
CRC
(optional)
(16)
LEN LSB (8)
CID LSB (8)
EKS
(2)
Rsv (1)
CI=1 (1)
Type (6)
ESF (1)
EC (1)
HT=0 (1)
MSB
a) MAC PDU format
LEN
MSB (3)
CID MSB (8)
HCS (8)
b) Generic MAC header format
Type
(2)
Rel (1)
Unicast
Broadcast
Prio
DP
Link ID
NetID
0xFF
(3)
(2)
(8)
(8)
(8)
c) CID format
Management
Management Message Payload
Message Type
d) Payload format for MAC Management messages
Fig. 13.6 MAC message format
282
I. Cerutti et al.
reliability (Rel), priority/class (Pri) and drop precedence (DP), link identification
(Link ID) and network identification (NetID).
The Mesh subheader contains the 16-bit Node ID of the transmitting node. When
operating in Mesh mode, the Mesh subheader is mandatory and precedes the other
subheaders, except for the optional extended subheader (Fig. 13.6a). To indicate the
presence of the Mesh subheader, the most significant bit of the Type field in the
MAC header is set to 1.
The MAC Management messages are carried in the payload of the MAC PDU
and consist of a Type field and a payload, as illustrated in Fig. 13.6d. The Type
field identifies the type of MAC Management message. The use of the different
MAC Management messages in the mesh-specific procedures of Synchronization,
Network entry, Scheduling and ordinary operations is described next.
13.8.3 Synchronization
The MAC layer incorporates mechanisms to achieve synchronization within the network and with nearby networks.
Synchronization within the Mesh network is achieved through a number of externally synchronized nodes (e.g., GPS-connected) that act as master time keepers.
The other nodes must synchronize to the neighbors, that are closer to the externally
synchronized nodes (i.e., nodes with lower synchronization hop count). For this
purpose, Mesh network configuration messages (MSH-NCFG) contain a timestamp
and synchronization hop count information, that can be used to achieve synchronization. MSH-NCFG messages are sent periodically by the Mesh nodes (i.e., both
BSs and SSs), during the network control sub-frame transmit opportunities, following an election-based scheduling. In addition, Mesh network entry messages
(MSH-NENT) permit new nodes entering the network to achieve synchronization.
MSH-NENT messages are sent only in the first transmit opportunity of a network
control sub-frame, on a contention-based access. Finally, for synchronization to the
start of the frame, MSH-NCFG, MSH-NENT and distributed scheduling messages
(MSH-DSCH) are used.
Between nearby Mesh networks, synchronization and coordination of the channel usage can be achieved by using the information carried by MSH-NCFG and
MSH-NENT messages.
13.8.4 Network Entry
A node entering into a Mesh network, referred to as candidate node, should perform
the following steps:3
3
In the description, the notation MESSAGE:Type is utilized.
13
r
r
r
r
r
r
r
Enhanced Modes of Operation and Integration with Wired MANs
283
Scan the possible channels in the frequency bands of operations for active networks and establish coarse synchronization with the network by acquiring the
timestamp from MSH-NCFG:Network Descriptor messages. MSH-NCFG:
Network Descriptor message advertises the network channels and the
PHY PDU profiles (i.e., the FEC code type and the mandatory exit and entry
carrier-to-interference-and-noise ratio threshold) supported in the network.
Obtain network parameters from MSH-NCFG:Network Descriptor messages and select a candidate Sponsor Node.
Request a sponsor channel, i.e., a temporary schedule for the communications
to the candidate Sponsor Node, by sending a Mesh network entry message,
MSH-NENT:NetEntryRequest. The sponsor channel is opened when the
candidate Sponsor Node replies positively by advertising the candidate node
MAC address in the MSH-NCFG:NetEntryOpen message. The sponsor channel is available when the candidate node – now new node – acknowledges the
response with a MSH-NENT:NetEntryAck message.
Negotiate the basic capabilities of the links. A link is established to neighboring
nodes by advertising an SS basic capability request message (SBC-REQ). The
node at the other end of the link may accept the negotiation by replying with an
SS basic capability response message (SBC-RSP), containing the intersection of
both nodes’ capabilities.
Request authorization to the Authorization Node4 by tunneling a privacy key
management request message (PKM-REQ) through the Sponsor Node. Upon verification of the certification, the Authorization Node authorizes the new node
to join the network by tunneling a privacy key management response message
(PKM-RSP) through the Sponsor Node.
Request registration by sending a registration request message (REG-REQ) to
the Registration Node by tunneling through the Sponsor Node. Upon reception of a registration response message (REG-RSP), the new node is assigned a
Node ID.
Establish IP connectivity by acquiring IP address using DHCP, establish time
of the day using IETF RFC 868-defined protocol and, if necessary, transfer the
operational parameters by downloading the Configuration File via TFTP. Once
the TFTP download is completed, the new node acknowledges the transfer with a
TFTP completed message (TFTP-CPLT) and the BS establishes the provisioned
connection by sending a TFTP response messages (TFTP-RSP). All these operations are taking place over the sponsor channel.
In the case of abnormal behavior of an SS, the BS may force the SS MAC
re-initialization and the SS network entry process, by sending a reset command
message (RES-CMD).
4 The Authorization Node and the Registration Node are defined in the sponsor node configuration
file that each SSs can download via trivial file transfer protocol (TFTP).
284
I. Cerutti et al.
To establish links to neighbors, other than to the Sponsor Node, a mesh node
utilizes MSH-NCFG:Neighbor Link Establishment IE message whose
exchange is based on the following procedure:
r
r
r
A node sends a MSH-NCFG:Neighbor Link Establishment IE
challenge to the challenged node, i.e., the terminal node of the candidate
link. The challenge contains private keys.
Upon reception, the challenged node replies with a positive or negative acknowledgment, MSH-NCFG:Neighbor Link Establishment IE challenge
response, depending on the matching of the received and stored information,
including the private keys.
In the case of positive reply, upon a match of the information at the challenging node, the link is established when the MSH-NCFG:Neighbor Link
Establishment IE accept message is received at the challenged node.
13.8.5 Scheduling
Two scheduling mechanisms are defined for Mesh mode: distributed and centralized. Both mechanisms can be concurrently supported, by flexibly reserving the
number of data minislots for centralized scheduling and the number of distributed
scheduling Management messages, in the MSH-NCFG message.
13.8.6 Distributed Scheduling
Distributed scheduling can be performed in coordinated or uncoordinated manner.
In coordinated distributed scheduling, all the nodes in the extended neighborhood
coordinate their scheduling. To achieve coordination, each node informs periodically the neighbors about its schedule, by transmitting an MSH-DSCH message in
the schedule control sub-frame.
In uncoordinated scheduling, the two nodes of a link coordinate their scheduling, ensuring that it does not interfere with centralized or coordinated distributed
scheduling. Contention-based transmissions of MSH-DSCH messages occur in the
data sub-frame without interfering with the existing schedule (but MSH-DSCH message collisions may occur).
In both cases, the distributed scheduling is agreed upon a three way exchange of
MSH-DSCH messages. When making a request through a MSH-DSCH:Availabilities message, the node includes information of potentially available slots and
actual schedule. Upon request, an indication of the availabilities fitting the request
is issued in a MSH-DSCH:Grant message. The schedule is acknowledged with a
MSH-DSCH:Grant message sent by the requester to confirm the schedule. During
the exchange of MSH-DSCH:Grant messages, the neighbors of the requesting and
granting nodes are automatically informed of such schedule.
13
Enhanced Modes of Operation and Integration with Wired MANs
285
13.8.7 Centralized Scheduling
The centralized scheduling permits coordinated and collision-free transmissions on
the links of a routing tree covering the mesh network. The root of the routing tree is
the BS and the links are those established from any SS to its corresponding Sponsor
Node.
The routing tree is advertised in the centralized scheduling configuration message (MSH-CSCF). The BS broadcasts the MSH-CSCF message, that contains the
updated routing tree and the PHY PDU profile of each link, to all the neighbors that
in turn rebroadcast it to their neighbors.
Using the centralized scheduling message (MSH-CSCH), each SS may request
bandwidth to the BS for each node in its own subtree. Uplink requests start in the
last frame in which a node received the previous schedule. The BS collects the
resource requests from the SSs, decides the resource assignment and broadcasts it
through a MSH-CSCH message to all the neighbors that in turn rebroadcast it to
their neighbors with higher tree depth. Each SS determines its own data transmission schedule in a distributed fashion by dividing the data sub-frame reserved for
centralized scheduling proportionally to the assignments.
Nodes, that are distant a number of hops equal or greater than the channel reuse field in MSH-NCFG message, may concurrently transmit in the same opportunity [12–14]. The schedule is valid for the time required to collect the request and
distribute the next schedule, as shown in Fig. 13.7 for a tree topology composed of
a BS (node 0), two BS’s child nodes (node 1 and 2), and two child nodes of node 1
(node 3 and 4). The scalability of the centralized scheduling and the delay between
the arrival of an higher layer PDU and its transmission have been evaluated in [15].
validity of previous schedule
MSH−CSCH requests
MSH−CSCH grants
tree depth
0
1 2
2
1
3 4
control
data
subframe subframe
2
3 4
control
data
control
data
subframe subframe subframe subframe
control
data
subframe subframe
Fig. 13.7 Schedule validity
13.8.8 Ordinary Operations
Once the SS is registered into the network, it is responsible for performing the following operations:
r
keeping updated information on the local or extended neighborhood. Each SS
maintains a neighborhood list with neighbor-specific information on MAC address, Node ID, hops to the BSs, synchronization hop count, and next expected
MSH-NCFG message from the neighbor;
286
r
r
r
I. Cerutti et al.
periodic network configuration broadcasting. Periodically, the SS sends a MSHNCFG message with the updated neighborhood list, network information (such
as available burst profiles and operator identifier), channel characterization, and
time frame scheduling information (such as frame duration, control sub-frame
length, and centralized scheduling length);
data transmission. The SS can transit its own data or forward the data to its
Sponsor Node on behalf of its child nodes (and viceversa), during the minislots allocated by the centralized scheduling (MSH-CSCH message). In addition,
the SS may transmit data to the neighbors during the minislots allocated by the
distributed scheduling message (MSH-DSCH);
Management message tunneling and broadcasting. The SS is responsible for
UDP/IP tunneling the Management messages (such as PKM-REQ, PKM-RSP,
REG-REQ, REG-RSP) and forwarding data and Management messages (such
as MSH-CSCH, MSH-CSCF) for/to its child nodes in the tree.
13.9 Open Issues and Solutions
As described in Section 13.2, IEEE 802.16 allows different MIMO and link adaptation strategies to improve the link performance, increase the system capacity, and
support mobility (i.e., IEEE 802.16e). However, the standards lack to indicate the
receiver structure and the adaptation algorithms to be used for MIMO and AMC
strategies. The study of these solutions is still an open issue.
In addition, different and enhanced versions of MIMO and AMC should be investigated as they may help to further increase the system capacity and flexibility. For
instance, the choice of implementing MIMO strategies based on spatial multiplexing
or based on space time coding (STC) depends on the specific service requirements:
high capacity or high reliability. The possibility to exploit both techniques, alternatively, may help to achieve both objectives.
New diversity transmission schemes can be proposed by relaxing the orthogonal
properties in order to achieve power balancing at the transmitter, as in the case of
Alamouti transmission with more than two antennas. Moreover, new STC schemes
with higher coding rate are suitable for increasing capacity or serving an higher
number of users in a multiuser downlink system. In general, Alamouti has been
demonstrated to be the unique full-rate full-orthogonal complex modulation STC. A
maximum rate of 3/4 can be achieved in the case of 3 or 4 antennas. An orthogonal
code with five or more antennas has a maximum rate of 1/2. Quasi-orthogonal codes
achieve full rate transmissions and hybrid schemes achieve rates greater than 1 by
adding spatial gain. Thus, BS with more than four antennas can select transmission
modes from a wide range of possibilities.
From this point of view, algorithms that are able to switch between the different
diversity schemes, as the ones shown in Fig. 13.8, are necessary. These algorithms
can operate by using either PHY information, such as channel state information, or
MAC layer information, such as service type and queue status.
13
Enhanced Modes of Operation and Integration with Wired MANs
Burst
Composer
Diversity scheme
Diversity decision
algorithm
287
Carriers
Permutation
IFFT and
CP insertion
to RF
stages
Carriers
Permutation
IFFT and
CP insertion
to RF
stages
CSI from SS
Qos and Mac param
from RF
stages
from RF
stages
CP removal
and FFT
CP removal
and FFT
Carriers
De-permutation
Diversity
receiver
RX Burst
Detection
Channel
Estimation
TX Burst
Composer
Carriers
De-permutation
Fig. 13.8 Adaptive diversity scheme
As explained in Section 13.2 concerning the link adaptation strategies, power
control, modulation and coding selection, and subchannel allocation are three key
elements in the design of an efficient and flexible multiuser OFDM system. The
adaptation algorithms that efficiently assign the resources (power, subcarrier and
AMC scheme) must be defined and represents an important open issue.
13.10 Advanced Modulation and Coding
Different schemes and techniques can be implemented to match transmission parameters to time-varying channel conditions and to meet QoS requirements. The
aim is to maximize the system performance in terms of some QoS metrics, with a
particular attention to error probability and throughput. In [16], two adaptive modulation techniques for the WiMax system are proposed.
The first technique, called Maximum Throughput (MT), aims at maximizing the
system throughput without any explicit constraint on target SER (Symbol Error
Rate). The second technique, called Target SER (TSER), aims at guaranteeing a
given maximum target Symbol Error Rate (SER) that is imposed on the basis of a
target QoS level. The target value of the SER can be fixed for every SNR or can
vary with it. In the second case, the modulation can be adapted in order to meet the
288
I. Cerutti et al.
α<A
Fig. 13.9 Moore’s three state
machine
α<A
QPSK
α≥B
64
QAM
α≥B
A≤α < B
A≤α < B
α<A
α≥B
16
QAM
A≤α < B
theoretical SER of QPSK modulation, thus leading to the Minimum SER (MSER)
algorithm.
All three techniques use the same AMC scheme. The AMC scheme is modelled
as a Moore’s three state machine, as represented in Fig. 13.9. The difference among
Maximum Throughput, Target SER and Minimum SER is the threshold calculation.
Thresholds are the inputs of the AMC block that controls the adaptive modulation.
Each adaptation algorithm is characterized by two thresholds (i.e., A and B), that
trigger the state change to a different modulation order. The thresholds are calculated
by means of theoretical analysis. By comparing the actual channel attenuation factor
α(k) against the thresholds, it is possible to estimate the modulation order to be used
in the subsequent frame.
In Fig. 13.10, the performance in terms of SER is compared against the theoretical SER, for the three static modulation orders and for the three proposed
techniques. Two different values of target SER are considered for the Target SER
technique, i.e., SER = 7 · 10−2 and SER = 5 · 10−3 . The best SER performance is
achieved by AMC schemes using MSER or TSER (with SER = 5 · 10−3 ) techniques
or QPSK.
Figure 13.11 shows the performance comparison in terms of throughput, for different SNR values at the transmitter side. The throughput is expressed as the average
useful bits per symbol. The best performing technique is MT. For any SNR value,
MT technique is able to achieve a throughput higher than the static modulation
throughput. Also, MT outperforms the MSER and TSER techniques.
By comparing Figs. 13.10 and 13.11, it is evident that the choice of the best techinque depends on the specific system requirements. While the MT technique and
the MSER technique are well suitable for applications requesting strict throughput
or SER requirements, respectively, the TSER technique is suitable for generic applications in which the target SER can be adjusted following the requested QoS level.
Indeed, when the target SER value increases, SER performance of TSER worsens.
On the contrary, when the target SER value increases, throughput performance of
TSER improves. As a matter of fact, the TSER technique has been designed to
13
Enhanced Modes of Operation and Integration with Wired MANs
289
10−0
SER
10−1
10−2
10−3
10−4
QPSK
16QAM
64QAM
AMC Minimum SER
AMC Maximum Throughput
AMC Target SER = 0.005
AMC Target SER = 0.07
0
5
10
15
SNR [dB]
20
25
30
Fig. 13.10 Performance comparison in terms of SER
ensure a generic target SER, with the possibility of modifying such value whenever
the QoS requirements of the application change.
In order to offer multimedia services, a proper integration of the different link
adaptation strategies should be investigated. Schemes that utilize adaptive resource
allocation jointly with adaptive modulation and coding have the potential to enhance
the spectral efficiency, while guaranteeing QoS on a wireless channel. Moreover, a
cross-layer approach (i.e., the joint design of the MAC and PHY layers) shall be
considered for resource allocation. The transmission parameters, optimized by the
adaptive modulation/coding, are selected at the physical layer to match the wireless channel, but they must take into account also the information coming from
the higher levels, in particular from the MAC layer. For example, existing AMC
schemes are based only on the CSI available at the physical layer and rely on the
assumption that data bits are always available at the transmitter. The modulationcoding schemes are chosen at the physical layer to match the wireless channel,
assuming that there are sufficient PDUs waiting to be transmitted in the queues
(buffers) at the data link layer. However, in practical communication systems with
randomly arriving PDUs, the queues may be empty from time to time, even though
the wireless channel can accommodate transmissions. On the other hand, the queue
size is also affected by the wireless medium and depends on how the AMC module
adapts its parameters to channel variations. The interaction of queueing at the data
290
I. Cerutti et al.
6
QPSK
16QAM
64QAM
AMC Minimum SER
AMC Maximum Throughput
AMC Target SER = 0.005
AMC Target SER = 0.07
5
Throughput [bit/symb]
4
3
2
1
0
0
5
10
15
SNR [dB]
20
25
30
Fig. 13.11 Performance comparison in terms of throughput
link layer with AMC at the physical layer provides interesting design problems and
studies. In addition, QoS requirements imposed by the MAC layer can impact the
modulation and coding scheme to be selected.
The performance evaluation of complex cross-layer schemes can be a difficult
task since both network and signal processing time scales have to be present simultaneously. A flexible approach is obtained by integrating a network-level simulator
(the well-known NS2 from UC at Berkley) and the C++ signal processing simulator
MuDiSP3 from the University of Florence [17]. The integrated simulator replaces
the MAC, PHY, and channel strata of NS2 and inserts a framed time model. The
essential classes of the WiMax NS2 simulator are shown in Fig. 13.12.
The leading class is the FramedRadioChannel which is activated by 4 timers
at the beginning and the end of the downlink and uplink sub-frames. The downlink timing, described in Fig. 13.13, shows the essential steps during the delivery
of a downlink frame from the BS to all active SS. Network events are simulated
with an asynchronous time representation, while the PHY layer is modeled as a
synchronous series of operations. Upper layer network events are encapsulated into
synchronized frames and delivered to the FrameRadioChannel object. Then, at the
beginning of the first available DL sub-frame, the MAC payload data unit (MACPDU) is transferred from the MAC layer to the PHY layer of the BS, where a time
13
Enhanced Modes of Operation and Integration with Wired MANs
Fig. 13.12 NS2-MuDiSP3
WiMax simulator classes
291
BSMac
SSMac
BSPhy
SSPhy
Framed Radio Channel
Fig. 13.13 NS2-MuDiSP3
WiMax simulator: downlink
timing
domain complex signal is generated by an invocation of the MuDiSP3 simulation
engine [17]. The composed (network and physical) PDU is then collected by the
FramedRadioChannel and delivered to all SSs at the end of the downlink sub-frame.
Each SS processes the received physical signal in the SSPhy class, calling the required MuDiSP3 functions. Then, it delivers the network part of the received frame
(MAC-PDU) to MAC layer, along with an error map derived from the MuDiSP3
processing. Finally, the SSMac class can deliver only the information correctly received, to upper layers.
The simulator operates in a similar way for the uplink, whose timing is shown in
Fig. 13.14. The key difference is the role of the FramedRadioChannel class. First,
the FramedRadioChannel class collects all the uplink PDUs coming from the active
SSs and, then, it assembles them into a single uplink (physical and network) subframe, which is finally delivered to the BS.
Fig. 13.14 NS2-MuDiSP3
WiMax simulator: uplink
timing
292
I. Cerutti et al.
MuDiSP3 signal processing includes the following features:
r
r
r
r
pedestrian/vehicular urban/rural channel models for the 3.5 GHz;
models for the timing, synchronization, and carrier recovery errors;
all the modulation and coding schemes present in the 802.16e standard;
MIMO and AMC transmission modes.
13.11 IEEE 802.16 Mesh Mode Centralized Scheduling Issues
and Comparisons
When operating in Mesh mode, centralized scheduling allows the optimal allocation
of the resources among the SSs and facilitates the control and management of the
whole network. When using centralized scheduling, one of the main issues is the
computation of the transmission schedule and of the routing tree, used by the SSs
to communicate with the BS. From this point of view, IEEE 802.16 standard lacks
of indications on the strategy to use for designing the routing tree and for planning
the scheduling. However, the routing tree selection affects the transmission schedule
and the probability of a successful communication from (to) an SS to (from) a BS.
It is, thus, important to jointly optimize the tree selection and the scheduling to
improve performance. A proposal is presented next.
Given a network mesh topology where links are established between nodes that
can exchange MAC protocol data units (PDUs) and given the MAC data transmission requests, the routing tree design and the transmission scheduling needs to be
jointly solved to find the optimal solution. Given the complexity of the problem
(NP-hard), a two-step approach is pursued next.
The first step consists in designing the routing tree. Similar to the AMC study for
the PHY layer, two different QoS objectives are considered for the design: reliability
and throughput. Reliability refers to the expected probability that SSs can communicate successfully with the BS. Throughput refers to the maximum percentage of
bandwidth reserved for any node transmission, during the centralized scheduling
interval in the data sub-frame.
A maximum reliability tree (MRT) can be optimally found by selecting the shortest path tree rooted at the BS. The shortest paths are calculated on the mesh topology
by using (−log(1 − pi j )) as link weight, where pi j is the expected probability of an
unsuccessful transmission of a data PDU on link (i, j).
A maximum throughput tree (MTT) can be found by selecting the minimum hop
shortest path tree rooted at the BS. When multiple nodes at minimum hop distance
exist, the node with minimum number of two-hop neighbors (i.e., minimum number
of interfering neighbors [12]) is selected.
Once the routing tree is designed, the second step consists in optimizing the
scheduling. Concurrent transmissions of non-interfering SSs can be allowed [12].
The optimal scheduling is a coloring problem (thus an NP-hard problem) and is
solved using a heuristic algorithm [18].
13
Enhanced Modes of Operation and Integration with Wired MANs
Fig. 13.15 Expected
reliability versus pmax
293
1
Average reliability
0.9
0.8
0.7
0.6
0.5
0.4
MRT: L=51
MTT: L=51
MRT: L=106
MTT: L=106
MRT: L=169
MTT: L=169
0.3
0
0.1
0.2
0.3
0.4
p 0.5
0.6
0.7
0.8
0.9
max
Performance is evaluated on a number of randomly generated mesh topologies
of 20 nodes and L links, to achieve a confidence interval value of 5% or better, at
95% confidence level. The expected PDU error probability is uniformly distributed
on each links in [0, pmax ]. One of the nodes acts as BS and the others act as SSs.
SSs request the same amount of bandwidth for uplink transmissions. It is assumed
that concurrent transmissions of SSs that are more than two-hops apart (on the mesh
topology) are interference-free.
Figures 13.15 and 13.16 show the expected reliability and the expected maximum
throughput of the routing tree versus pmax for different degrees of mesh connectivity.
The plot shows that MRT is more reliable than MTT at the expenses of throughput.
Thus, the choice of the most suitable tree needs to be carefully evaluated depending
on the level of QoS required by the application.
0.05
MRT: L=51
MTT: L=51
MRT: L=106
MTT: L=106
MRT: L=169
MTT: L=169
Throughput
0.04
0.03
0.02
0
0.1
0.2
0.3
0.4
0.5
pmax
Fig. 13.16 Maximum throughput versus pmax
0.6
0.7
0.8
0.9
294
I. Cerutti et al.
13.11.1 Integration with Wired MAN
In addition to the aforementioned issues internal to the Wireless MAN (WMAN),
additional issues arise when integrating the (fixed or mobile) WMAN with the
wired network. The integration requires a seamless service support between wireless
and wired networks and must guarantee the requested level of end-to-end quality
of service (QoS). Integration between optical access networks, such as Ethernet
Passive Optical Networks (EPONs), and WiMax has been proposed in literature,
e.g., [19–21].
In this chapter, the considered scenario is represented by an IEEE 802.16 WMAN
and a wired MAN carrying IP traffic, as sketched in Fig. 13.17. The wireless BSs,
operating either in PMP or Mesh mode, act as interfaces between the wireless and
wired domain. In the following, the SSs are considered to be fixed or slowly moving. The additional issues of guaranteeing a seamless connectivity in the presence
of mobile wireless nodes (e.g., handover issues) can then be tackled by using, for
example, the approach proposed in [22], keeping into consideration the mobility
management procedures already available at the MAC layer of IEEE 802.16.
Fig. 13.17 Integrated wireless and wired architecture
Different integration approaches can be envisioned for the wireless and wired
MAN infrastructure and can be divided in IP-based and sub-IP-based, as explained
next.
13.12 IP-Based Integration
The IP-based integration is based on IP protocol, as proposed in [23]. Both the
wireless and the wired nodes should support IP protocol for network control and
data transport. As shown in Fig. 13.18 data and control packets are forwarded at
layer 3, according to the IP forwarding tables.
In each wireless node, a service-specific convergence sublayer (CS) for IP packet
support is required for interfacing the MAC layer of IEEE 802.16 protocol with the
13
Enhanced Modes of Operation and Integration with Wired MANs
Network
layer (IP)
Network
layer (IP)
CS
CS
IEEE 802.16
MAC
IEEE 802.16
MAC
IEEE 802.16
PHY
IEEE 802.16
PHY
Subscriber
station (SS)
295
Network
layer (IP)
Network
layer (IP)
Wired
MAC
Wired
MAC
Wired
MAC
Wired
PHY
Wired
PHY
Wired
PHY
Gateway/core/edge
wired node
Terminal
wired node
Base station (BS)
Fig. 13.18 IP integration: integrated wireless and wired network protocol layering
IP layer. Thanks to CS, IP packets can be forwarded to the next hop wireless node
as follows. Once the next hop IP address is determined, the IP packet may undergo
fragmentation or packing. Each (fragmented or packed) IP packet is then encapsulated with MAC header and transmitted according to PMP or Mesh operation mode
of IEEE 802.16 protocol. Similarly, the received MAC PDUs are decapsulated from
the MAC header and passed to the higher layers for the proper handling.
Within IP networks, QoS can be guaranteed using either the integrated service
(IntServ) or Differentiated service (DiffServ) approach [24]. In the integrated scenario, the BSs must be provided with additional functionalities for mapping QoS
parameters from the IP layer to the MAC layer. When using DiffServ, the Differentiated Service Code Point (DSCP) six bits in the IP header define the per-hop
behavior of each packet in both the wired and wireless segment. Data IP packet may
be marked at the BS by mapping, for example, the DSCP field into the scheduling services (i.e., UGS, ertPS, rtPS, nrtPS and BE) supported in the IEEE 802.16
network. When using IntServ, the traffic specifications (TSpec) information of the
Path message used in the resource reservation protocol (RSVP) [25] should be
mapped to the MAC QoS parameters, such as rate and delay.
Although promising and compatible with both the PMP and Mesh mode, the
IP-based integration has some weaknesses. When using DiffServ, QoS is guaranteed
only on a per-hop basis and may not be possible to ensure an end-to-end QoS. When
using IntServ, support or integration [14] of the RSVP signaling protocol with the
IEEE 802.16 MAC management protocols must be ensured. Moreover, it is wellknown that IntServ suffers from complexity and scalability problems with large
volumes of traffic. Therefore, to ensure end-to-end QoS and to avoid the well-known
scalability limitations of IntServ (i.e., the state explosion problem [26]), a sub-IPbased integration is envisioned, as explained next.
13.12.1 Sub-IP Integration
Except for the Mesh mode operating with distributed scheduling, IEEE 802.16
features a connection-oriented MAC Layer and could well-interface with other
296
I. Cerutti et al.
connection-oriented sub-IP protocols supported by wired MAN such as (Generalized) Multi-Protocol Label Switching (GMPLS) [27]. The advantage of a sub-IP
connection-oriented integration is the possibility to perform traffic engineering and
to ensure and control end-to-end QoS.
The connection-oriented nature of both IEEE 802.16 and GMPLS may permit
two different sub-IP integration solutions.
13.12.2 Wireless (G)MPLS Network-Wired (G)MPLS Network
Similarly to the IP-based integration approach described in the previous section,
the first solution assumes that the wireless network supports (G)MPLS (a similar
approach has been proposed for UMTS in [28]) through a well-define CS at the
wireless nodes. (G)MPLS data and management messages should be supported at
each wireless node, as shown by the protocol layering in Fig. 13.19. Notice that IP
layer may also be supported on top of (G)MPLS layer. (G)MPLS packets are forwarded along the route of the (G)MPLS connections, referred to as label switched
paths (LSP), according to the shim (G)MPLS labels in the packet header. An extension for traffic engineering of RSVP (RSVP-TE) permits the reservation of the
resources, while guaranteeing the required QoS.
At the edge router, either in the wireless or in the wired domain, IP packet DSCP
field can be mapped in an EXP-inferred or a label-inferred fashion into LSPs [29]. In
the EXP-inferred approach, a single LSP can support IP packets requiring different
Per Hop Behaviors (PHB) (i.e., Behavior Aggregates—BAs). In this case, packets
with different DSCPs have the same LSP label but a different EXP field value that
is obtained through a DSCP-EXP mapping. With such LSPs, the EXP field of the
MPLS Shim Header is used by the Label Switch Router (LSR) to determine which
PHB needs to be applied to the packet. In the label-inferred approach, a single LSP
carries packets belonging to a single BA. Thus, a mapping between Forwarding
Equivalence Class (FEC) and BA is necessary. The PHB Scheduling Class (PSC)
is explicitly signaled at the time of label establishment, so that after label establishNetwork
layer (IP)
(G)MPLS
(G)MPLS
CS
CS
IEEE 802.16
MAC
IEEE 802.16
MAC
IEEE 802.16
PHY
IEEE 802.16
PHY
Subscriber
station (SS)
(G)MPLS
Network
layer (IP)
(G)MPLS
Wired
MAC
Wired
MAC
Wired
MAC
Wired
PHY
Wired
PHY
Wired
PHY
Gateway/core/edge
wired node
Terminal
wired node
Base station (BS)
Fig. 13.19 Wireless (G)MPLS Network-Wired GMPLS Network integration: integrated wireless
and wired network protocol layering
13
Enhanced Modes of Operation and Integration with Wired MANs
297
ment, the LSR can infer the PSC to be applied to a labeled packet, exclusively from
the label value.
For an efficient cross-layer integration, RSVP-TE should be interfaced and interlaced with the IEEE 802.16 mechanism to reserve bandwidth for connections (or
service flows in PMP mode). In other words, RSVP-TE signaling should be able to
trigger mechanisms for bandwidth allocation as well as to map of QoS parameters,
at the BS or at the terminal SS.
13.12.3 Wireless IEEE 802.16 Network-Wired (G)MPLS Network
Another sub-IP solution for integrating the wireless and the wired networks is
sketched in Fig. 13.20 and is achieved by interlacing the LSPs of the (G)MPLS
networks with the IEEE 802.16 connections (e.g., service flows in PMP mode). The
(G)MPLS network operates as explained before. The wireless network is based on
IEEE 802.16. In the wireless network, end-to-end QoS can be guaranteed at the
MAC layer, thus simplifying the cross-layer approach and achieving a better QoS
control.
Network
layer (IP)
CS
(G)MPLS
(G)MPLS
Network
layer (IP)
(G)MPLS
IEEE 802.16
MAC
IEEE 802.16
MAC
Wired
MAC
Wired
MAC
Wired
MAC
IEEE 802.16
PHY
IEEE 802.16
PHY
Wired
PHY
Wired
PHY
Wired
PHY
Gateway/core/edge
wired node
Terminal
wired node
Subscriber
station (SS)
Base station (BS)
Fig. 13.20 Wireless IEEE 802.16 Network-Wired (G)MPLS Network integration: integrated wireless and wired network protocol layering
The advantage of this solution is a simplification of the wireless node architecture and protocol stack, at the expense of additional BS complexity. Indeed, when
adopting this solution, the BS acts as a protocol translator and thus has the burden to
interface RSVP-TE with the MAC signaling for resource allocation in IEEE 802.16,
to map QoS parameters, to perform admission control and so on, on behalf also of
the SSs.
13.12.4 Open Issues
In addition to the aforementioned issues for each integration approach, other issues
exist and are common to the different approaches.
298
I. Cerutti et al.
Both integration proposals, i.e., IP-based and sub-IP-based, suffer from some
common issues. First of all, while PMP mode is based on the definition of service
flows, the Mesh mode of IEEE 802.16 lacks a MAC signaling procedure for setting up connections and a mechanism to assign QoS to end-to-end transmissions. It
might be then necessary to extend to Mesh mode the PMP mechanism for defining
and setting up service flows with QoS parameters.
Some other issues are also common to both IP-based and sub-IP-based approaches. Wireless-wired integration requires admission control mechanisms (for
connection requests and/or packets) to be performed at the wireless nodes. Admission control mechanisms that take into account also the PHY layer performance
need to be proposed.
Finally, since resource allocation in IEEE 802.16 is achieved by scheduling transmissions, optimization algorithms and techniques need to be developed. As for admission control mechanisms, a cross-layer approach that takes into account PHY
layer performance can best optimize scheduling and network performance.
13.13 Conclusion
This chapter analyzed the key aspects of the IEEE 802.16 standard focusing on advanced access technologies such as MIMO antennas, AMC, and the optional IEEE
802.16 Mesh mode of operation.
The cross-layer adaptation described in this chapter, based on a close interaction between transmission schemes (MIMO) and modulations (AMC), results in an
effective solution to provide broadband access in a mobile context.
In addition, scheduling issues in Mesh mode were studied and assessed with the
aim of maximizing either the probability of successful communication between SS
and BS or the network throughput.
Finally, the issues for the integration of WiMax-based WMAN and wired/optical
Metropolitan Area Networks (MANs) were addressed. Three solutions for an integration capable of providing end-to-end cross-domain QoS were summarized. One
solution is based on integrating WMAN and wired MAN at the IP layer while the
other two are based on a sub-IP (i.e., layer 2/3) integration.
Acknowledgments This work has been jointly supported by MIUR under Italy-Tunisia FIRB
project “Software and Communication Platforms for High-Performance Collaborative Grid”
(RBIN043TKY) and under PRIN project “Traffic and terminal self-configuration in integrated
mesh optical and broadband wireless networks (TOWN)” (2005095328).
References
1. IEEE. IEEE Std. 802.16-2004, IEEE Standard for Local and Metropolitan Area Networks,
Part 16: Air Interface for Fixed Broadband Wireless Access Systems, 2004.
13
Enhanced Modes of Operation and Integration with Wired MANs
299
2. IEEE. IEEE Std 802.16e-2005 and IEEE Std 802.16-2004/Cor 1-2005: IEEE Standard for
Local and metropolitan area networks Part 16: Air Interface for Fixed and Mobile Broadband Wireless Access Systems Amendment 2: Physical and Medium Access Control Layers for
Combined Fixed and Mobile Operation in Licensed Bands and Corrigendum 1, 2005.
3. P. Piggin. Emerging mobile WiMax antenna technologies. IET Communications Engineer,
4(5):29–33, 2006.
4. S.M. Alamouti. A simple transmit diversity technique for wireless communications. IEEE
Journal on Selected Areas in Communications, 16(8):1451–1458, Oct. 1998.
5. X. Zhuang, F.W. Vook, S. Rouquette-Leveil, and K. Gosse. Transmit diversity and spatial
multiplexing in four-transmit-antenna OFDM. In Proc. IEEE ICC, volume 4, pages 2316–
2320, 11–15 May 2003.
6. G.J. Foschini. Layered space-time architecture for wireless communication in a fading environment when using multi-element antennas. Bell Laboratories Technical Journal, Autum:
41–59, 1996.
7. B. Muquet, E. Biglieri, A. Goldsmith, and H. Sari. MIMO link adaptation in mobile WiMax
systems. Hong Kong, Mar. 2007.
8. R.W. Heath and A.J. Paulraj. Switching between diversity and multiplexing in mimo systems.
IEEE Transactions on Communications, 53(6):962–968, June 2005.
9. A. Hottinen, O. Tirkkonen, and R. Wichman. Multi-antenna Transceiver Techniques for 3G
and Beyond. New York, Wiley, 2003.
10. P.W. Wolniansky, G.J. Foschini, G.D. Golden, and R.A. Valenzuela. V-BLAST: an architecture
for realizing very high data rates over the rich-scattering wireless channel. In Signals, Systems,
and Electronics, 1998. ISSSE 98. 1998 URSI International Symposium on, pages 295–300, 29
Sept.–2 Oct. 1998.
11. IEEE. IEEE 802.16’s mobile multihop relay (MMR) study group. http://www.ieee802.org/
16/sg/mmr/
12. H.-Y. Wei, S. Ganguly, R. Izmailov, and Z.J. Haas. Interference-aware IEEE 802.16 WiMax
mesh networks. In Proc. IEEE Vehicular Technology Conference, June 2005.
13. J. Tao, F. Liu, Z. Zeng, and Z. Lin. Throughput enhancement in WiMax mesh networks using
concurrent transmission. In Proc. International Conference on Wireless Communications,
Networking and Mobile Computing, 2005.
14. J. Chen, C. Chi, and Q. Guo. A bandwidth allocation model with high concurrence rate in
IEEE802.16 Mesh mode. In Proc. Asia-Pacific Conference on Communications, Oct. 2005.
15. C. Schwingenschloegl, P.S. Mogre, M. Hollick, V. Dastis, and R. Steinmetz. Performance
analysis of the real-time capabilities of coordinated centralized scheduling in 802.16 mesh
mode. In Proc. IEEE Vehicular Technology Conference, May 2006.
16. D. Marabissi, D. Tarchi, F. Genovese, and R. Fantacci. A finite state modeling for adaptive
modulation in wireless OFDMA systems. Gothenburg, Sweden, Apr. 2007.
17. S. Nannicini, T. Pecorella, and L.S. Ronga. IneSiS: Integrated network protocols and signal
processing simulator. In Sixth Baiona Workshop, Vigo, Spain, 1999.
18. D. W. Matula. k-components, clusters, and slicings in graphs. SIAM Journal on Applied
Mathematics, 22(3):459–480, 1972.
19. G. Shen, R.S. Tucker, and C.-J. Chae. Fixed mobile convergence architectures for broadband
access: integration of EPON and WiMax. IEEE Communications Magazine, 45(8):44–50,
2007.
20. W.-T. Shaw, S.-W. Wong, N. Cheng, K. Balasubramanian, X. Zhu, M. Martin, and L.G.
Kazovsky. Hybrid architecture and integrated routing in a scalable optical-wireless access
network. Journal of Lightwave Technology, 25(11):3443–3451, 2007.
21. L.G. Kazovsky, W.-T. Shaw, D. Gutierrez, N. Cheng, and S.-W. Wong. Next-generation optical
access networks. Journal of Lightwave Technology, 25(11):3428–3442, 2007.
22. O.S. Yang, S.G. Choi, J.K. Choi, J.S. Park, and H.J. Kim. A handover framework for seamless
service support between wired and wireless networks. In Proc. ICACT, 2006.
300
I. Cerutti et al.
23. J. Chen, W. Jiao, and Q. Guo. An integrated QoS control architecture for IEEE 802.16 broadband wireless access systems. In Proc. IEEE GLOBECOM, 2005.
24. W. Stallings. High-speed networks and internets: performance and quality of service. Upper
Saddle River Prentice Hall, second edition, 2005.
25. R. Braden, L. Zhang, S. Berson, S. Herzog, and S. Jamin. Resource ReSerVation Protocol
(RSVP). RFC 2205, Sept. 1997. Standards Track, IETF.
26. S. Aidarous and T. Plevyak, editors. Managing IP networks : challenges and opportunities.
New York, IEEE Press, 2003.
27. A. Farrel and I. Bryskin. GMPLS : Architecture and applications. Morgan Kaufmann, 2005.
28. H.-s. Chueh and K. Wang. An all-MPLS approach for UMTS 3G core networks. In Proc.
IEEE Vehicular Technology Conference, 2003.
29. Ed. F. Le Faucheur. Multi-Protocol Label Switching (MPLS) Support of Differentiated Services. RFC 3270, May 2002. Standards Track, IETF.