/


Текст
THE STATE OF
FOOD SECURITY
AND NUTRITION
IN THE WORLD
TRANSFORMING FOOD SYSTEMS
FOR FOOD SECURITY, IMPROVED NUTRITION
AND AFFORDABLE HEALTHY DIETS FOR ALL
This flagship publication is part of The State of the World series of the Food and Agriculture Organization
of the United Nations.
Required citation:
FAO, IFAD, UNICEF, WFP and WHO. 2021. The State of Food Security and Nutrition in the World 2021.
Transforming food systems for food security, improved nutrition and affordable healthy diets for all. Rome, FAO.
https://doi.org/10.4060/cb4474en
The designations employed and the presentation of material in this information product do not imply the expression of any
opinion whatsoever on the part of the Food and Agriculture Organization of the United Nations (FAO), the International Fund
for Agricultural Development (IFAD), the United Nations Children’s Fund (UNICEF), the World Food Programme (WFP) or the
World Health Organization (WHO) concerning the legal or development status of any country, territory, city or area or of its
authorities, or concerning the delimitation of its frontiers or boundaries. The mention of specific companies or products of
manufacturers, whether or not these have been patented, does not imply that these have been endorsed or recommended by
FAO, IFAD, UNICEF, WFP or WHO in preference to others of a similar nature that are not mentioned.
The designations employed and the presentation of material in the maps do not imply the expression of any opinion
whatsoever on the part of FAO, IFAD, UNICEF, WFP or WHO concerning the legal or constitutional status of any country,
territory or sea area, or concerning the delimitation of frontiers.
All reasonable precautions have been taken by FAO, IFAD, UNICEF, WFP and WHO to verify the information contained in this
publication. However, the published material is being distributed without warranty of any kind, either expressed or implied.
The responsibility for the interpretation and use of the material lies with the reader. In no event shall FAO, IFAD, UNICEF, WFP
and WHO be liable for damages arising from its use.
ISSN 2663-8061 (print)
ISSN 2663-807X (online)
ISBN 978-92-5-134325-8
© FAO 2021
Some rights reserved. This work is made available under the Creative Commons Attribution-NonCommercial-ShareAlike 3.0
IGO licence (CC BY-NC-SA 3.0 IGO; https://creativecommons.org/licenses/by-nc-sa/3.0/igo).
Under the terms of this licence, this work may be copied, redistributed and adapted for non-commercial purposes, provided
that the work is appropriately cited. In any use of this work, there should be no suggestion that FAO endorses any specific
organization, products or services. The use of the FAO logo is not permitted. If the work is adapted, then it must be licensed
under the same or equivalent Creative Commons licence. If a translation of this work is created, it must include the following
disclaimer along with the required citation: “This translation was not created by the Food and Agriculture Organization of the
United Nations (FAO). FAO is not responsible for the content or accuracy of this translation. The original English edition shall
be the authoritative edition.”
Any mediation relating to disputes arising under the licence shall be conducted in accordance with the Arbitration Rules of
the United Nations Commission on International Trade Law (UNCITRAL) as at present in force.
Third-party materials. Users wishing to reuse material from this work that is attributed to a third party, such as tables,
figures or images, are responsible for determining whether permission is needed for that reuse and for obtaining permission
from the copyright holder. The risk of claims resulting from infringement of any third-party-owned component in the work
rests solely with the user.
Sales, rights and licensing. FAO information products are available on the FAO website
(www.fao.org/publications) and can be purchased through publications-sales@fao.org.
Requests for commercial use should be submitted via: www.fao.org/contact-us/licence-request.
Queries regarding rights and licensing should be submitted to: copyright@fao.org.
COVER PHOTOGRAPH ©John Keates / Alamy Stock Photo
VIET NAM. A woman with a traditional conical hat selling fruit on the beach.
ISSN 2663-8061
THE STATE OF
FOOD SECURITY
AND NUTRITION
IN THE WORLD
TRANSFORMING FOOD SYSTEMS FOR FOOD
SECURITY, IMPROVED NUTRITION AND
AFFORDABLE HEALTHY DIETS FOR ALL
Food and Agriculture Organization of the United Nations
Rome, 2021
CONTENTS
FOREWORD
METHODOLOGY
ACKNOWLEDGEMENTS
ACRONYMS AND ABBREVIATIONS
KEY MESSAGES
EXECUTIVE SUMMARY
CHAPTER 1
INTRODUCTION
CHAPTER 2
FOOD SECURITY AND NUTRITION AROUND
THE WORLD
ANNEXES
vi
viii
ix
xi
xii
xv
ANNEX 1A
Statistical tables to Chapter 2
Methodological notes for the food security
and nutrition indicators
Country exposure to the drivers and PoU
change point analysis in Chapter 3
2.1 Food security indicators – latest updates
and progress towards ending hunger and ensuring
food security
8
38
CHAPTER 3
MAJOR DRIVERS OF RECENT FOOD SECURITY
AND NUTRITION TRENDS
52
3.2 Impact of major drivers on food security
and nutrition
60
Country group definitions and lists of countries
affected by drivers in Chapter 3
Country group definitions for the analysis
of food insecurity and drivers in 2020
CHAPTER 5
CONCLUSION
125
186
ANNEX 6
4.1 Six pathways to address major drivers behind
recent food security and nutrition trends
87
109
181
ANNEX 5
CHAPTER 4
WHAT NEEDS TO BE DONE TO TRANSFORM FOOD
SYSTEMS FOR FOOD SECURITY, IMPROVED
NUTRITION AND AFFORDABLE HEALTHY DIETS? 85
4.2 Building coherent portfolios of policies
and investments
179
ANNEX 4
51
3.1 A food systems lens is critical to address
the major drivers of recent food security and
nutrition trends
170
ANNEX 3
7
2.3 Ending hunger and all forms of malnutrition
by 2030
156
ANNEX 2
Methodologies Chapter 2
29
130
ANNEX 1B
1
2.2 Nutrition indicators – latest updates and
progress towards global nutrition targets
129
| ii |
Glossary
188
NOTES
194
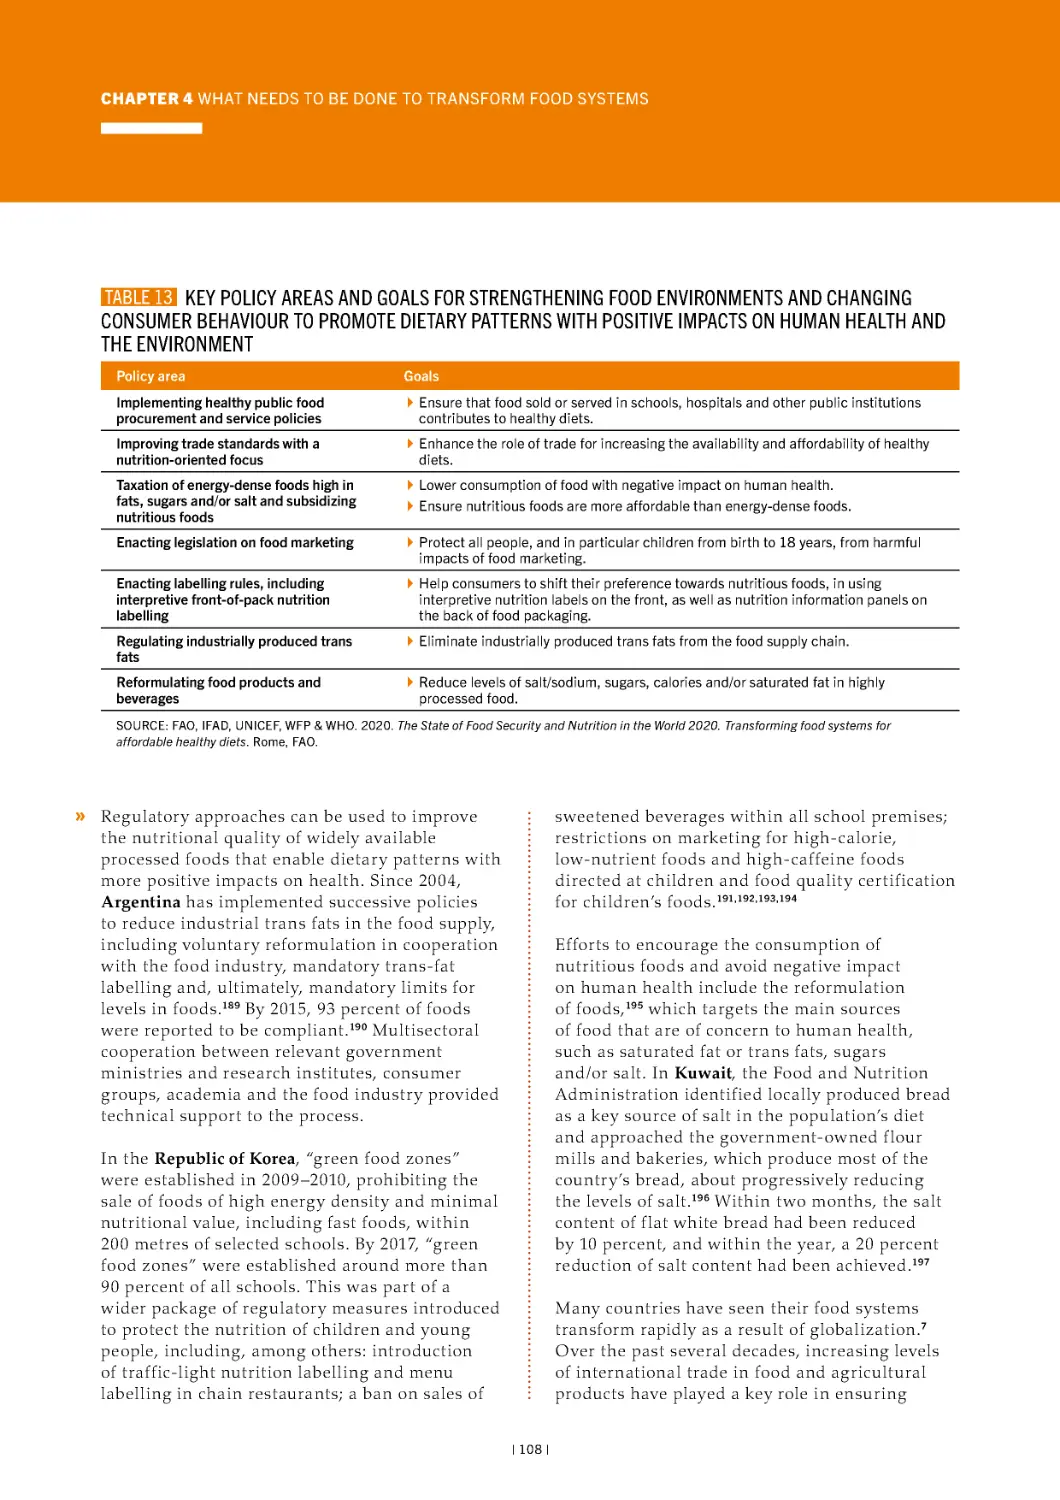
13 Key policy areas and goals for strengthening food
TABLES
environments and changing consumer behaviour to
promote dietary patterns with positive impacts on
human health and the environment
1 Prevalence of undernourishment (PoU) in the
world, 2005–2020
11
2 Number of undernourished people in the world,
2005–2020
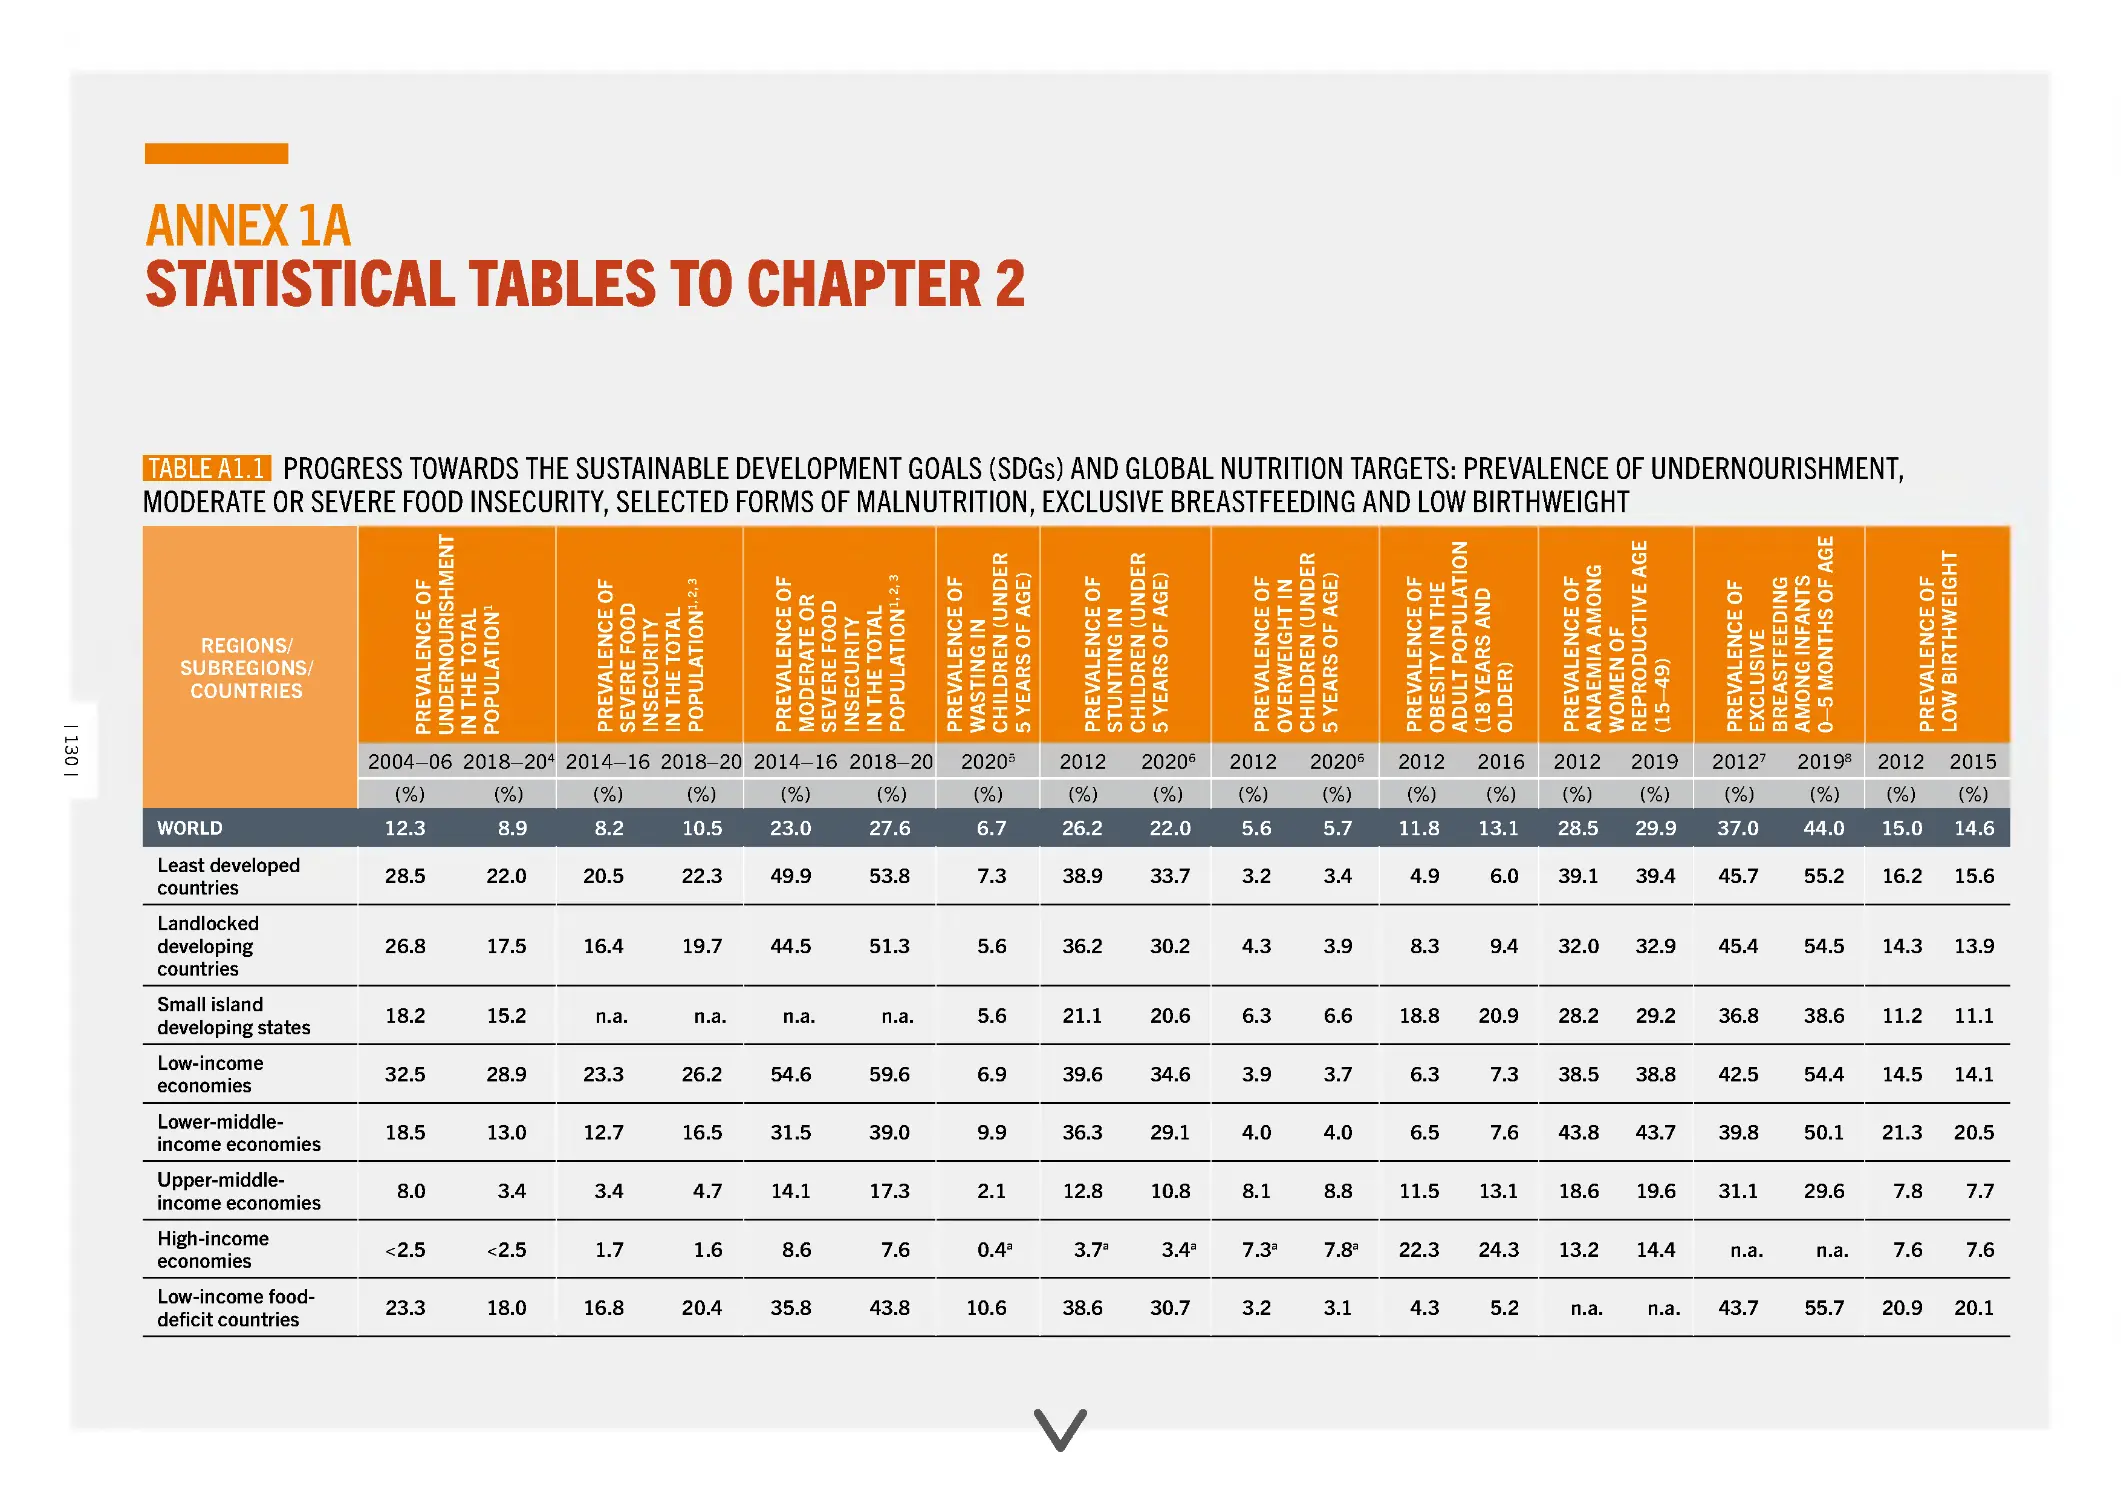
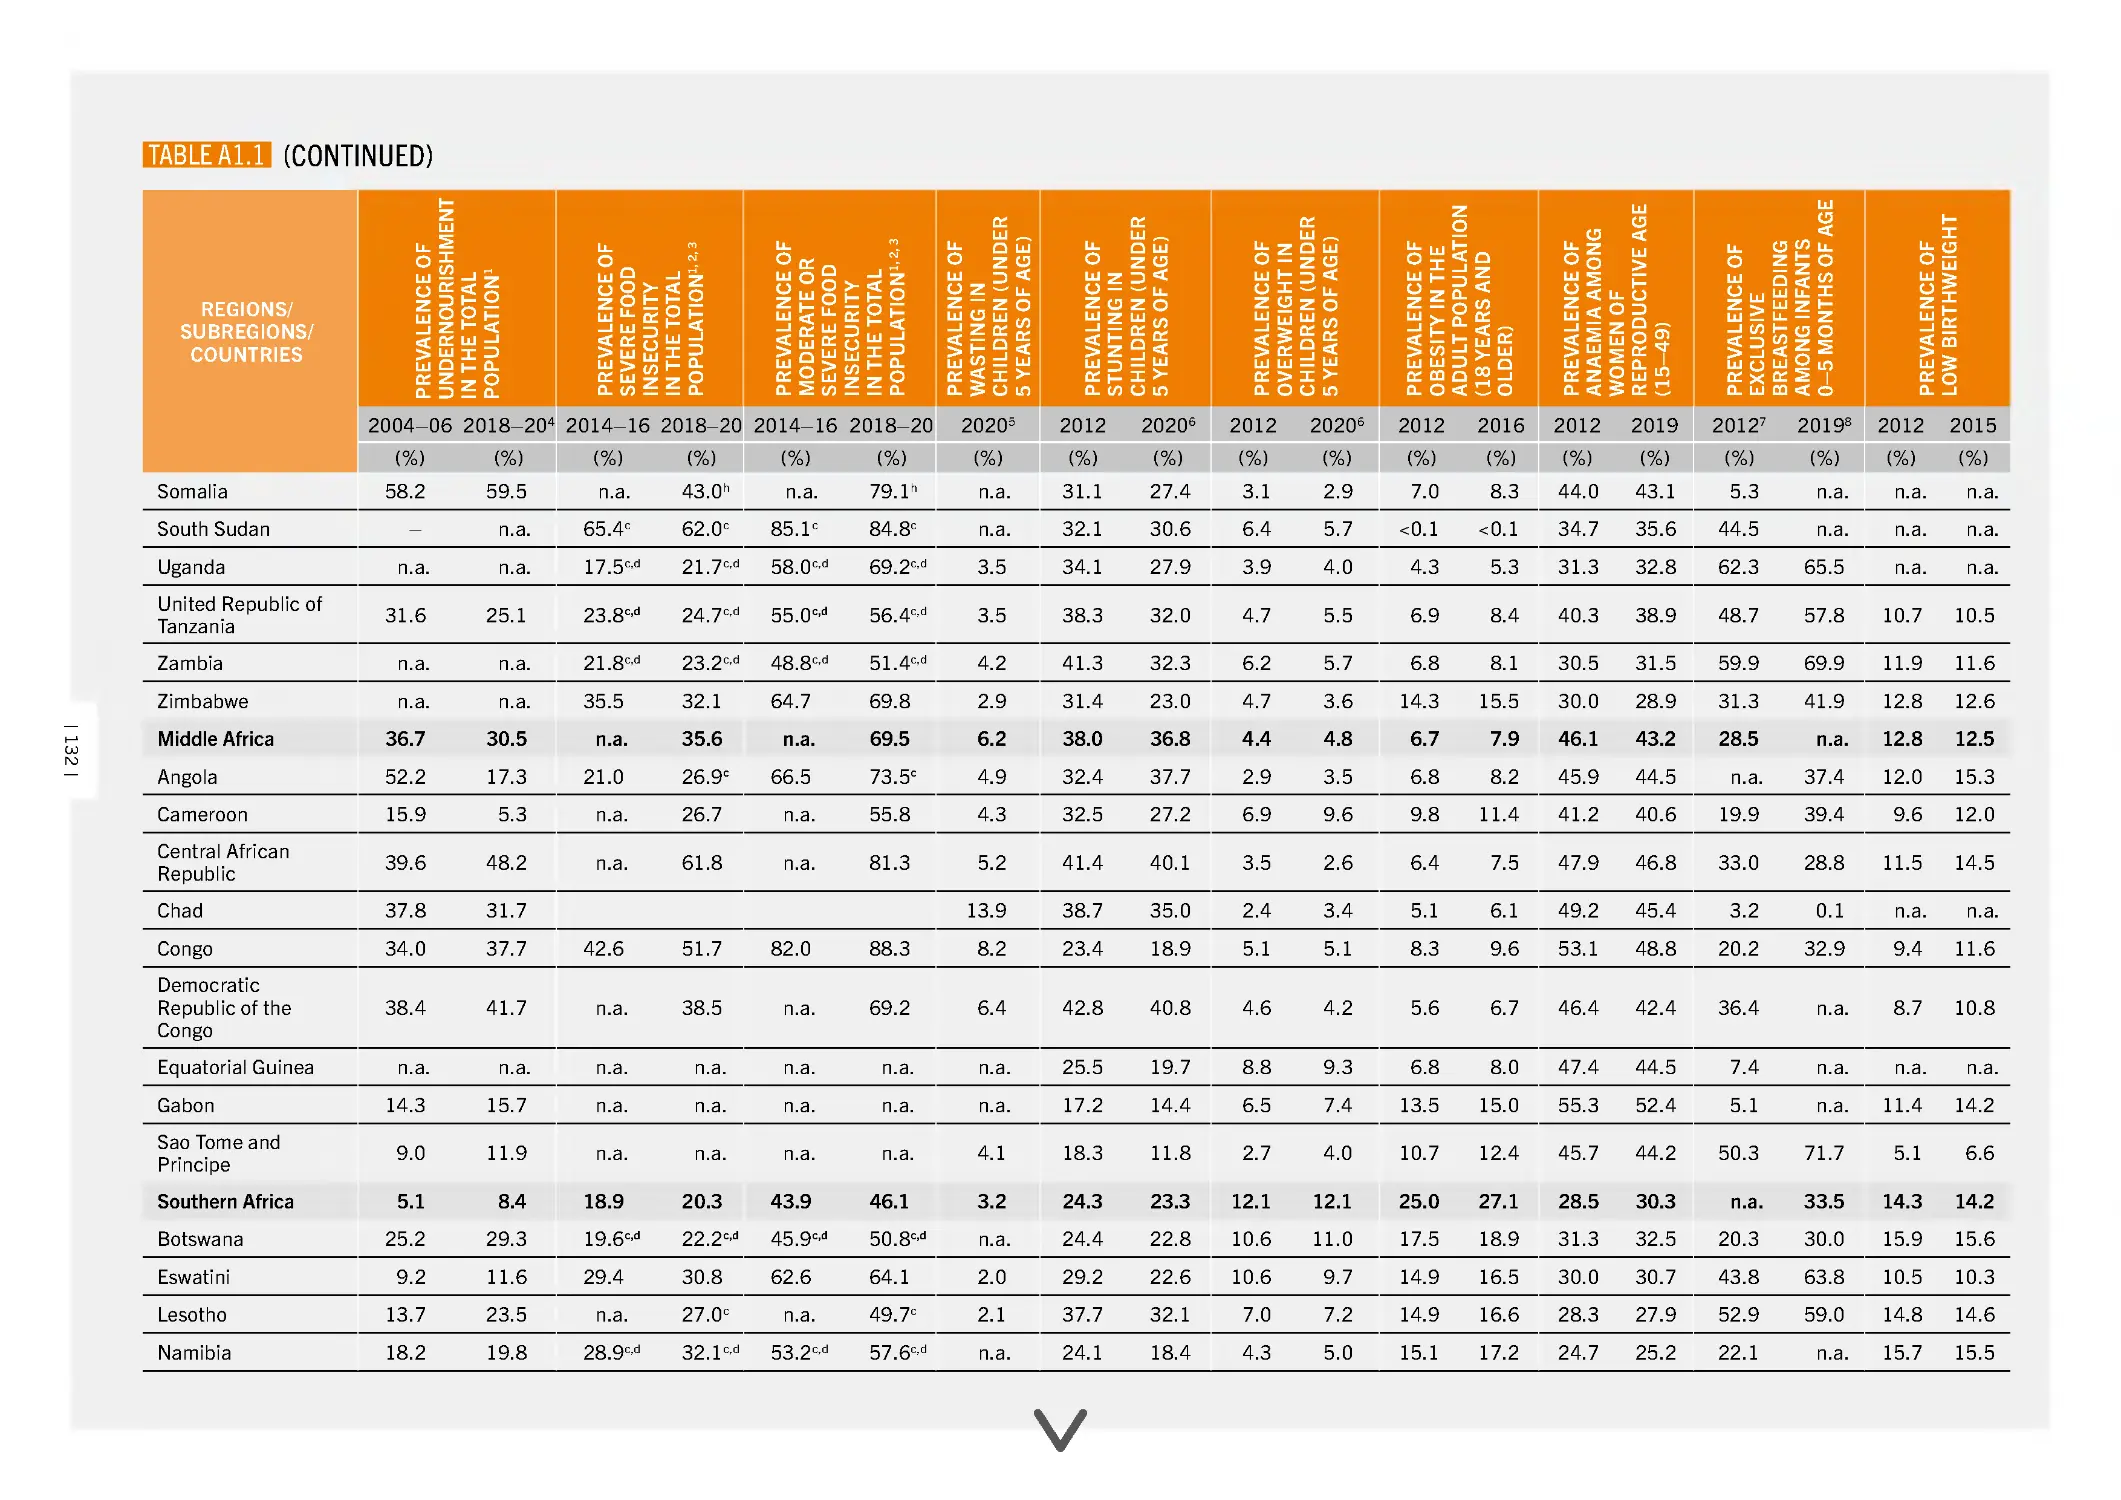
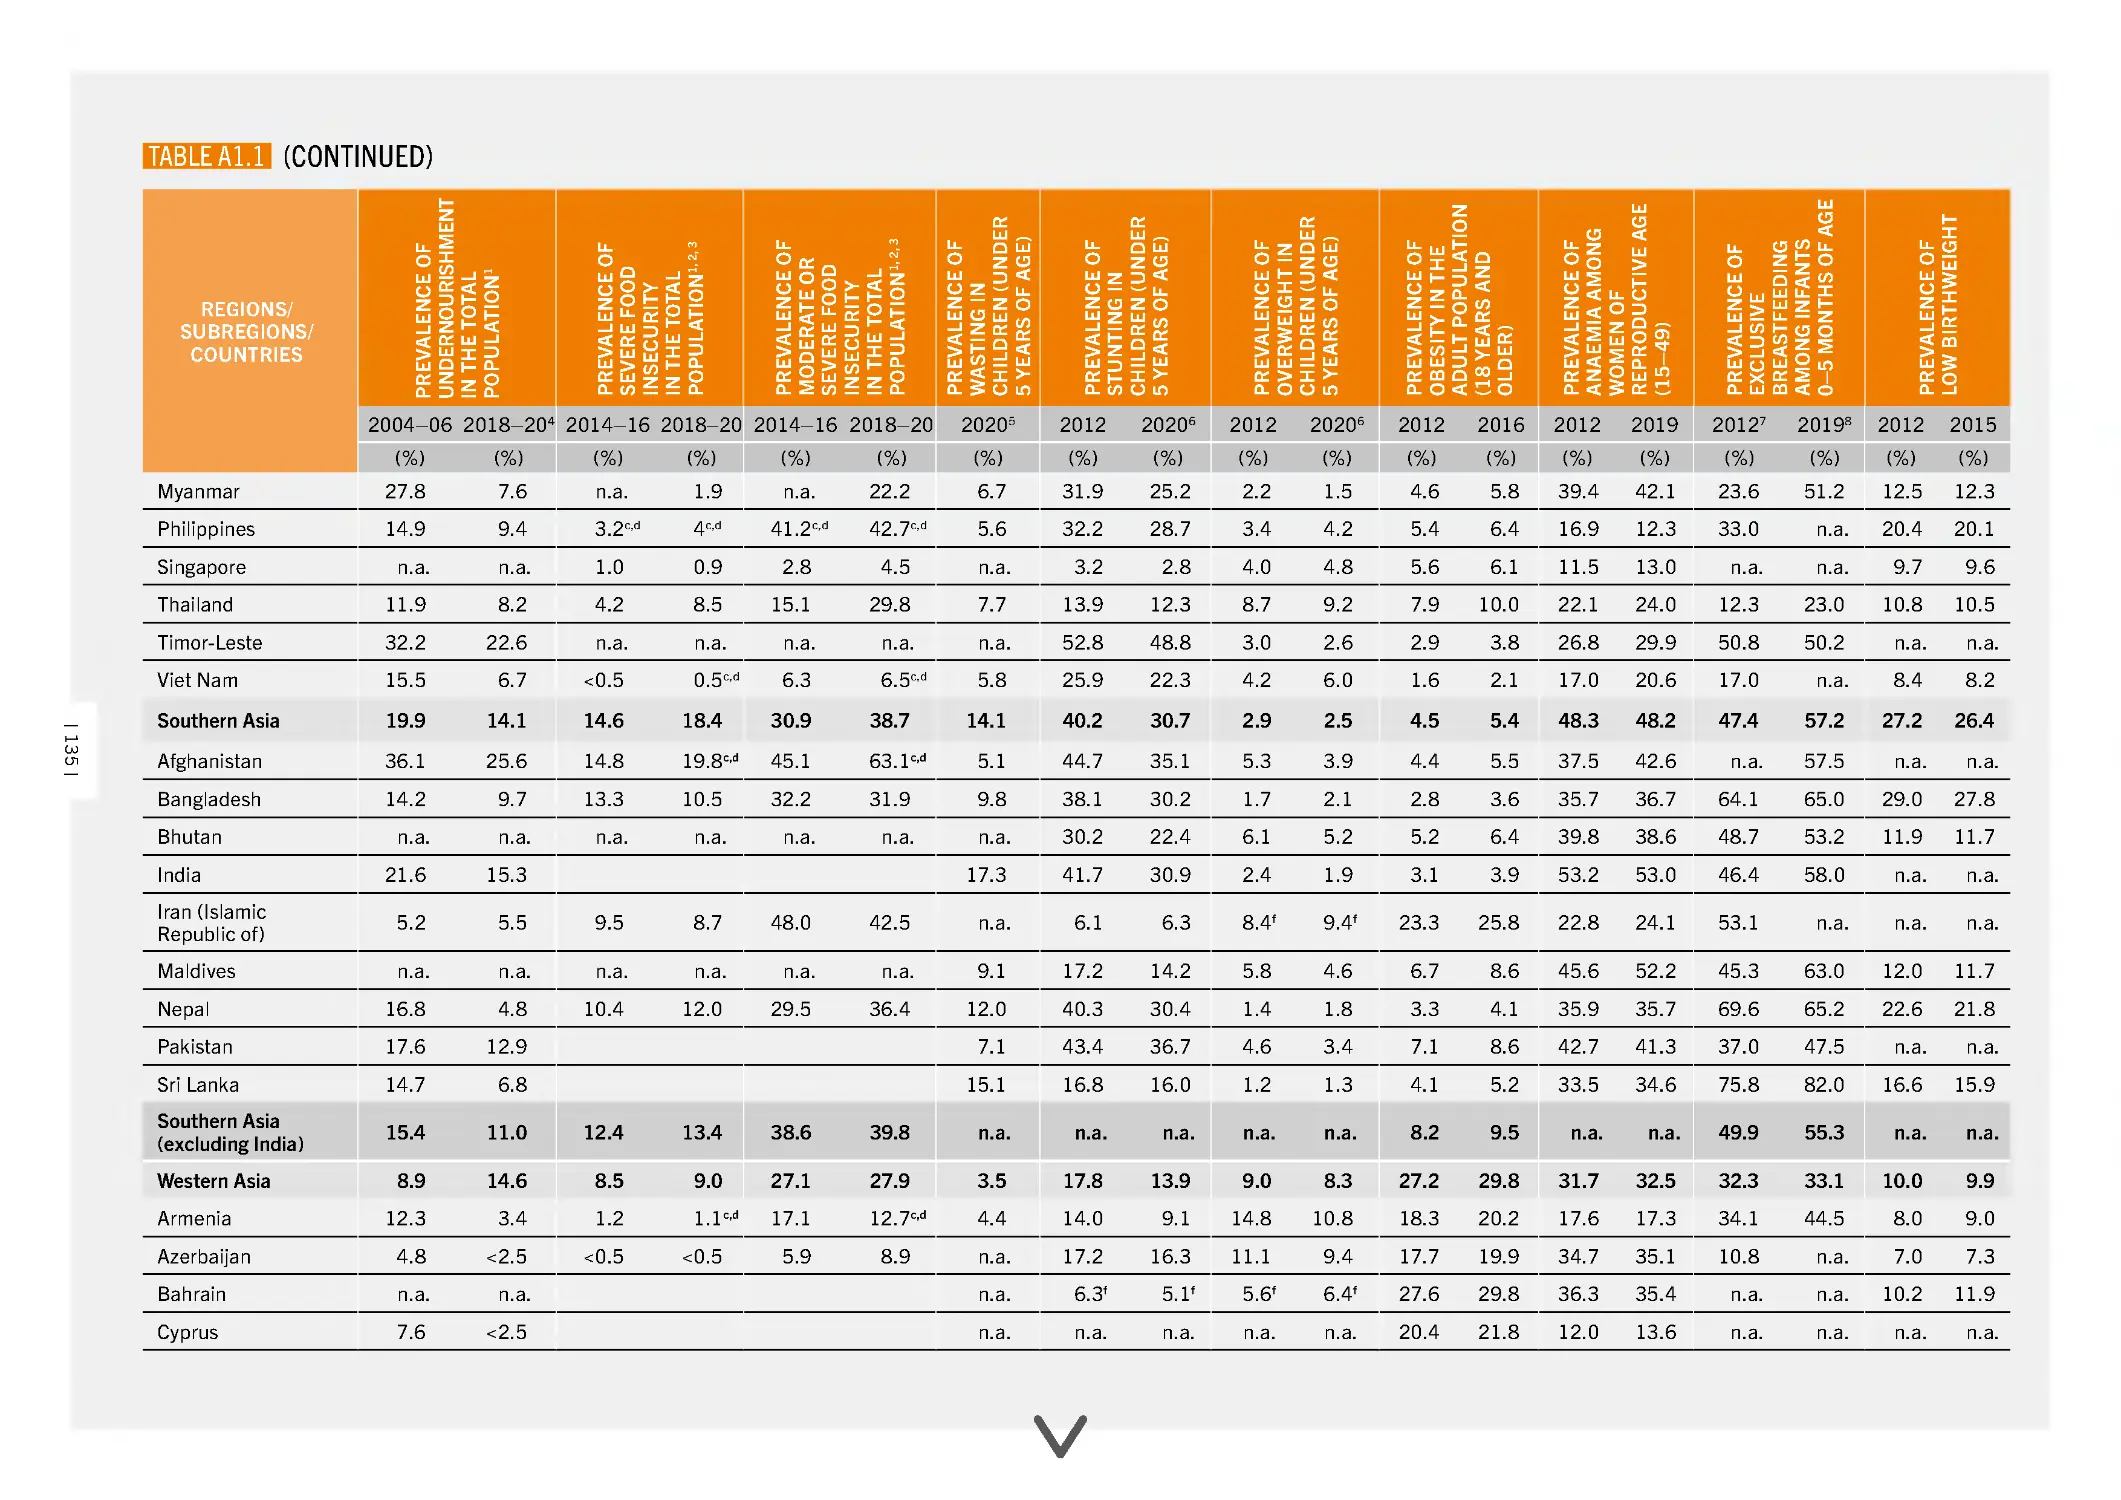
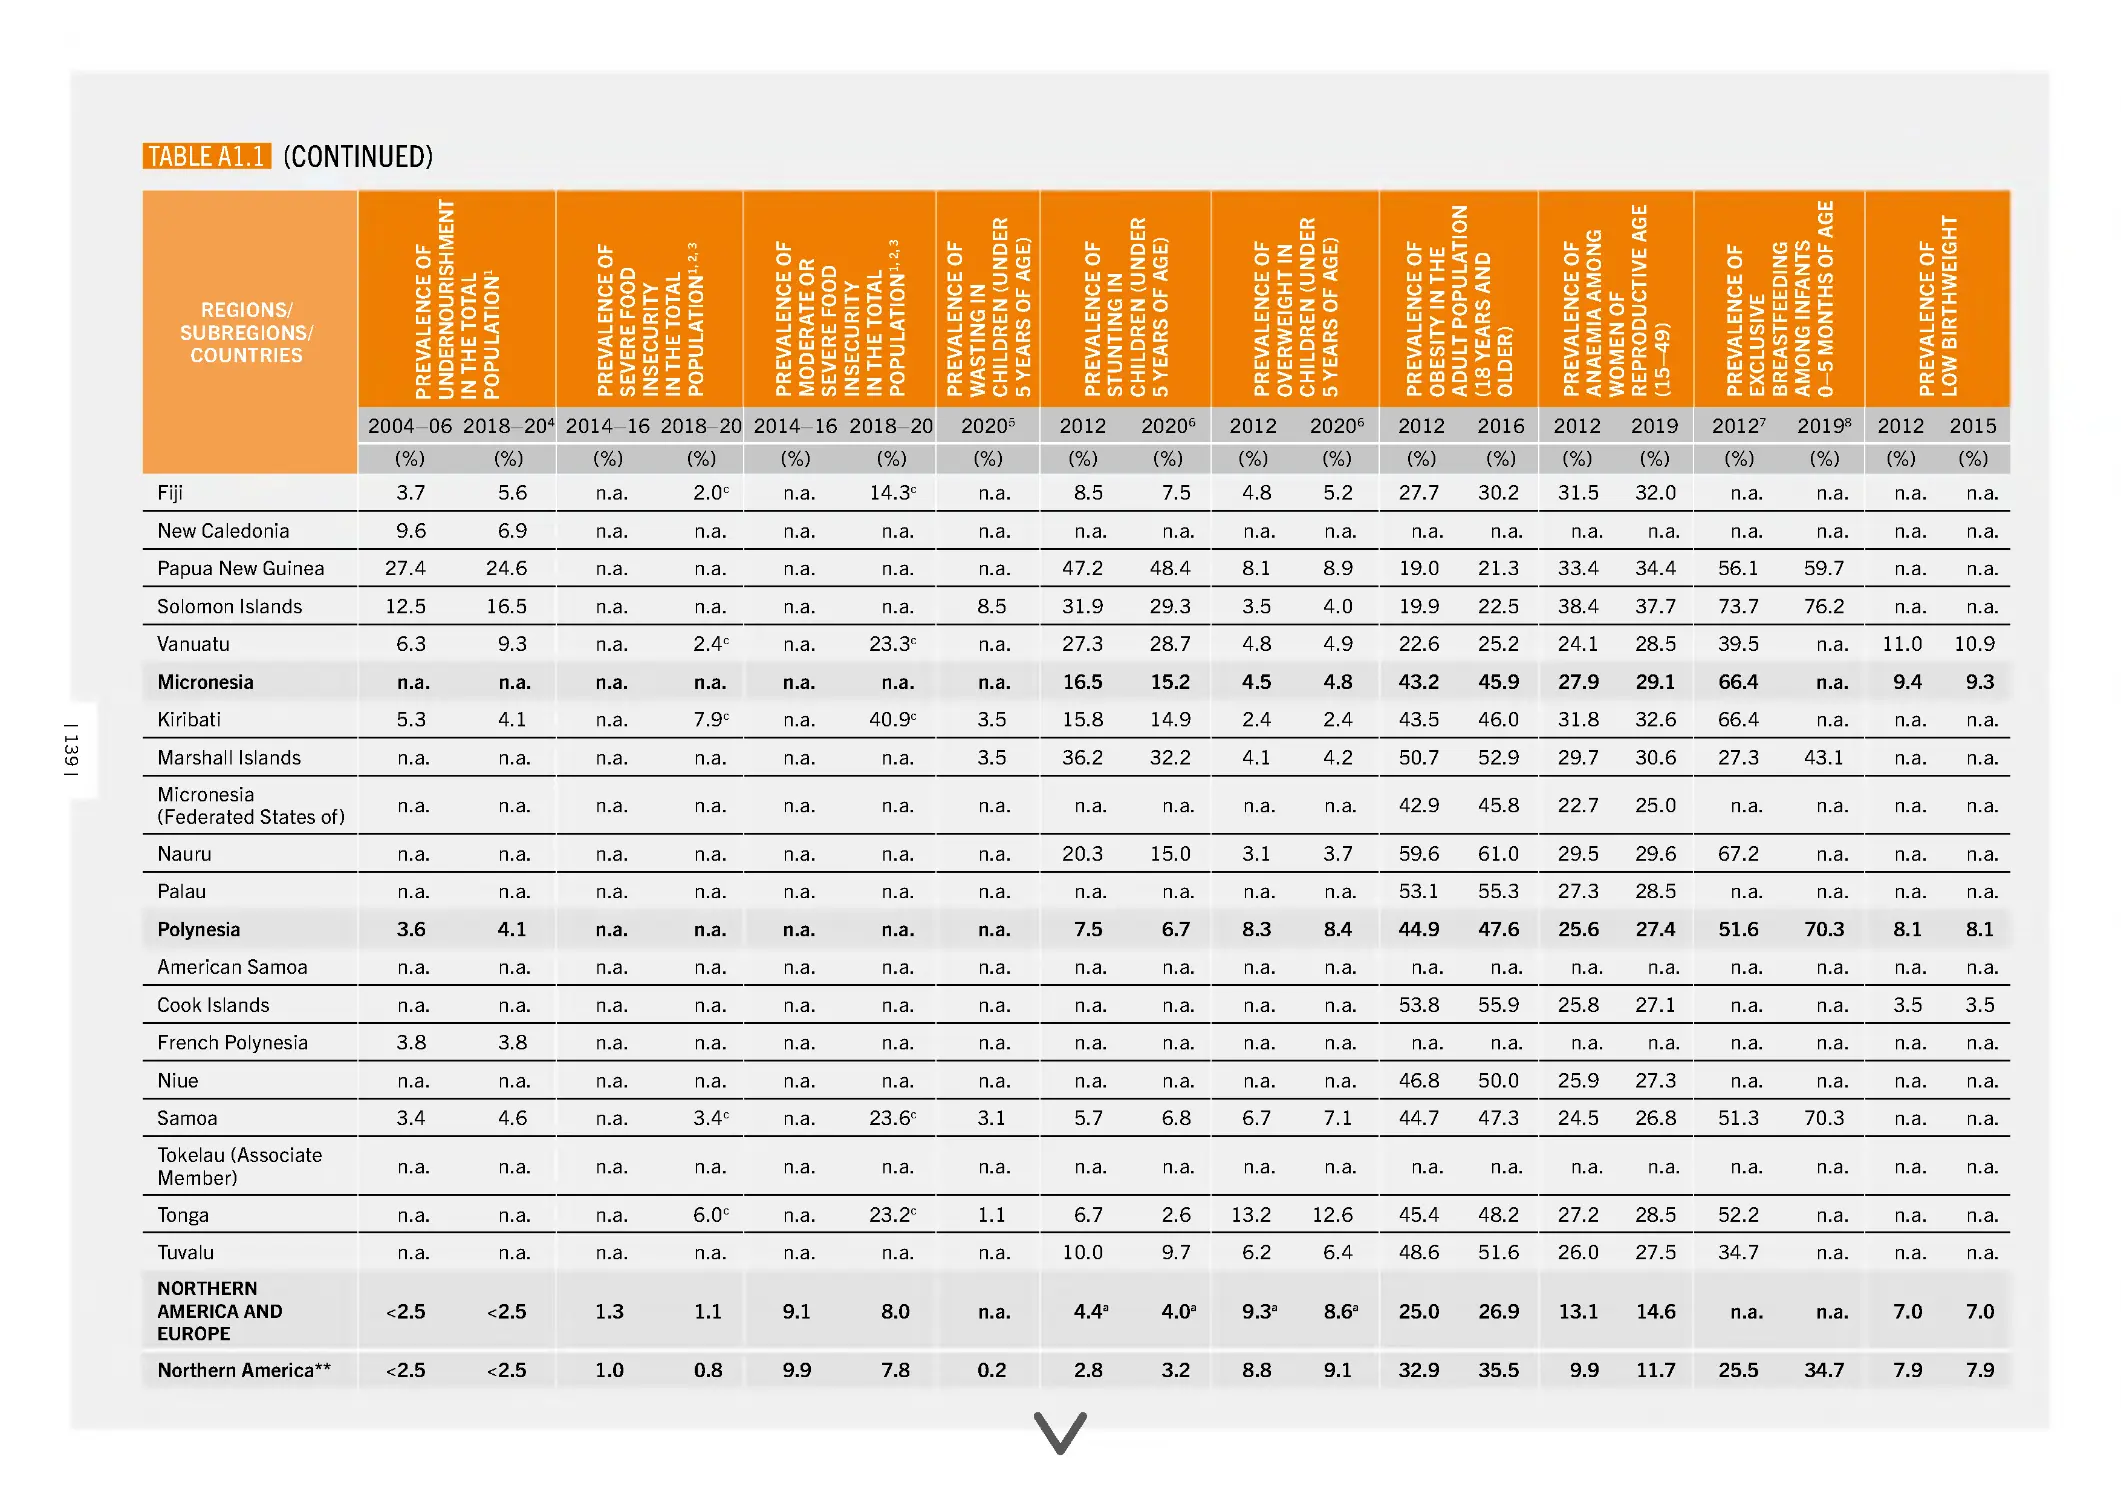
A1.1 Progress towards the Sustainable Development
12
Goals (SDGs) and global nutrition targets: Prevalence
of undernourishment, moderate or severe food
insecurity, selected forms of malnutrition, exclusive
breastfeeding and low birthweight
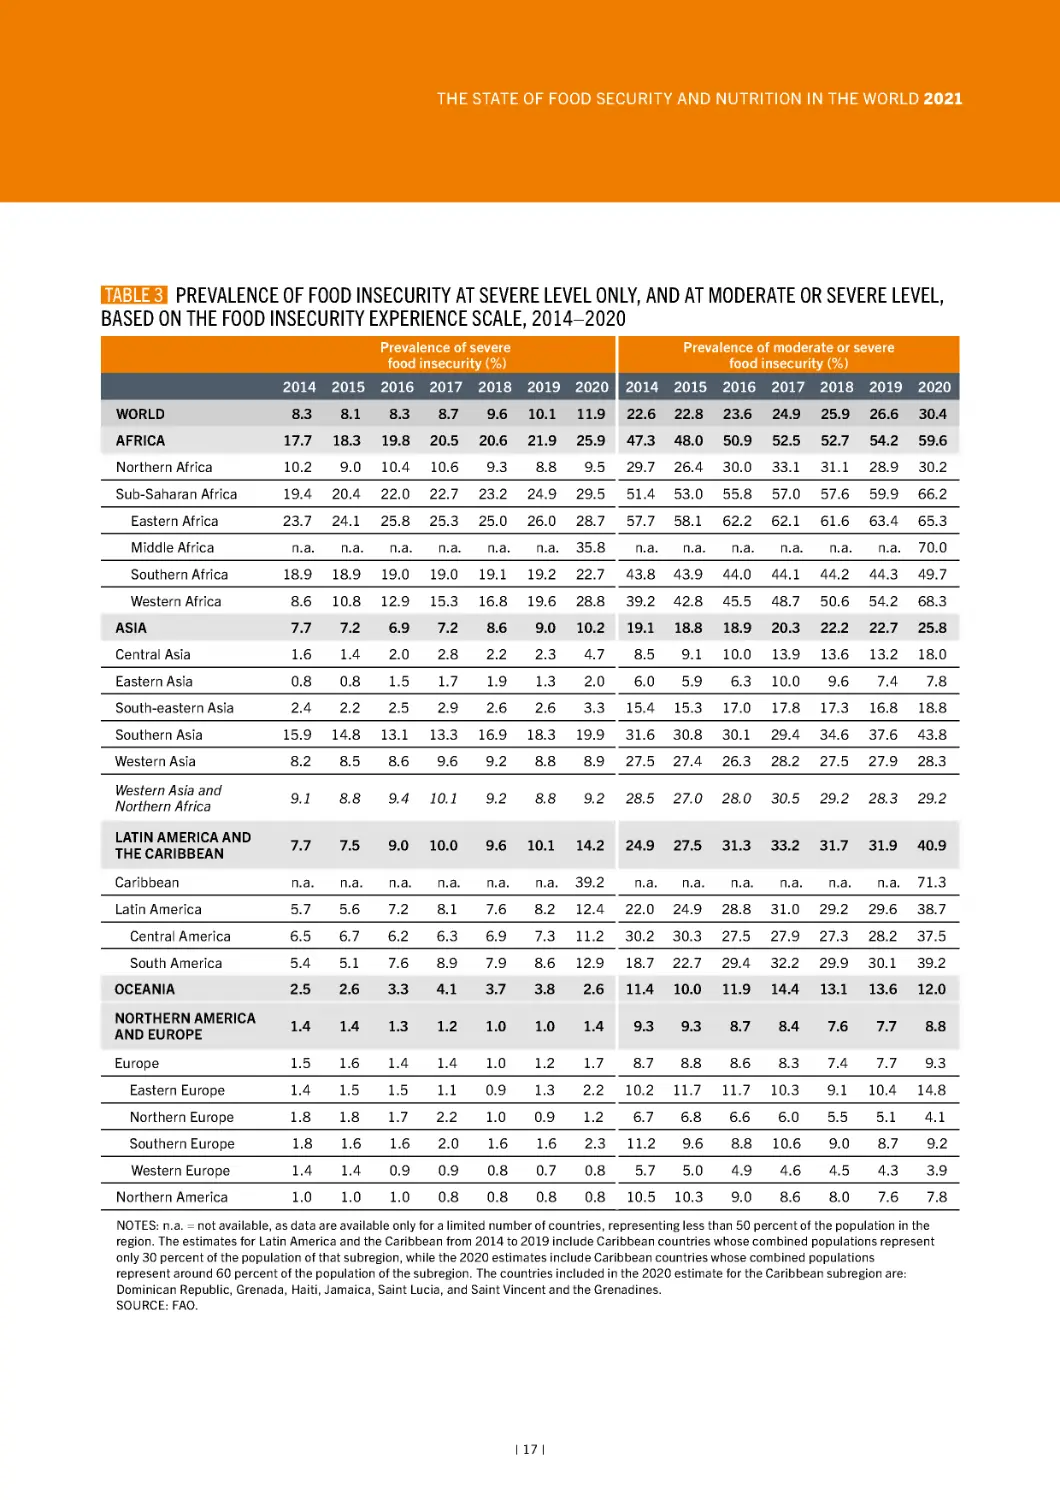
3 Prevalence of food insecurity at severe level only,
and at moderate or severe level, based on the Food
Insecurity Experience Scale, 2014–2020
17
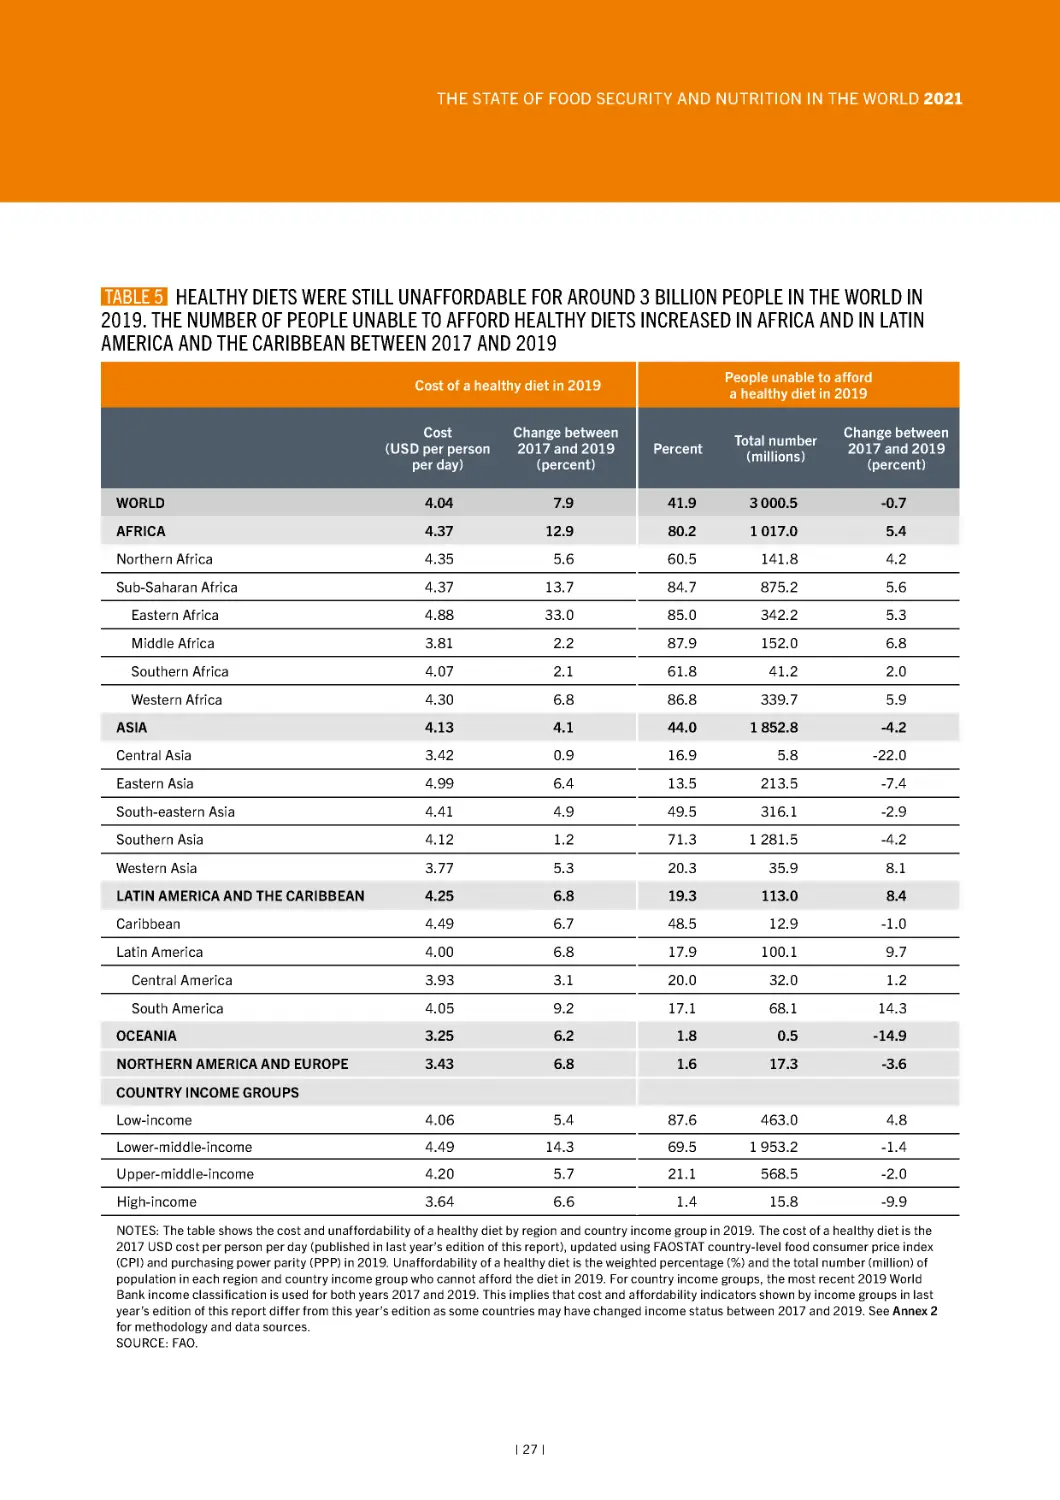
5 Healthy diets were still unaffordable for around
3 billion people in the world in 2019. The number of
people unable to afford healthy diets increased in
Africa and in Latin America and the Caribbean
between 2017 and 2019
18
27
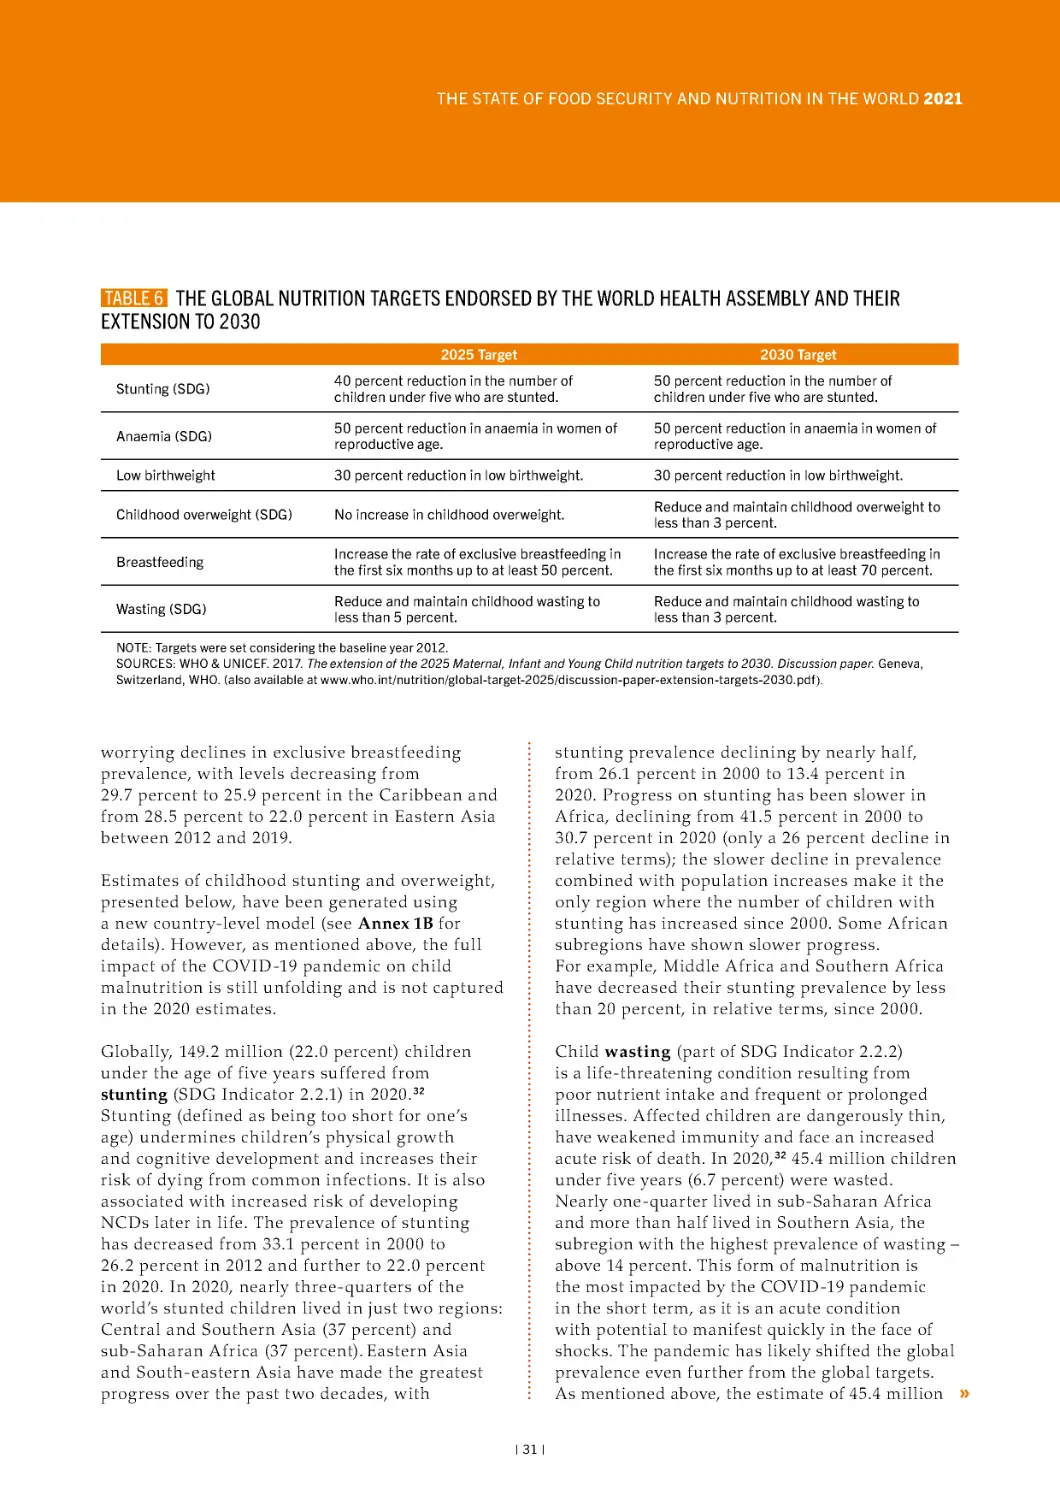
6 The global nutrition targets endorsed by the World
Health Assembly and their extension to 2030
130
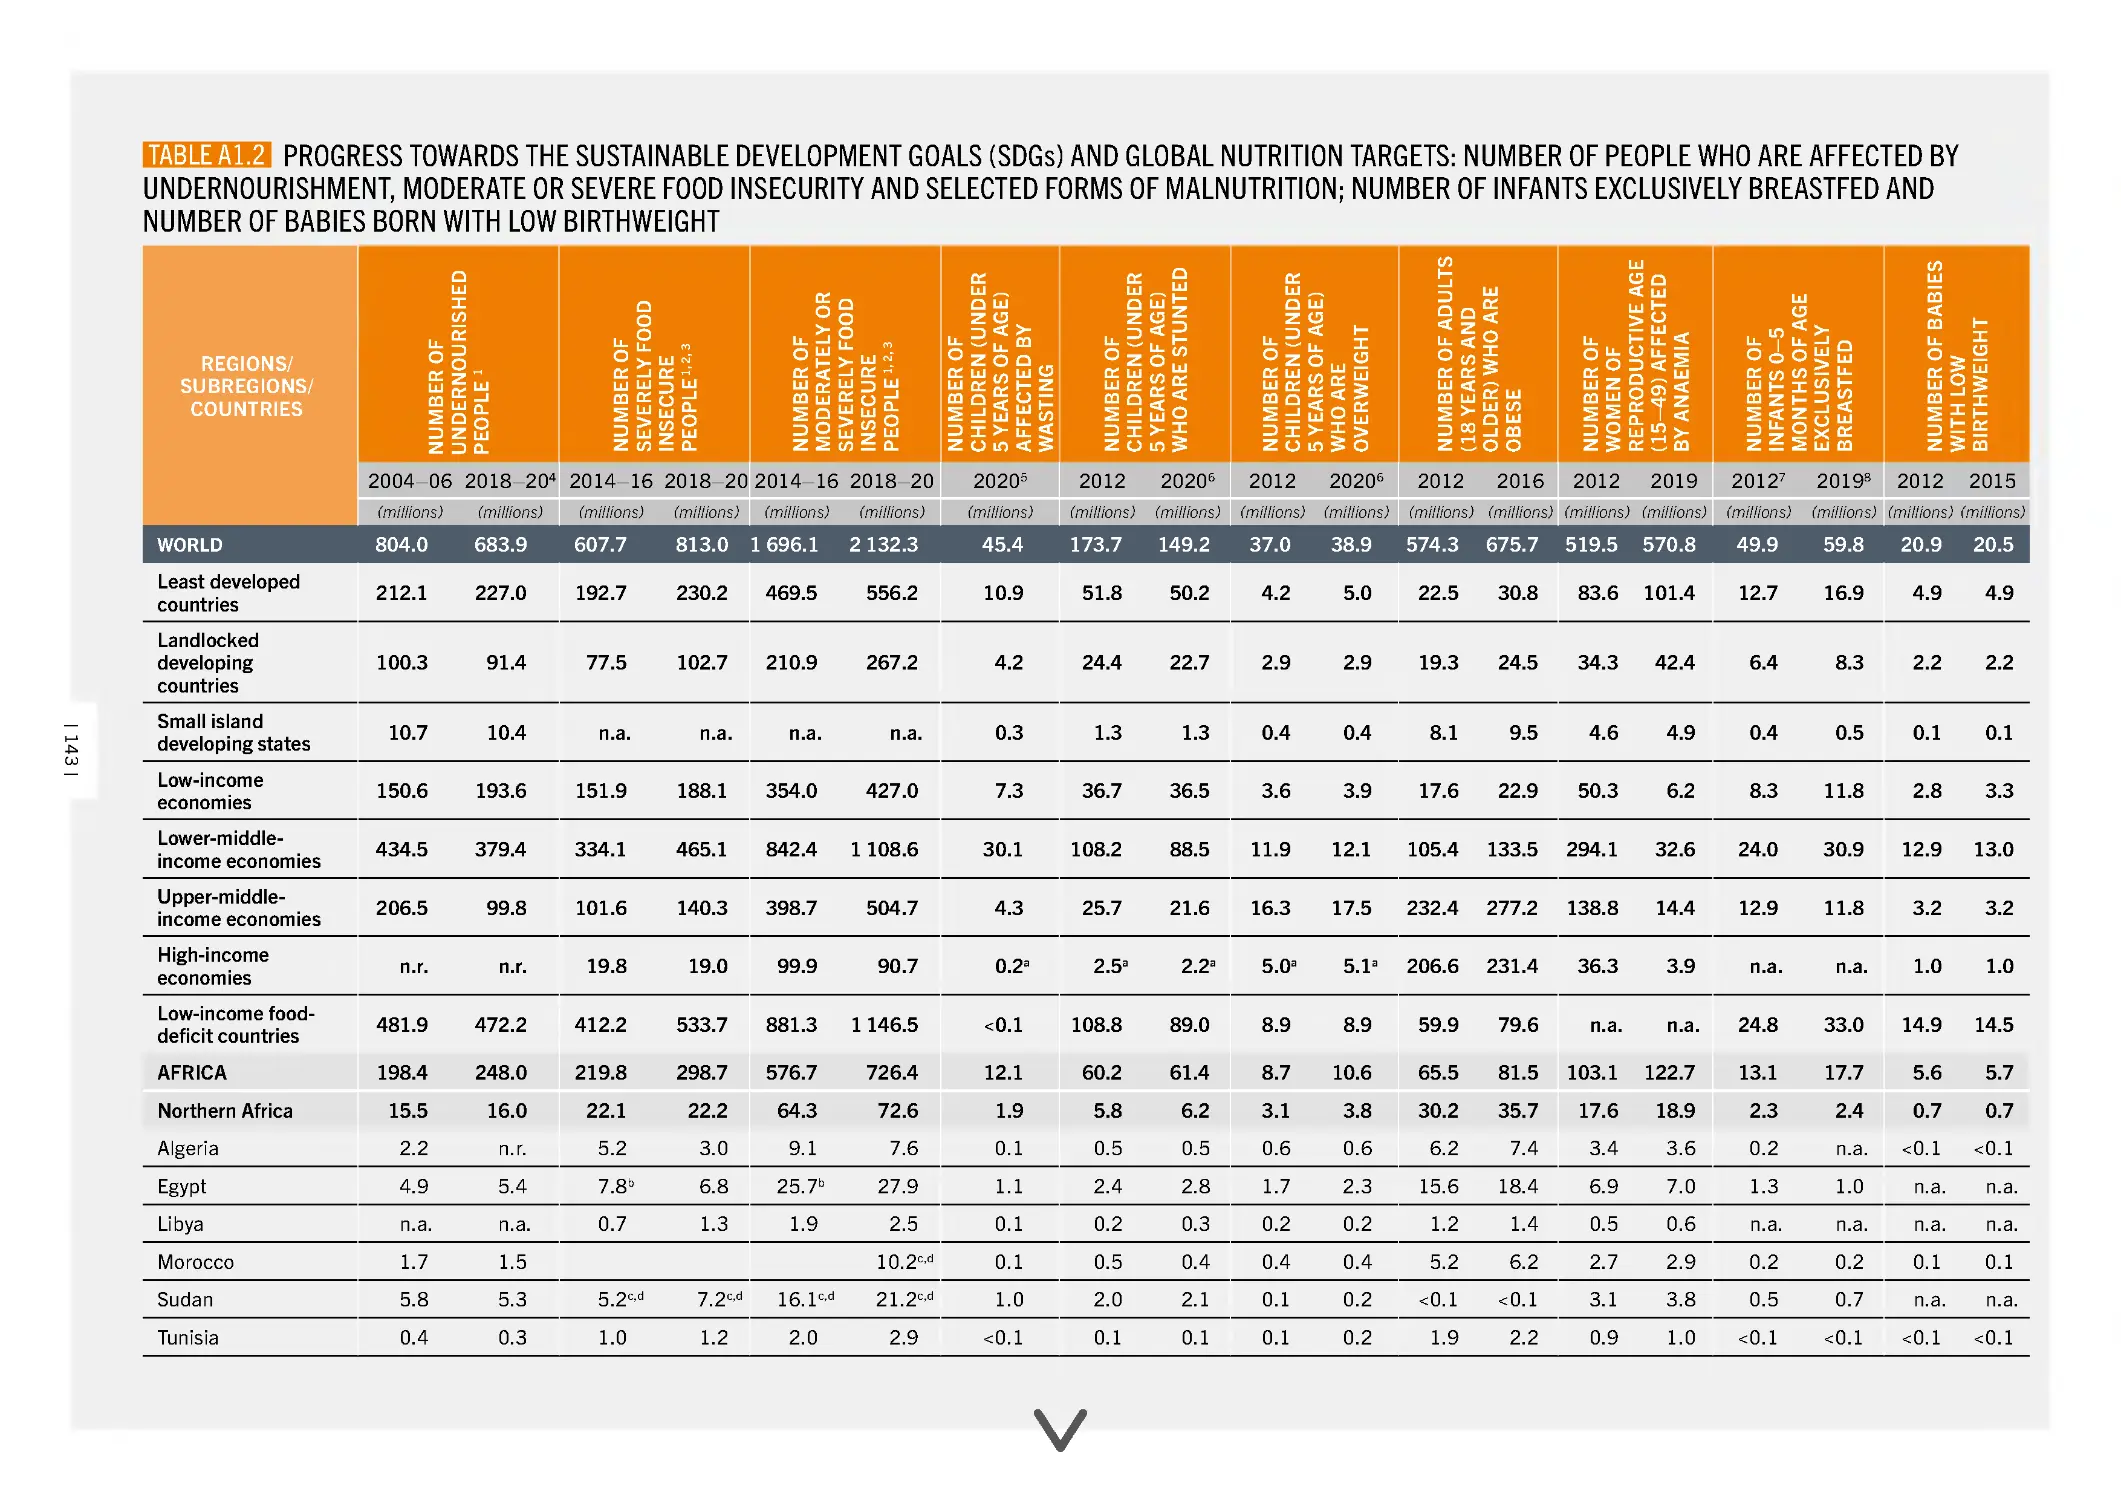
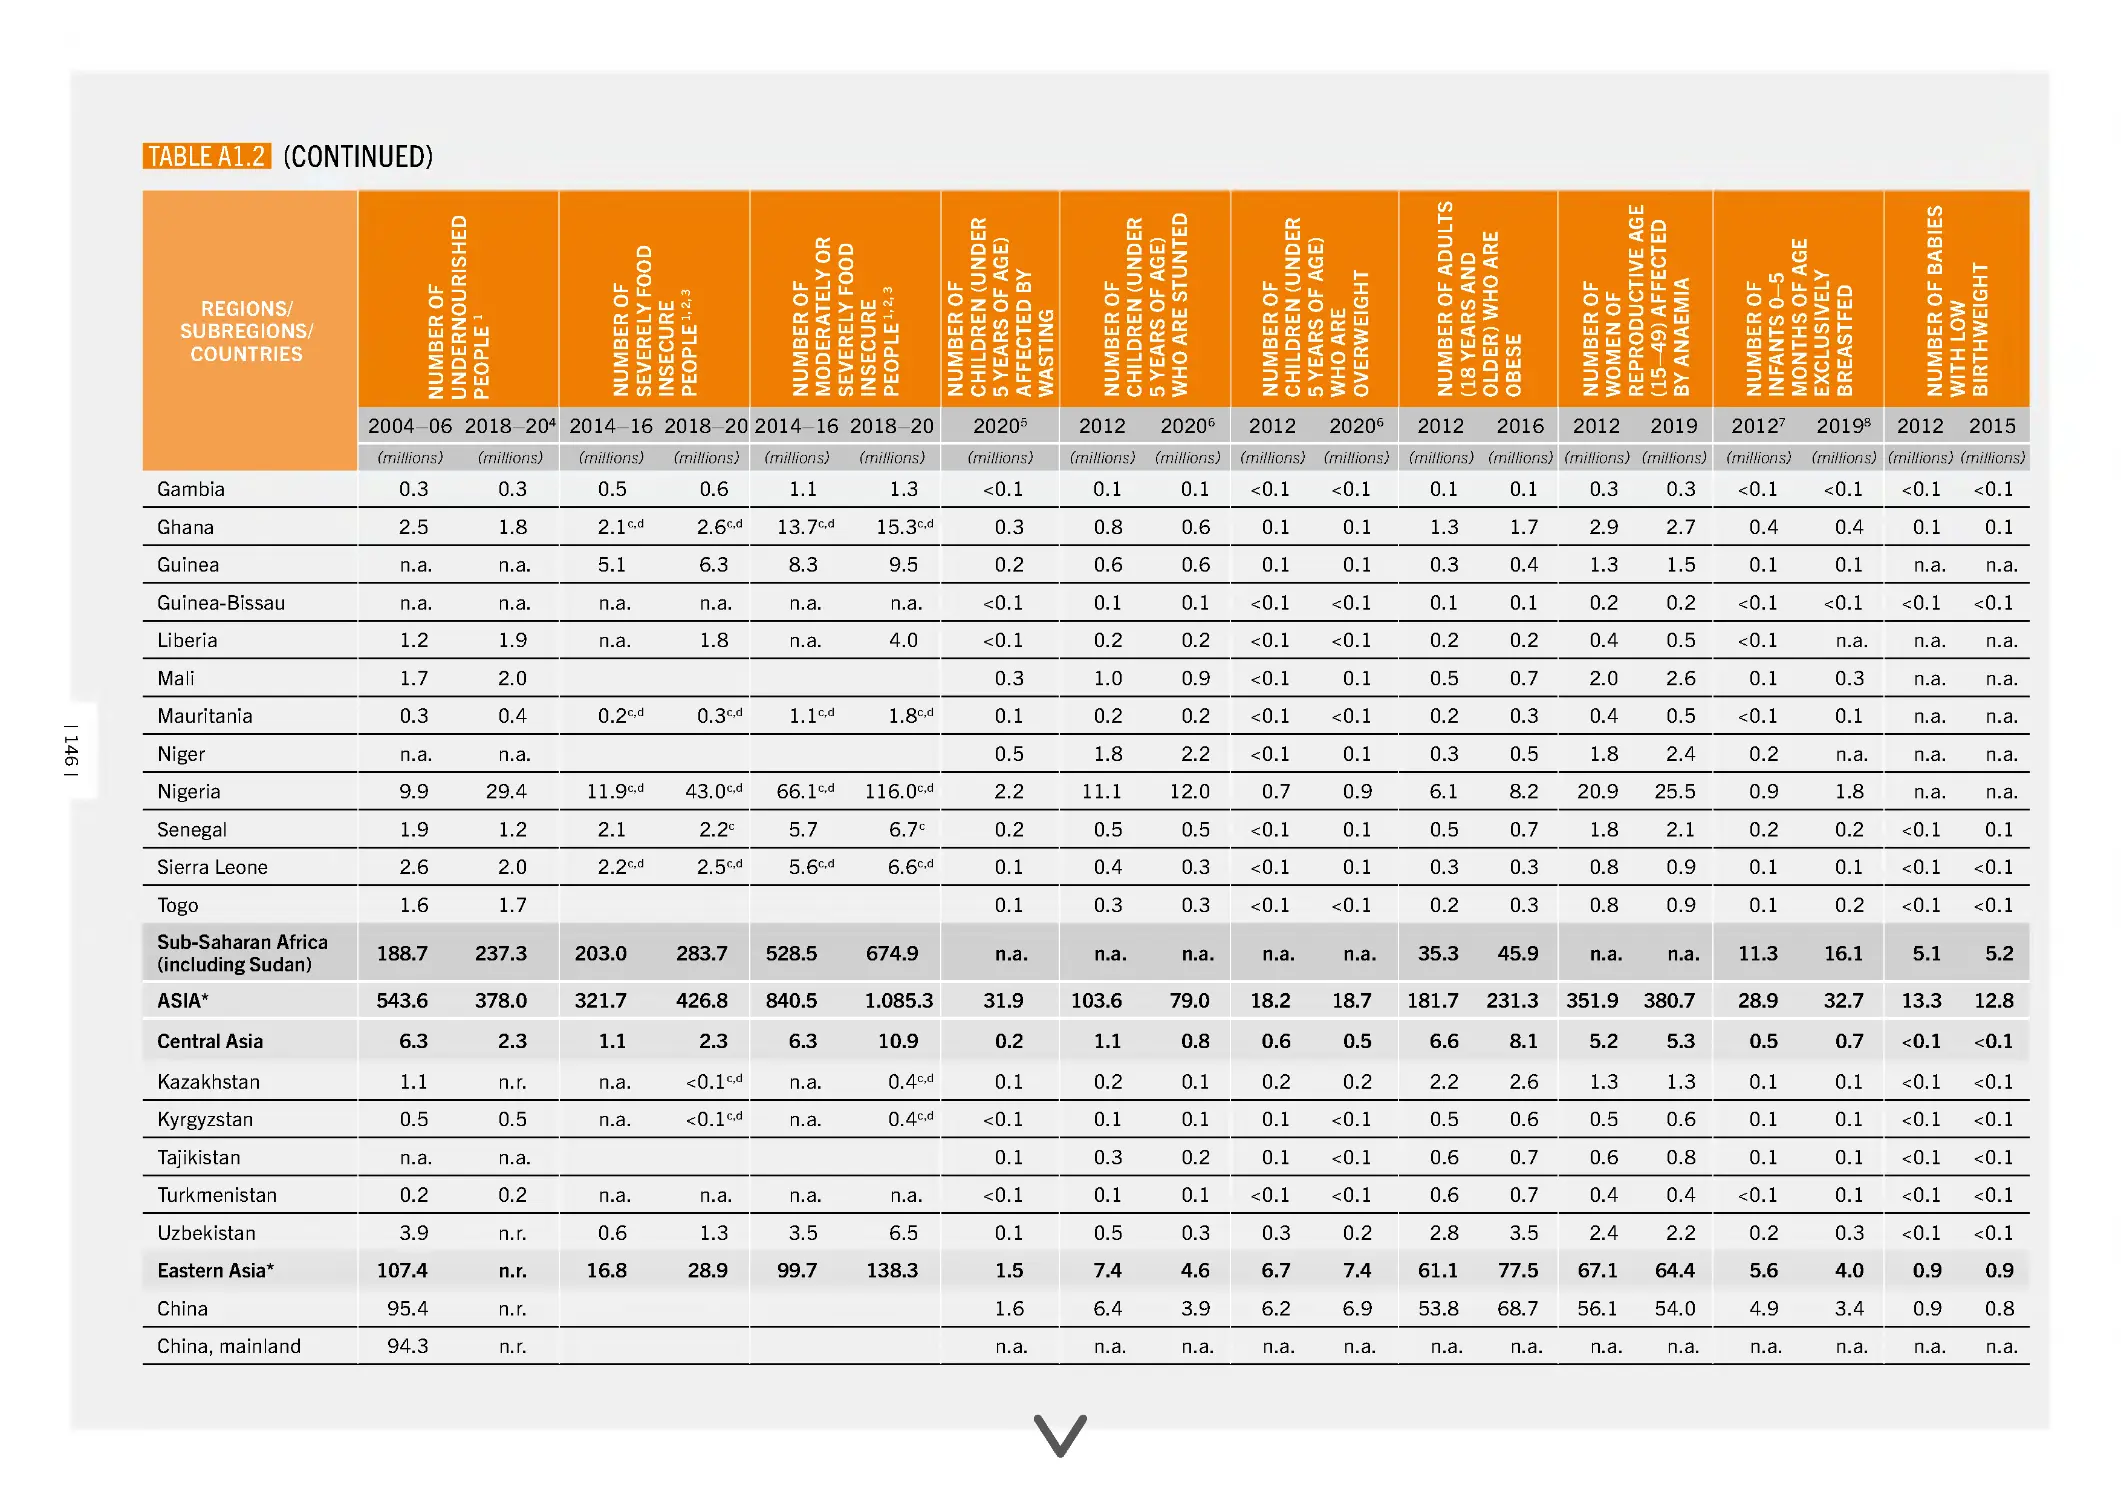
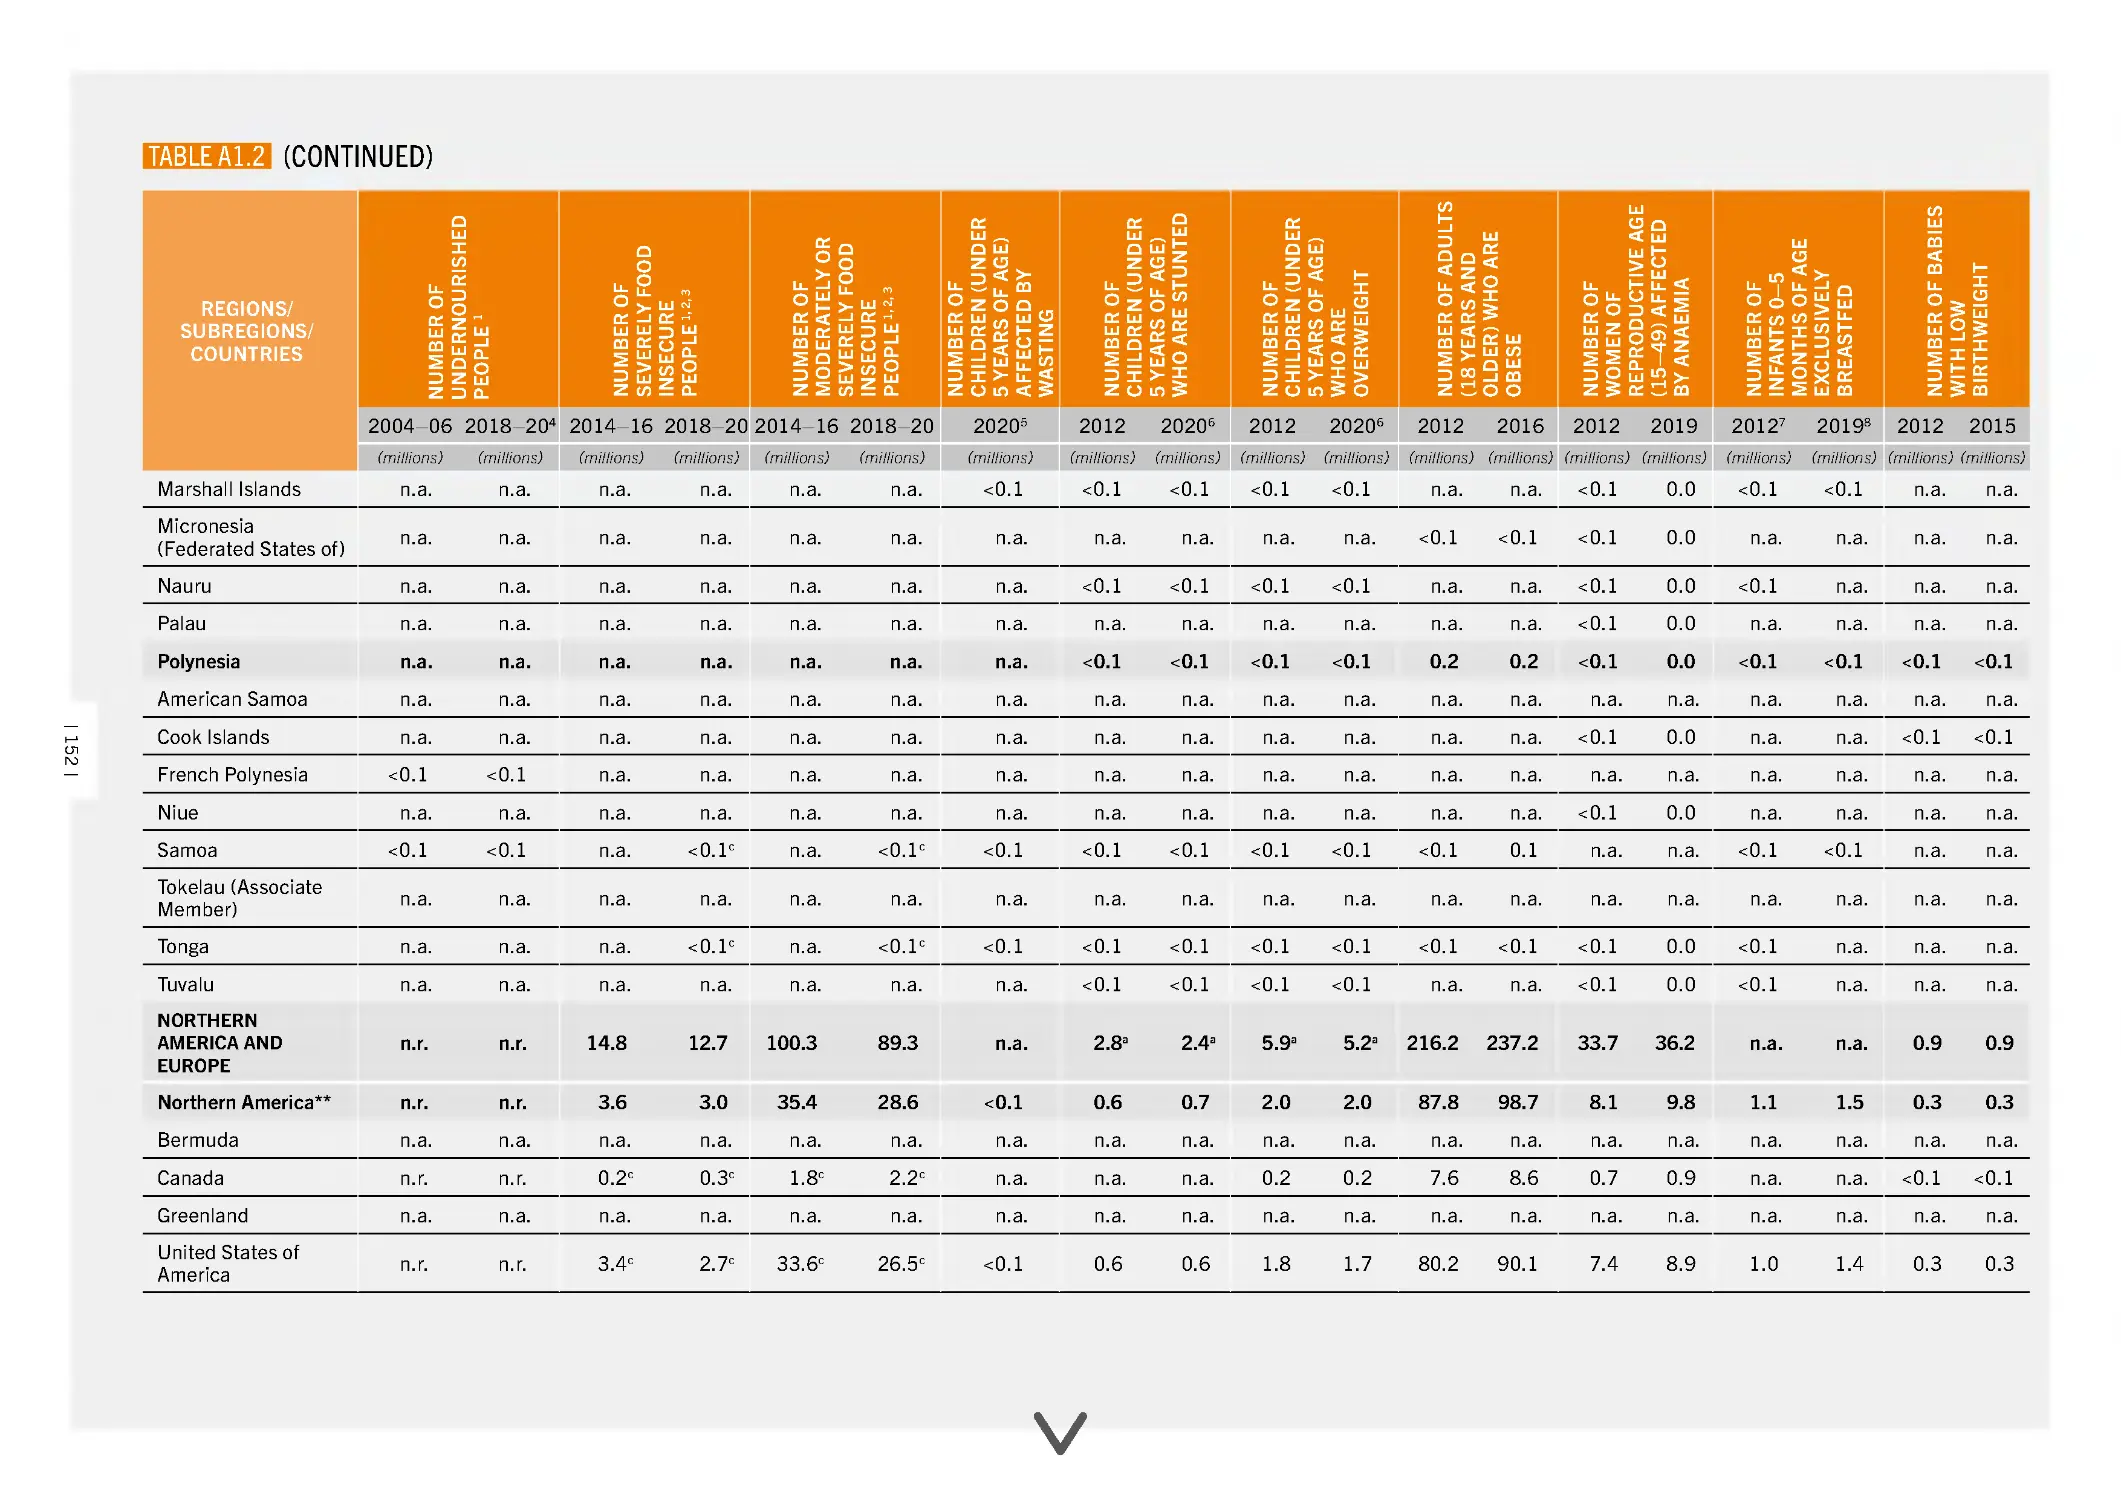
A1.2 Progress towards the Sustainable
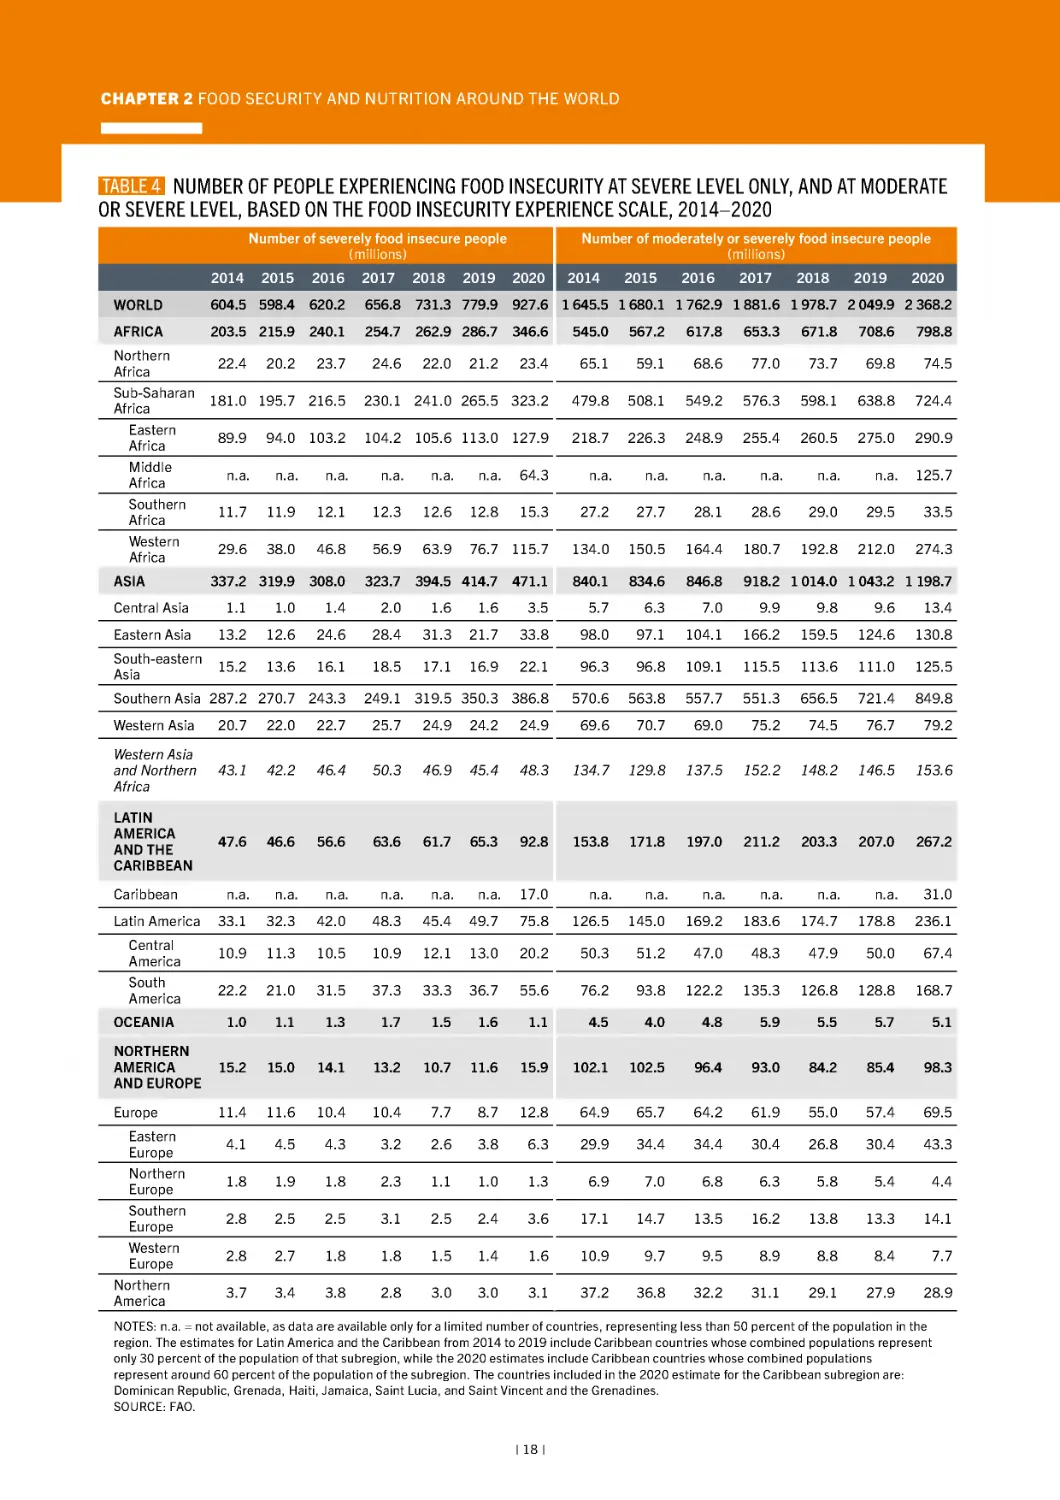
4 Number of people experiencing food insecurity at
severe level only, and at moderate or severe level,
based on the Food Insecurity Experience Scale,
2014–2020
108
31
Development Goals (SDGs) and global nutrition
targets: Number of people who are affected by
undernourishment, moderate or severe food
insecurity and selected forms of malnutrition;
number of infants exclusively breastfed and number
of babies born with low birthweight
143
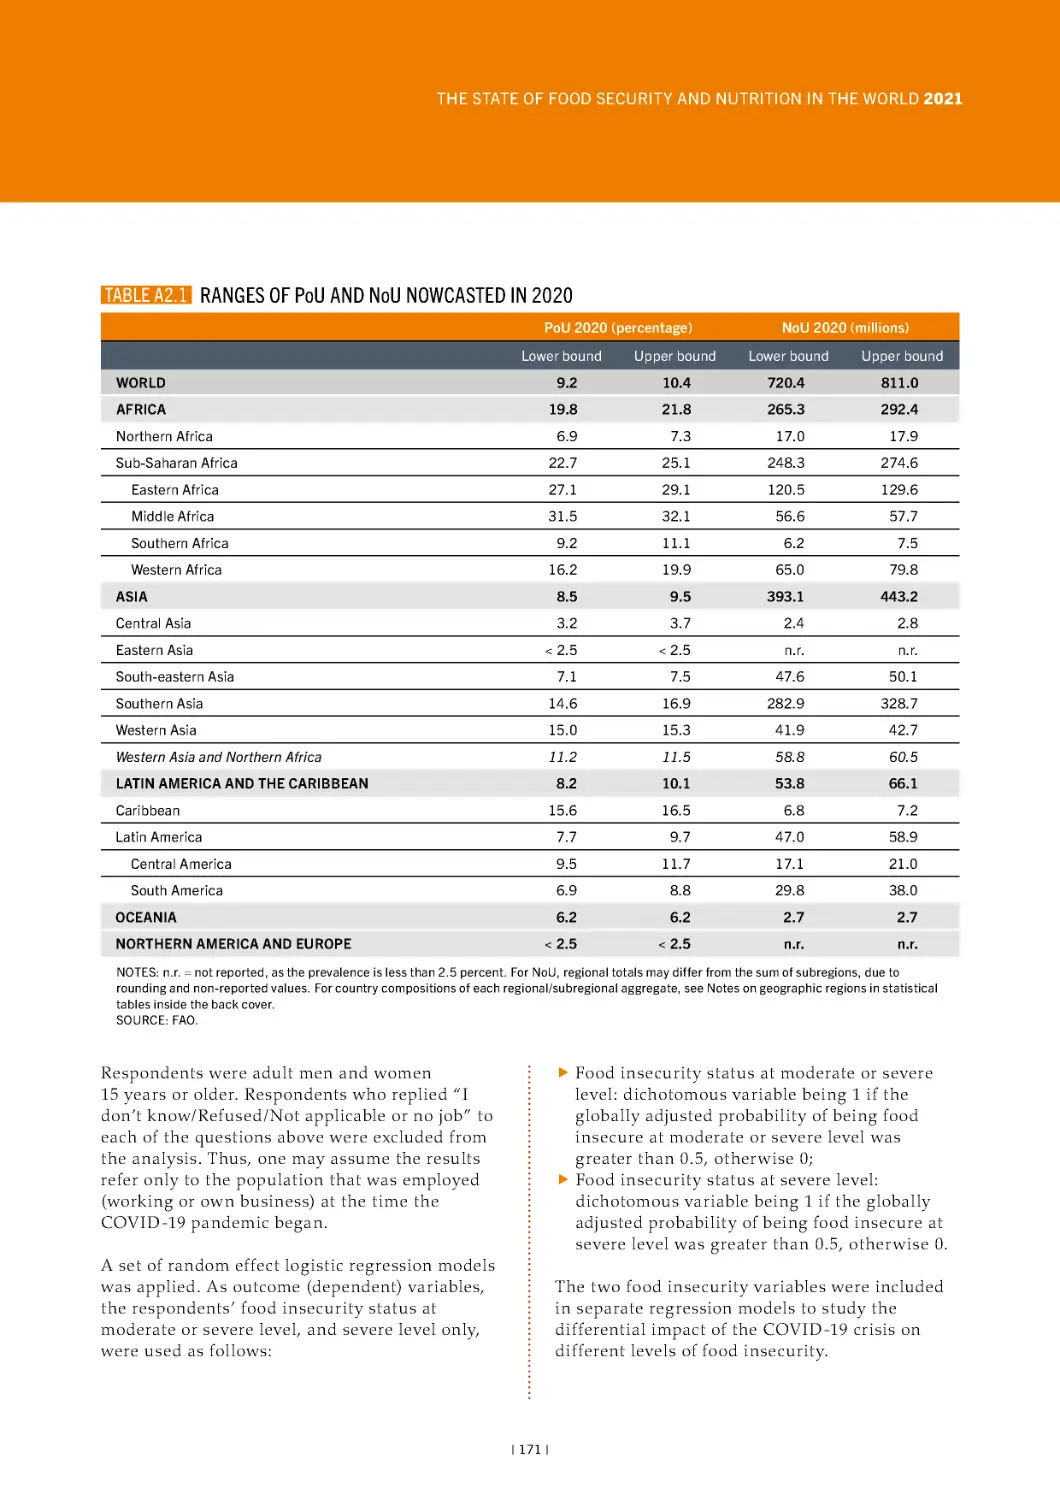
A2.1 Ranges of PoU and NoU nowcasted in 2020
171
A2.2 Regression coefficients from three models
estimated on historic CVy values (2000–2019)
175
A2.3 Rules for progress assessment against the
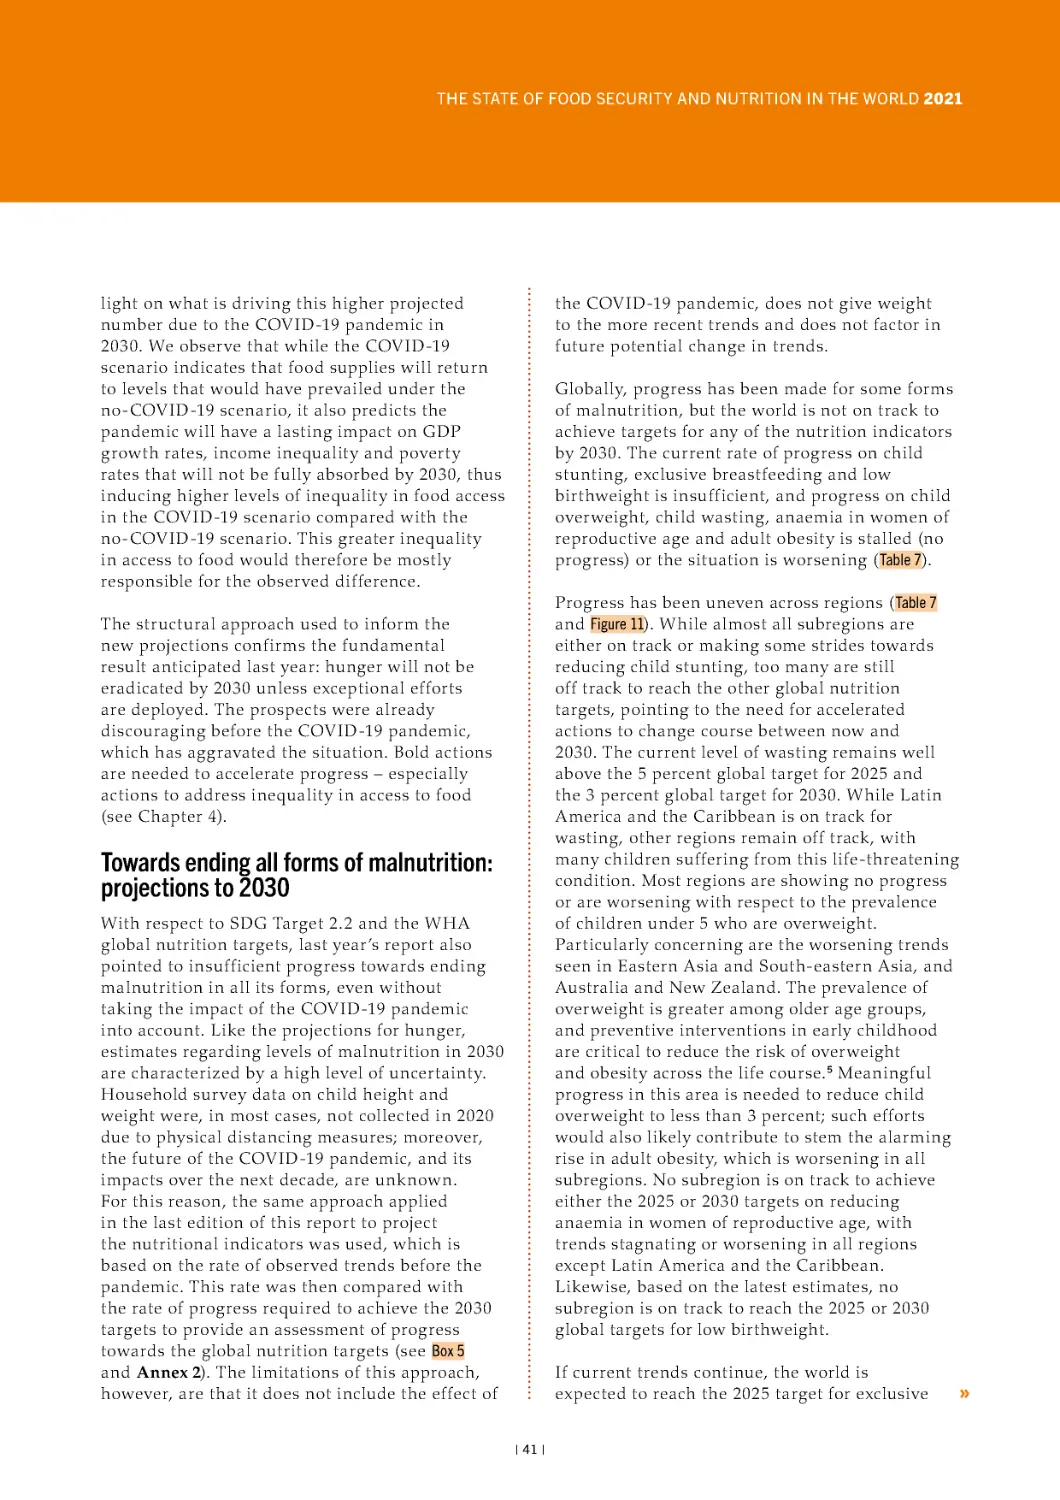
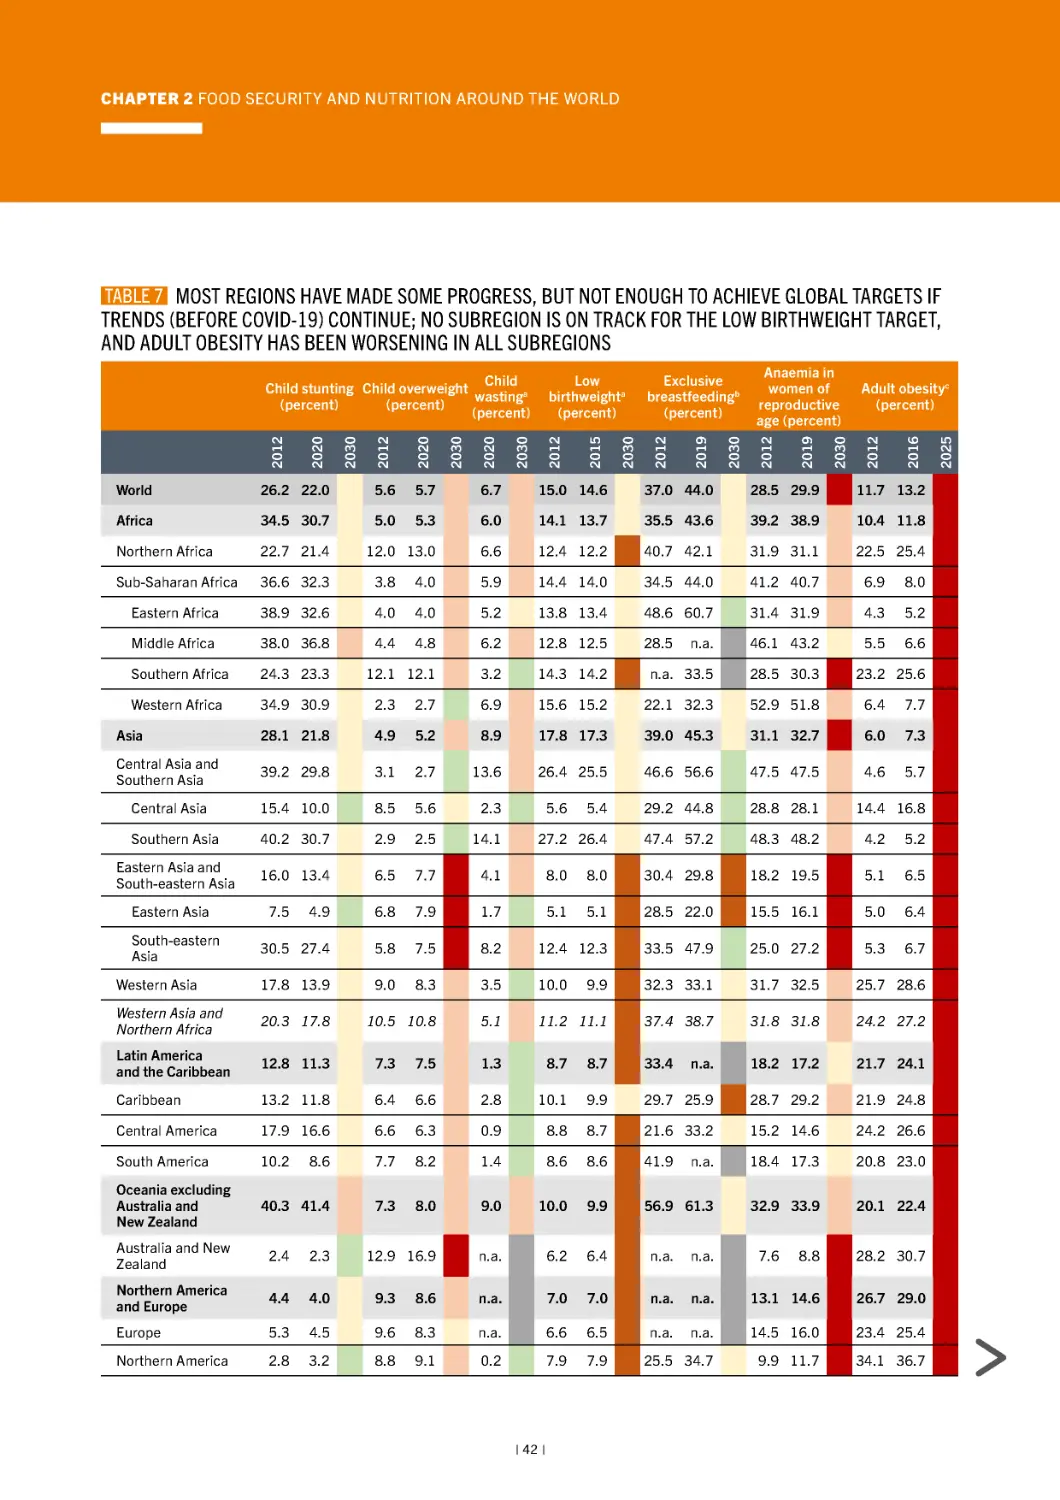
7 Most regions have made some progress, but not
global nutrition targets
177
enough to achieve global targets if trends (before
COVID-19) continue; no subregion is on track for the
low birthweight target, and adult obesity has been
worsening in all subregions
A4.1 List of countries by combination of drivers
184
FIGURES
42
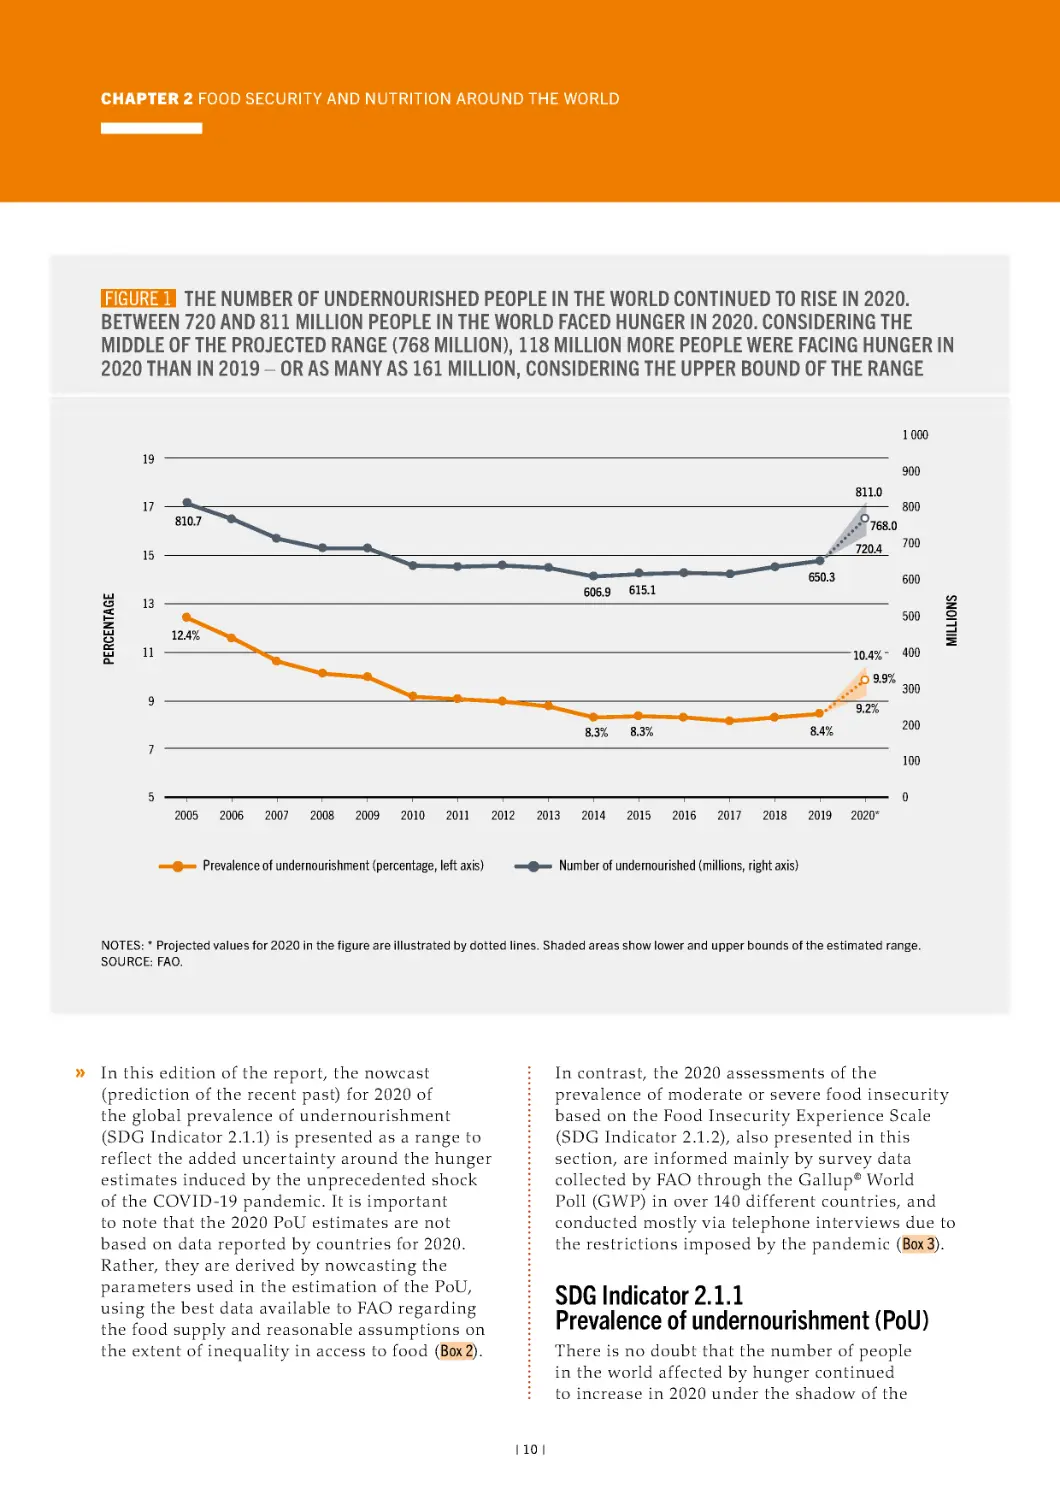
1 The number of undernourished people in the world
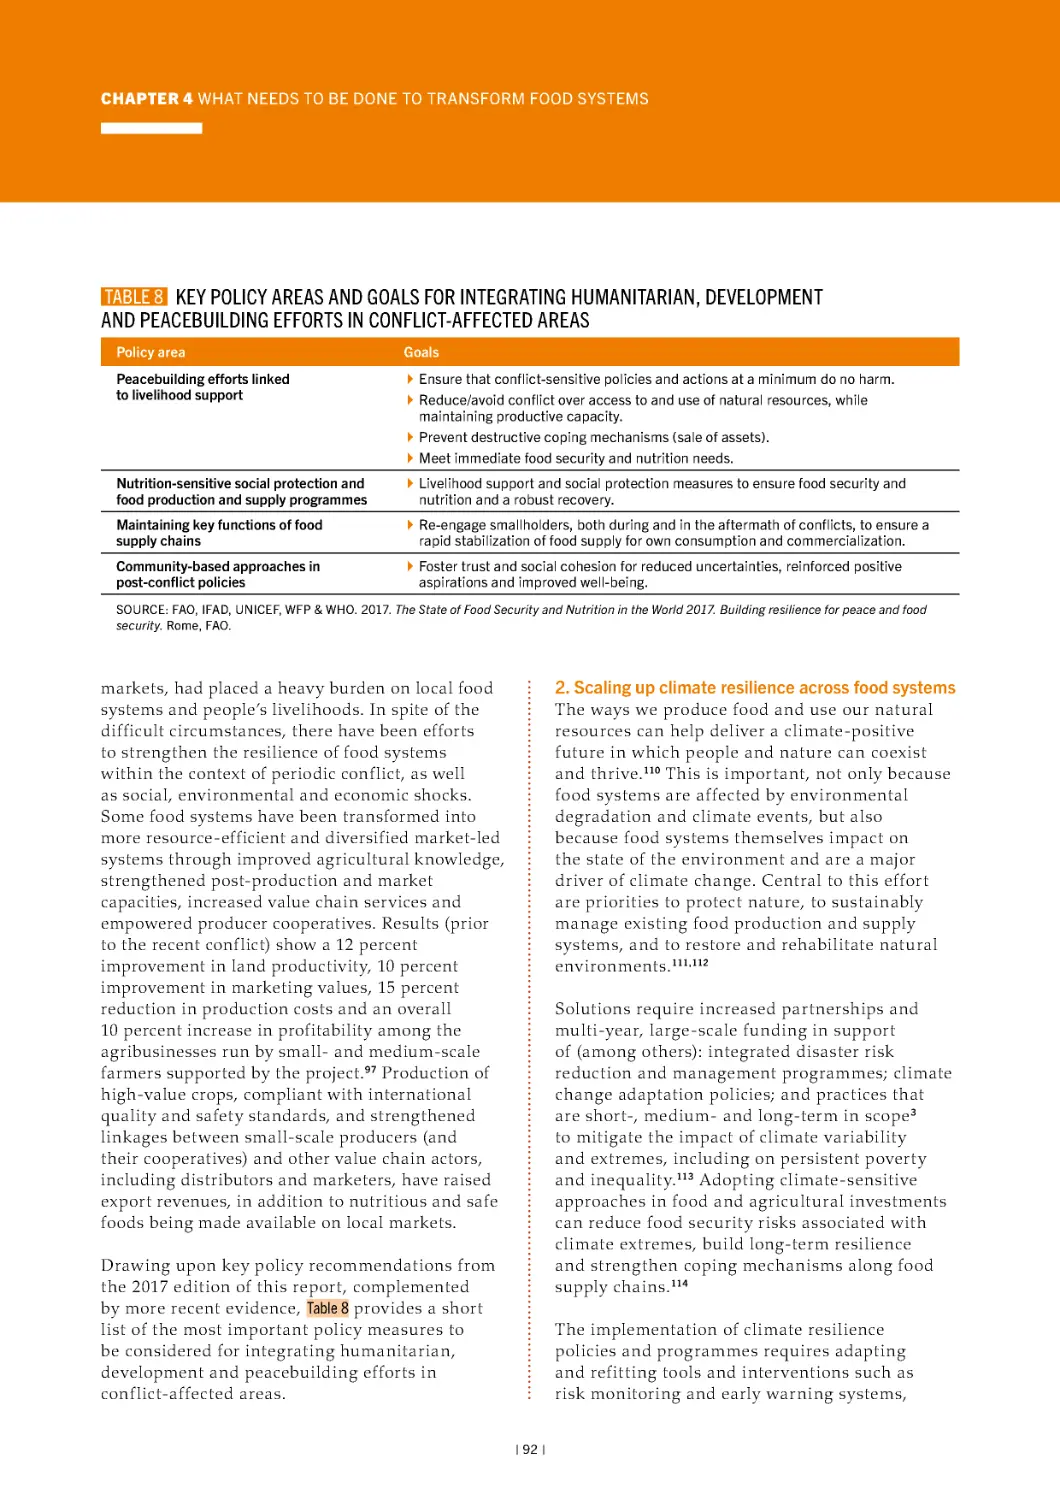
8 Key policy areas and goals for integrating
humanitarian, development and peacebuilding
efforts in conflict-affected areas
continued to rise in 2020. Between 720 and
811 million people in the world faced hunger in 2020.
Considering the middle of the projected range
(768 million), 118 million more people were facing
hunger in 2020 than in 2019 – or as many as 161
million, considering the upper bound of the range
92
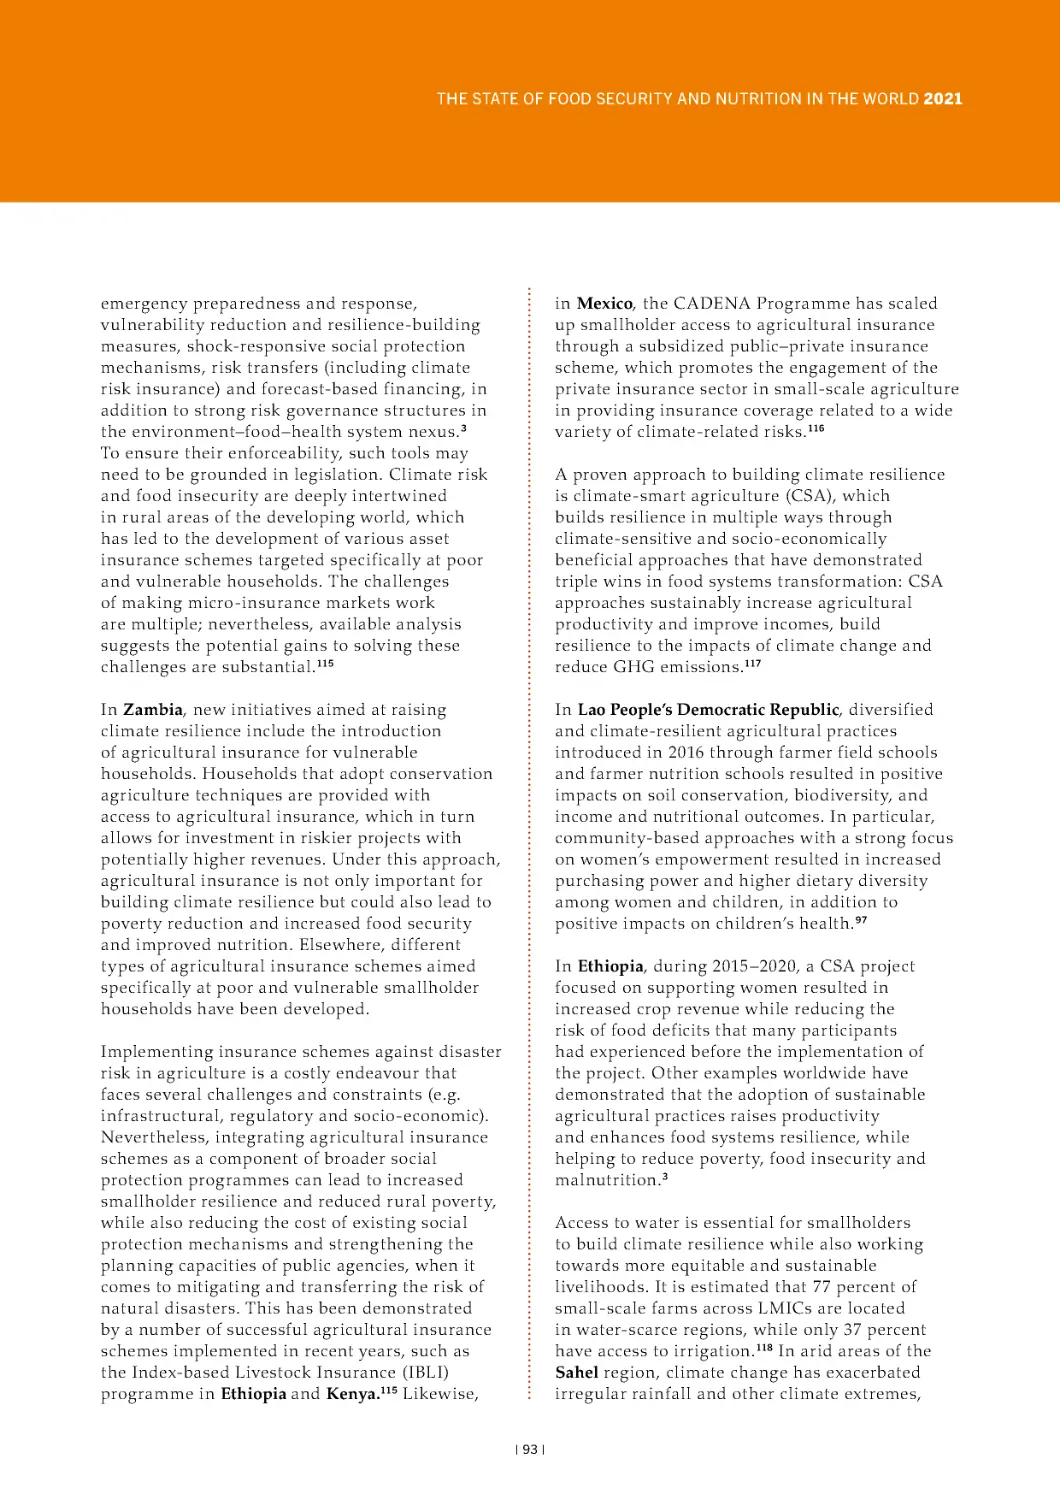
9 Key policy areas and goals for scaling up climate
resilience across food systems
95
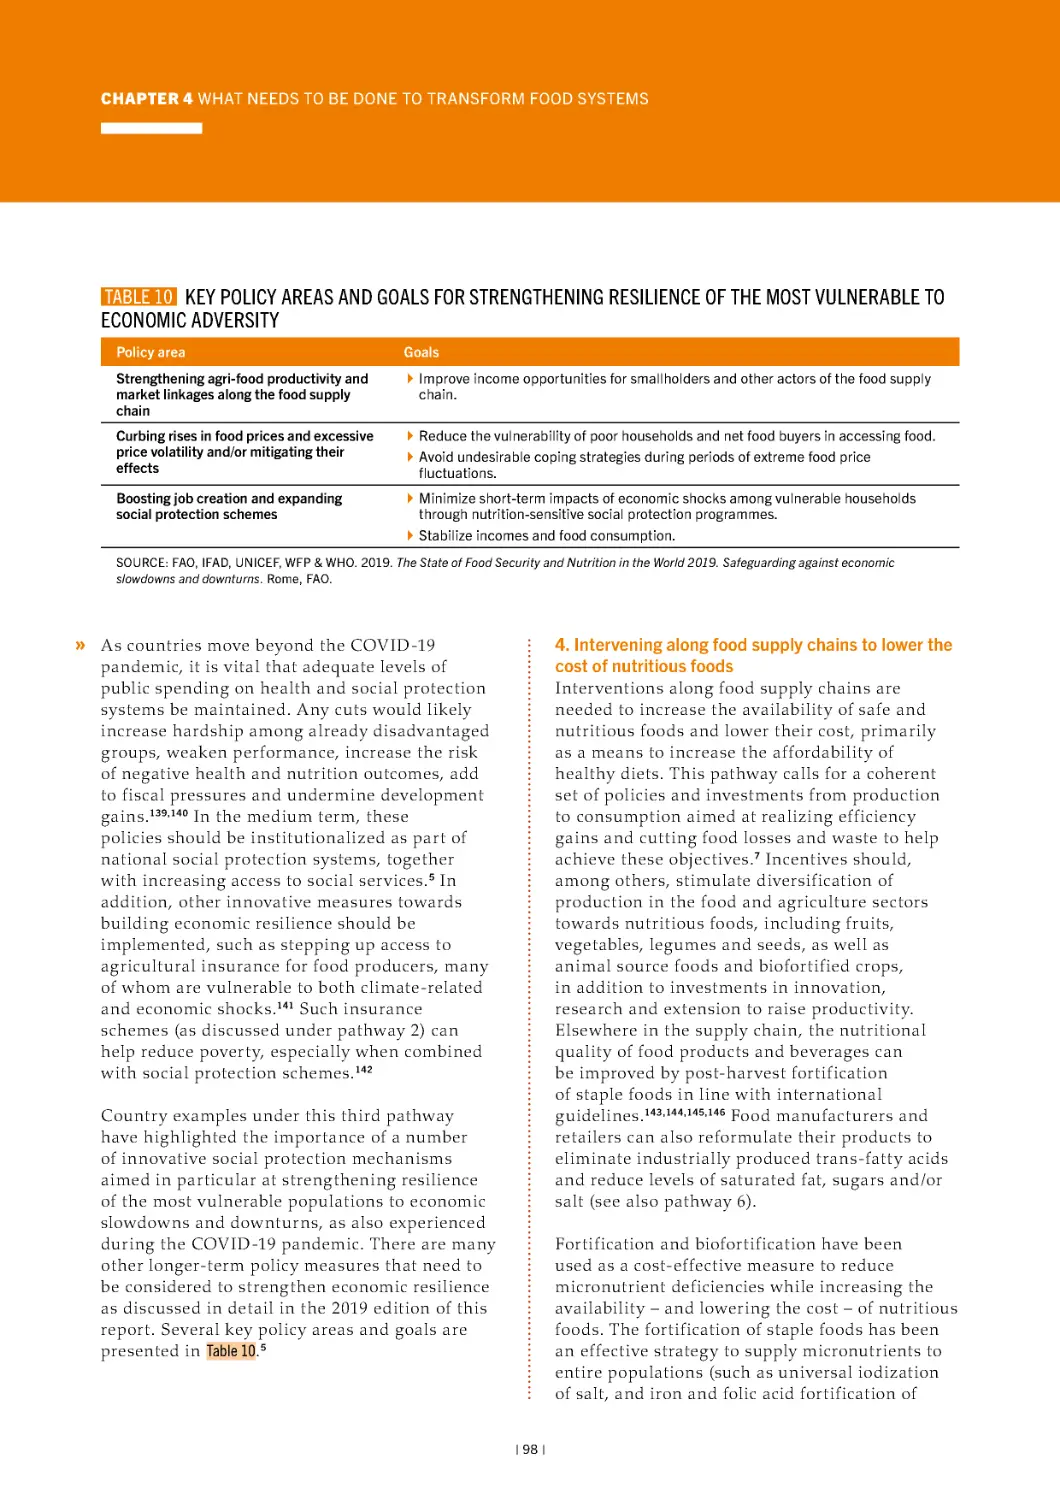
10 Key policy areas and goals for strengthening
resilience of the most vulnerable to economic
adversity
2 More than half (418 million) of the people in the
98
world affected by hunger in 2020 were in Asia and
more than one-third (282 million) in Africa
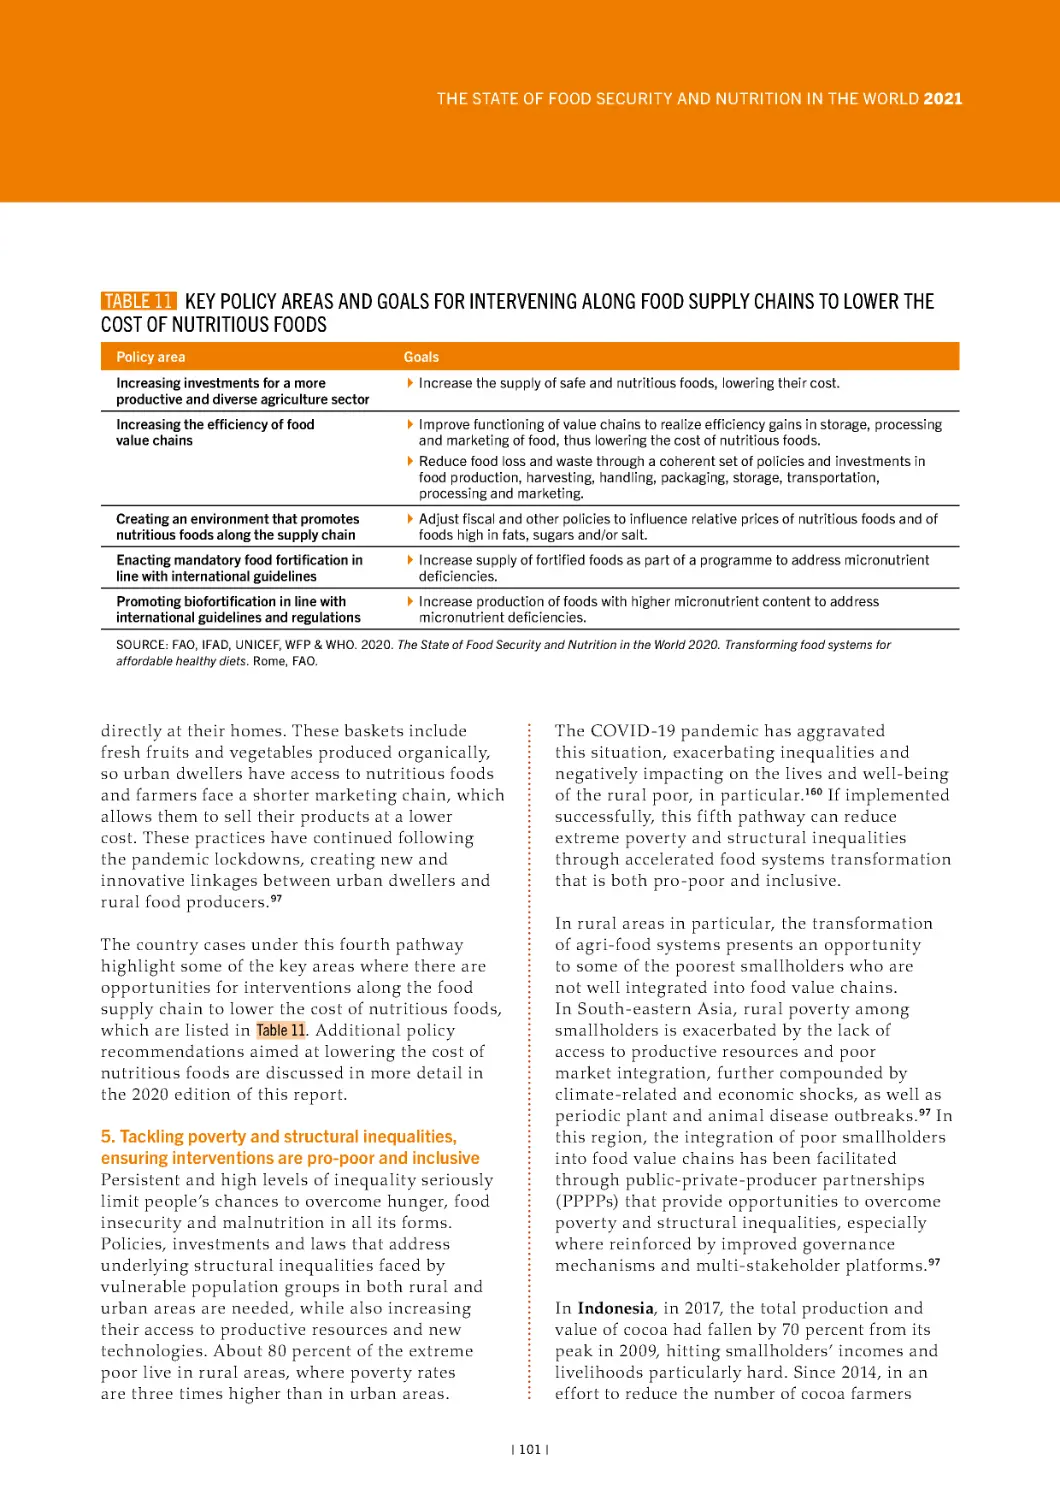
11 Key policy areas and goals for intervening along
food supply chains to lower the cost of nutritious
foods
13
3 All subregions of Africa and Latin America and the
101
Caribbean, and most subregions of Asia, show
increases in the prevalence of undernourishment
from 2019 to 2020, with the sharpest increase in
Western Africa
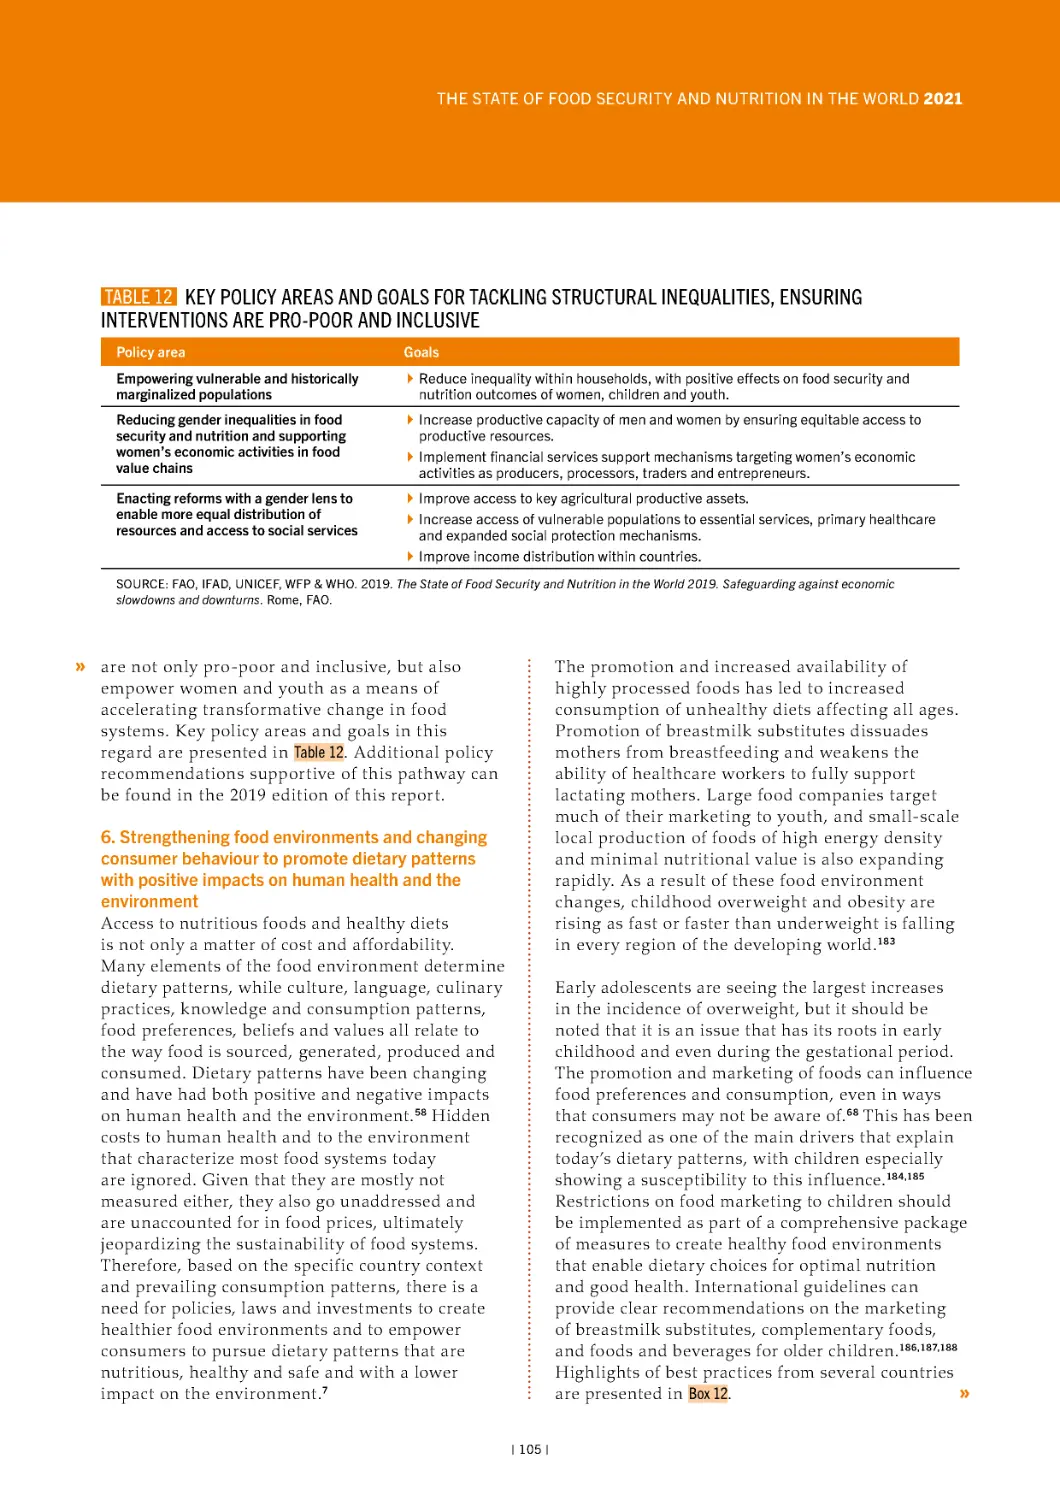
12 Key policy areas and goals for tackling structural
inequalities, ensuring interventions are pro-poor
and inclusive
10
105
| iii |
14
CONTENTS
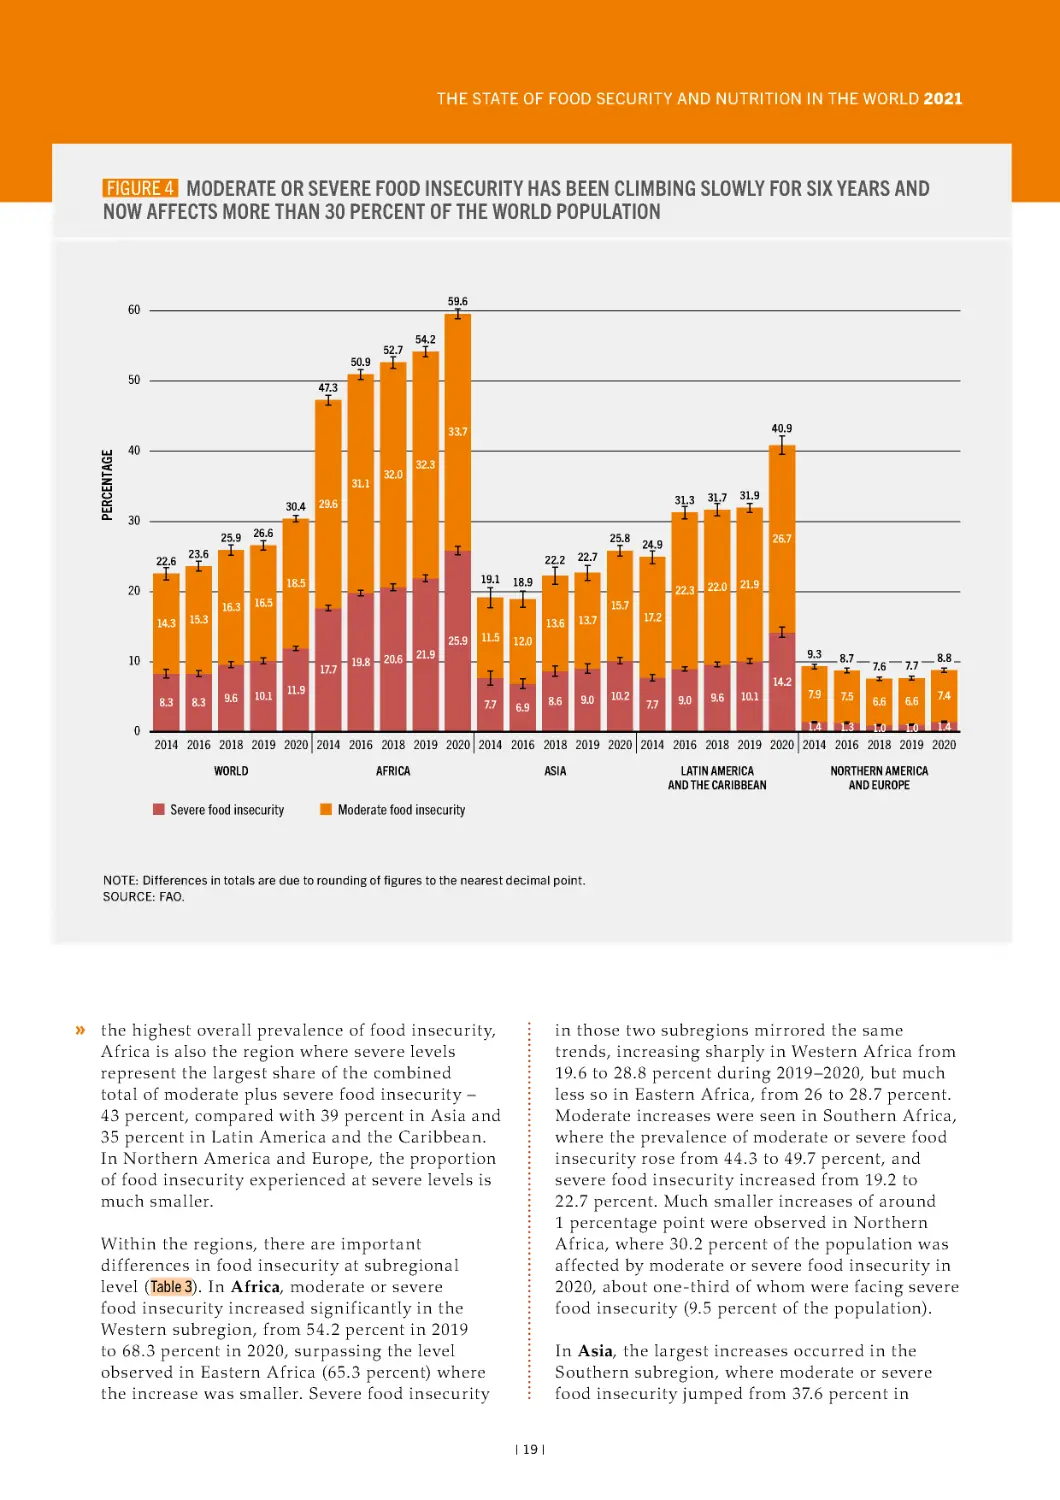
4 Moderate or severe food insecurity has been
climbing slowly for six years and now affects more
than 30 percent of the world population
19
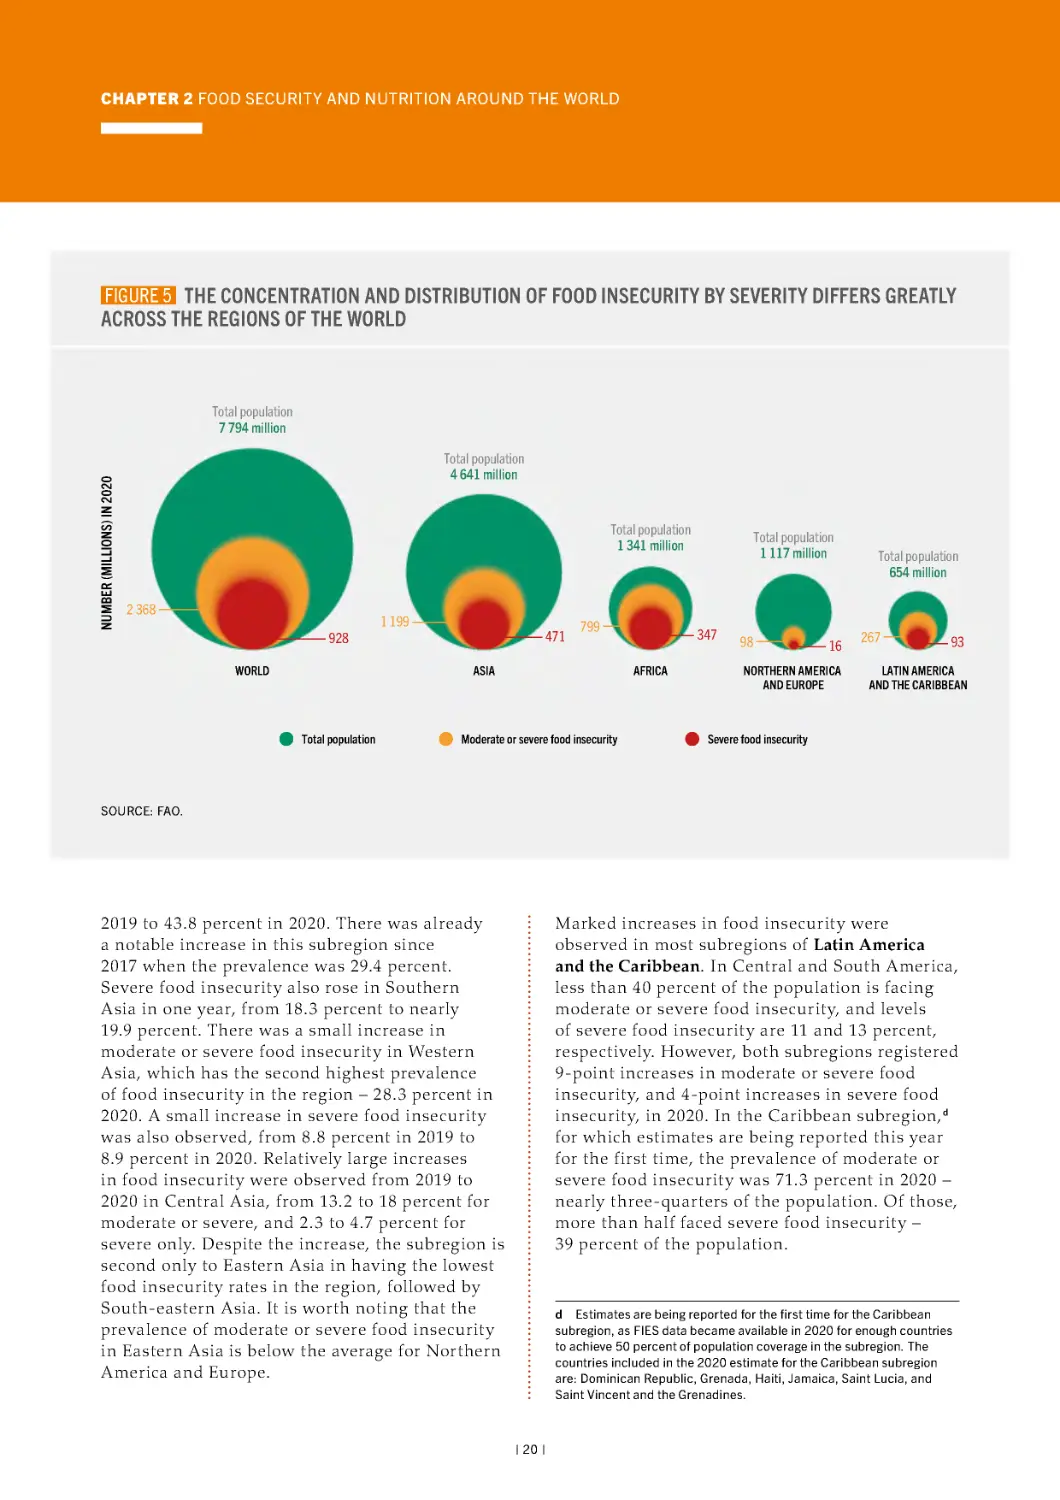
5 The concentration and distribution of food
insecurity by severity differs greatly across the
regions of the world
20
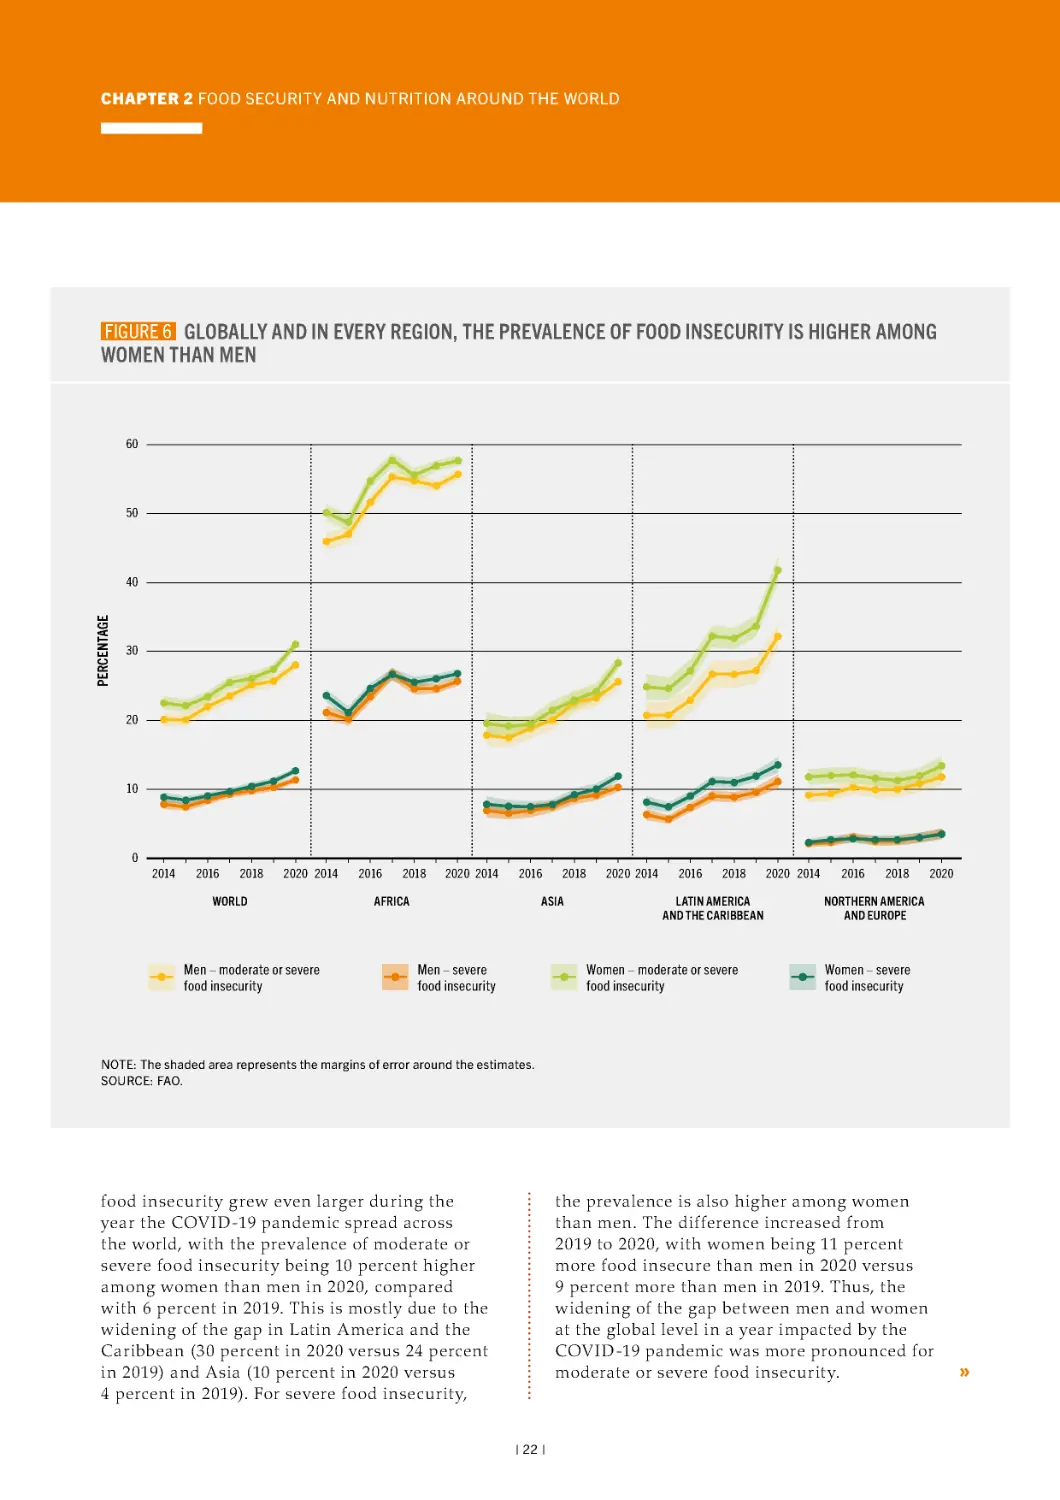
6 Globally and in every region, the prevalence of
food insecurity is higher among women than men
22
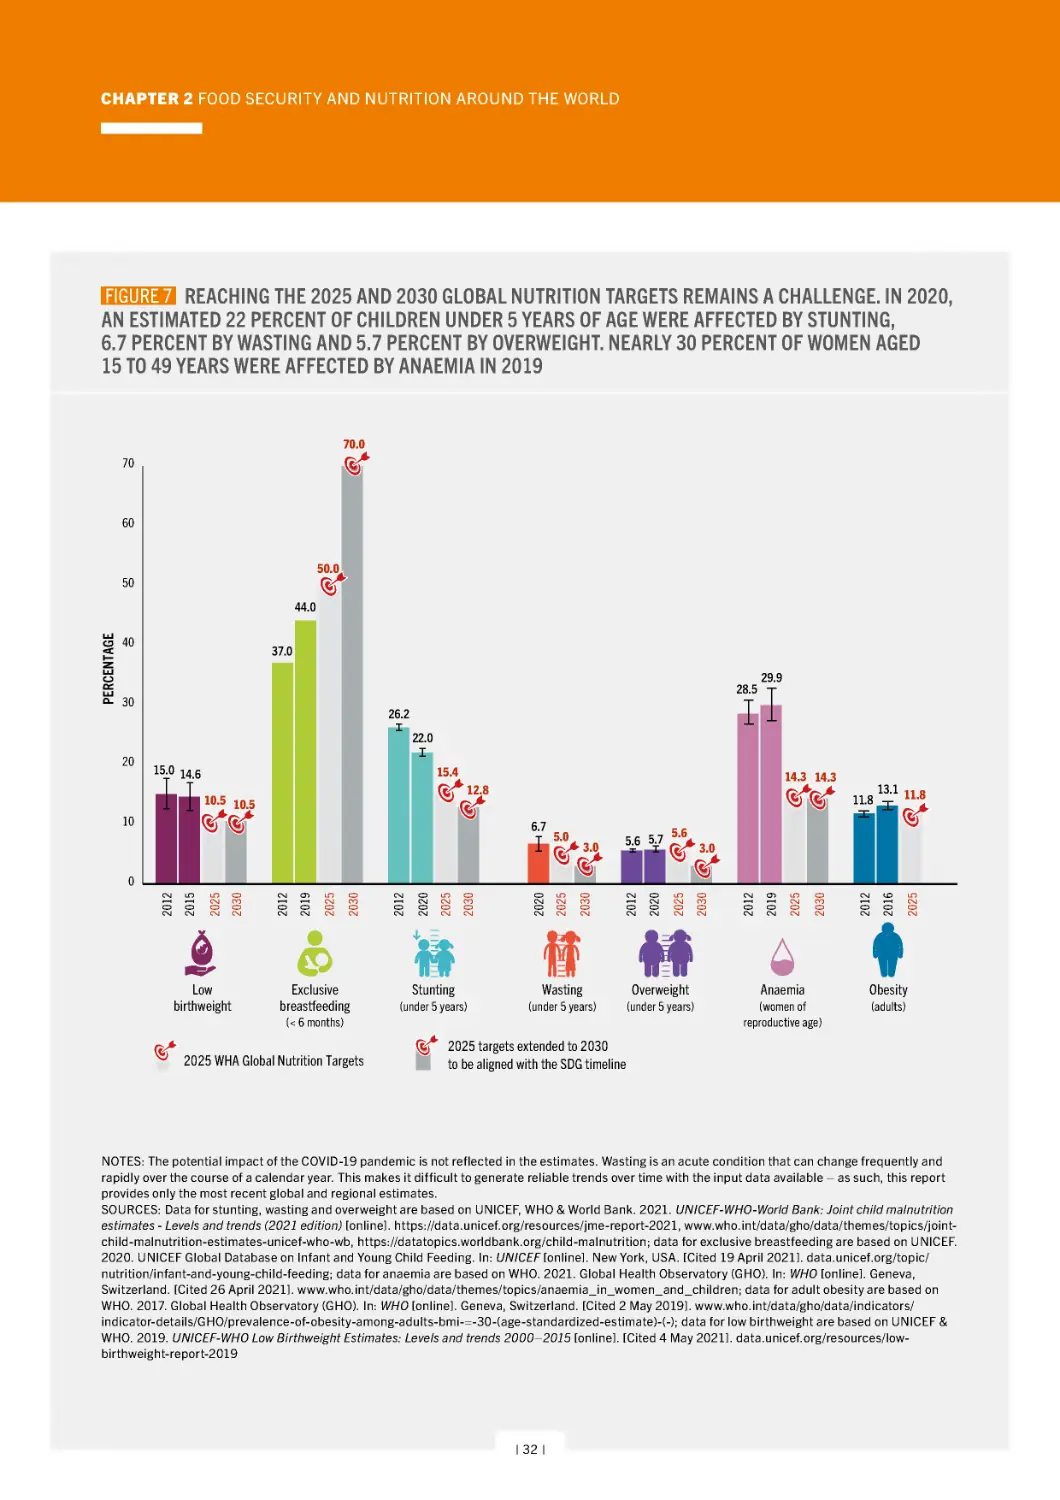
7 Reaching the 2025 and 2030 global nutrition
targets remains a challenge. In 2020, an estimated
22 percent of children under 5 years of age were
affected by stunting, 6.7 percent by wasting and
5.7 percent by overweight. Nearly 30 percent of
women aged 15 to 49 years were affected by
anaemia in 2019
32
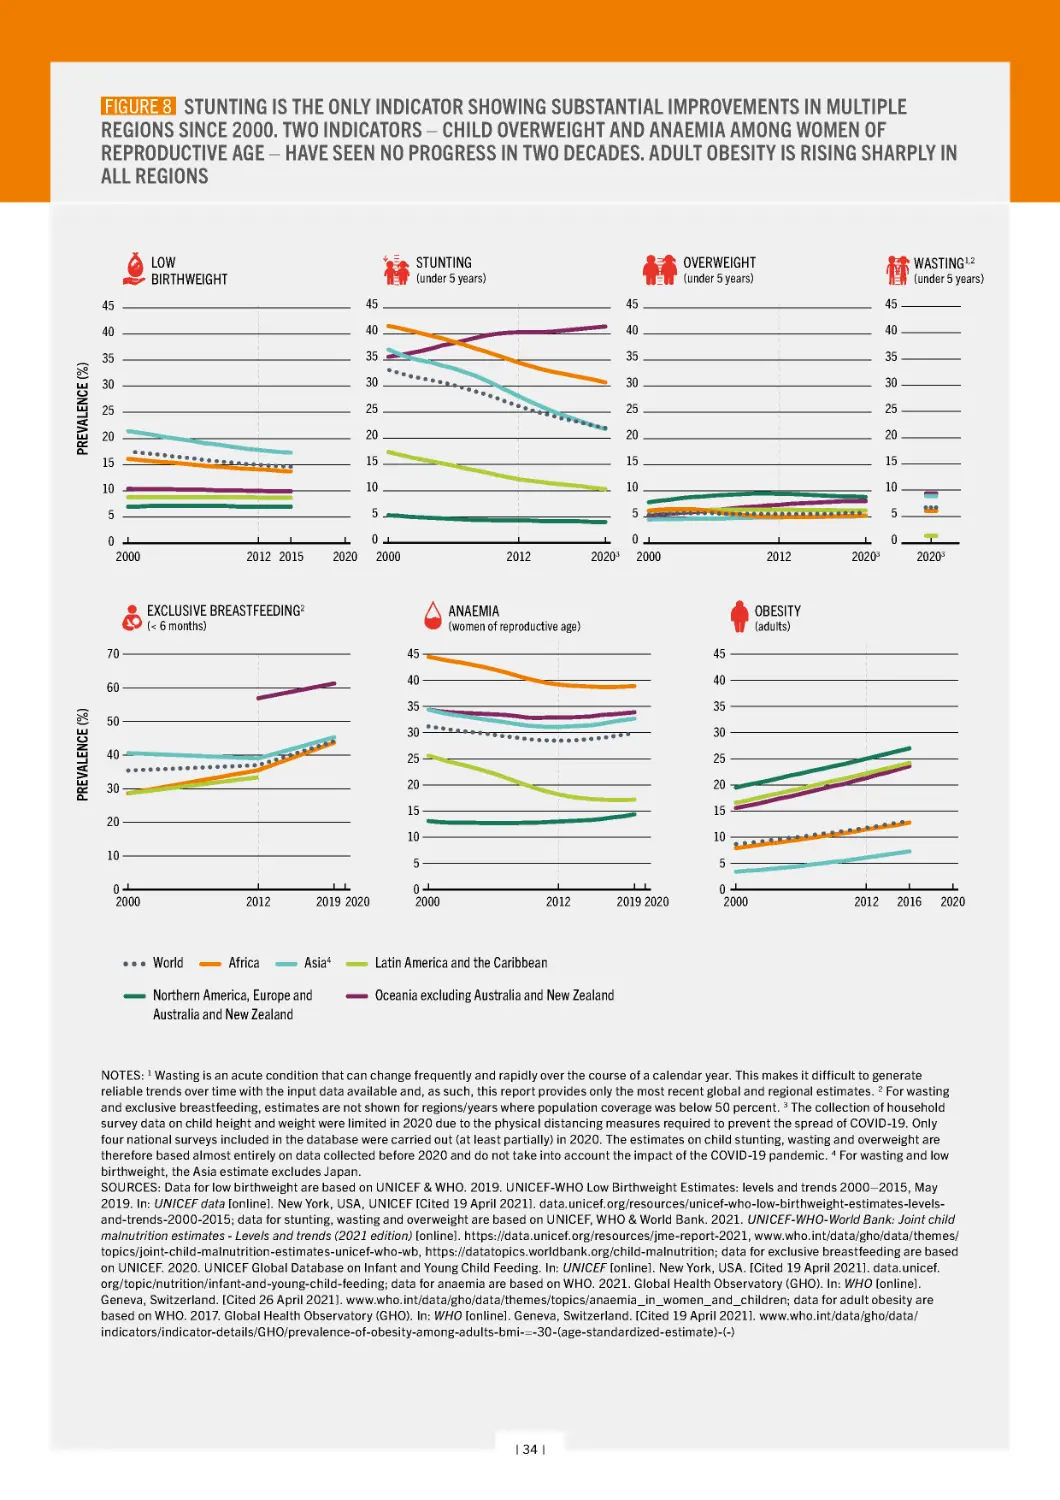
8 Stunting is the only indicator showing substantial
improvements in multiple regions since 2000.
Two indicators – child overweight and anaemia
among women of reproductive age – have seen no
progress in two decades. Adult obesity is rising
sharply in all regions
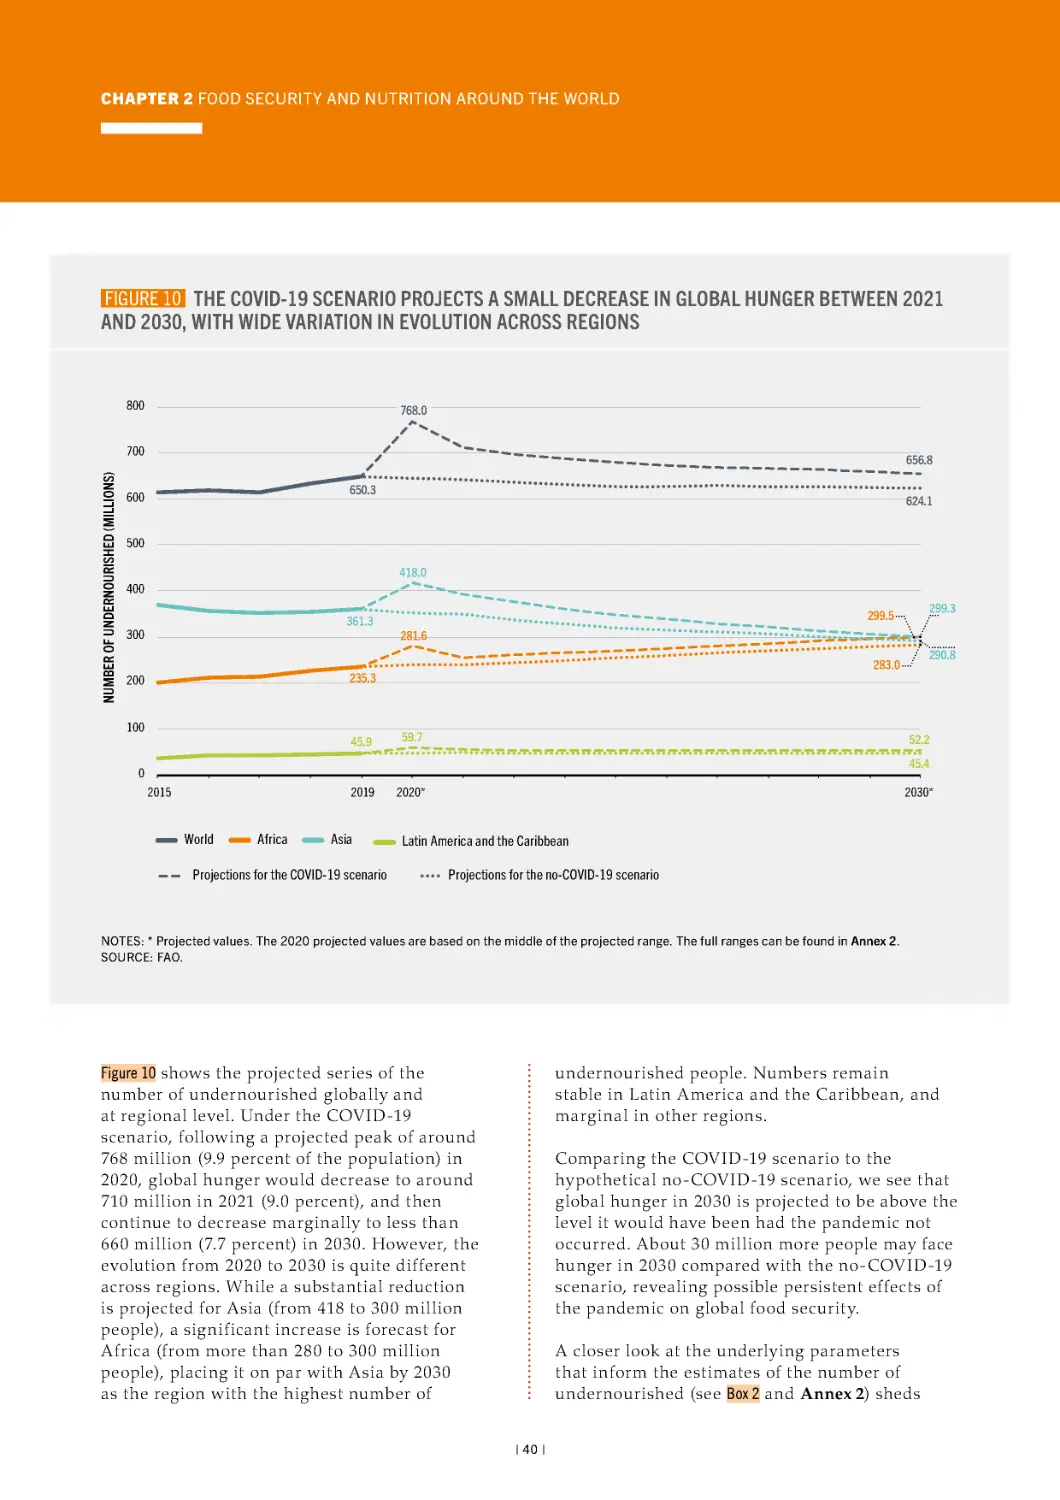
10 The COVID-19 scenario projects a small
decrease in global hunger between 2021 and 2030,
with wide variation in evolution across regions
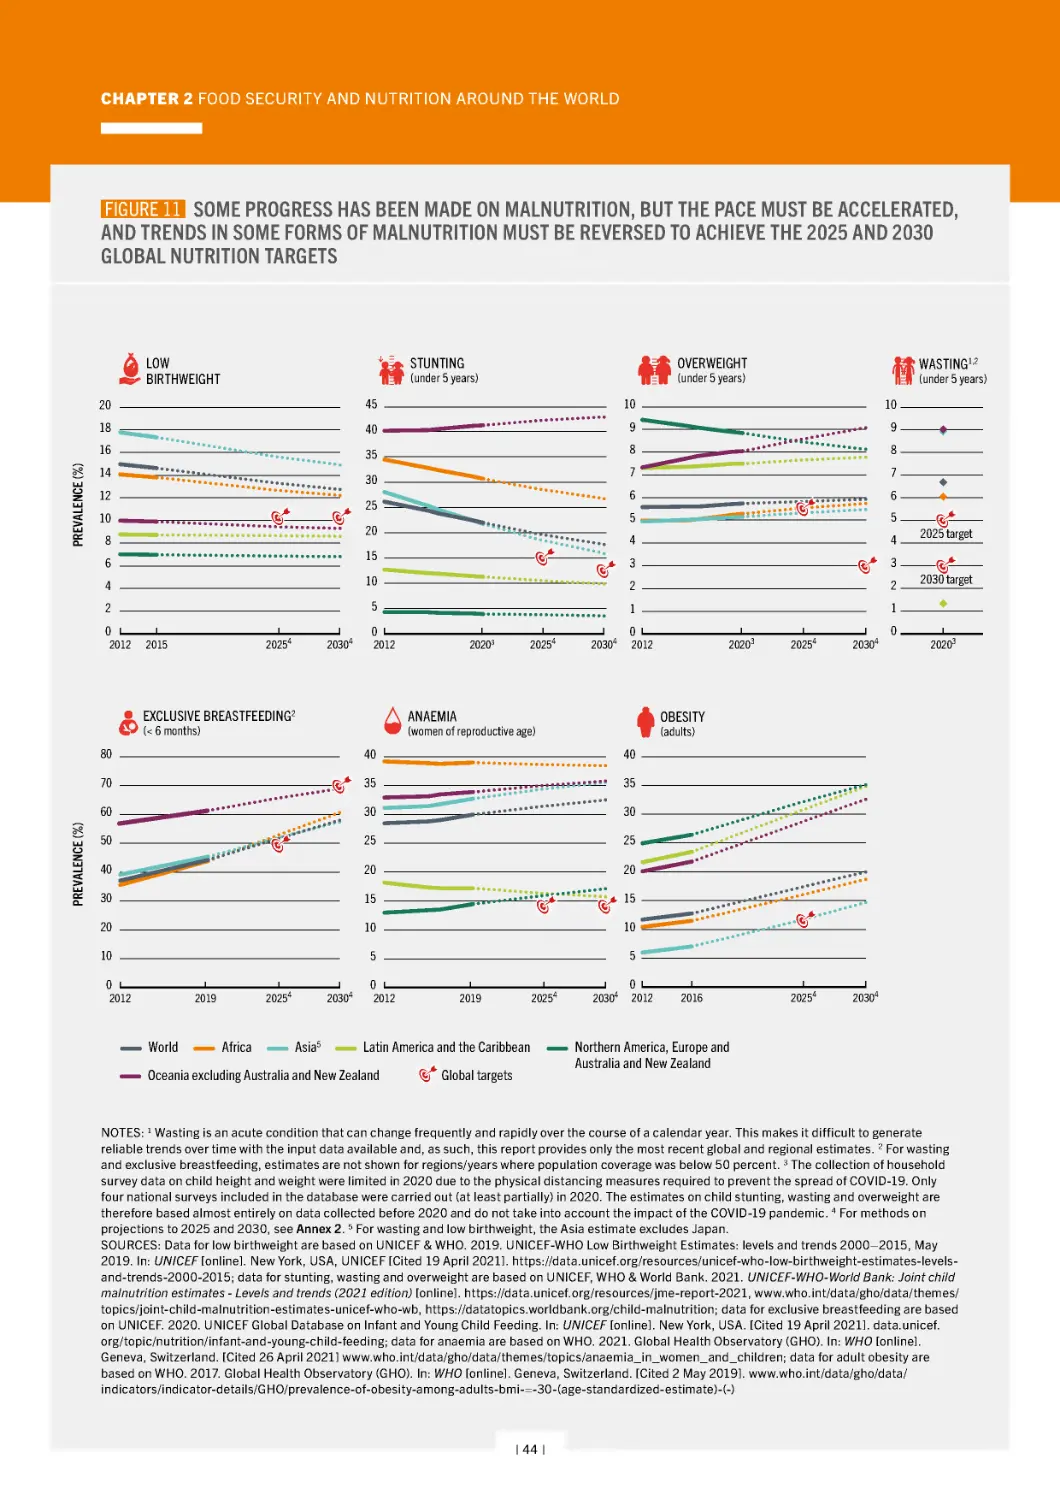
11 Some progress has been made on malnutrition,
but the pace must be accelerated, and trends in
some forms of malnutrition must be reversed to
achieve the 2025 and 2030 global nutrition targets
36
40
44
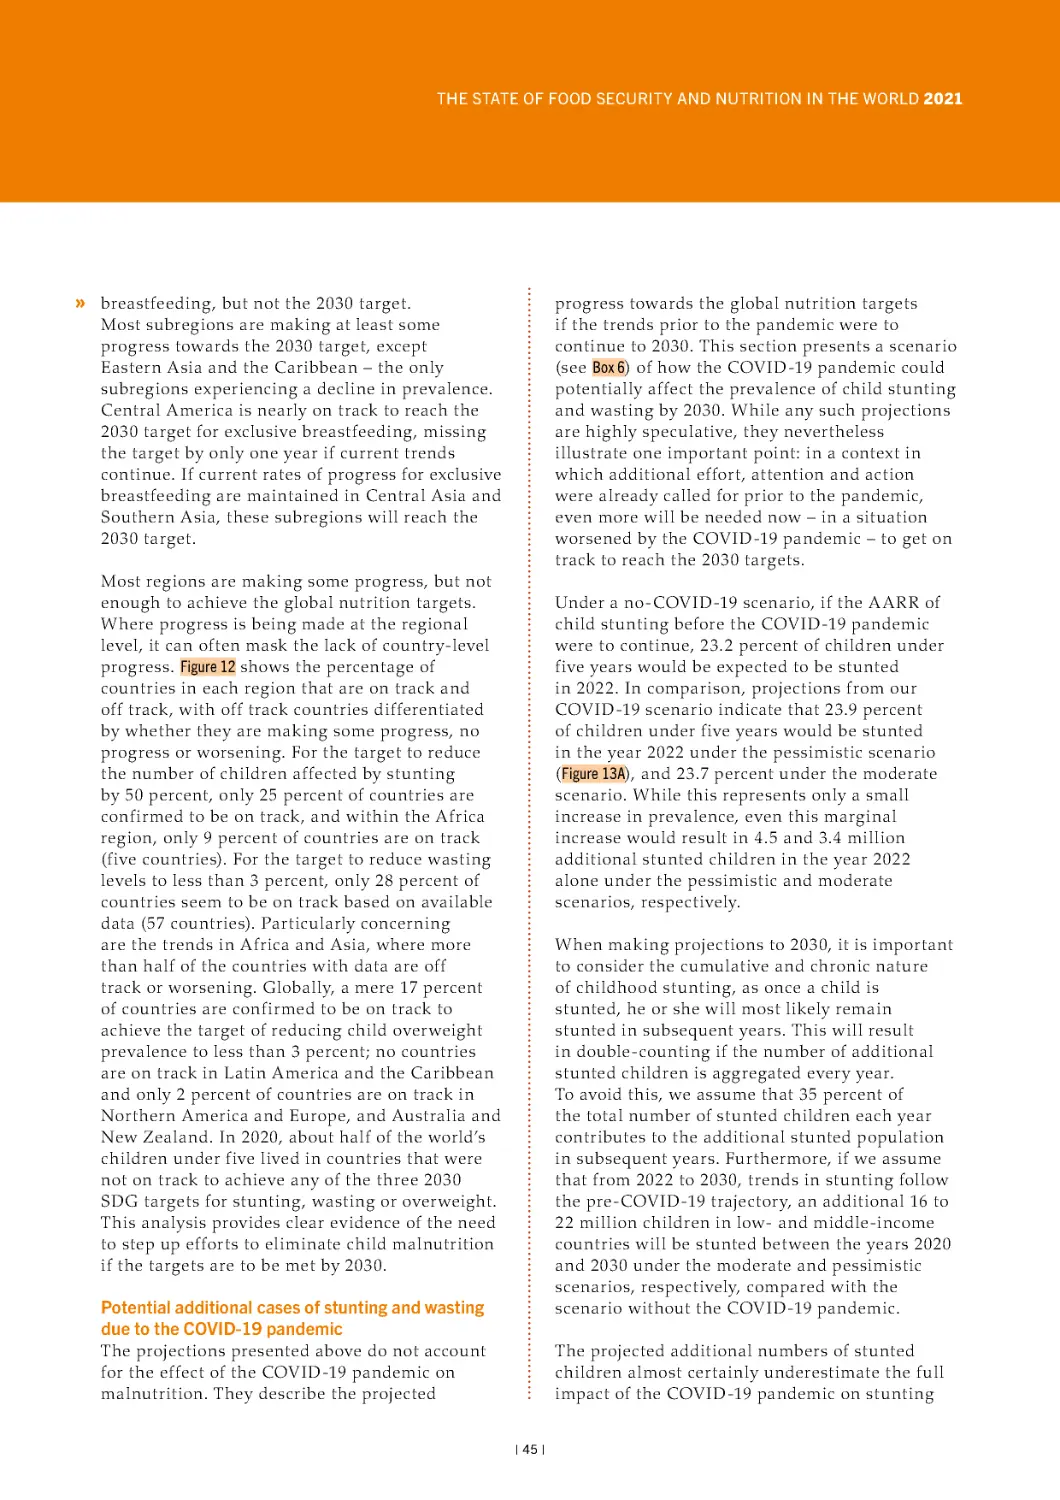
12 Around half of children live in countries that are
not on track to reach one of the 2030 SDG targets for
child stunting, wasting and overweight
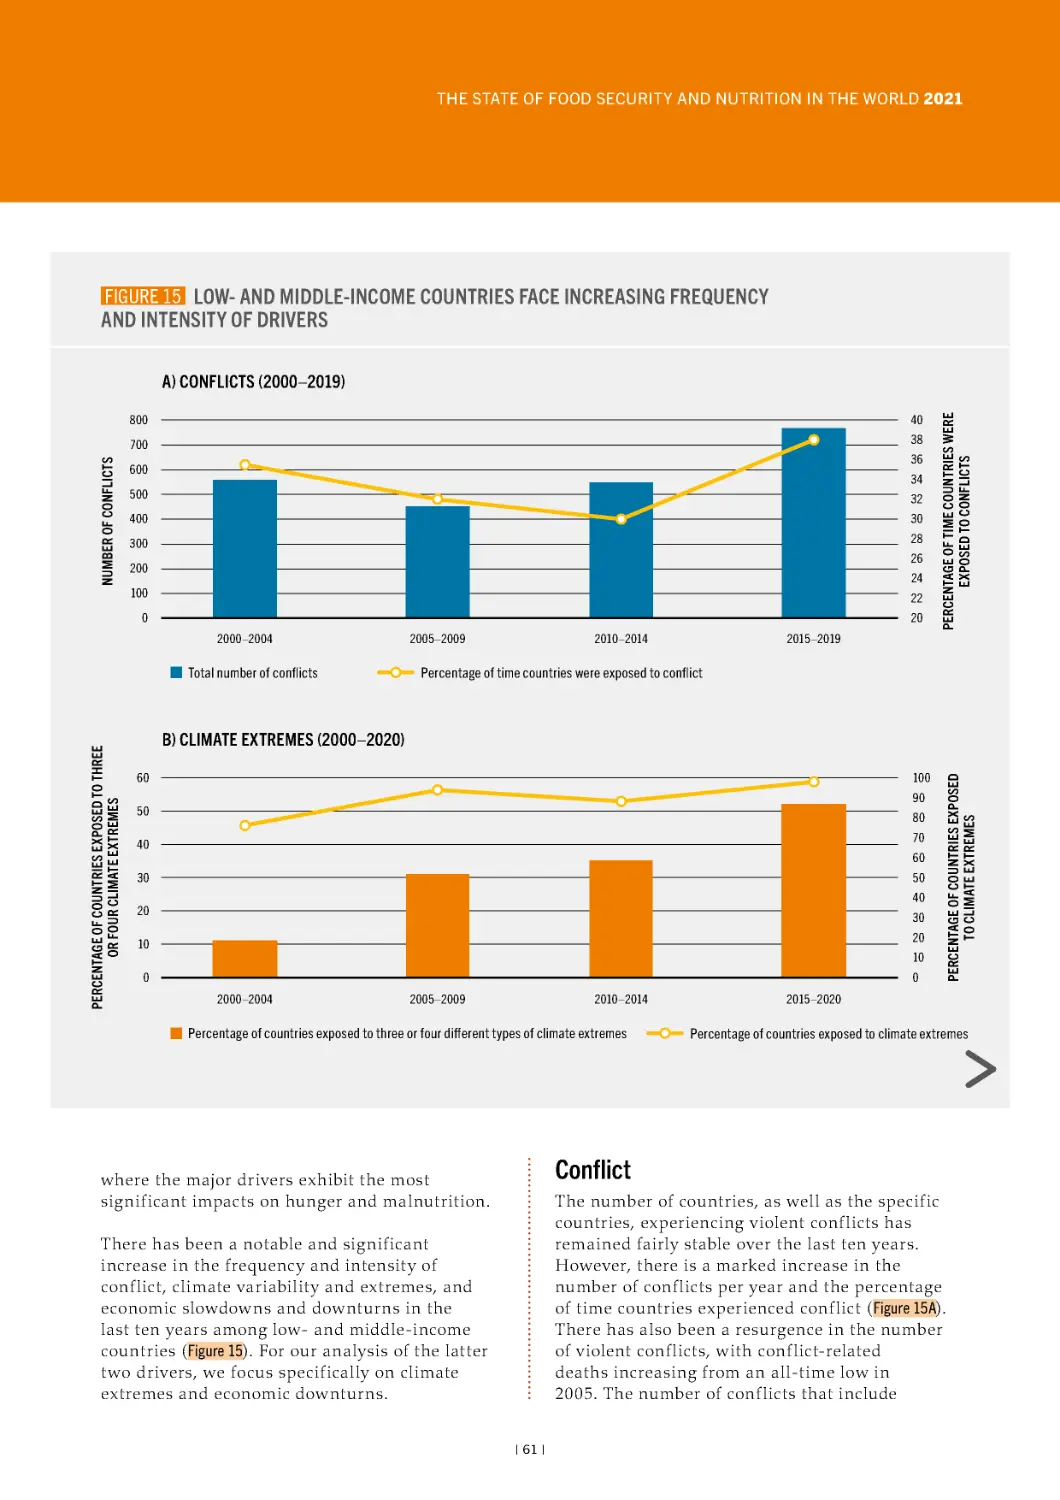
15 Low- and middle-income countries face
increasing frequency and intensity of drivers
61
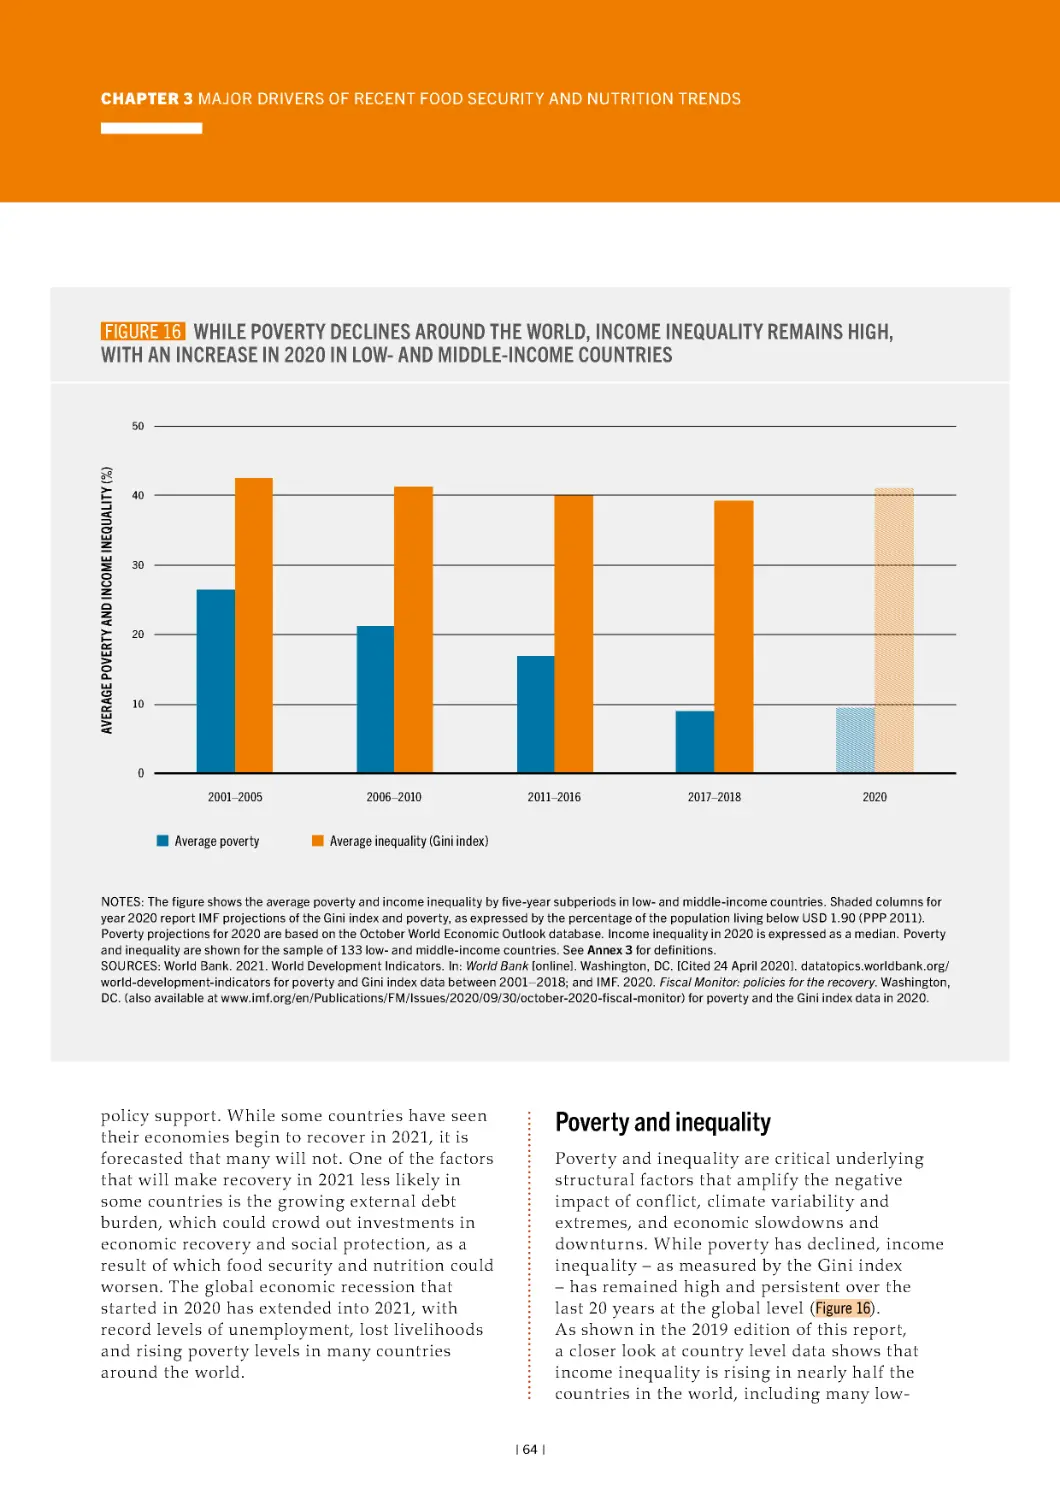
16 While poverty declines around the world, income
inequality remains high, with an increase in 2020 in
low- and middle-income countries
64
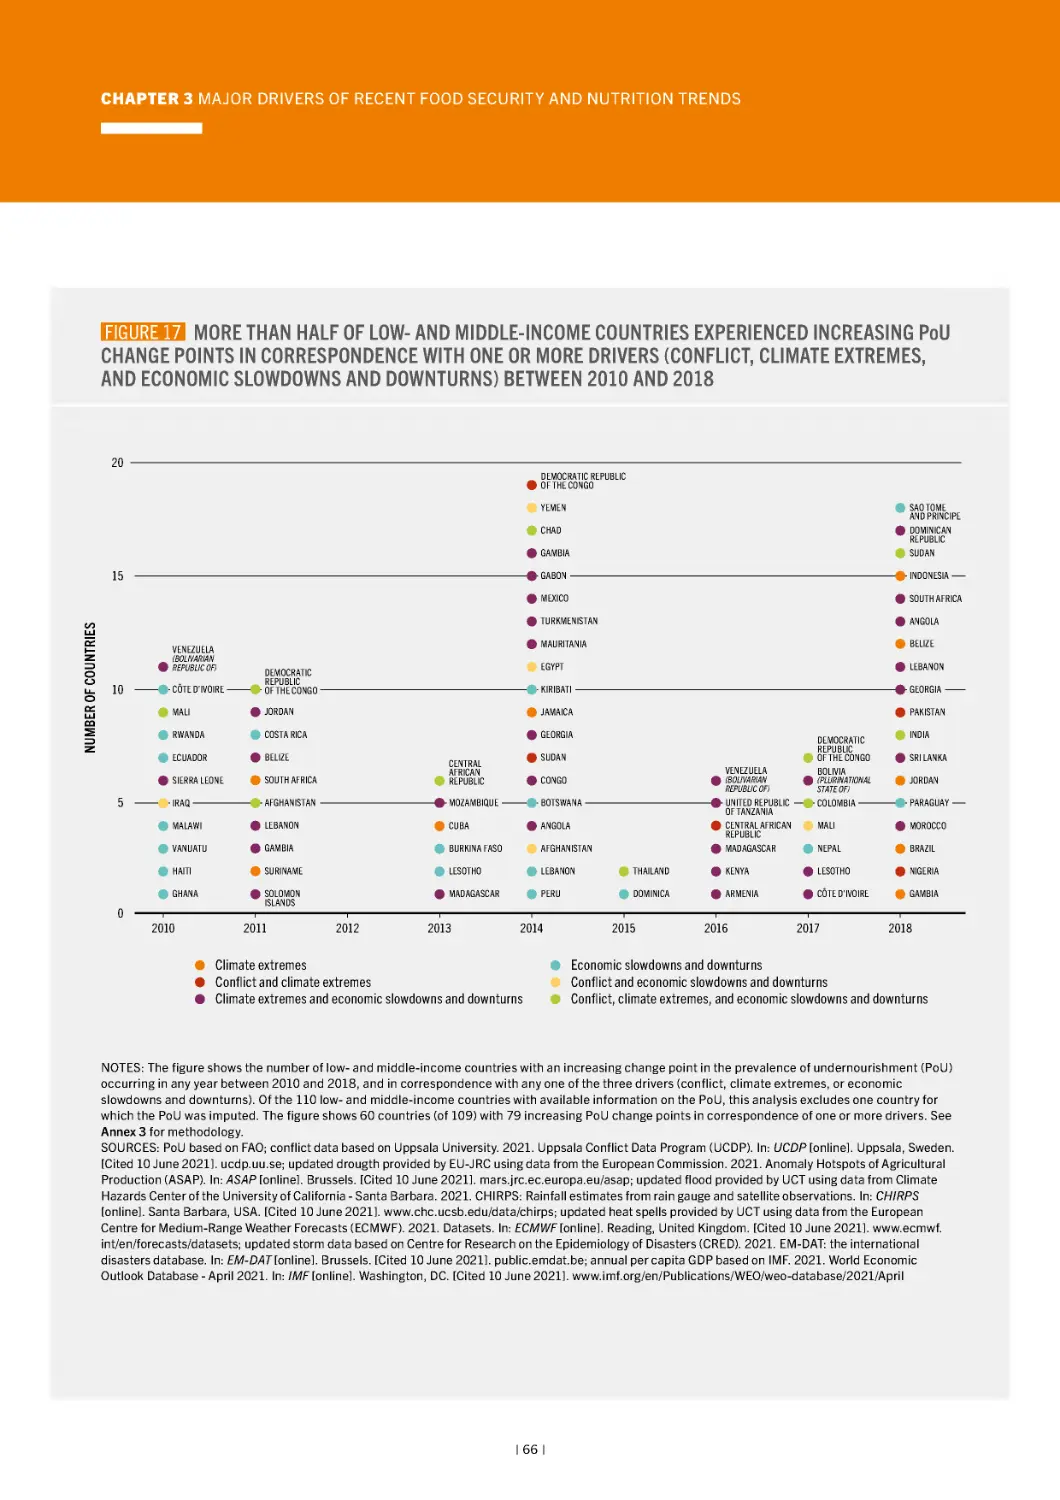
17 More than half of low- and middle-income
countries experienced increasing PoU change points
in correspondence with one or more drivers (conflict,
climate extremes, and economic slowdowns and
downturns) between 2010 and 2018
66
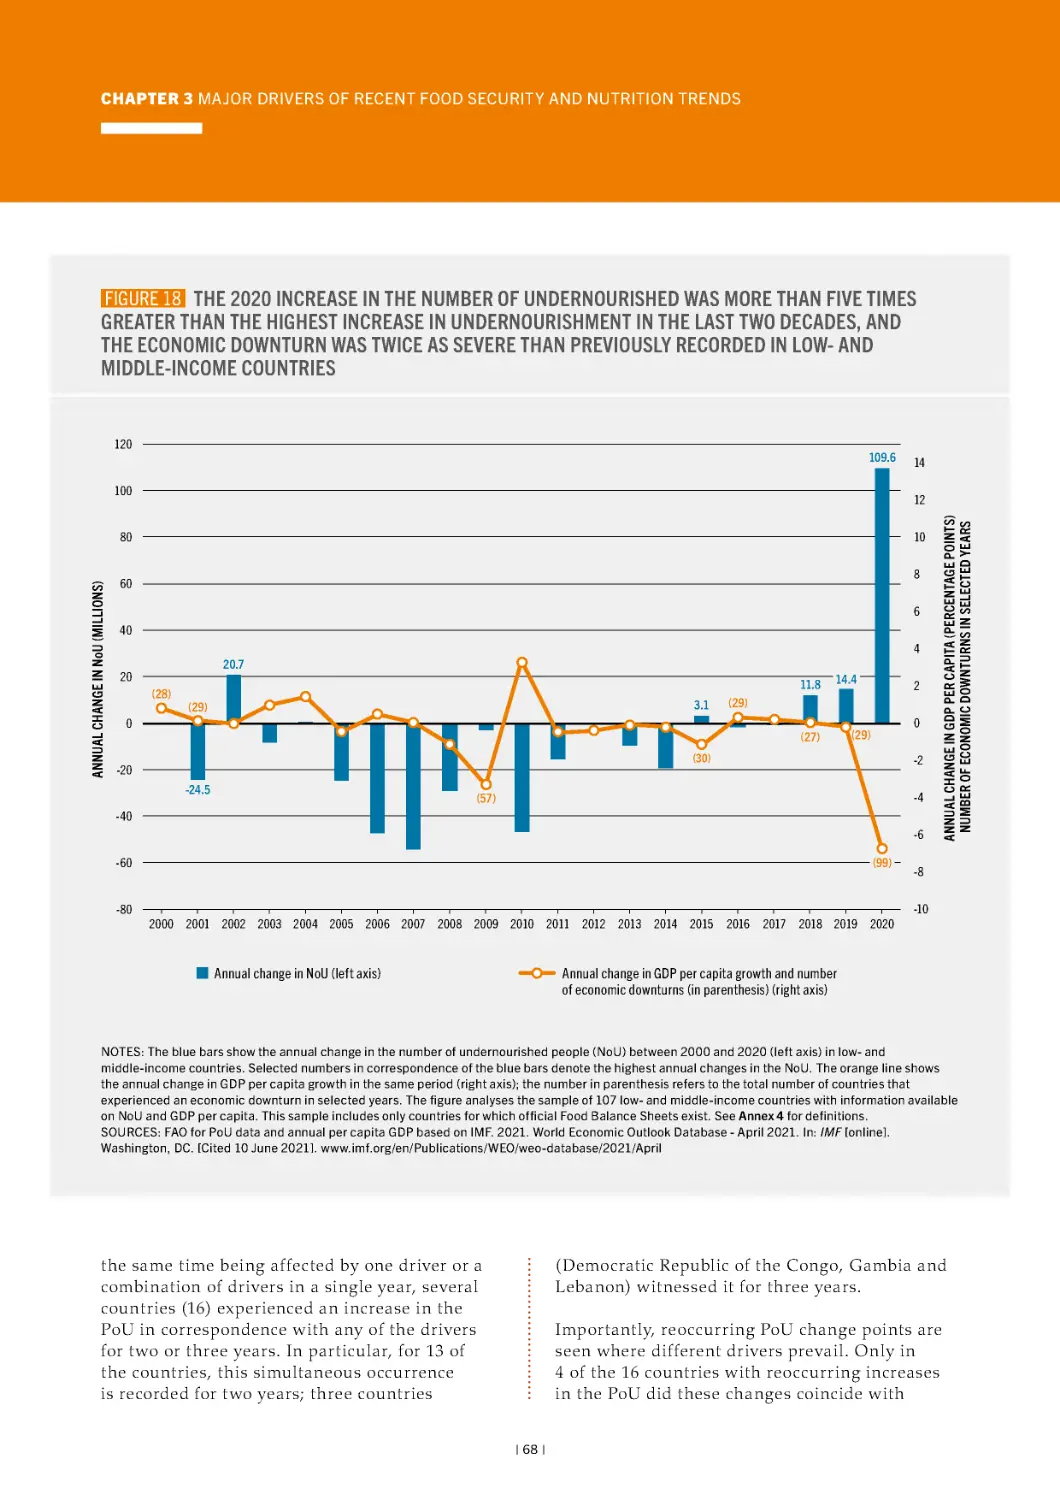
18 The 2020 increase in the number of
undernourished was more than five times greater,
than the highest increase in undernourishment in the
last two decades, and the economic downturn was
twice as severe, than previously recorded in low- and
middle-income countries
68
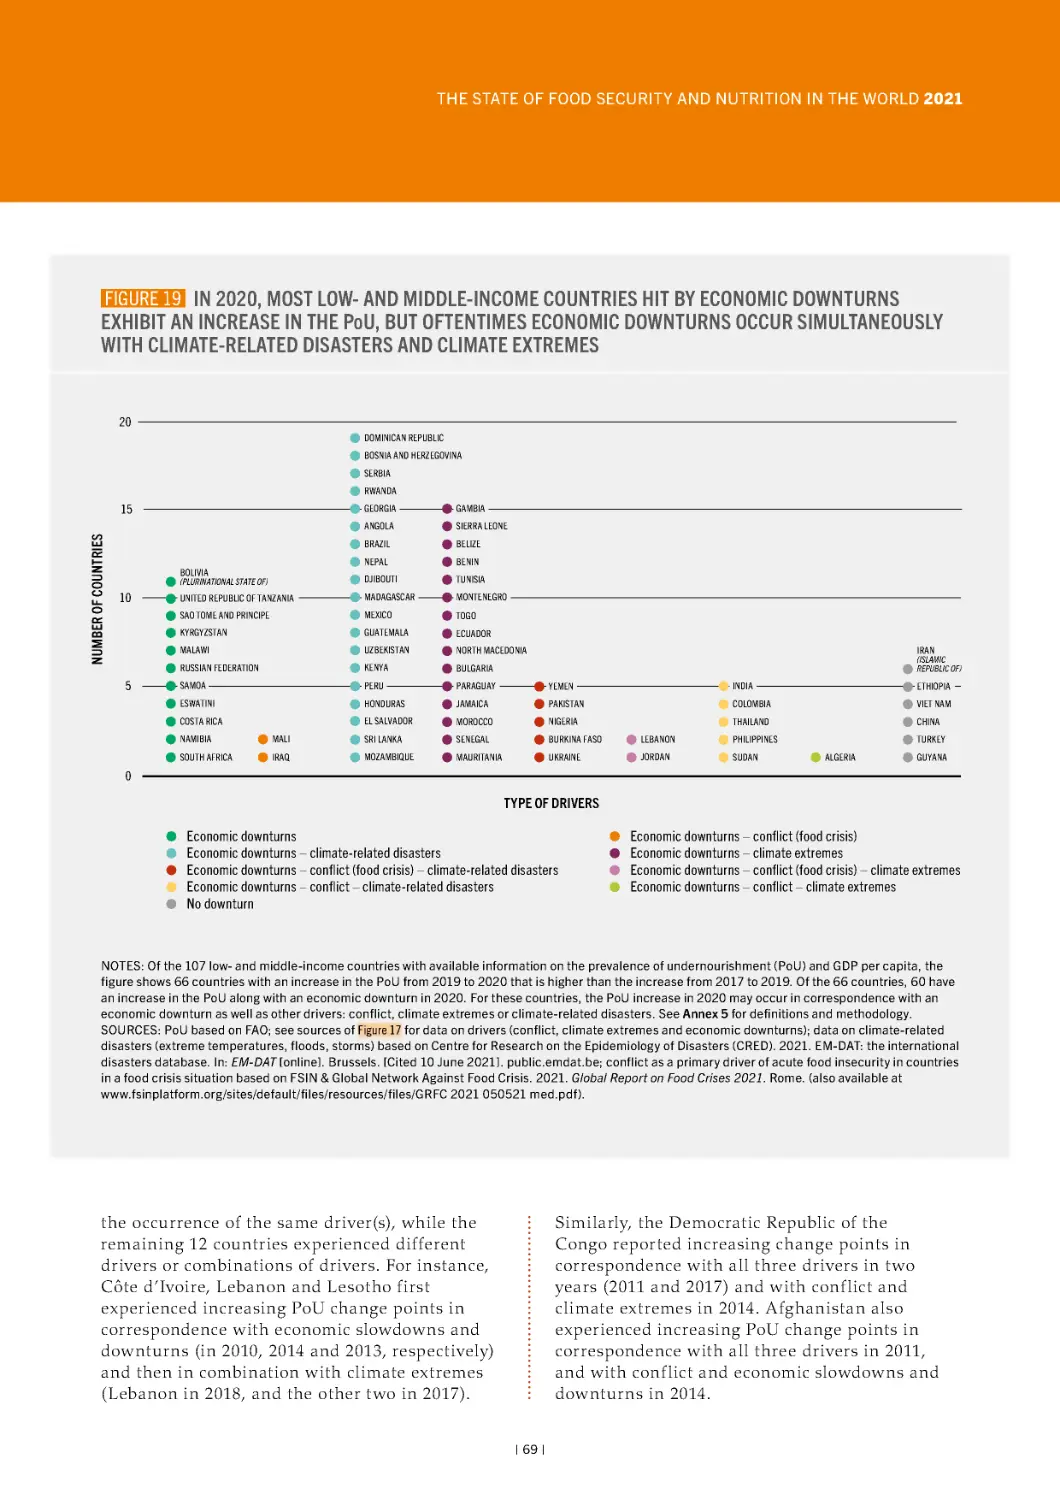
hit by economic downturns exhibit an increase in the
PoU, but oftentimes economic downturns occur
simultaneously with climate-related disasters and
climate extremes
69
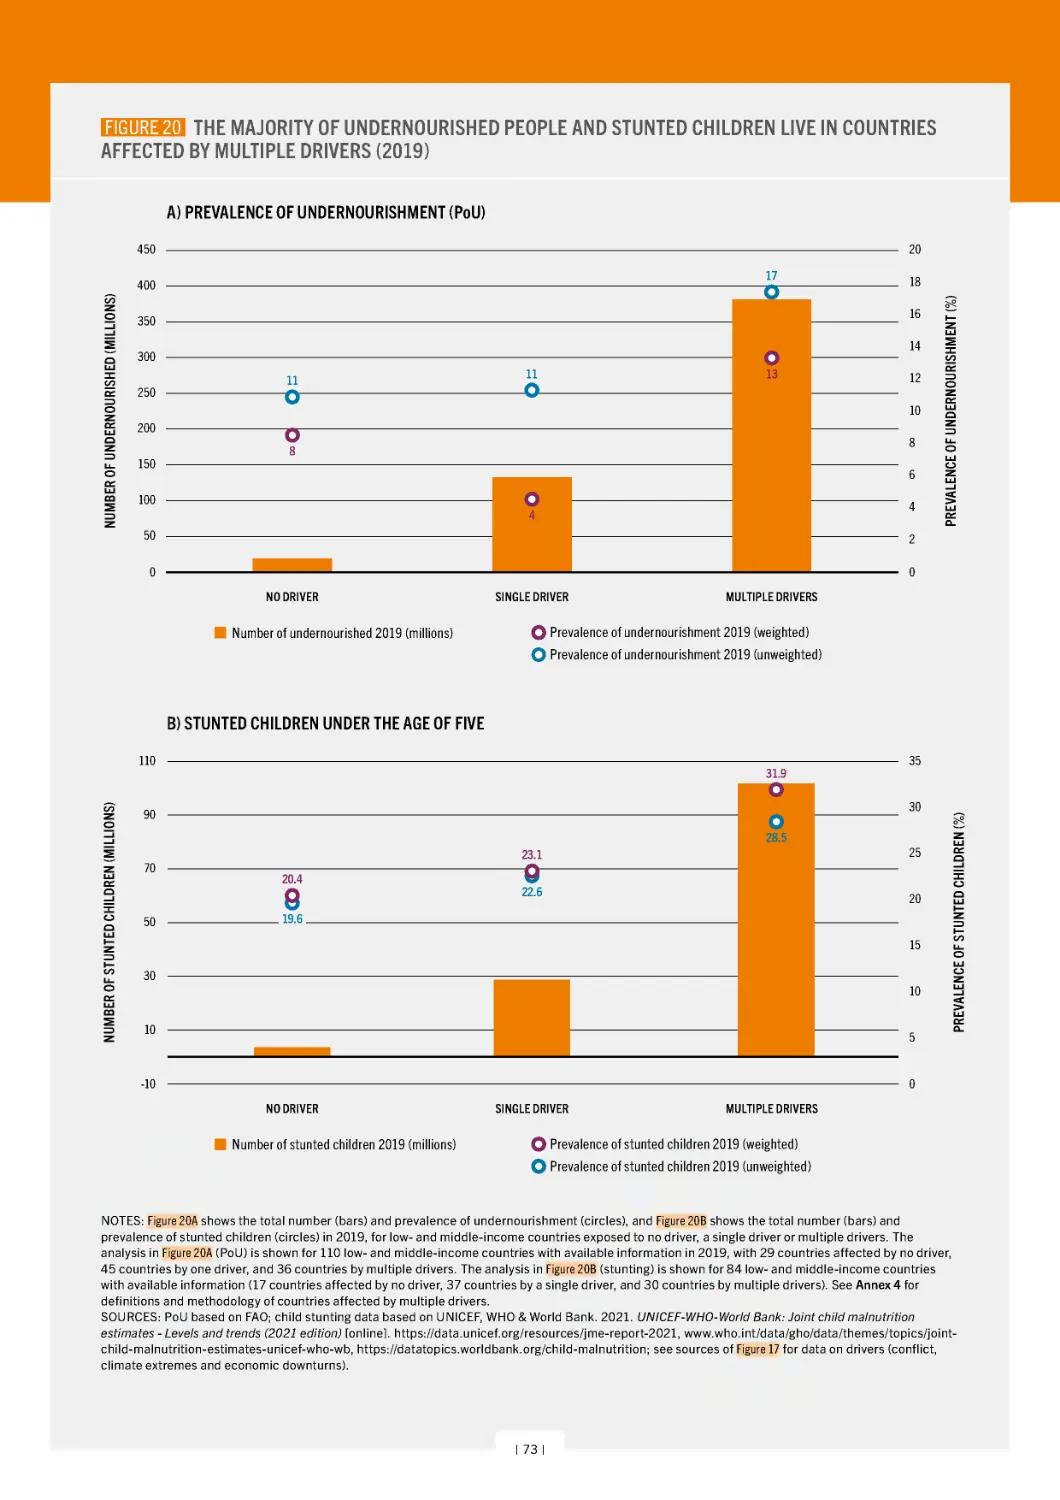
20 The majority of undernourished people and
stunted children live in countries affected by multiple
drivers (2019)
73
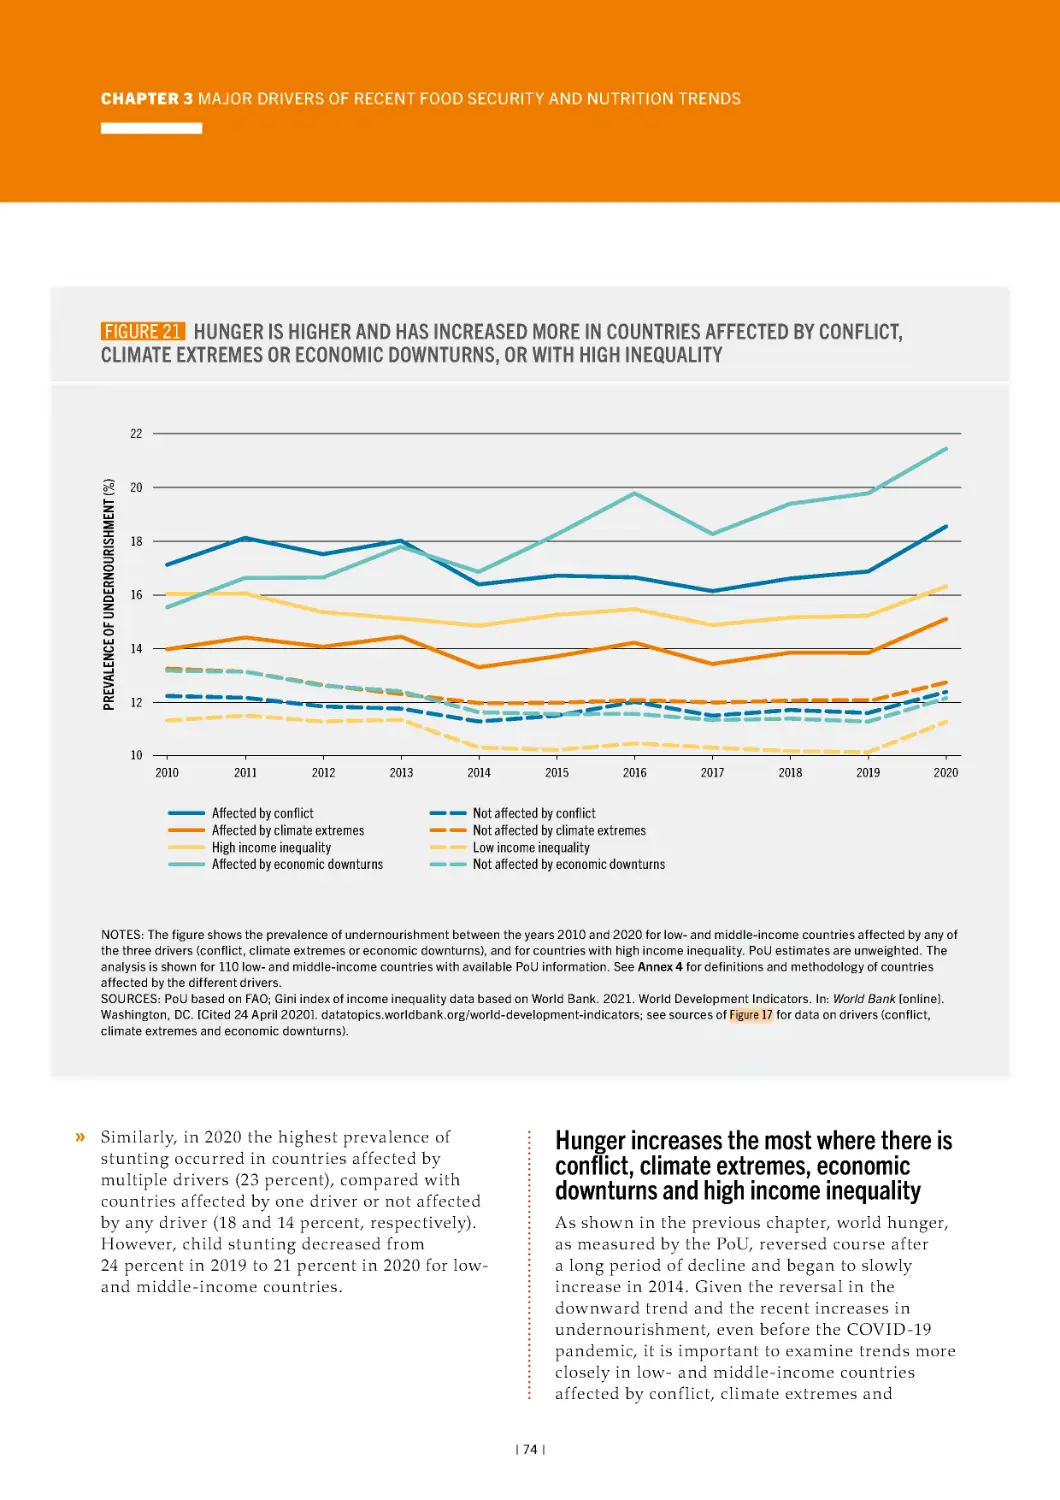
21 Hunger is higher and has increased more in
countries affected by conflict, climate extremes or
economic downturns, or with high inequality
74
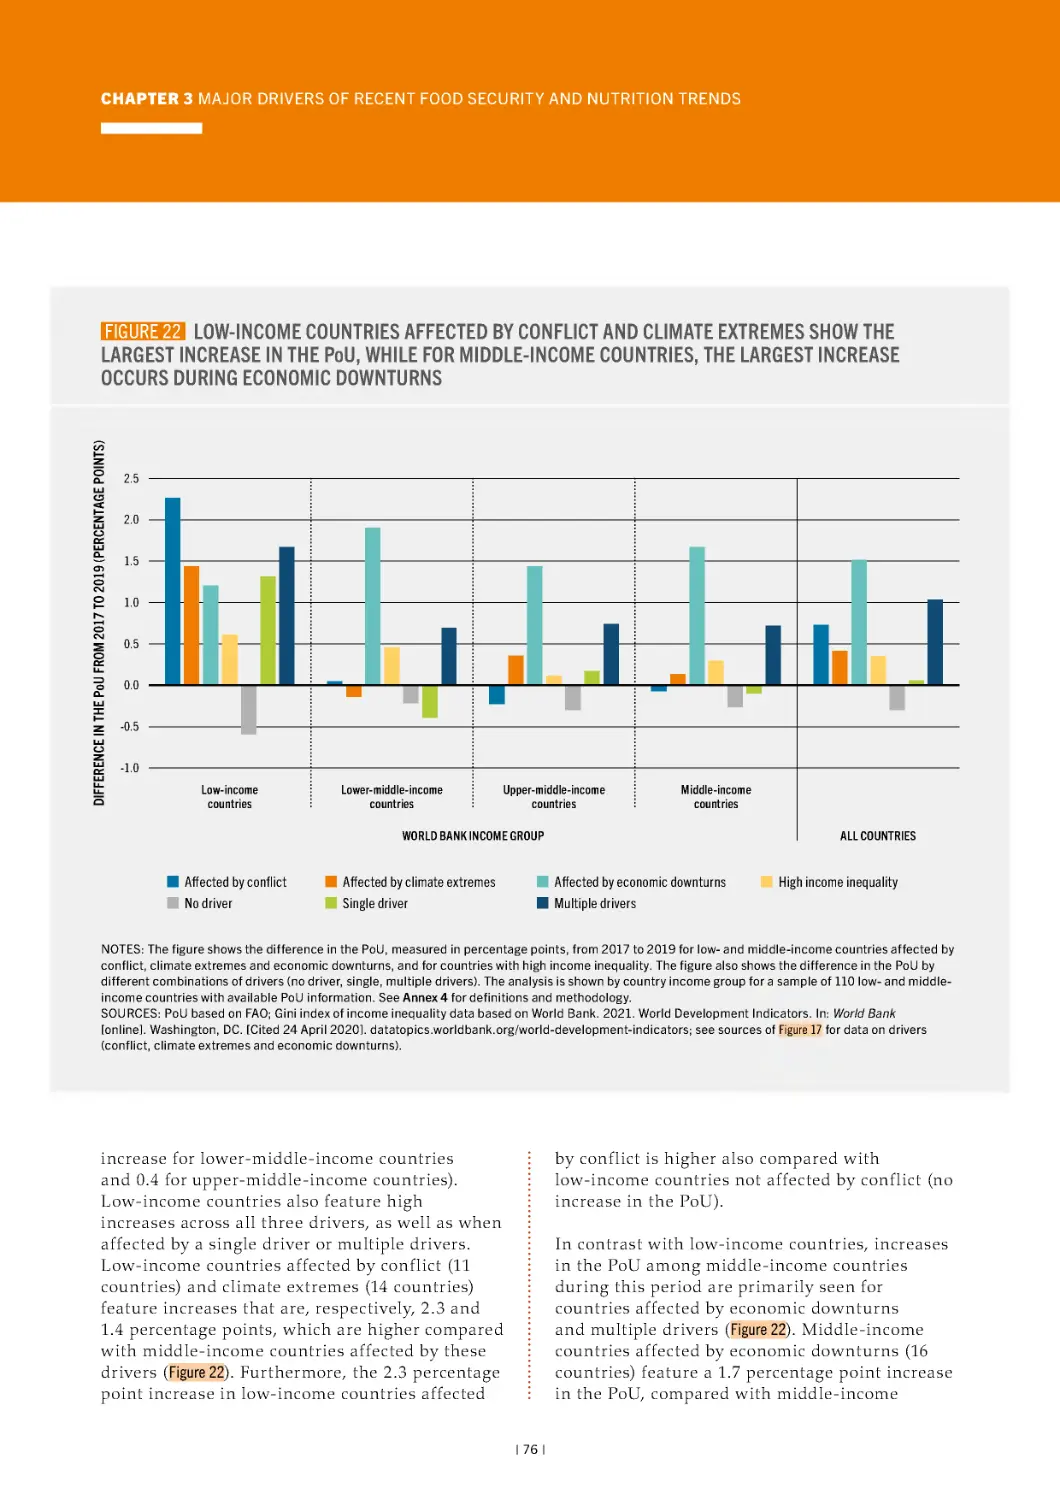
22 Low-income countries affected by conflict and
climate extremes show the largest increase in the
PoU, while for middle-income countries, the largest
increase occurs during economic downturns
76
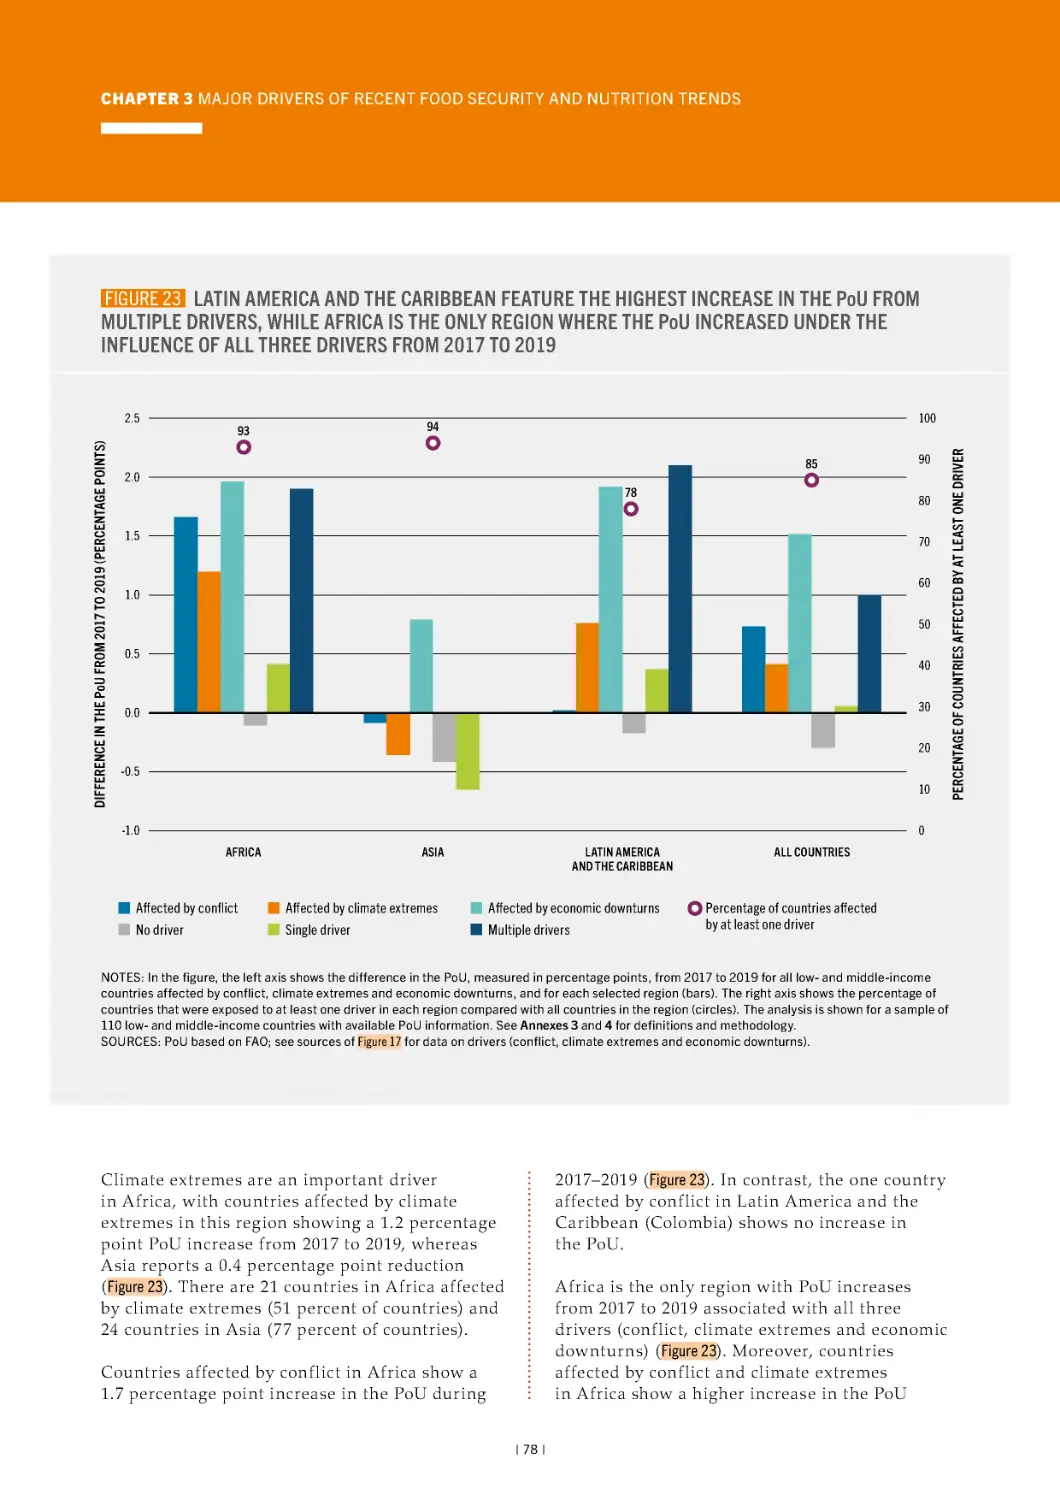
23 Latin America and the Caribbean feature the
46
highest increase in the PoU from multiple drivers,
while Africa is the only region where the PoU
increased under the influence of all three drivers
from 2017 to 2019
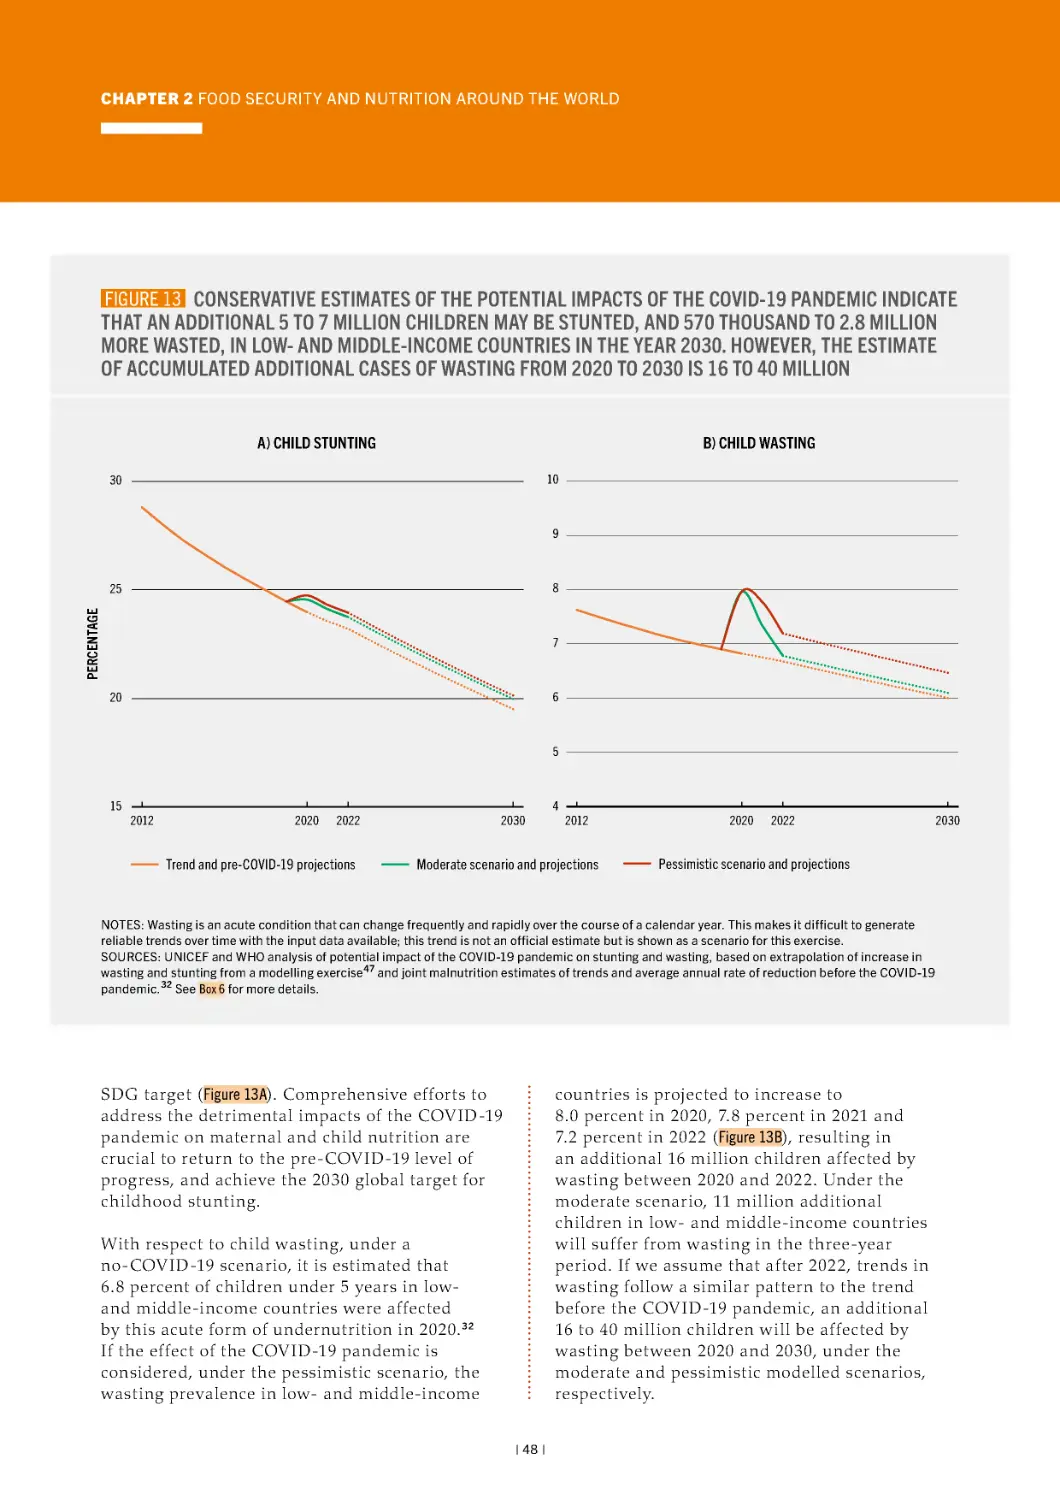
13 Conservative estimates of the potential impacts
of the COVID-19 pandemic indicate that an additional
5 to 7 million children may be stunted, and
570 thousand to 2.8 million more wasted, in low- and
middle-income countries in the year 2030. However,
the estimate of accumulated additional cases of
wasting from 2020 to 2030 is 16 to 40 million
53
19 In 2020, most low- and middle-income countries
34
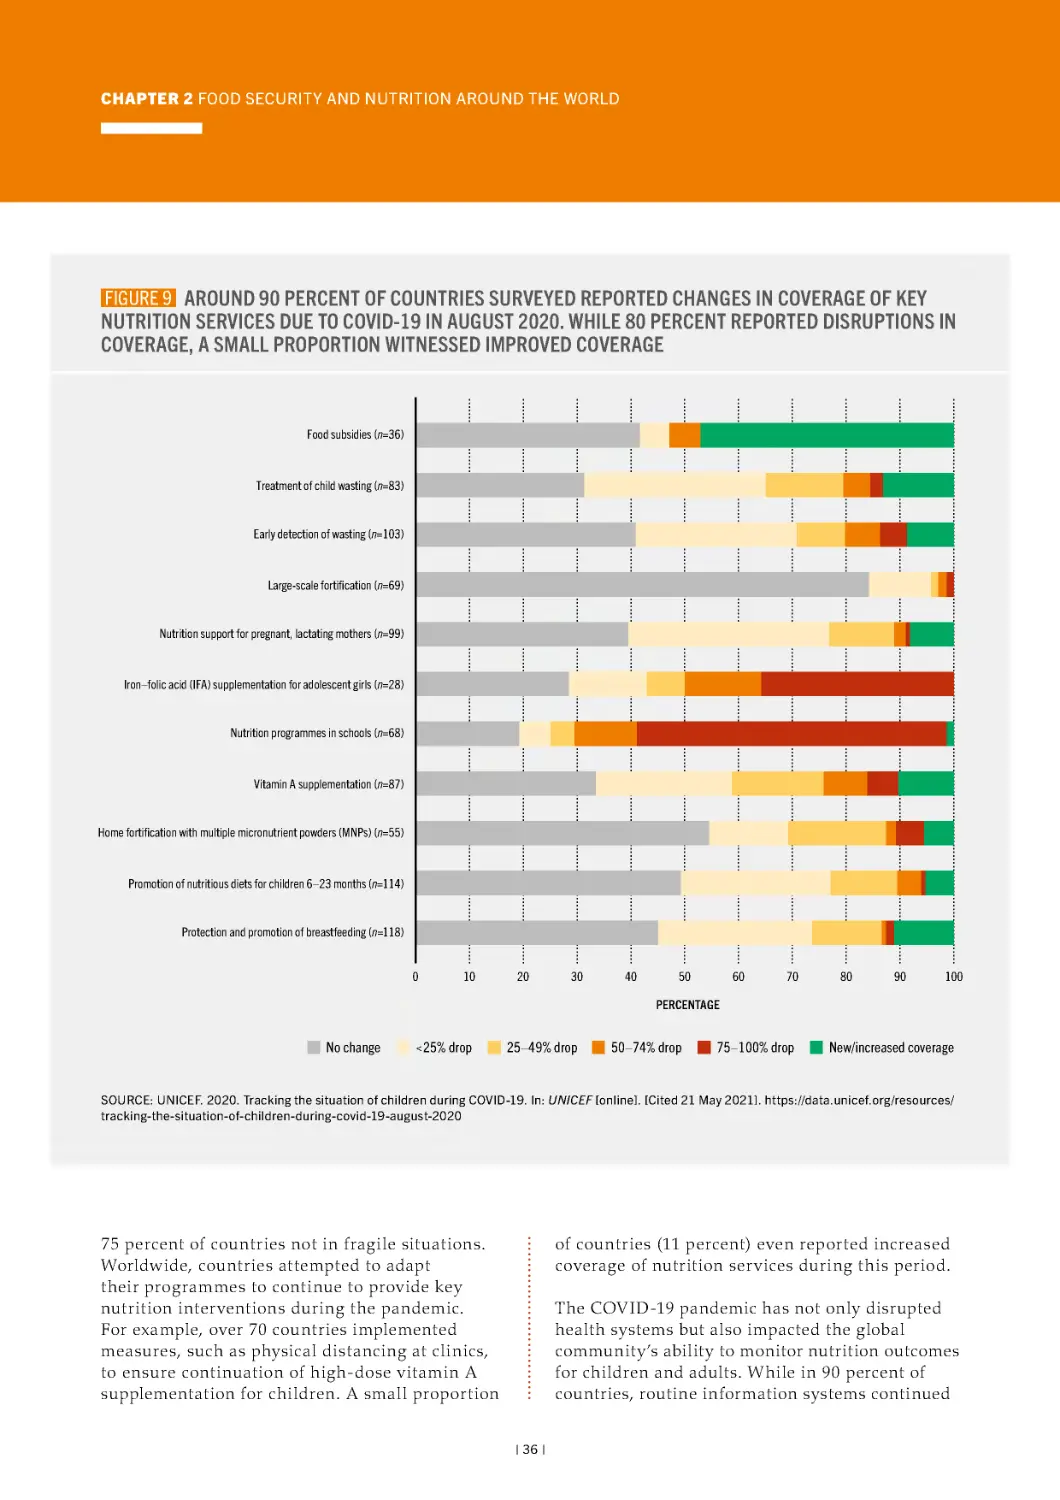
9 Around 90 percent of countries surveyed reported
changes in coverage of key nutrition services due to
COVID-19 in August 2020. While 80 percent reported
disruptions in coverage, a small proportion witnessed
improved coverage
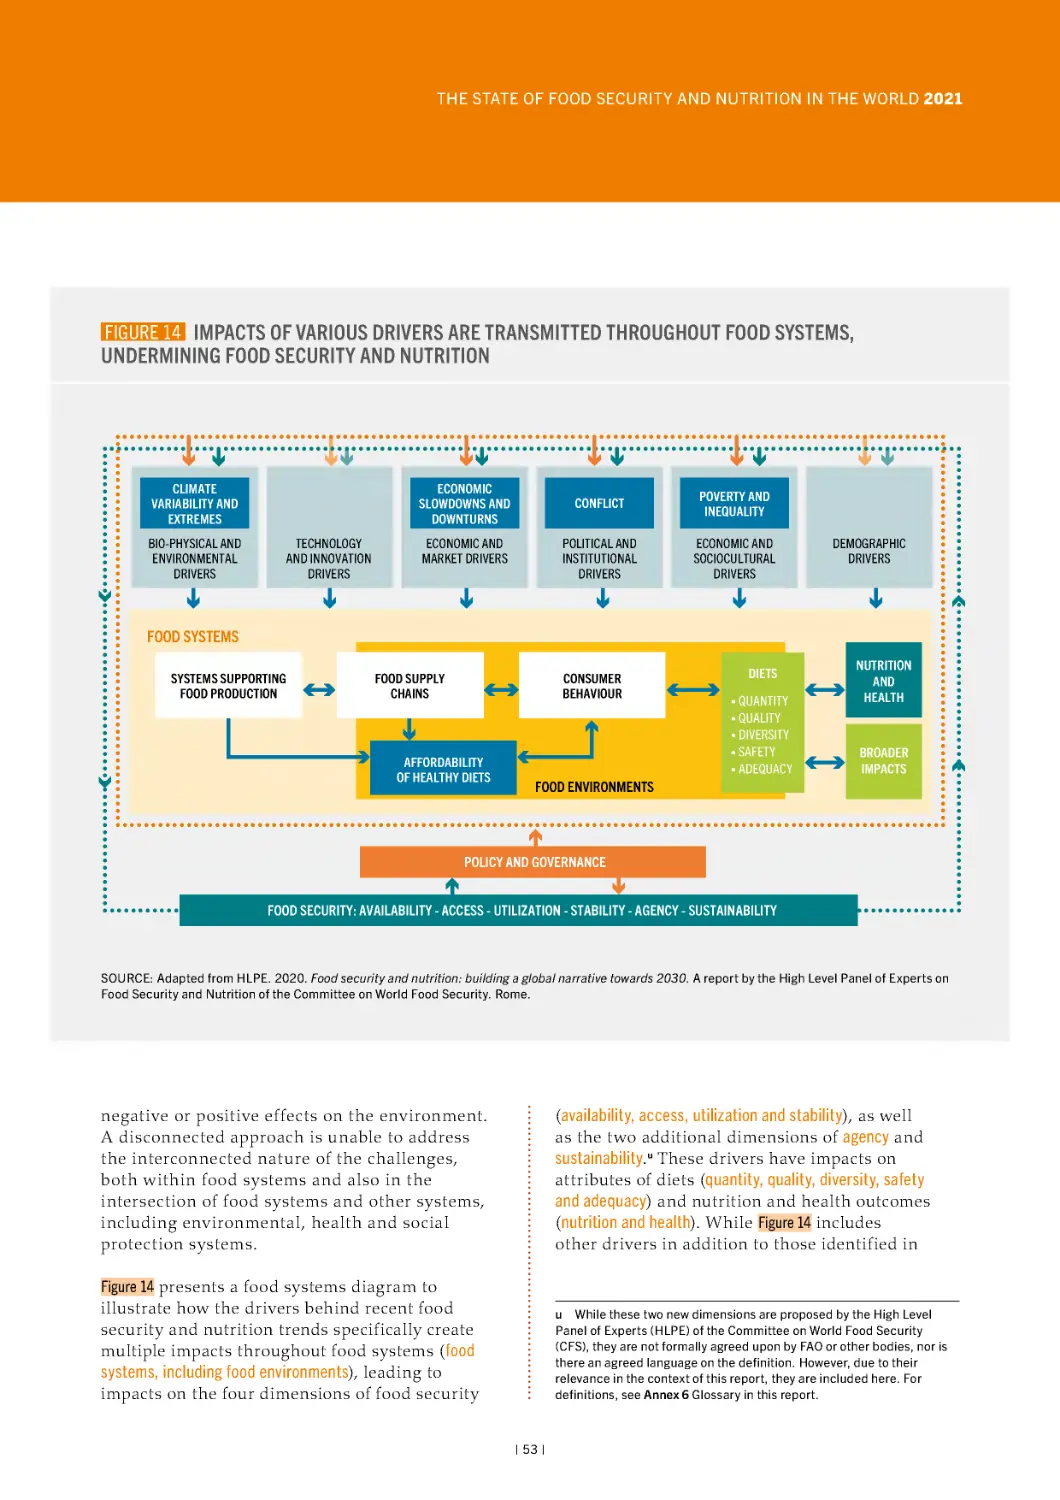
14 Impacts of various drivers are transmitted
throughout food systems, undermining food
security and nutrition
48
| iv |
78
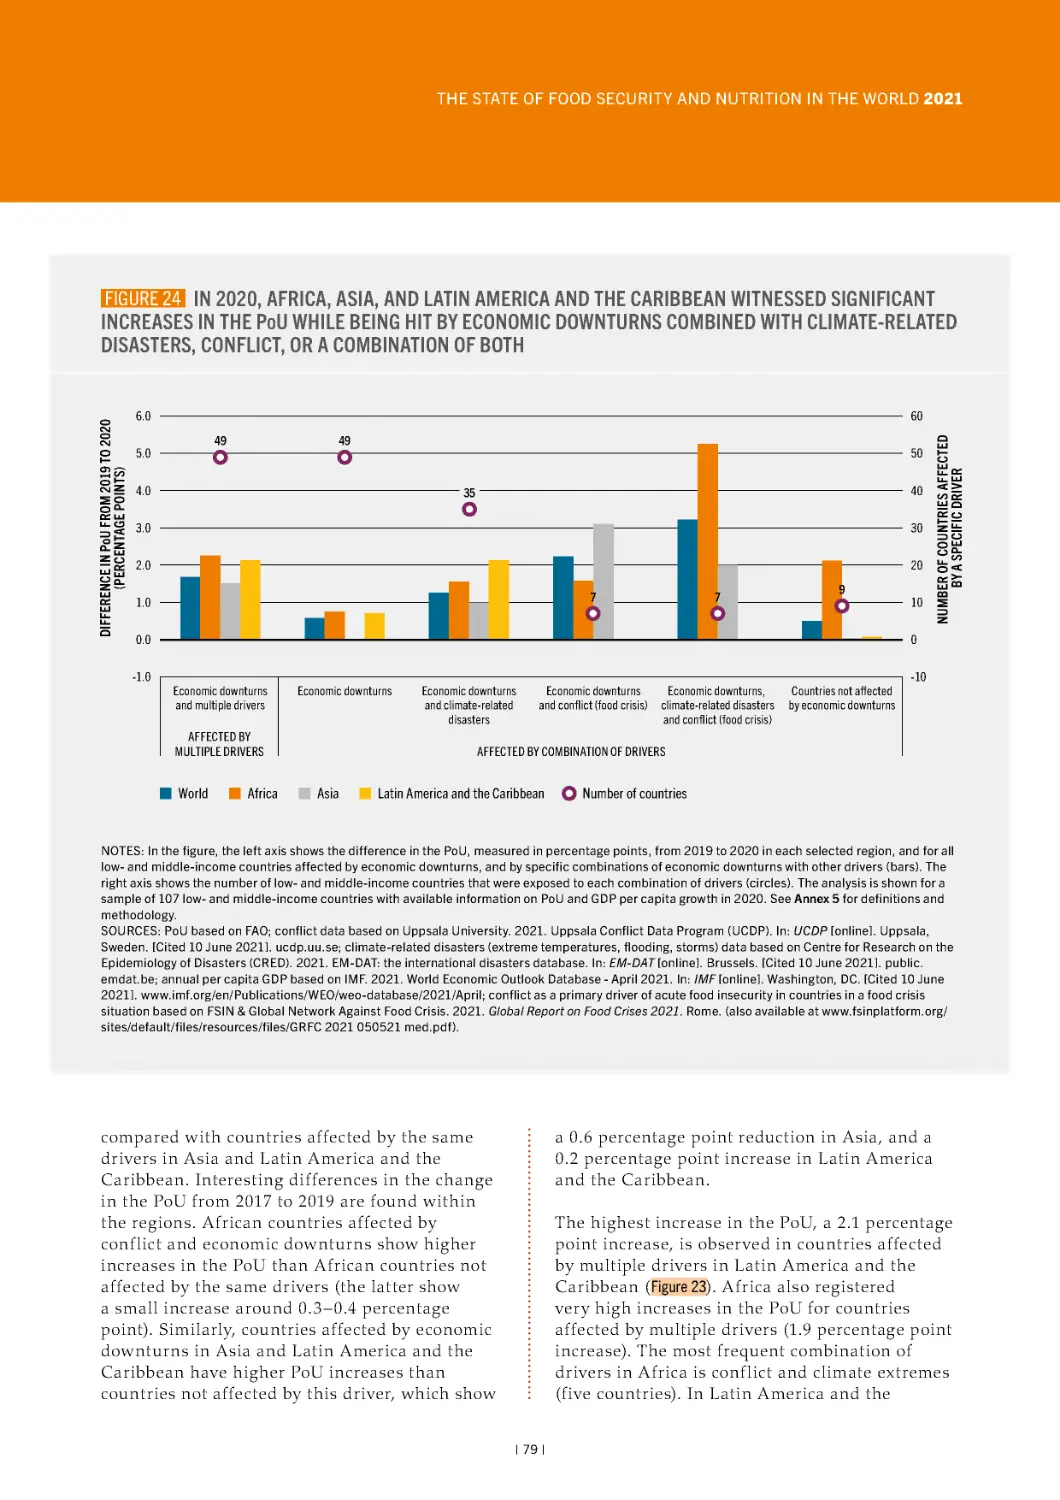
24 In 2020, Africa, Asia, and Latin America and the
Caribbean witnessed significant increases in the PoU
while being hit by economic downturns combined
with climate-related disasters, conflict, or a
combination of both
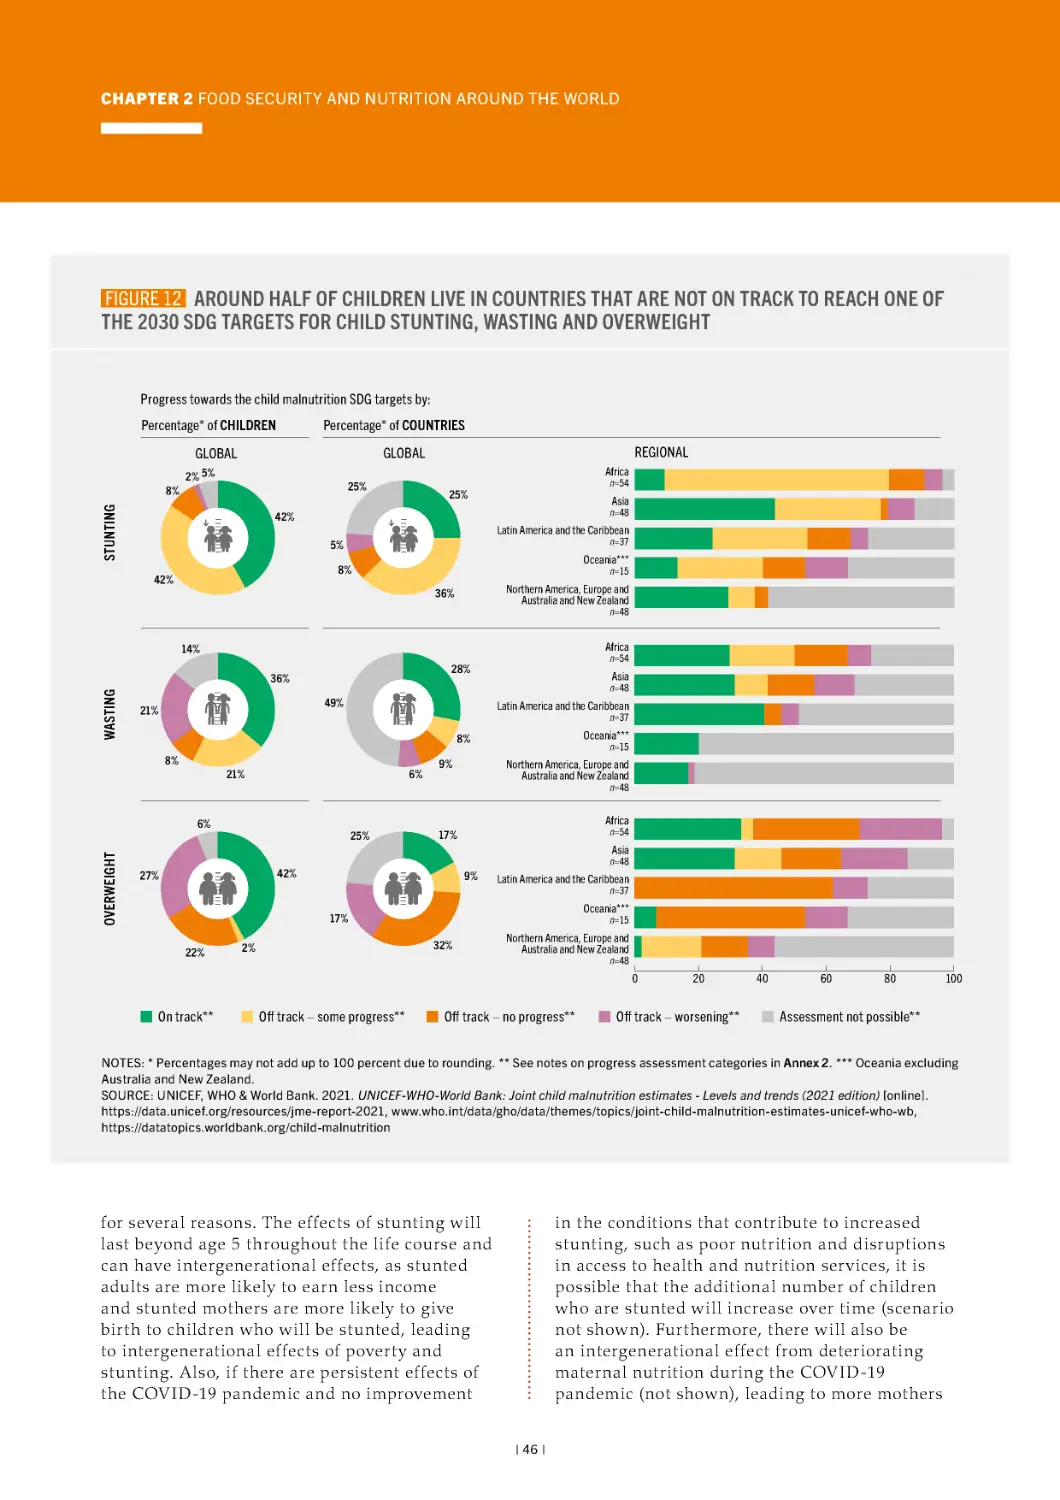
6 Methodology: estimates of potential additional
cases of stunting and wasting due to the COVID-19
pandemic based on a scenario
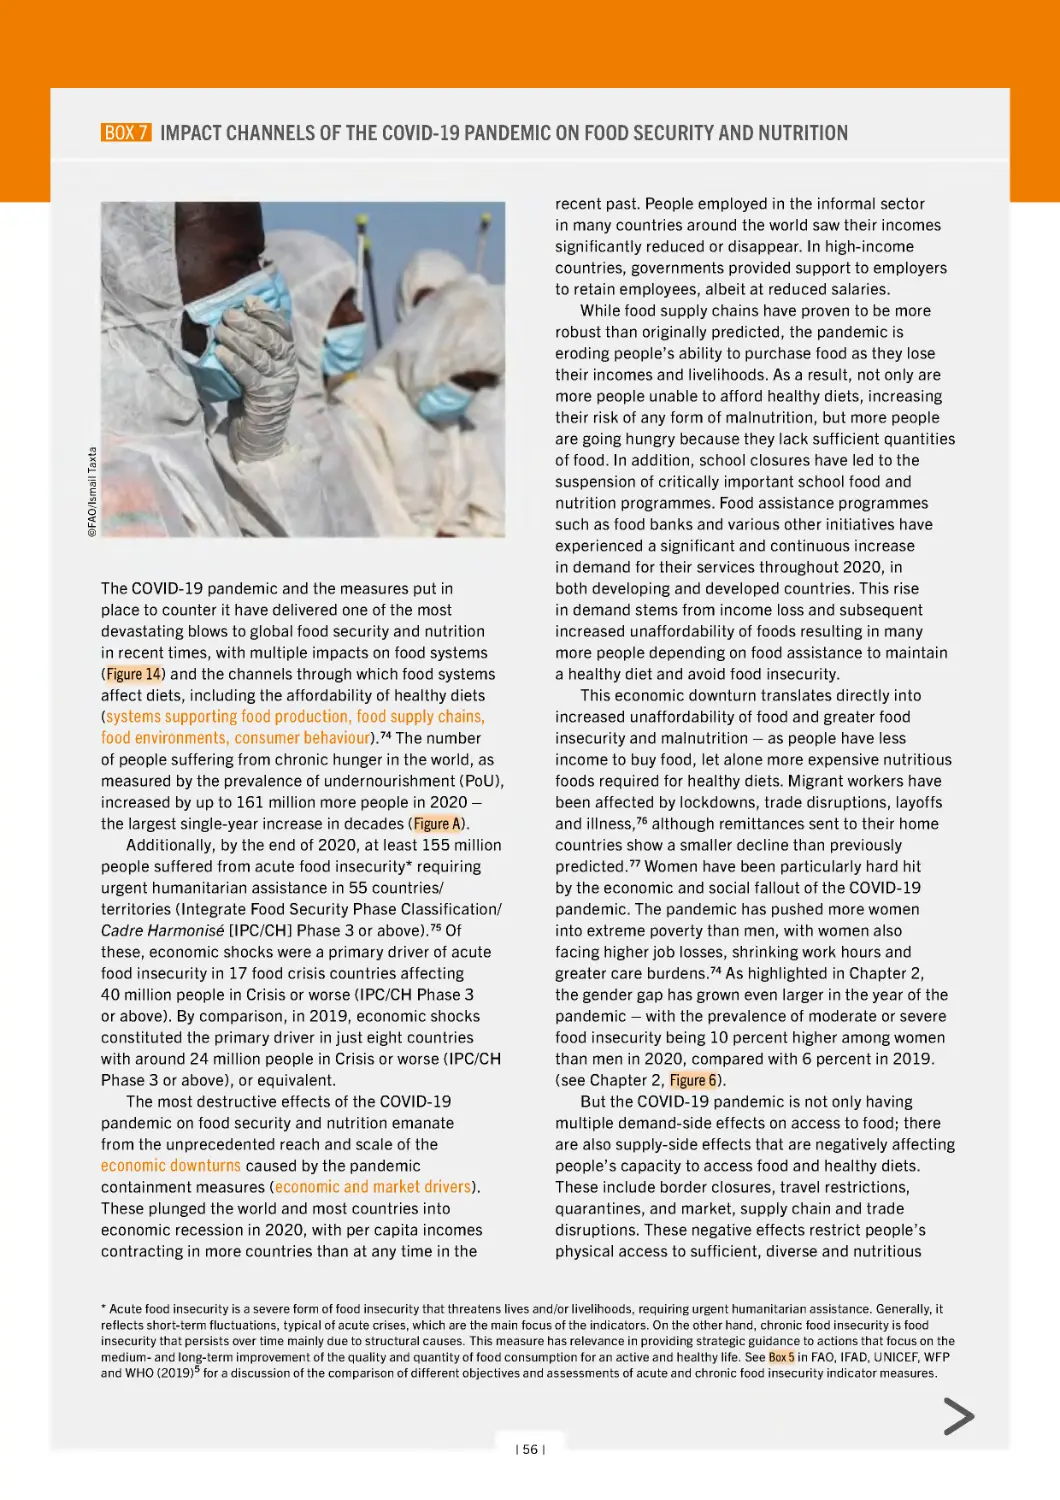
7 Impact channels of the COVID-19 pandemic on
79
food security and nutrition
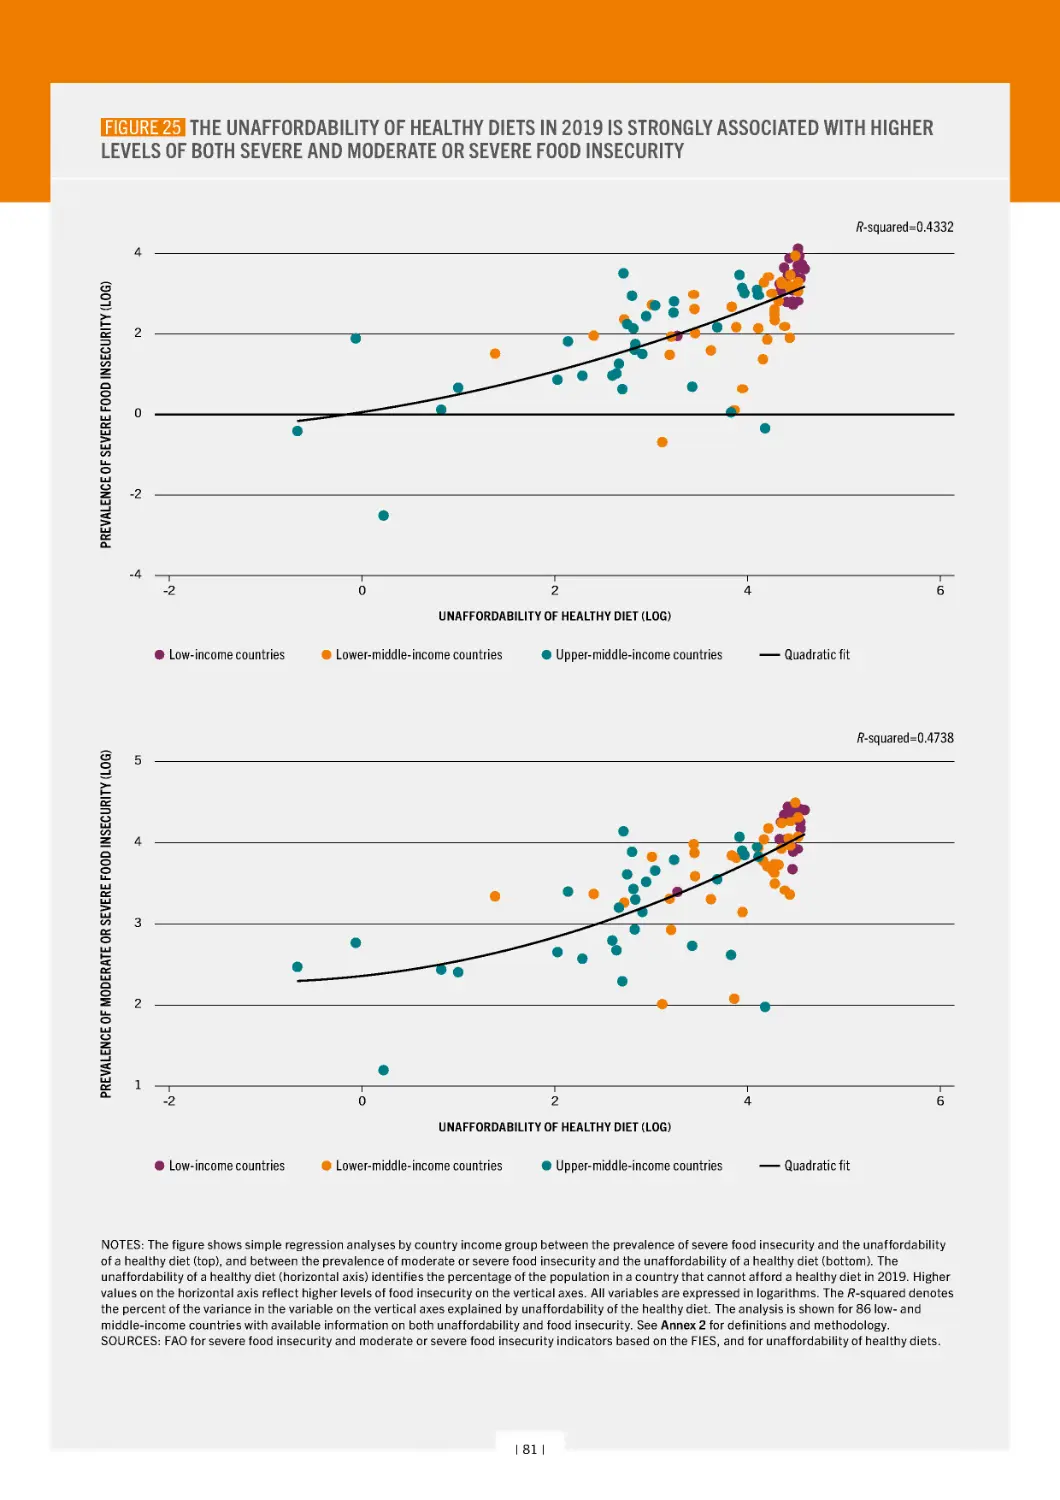
25 The unaffordability of healthy diets in 2019 is
strongly associated with higher levels of both severe
and moderate or severe food insecurity
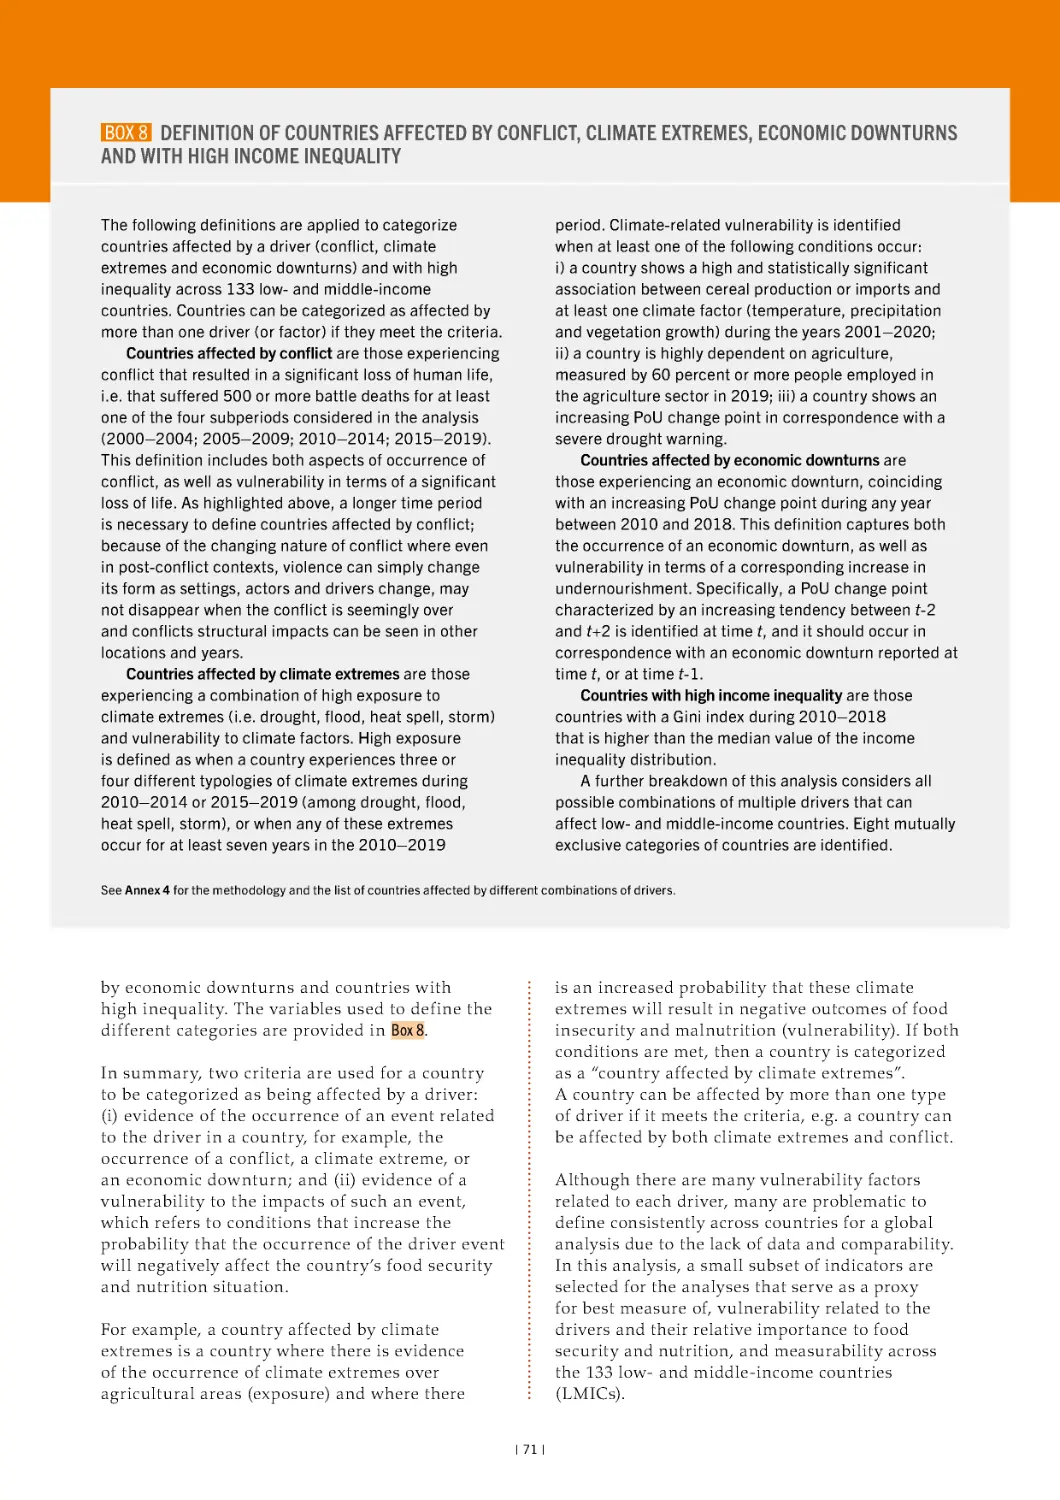
climate extremes, economic downturns and with
high income inequality
81
systems transformation
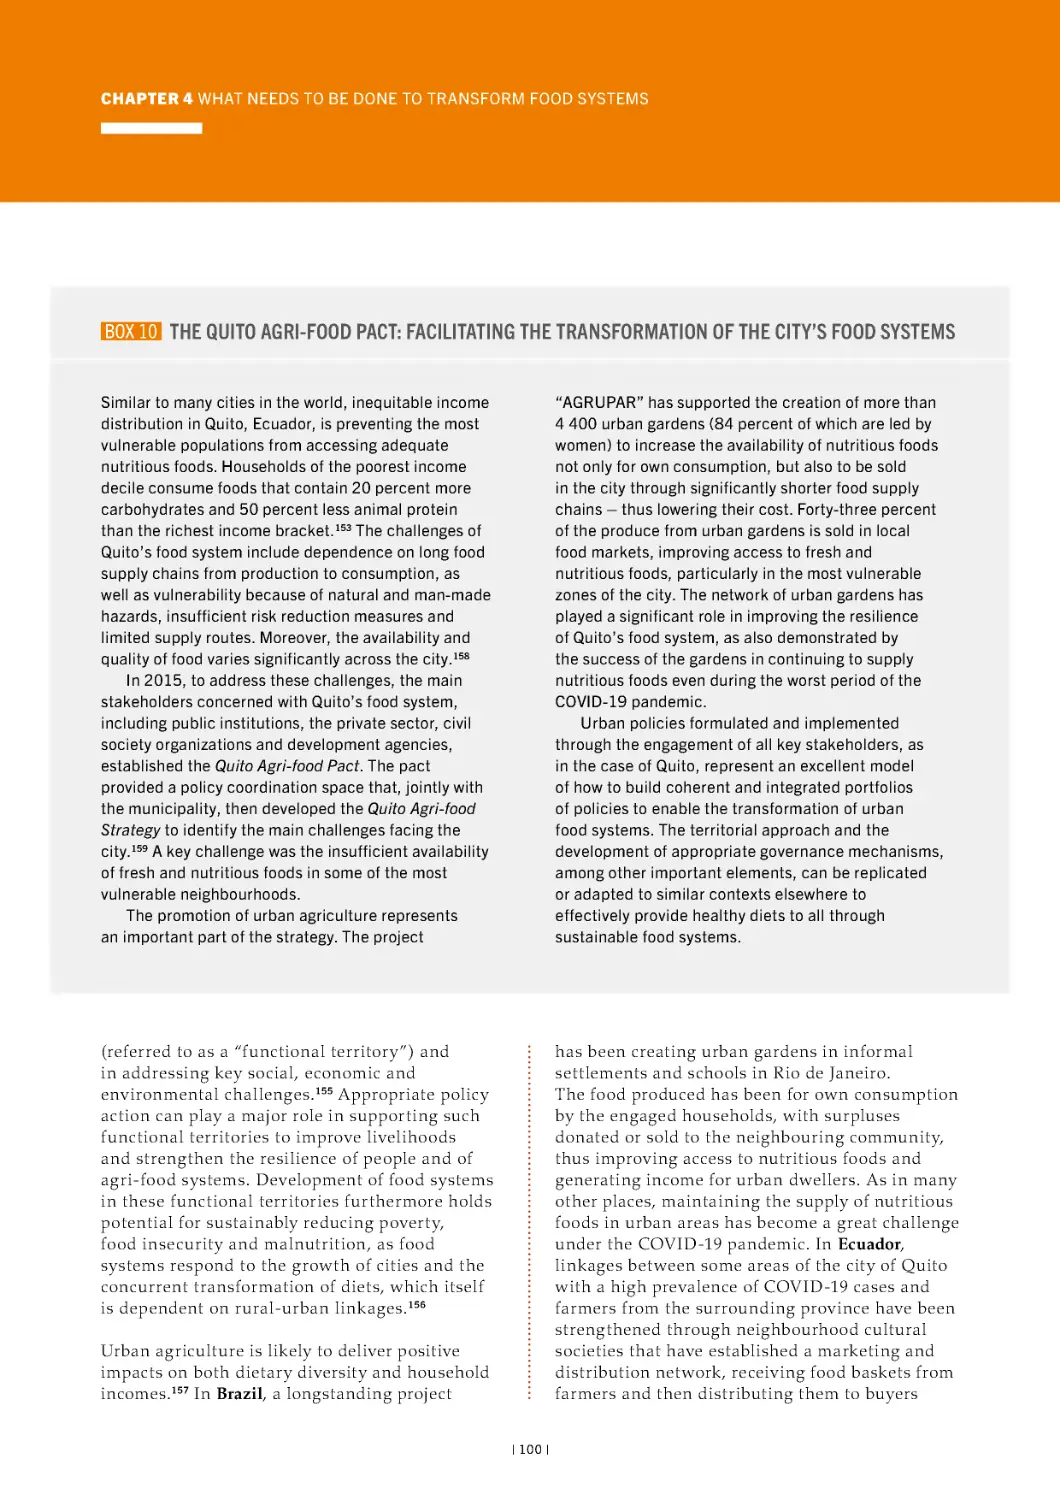
10 The Quito Agri-Food Pact: facilitating the
transformation of the city’s food systems
82
empowering women and youth
100
104
12 Protecting children from the harmful impacts of
food marketing
88
106
13 Nutrition policy measures to enhance benefits
and minimize risks of trade
89
investments
110
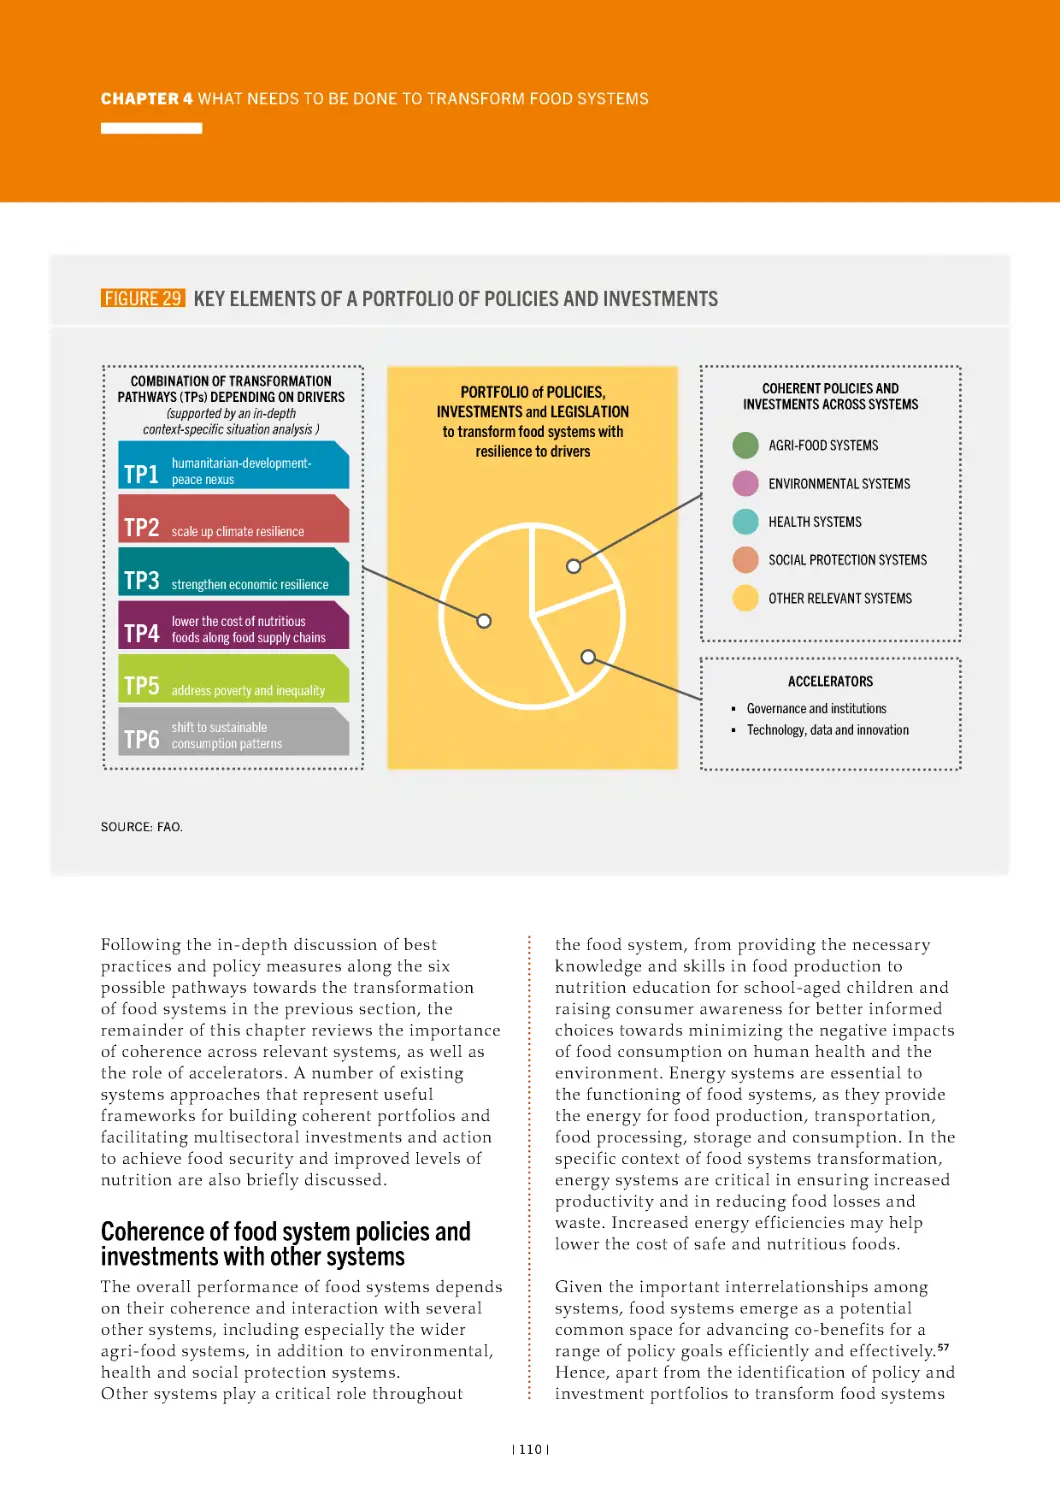
30 Ensuring coherence and complementarity
among agri-food*, environmental, health, social
protection and other** systems for food systems
transformation for food security, improved nutrition
and affordable healthy diets for all
111
A4.1 Countries by combination of drivers
183
BOXES
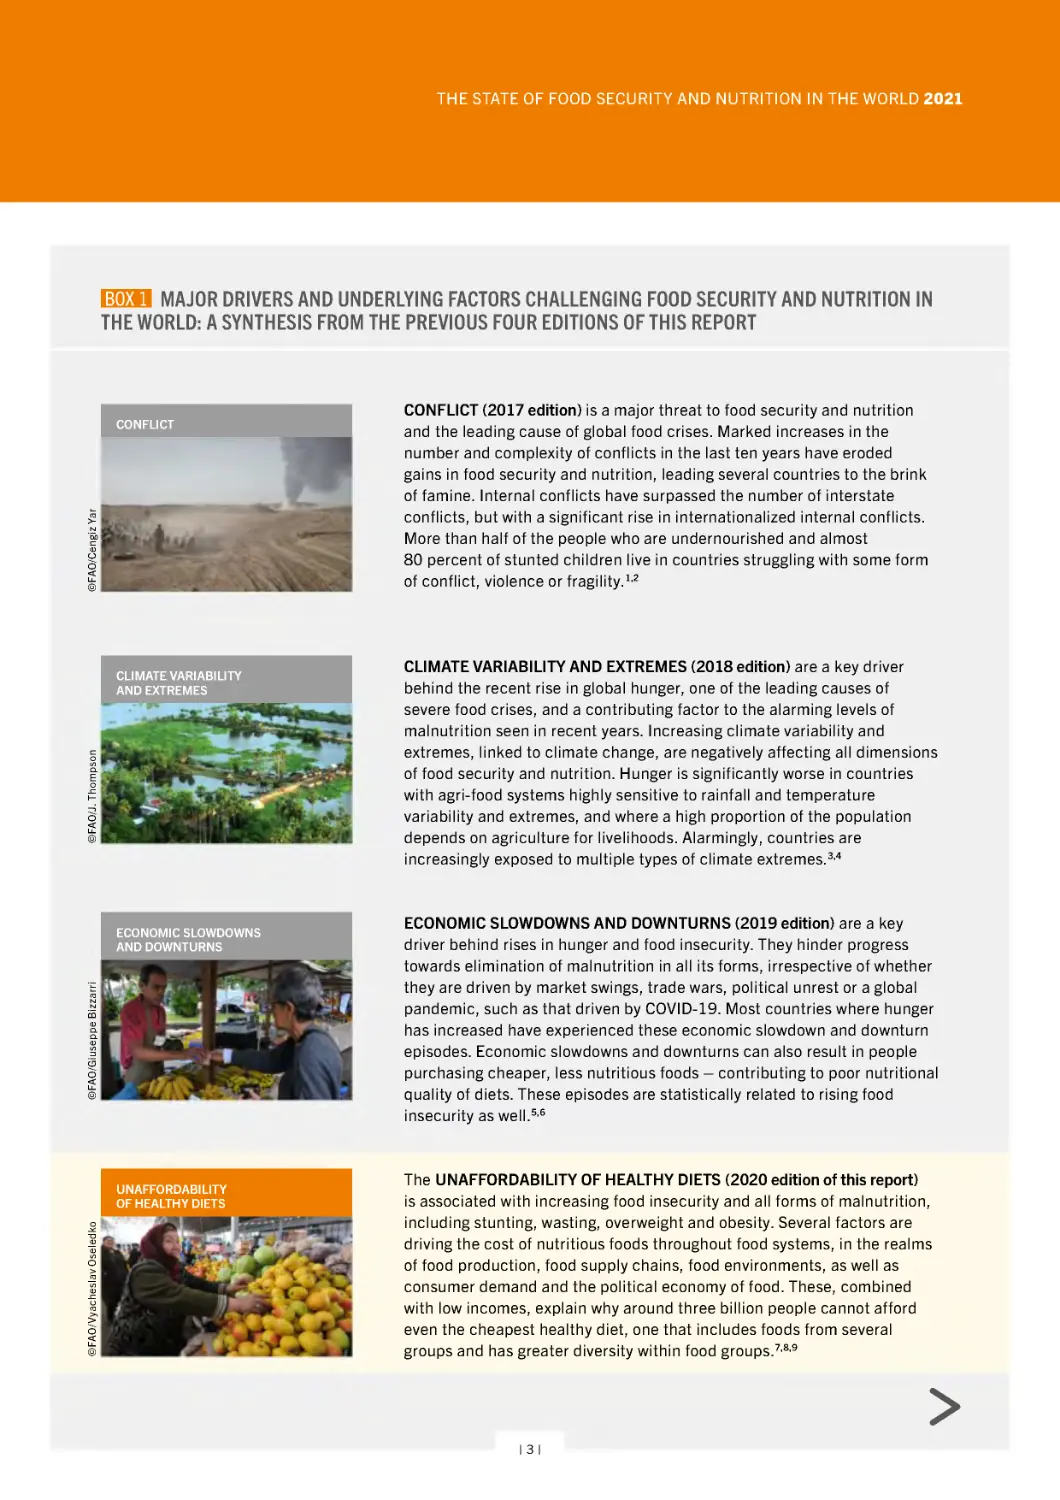
1 Major drivers and underlying factors challenging
food security and nutrition in the world: a synthesis
from the previous four editions of this report
3
2 Updates to the prevalence of undernourishment
and methodology for the 2020 nowcast
9
3 Adapting FIES data collection in the context of the
COVID-19 pandemic in 2020
16
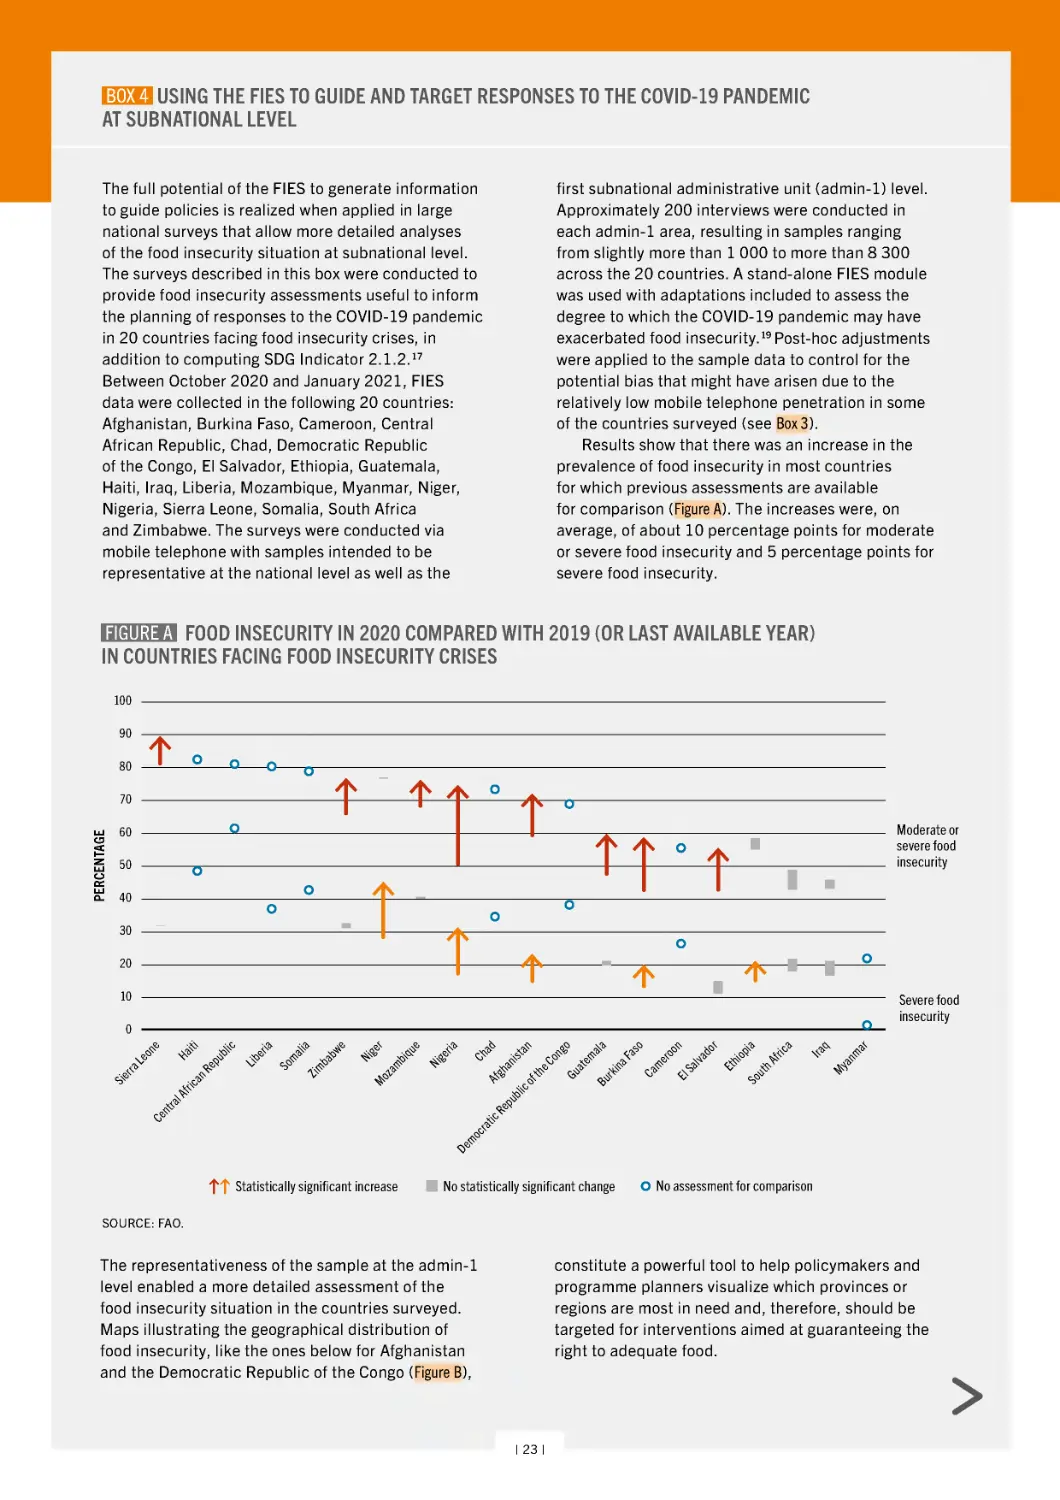
4 Using the FIES to guide and target responses to
the COVID-19 pandemic at subnational level
23
107
14 Indigenous Peoples’ systemic approaches
provide extensive knowledge for the sustainable and
122
inclusive transformation of food systems
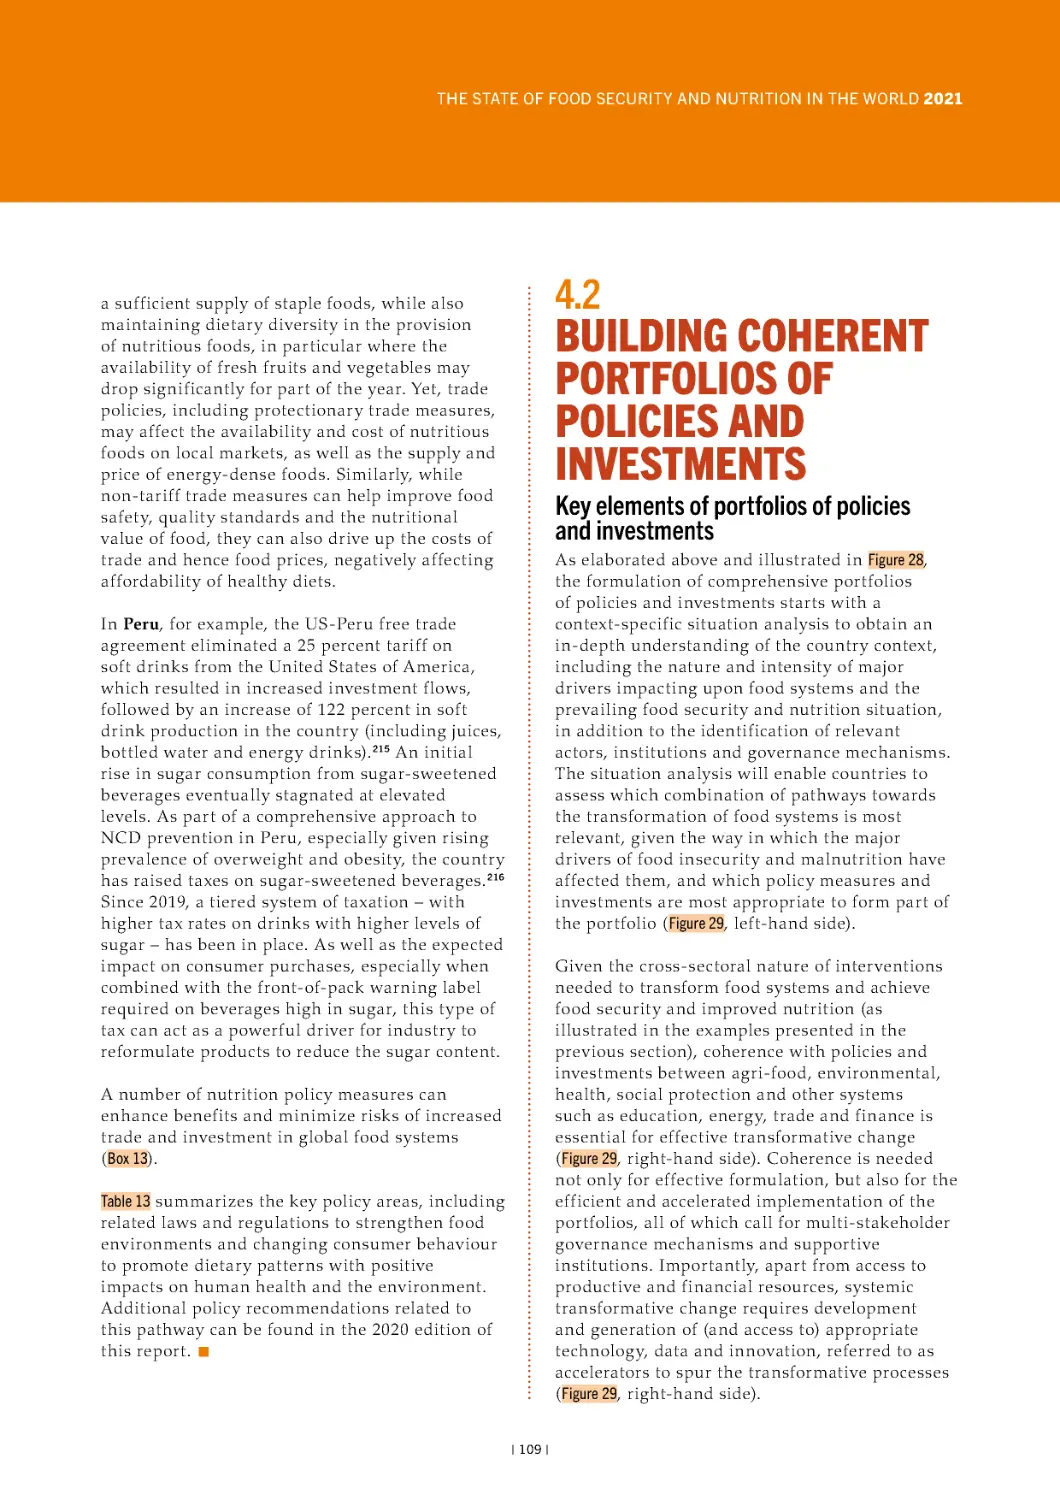
29 Key elements of a portfolio of policies and
5 Assessment of progress towards 2030 targets for
nutrition indicators
97
11 Accelerating food systems transformation by
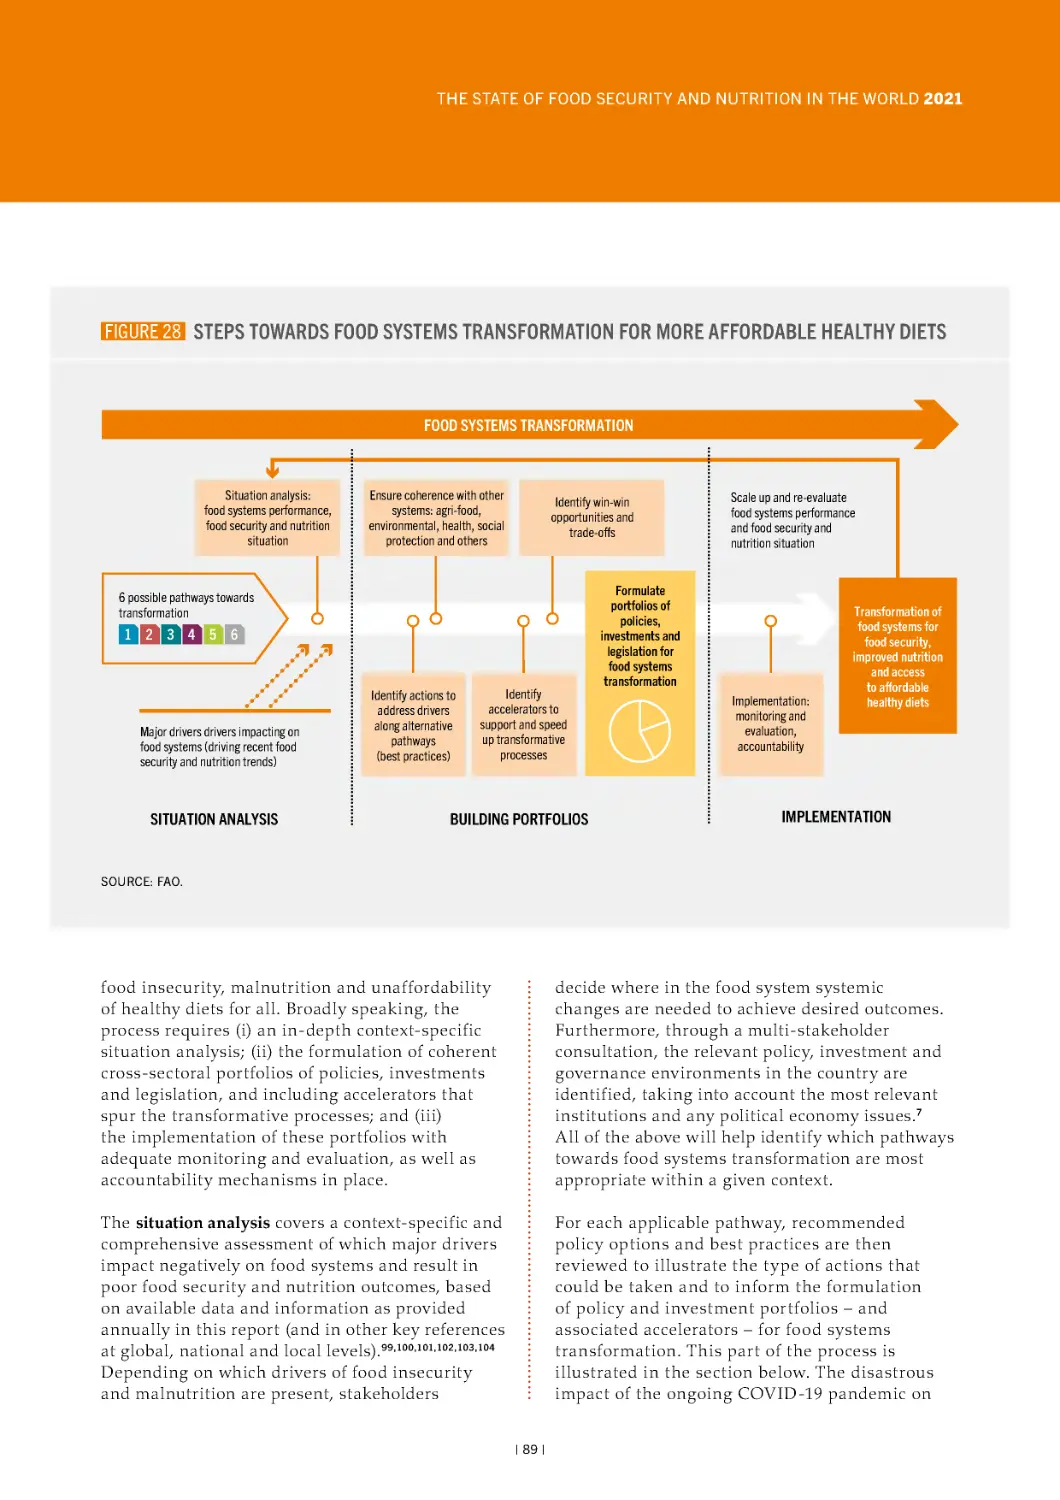
28 Steps towards food systems transformation for
more affordable healthy diets
71
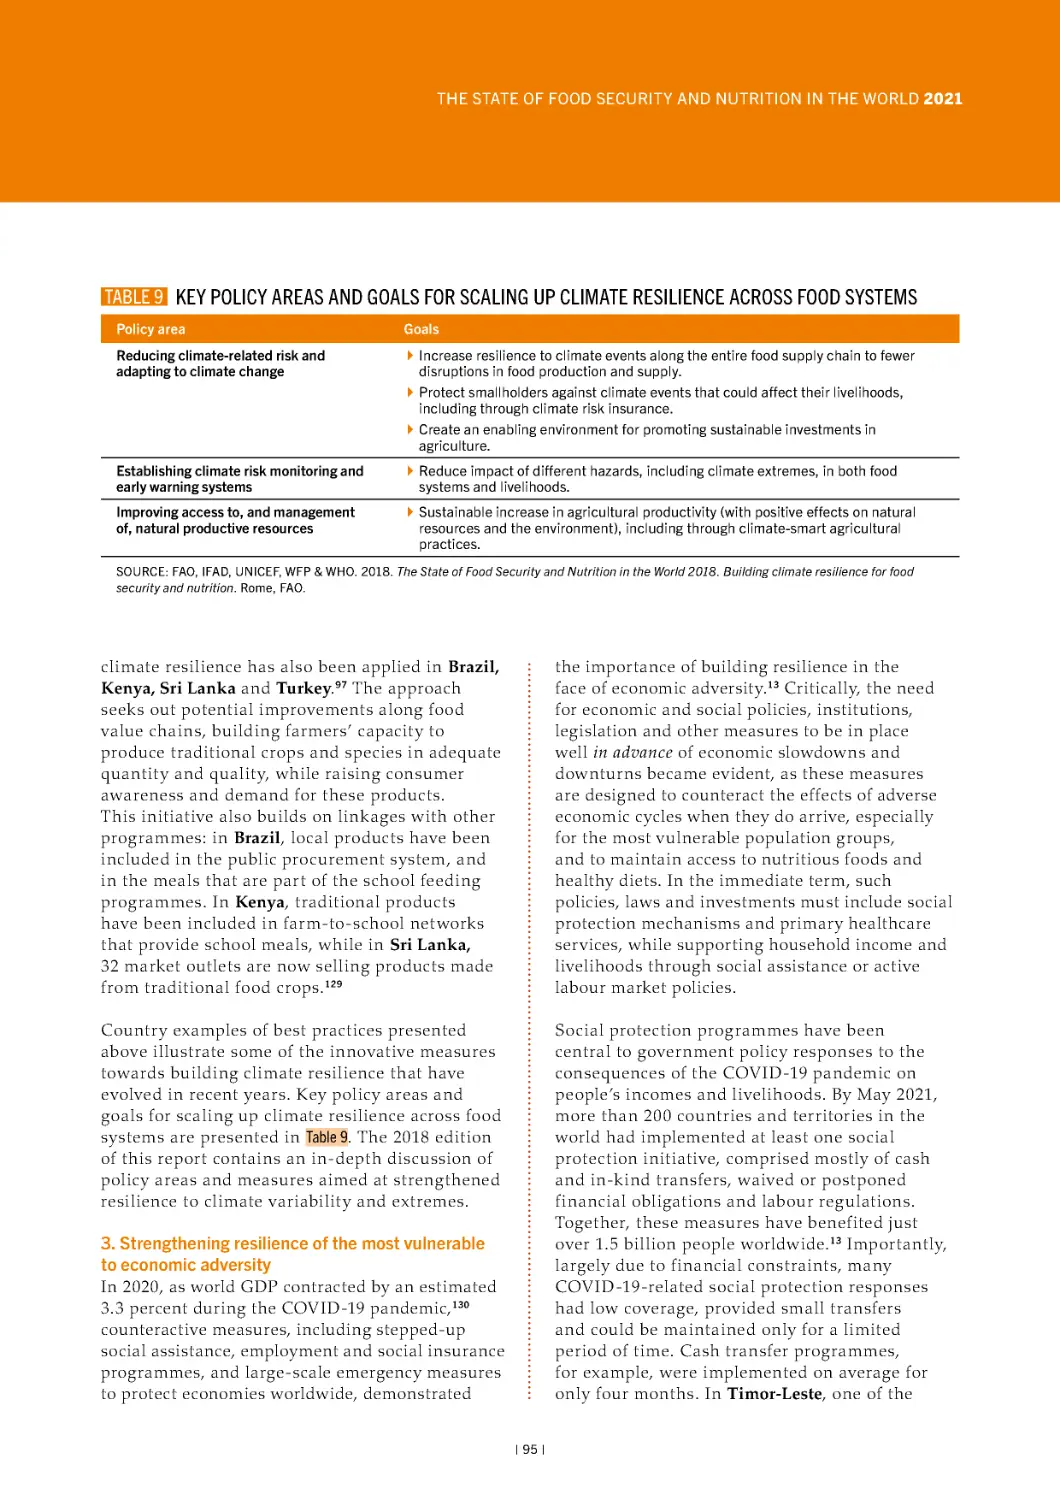
9 Home-grown school feeding as a lever for food
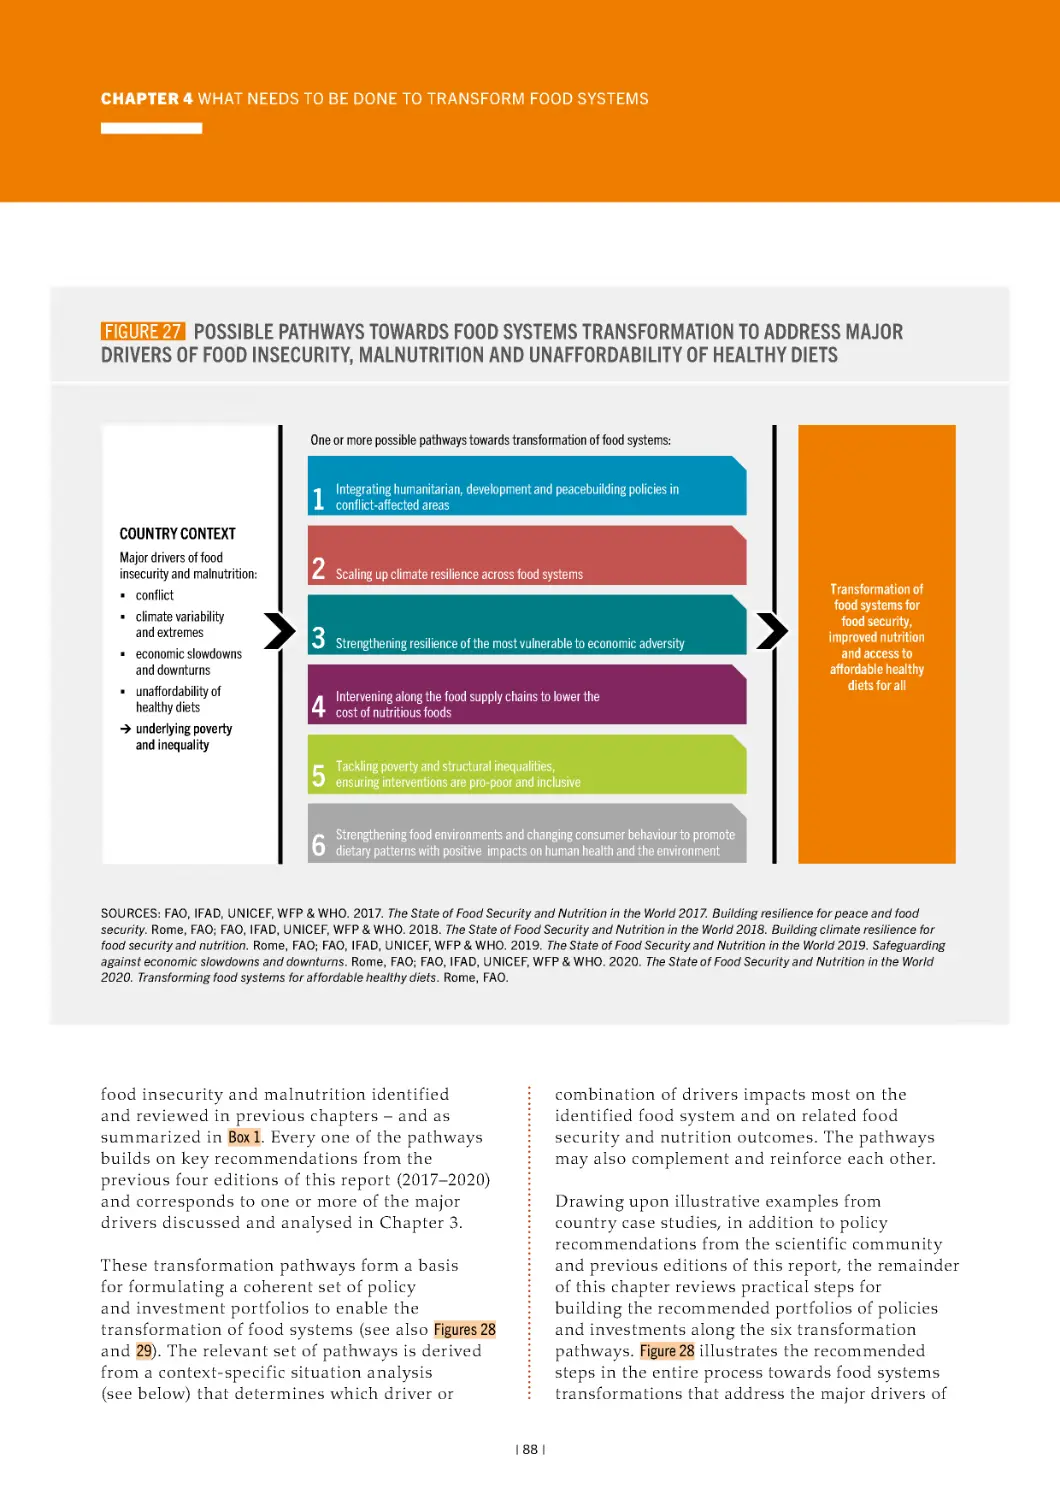
27 Possible pathways towards food systems
transformation to address major drivers of food
insecurity, malnutrition and unaffordability of
healthy diets
56
8 Definition of countries affected by conflict,
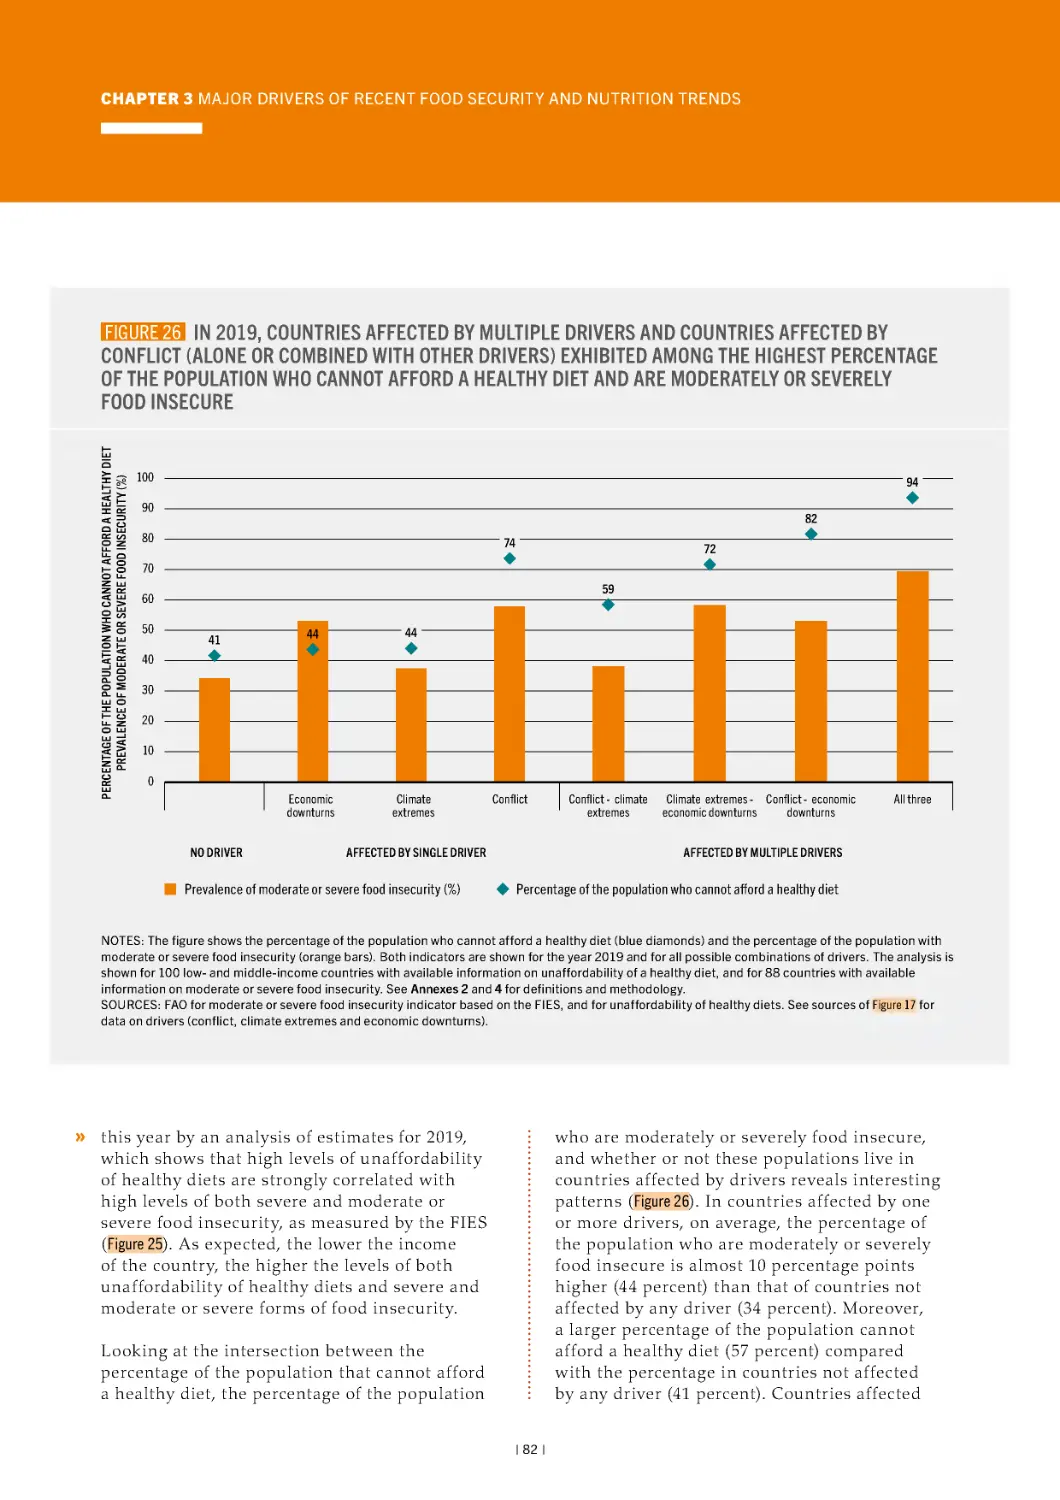
26 In 2019, countries affected by multiple drivers
and countries affected by conflict (alone or
combined with other drivers) exhibited among the
highest percentage of the population who cannot
afford a healthy diet and are moderately or severely
food insecure
47
43
|v|
FOREWORD
under 5 years of age who were affected by
stunting (149.2 million), wasting (45.4 million)
or overweight (38.9 million). Child malnutrition
continues to be a challenge, particularly in
Africa and Asia. Adult obesit y also continues
to increase, with no reversal in the trend in
sight at global or regional levels. Efforts to
eradicate malnutrition in all its forms have
been challenged by disruptions in essential
nutrition inter ventions and negative impacts
on dietar y patterns during the COV ID-19
pandemic. On the health front, the interaction
between the pandemic, obesit y and diet-related
non-communicable diseases has underlined the
urgency of ensuring access to affordable healthy
diets for all. Such myriad setbacks hide some
important achievements – such as the increasing
prevalence of exclusive breastfeeding of infants
under 6 months.
The world is at a critical juncture: it is ver y
different to where it was six years ago when it
committed to the goal of ending hunger, food
insecurit y and all forms of malnutrition by
2030. At the time, while we understood that
the challenges were significant, we were also
optimistic that with the right transformative
approaches, past progress could be accelerated,
at scale, to put us on track to achieve that goal.
Nonetheless, the past four editions of this report
revealed a humbling realit y. The world has
not been generally progressing either towards
Sustainable Development Goal (SDG) Target
2.1, of ensuring access to safe, nutritious and
sufficient food for all people all year round, or
towards SDG Target 2.2, of eradicating all forms
of malnutrition.
Last year’s report stressed that the COV ID-19
pandemic was having a devastating impact on the
world’s economy, triggering an unprecedented
recession not seen since the Second World War,
and that the food securit y and nutrition status
of millions of people, including children, would
deteriorate if we did not take swift action.
Unfortunately, the pandemic continues to expose
weaknesses in our food systems, which threaten
the lives and livelihoods of people around the
world, particularly the most v ulnerable and those
living in fragile contexts.
The situation could have been worse without
governments’ responses and the impressive social
protection measures they have put in place during
the COVID-19 crisis. However, not only have
measures to contain the spread of the pandemic
resulted in an unprecedented economic recession,
but also other important drivers are behind
recent setbacks in food security and nutrition.
These include conflict and violence in many parts
of the world as well as climate-related disasters
all over the world. Given the past and present
interactions of these drivers with economic
slowdowns and downturns, as well as high and
persistent (and in some countries growing) levels
of inequality, it is not surprising that governments
could not keep the worst-case scenario for food
security and nutrition from materializing and
affecting millions of people all over the world.
This year, this report estimates that between
720 and 811 million people in the world faced
hunger in 2020 – as many as 161 million more
than in 2019. Nearly 2.37 billion people did
not have access to adequate food in 2020 – an
increase of 320 million people in just one year.
No region of the world has been spared. The high
cost of healthy diets and persistently high levels
of povert y and income inequalit y continue
to keep healthy diets out of reach for around
3 billion people in ever y region of the world.
Moreover, new analysis in this report shows that
the increase in the unaffordabilit y of healthy
diets is associated with higher levels of moderate
or severe food insecurit y.
Hence, the world is at a critical juncture, not only
because we have to overcome more significant
challenges to ending hunger, food insecurit y and
all forms of malnutrition, but also because, with
the fragilit y of our food systems widely exposed,
we have an opportunit y to build forward better
and get on track towards achieving SDG 2.
The UN Food Systems Summit, to be held later
this year, will bring forward a series of concrete
actions that people, food system actors and
governments from all over the world can take
While it is not yet possible to fully quantif y the
impact of the COV ID-19 pandemic in 2020, we
are concerned by the many millions of children
| vi |
pathways needed to specifically address the
key drivers behind the recent rise in hunger
and slowing progress towards reducing all
forms of malnutrition. The report recognizes
that these transformation pathways are only
feasible if they help meet certain conditions,
including creating opportunities for traditionally
marginalized people, nurturing human health
and protecting the environment. Getting on
track towards ending hunger and all forms of
malnutrition will require a move away from
silo solutions towards integrated food systems
solutions, as well as policies and investments that
address the global food securit y and nutrition
challenges immediately.
to support a transformation of the world’s food
systems. We must build on the momentum
that the run-up to the Summit has already
generated and continue to build the evidence
base on inter ventions and engagement models
that best support the transformation of food
systems. This report aims to contribute to this
global effort.
We are aware that transforming food systems
so that they provide nutritious and affordable
food for all and become more efficient, resilient,
inclusive and sustainable has several entr y points
and can contribute to progress across the SDGs.
Future food systems need to provide decent
livelihoods for the people who work within
them, in particular for small-scale producers in
developing countries – the people who har vest,
process, package, transport and market our food.
Future food systems also need to be inclusive and
encourage the full participation of Indigenous
Peoples, women and youth, both individually and
through their organizations. Future generations
will only thrive as productive actors and leading
forces in food systems if decisive action is taken
to ensure that children are no longer deprived of
their right to nutrition.
This year offers a unique opportunit y for
advancing food securit y and nutrition through
transforming food systems with the upcoming
UN Food Systems Summit, the Nutrition for
Growth Summit and the COP26 on climate
change. The outcomes of these events will
certainly shape the actions of the second half of
the UN Decade of Action on Nutrition. We stand
firmly committed to take advantage of the
unprecedented opportunit y for these events to
generate commitments towards transforming
food systems to eradicate food insecurit y
and malnutrition in all its forms and deliver
affordable healthy diets for all, and to build
forward better from the COV ID-19 pandemic.
While this broader food systems transformation
is currently at the centre of global attention,
this report identifies the transformation
Qu Dongyu
Gilbert F. Houngbo
Henrietta H. Fore
FAO Director-General
IFAD President
UNICEF Executive Director
David Beasley
Tedros Adhanom Ghebreyesus
WFP Executive Director
WHO Director-General
| vii |
METHODOLOGY
The State of Food Security and Nutrition in the World 2021 has been prepared by the FAO Agrifood
Economics Division in collaboration with the Statistics Division of the Economic and Social Development
Stream and a team of technical experts from FAO, IFAD, UNICEF, W FP and W HO.
A senior advisor y team consisting of designated senior managers of the five UN publishing partners
g uided the production of the report. Led by FAO, this team decided on the outline of the report and
defined its thematic focus. It further gave oversight to the technical writing team composed of experts
from each of the five co-publishing agencies. Background technical papers were prepared to support
the research and data analysis undertaken by the members of the writing team. This year’s report
also included a global call for “best practices in transforming food systems for affordable healthy diets
and addressing key drivers of food insecurity and malnutrition”, which generated inputs from more than
80 development institutions and individuals worldwide. Further inputs were derived from an online
webinar organized through the Global Forum on Food Securit y and Nutrition (FSN Forum), which
included an expert panel discussion and ref lection on the report’s theme.
The writing team produced a number of interim outputs, including an annotated outline, first draft
and final draft of the report. These were reviewed, validated and cleared by the senior advisor y team at
each stage in the preparation process. The final report underwent a rigorous technical review by senior
management and technical experts from different divisions and departments within each of the five UN
agencies, both at headquarters and decentralized offices. Finally, the report underwent executive review
and clearance by the heads of agency of the five co-publishing partners.
| viii |
ACKNOWLEDGEMENTS
The State of Food Security and Nutrition in the World 2021 was jointly prepared by the Food and
Agriculture Organization of the United Nations (FAO), the International Fund for Agricultural
Development (IFAD), the United Nations Children’s Fund (UNICEF), the World Food Programme ( W FP)
and the World Health Organization ( W HO).
The publication was carried out under the direction of Marco V. Sánchez Cantillo and José Rosero
Moncayo, with the overall coordination of Cindy Holleman, the Editor of the publication, and the overall
g uidance of Máximo Torero Cullen, all of whom are from the FAO Economic and Social Development
Stream (ES). The development of the report was g uided by a Steering Committee consisting of agency
representatives from the five co-publishing partners: Marco V. Sánchez Cantillo (Chair), Sara Savastano
(IFAD), Victor Ag uayo (UNICEF), Arif Husain ( W FP) and Francesco Branca ( W HO). Alessandra Garbero
and Tisorn Songsermsawas (IFAD), Chika Hayashi and Jo Jewell (UNICEF), Eric Branckaert and Saskia
de Pee ( W FP) and Marzella Wüstefeld ( W HO) contributed to the coordination and provided technical
support. Valuable comments and final approval of the report were provided by the executive heads and
senior staff of the five co-authoring agencies.
Chapter 1 of the report was written by Cindy Holleman with inputs from Marco V. Sánchez Cantillo and José
Rosero Moncayo (FAO).
Chapter 2 of the report was coordinated by Anne Kepple (FAO). Section 2.1 was prepared by Carlo Cafiero
with inputs from Piero Conforti, Valentina Conti, Juan Feng, Cindy Holleman, Anne Kepple and Sara
Viviani (FAO). Section 2.2 was prepared by Chika Hayashi, Richard Kumapley, Vrinda Mehra and Ann
Mizumoto (UNICEF) and Elaine Borghi and Monica Flores Urrutia ( W HO), with input from Anne Kepple
(FAO), Julia Krasevec (UNICEF), and Katrina Lundberg, Juan Pablo Peña-Rosas and Marzella Wüstefeld
( W HO). Section 2.3 was prepared by Carlo Cafiero (FAO); Chika Hayashi, Julia Krasevec, Richard
Kumapley, Vrinda Mehra (UNICEF); and Elaine Borghi ( W HO), with input from Anne Kepple (FAO),
Saskia de Pee ( W FP) and Monica Flores Urrutia and Katrina Lundberg ( W HO). Olivier Lavagne d’Ortig ue
(FAO) provided support for data visualization and José Rosero Moncayo (FAO) provided editorial support
and input to Sections 2.1 and 2.3. Nona Reuter (UNICEF) provided support for data visualization in
Sections 2.2 and 2.3.
Chapter 3 of the report was coordinated and written by Cindy Holleman and Valentina Conti (FAO), with input
from Aurelien Mellin and Trudy Wijnhoven (FAO); Aslihan Arslan, Romina Cavatassi, Ilaria Firmian,
Stefania Gnoato, Caterina Ruggeri Laderchi, Tisorn Songsermsawas, Isabelle Stordeur and Sakiusa Tubuna
(IFAD); Chika Hayashi and Jo Jewell (UNICEF); Eric Branckaert, Saskia de Pee, Simone Gie and Sarah
Piccini (WFP); and Elaine Borghi, Karen McColl, Leanne Margaret Riley and Marzella Wüstefeld (WHO).
Updated agro-climate analysis and prevalence of undernourishment change point detection were provided by
Maria Dimou, Michele Meroni, Felix Rembold, Anne-Claire Thomas, Andrea Toreti, Ferdinando Urbano and
Matteo Zampieri (European Commission – Joint Research Centre), while updates to climatology indicators
were provided by Christopher Jack with inputs from Olivier Crespo and Pierre Kloppers (University of Cape
Town). Marco V. Sánchez Cantillo provided editorial support to the sections of this chapter.
Chapter 4 of the report was coordinated and written by Mark Smulders and Giovanni Carrasco Azzini (FAO),
with input from Melisa Aytekin, Luisa Castañeda, Mariana Estrada, Yon Fernandez de Larrinoa, Ileana
Grandelis, Cindy Holleman, Julius Jackson, Susan Kaaria, Lourdes Orlando, Marzia Pafumi, Luana
Swensson, Mikaila Way and Trudy Wijnhoven (FAO); Tarek Ahmed, Daniel Anavitarte, Ilaria Bianchi,
Antonella Cordone, Isabel de la Peña, Aolin Gong, Caterina Ruggeri Laderchi, Joyce Njoro, Karla Sofia
| ix |
ACKNOWLEDGEMENTS
Pita Vidal and Tisorn Songsermsawas (IFAD); Jo Jewell (UNICEF); Eric Branckaert, Saskia de Pee, Simone
Gie and Sarah Piccini ( W FP); and Maria De Las Nieves Garcia Casal, Katrin Engelhardt, Hy un Jin Kim,
Karen McColl, Benn McGrady, Kathr yn Robertson and Marzella Wüstefeld ( W HO). Further inputs to
Chapter 4 were received from FAO, IFAD, UNICEF, W FP and W HO colleag ues, as well as technical
experts around the world in response to a global call for “best practices in transforming food systems for
affordable healthy diets and addressing key drivers of food insecurit y and malnutrition”. Inputs were also
provided by Grahame Dixie and Erin Sweeney from Grow Asia. More than 80 development institutions
and individuals worldwide responded to a similar call for best practices in transforming food systems
through the Global Forum on Food Securit y and Nutrition (FSN Forum), facilitated by Svetlana Livinets
and Elise Polak (FAO). Chapter 4 also drew lessons from an expert panel through an online webinar
organized by the FSN Forum. The panellists included: Tim Benton (Chatham House), Michael Carter
(Universit y of California, Davis), Jessica Fanzo ( Johns Hopkins Universit y), Ndidi Nwuneli (Sahel
Consulting), David Spielman (International Food Policy Research Institute [IFPRI]) and Robert Townsend
( World Bank). Marco V. Sánchez Cantillo provided editorial support to the sections of this chapter.
Chapter 5 of the report was written by Marco V. Sánchez Cantillo with inputs from Cindy Holleman and José
Rosero Moncayo (FAO).
Numerous colleag ues from different technical units and departments across the five co-publishing
agencies provided valuable technical comments and input to the report. An agency-wide technical
clearance process facilitated a comprehensive review by many technical experts from the five
co-authoring agencies. Listing each of the contributions would be challenging and furthermore increase
the risk of important omissions.
Juan Feng, Abdul Sattar and Sara Viviani were responsible for preparing undernourishment and food
securit y data with input from Verónica Boero, Marinella Cirillo, Filippo Gheri, Adeeba Ishaq, Talent
Manyani, Ana Moltedo, María Rodríg uez, Firas Yassin and under the super vision of Carlo Cafiero in
Section 2.1. Supporting data were provided by the Food Balance Sheets team, led by Salar Tay yib of the
FAO Statistics Division (ESS). Valentina Conti and Cindy Holleman (FAO) were responsible for preparing
the analysis of the cost and affordabilit y of healthy diets in Section 2.1, with input from Yan Bai, Leah
Costlow, Alissa Ebel, Anna Herforth, William A. Masters and Aishwar ya Venkat (Tufts Universit y),
and Piero Conforti, Jean Marie Vianney Munyeshyaka and Michele Vollaro (FAO). Richard Kumapley
(UNICEF) was responsible for consolidating the nutrition data in Section 2.2, with input from Chika
Hayashi, Julia Krasevec and Vrinda Mehra (UNICEF), and Elaine Borghi, Monica Flores Urrutia and
Leanne Riley ( W HO). Carlo Cafiero prepared the 2030 projections of undernourishment with input from
Juan Feng, Adeeba Ishaq and Abdul Sattar (FAO) in Section 2.3. David Laborde generated key input
for the 2030 projected scenarios of undernourishment as part of a research collaboration with IFPRI.
Chika Hayashi and Richard Kumapley (UNICEF) and Elaine Borghi and Giovanna Gatica Doming uez
( W HO) were responsible for the analyses in Section 2.3 and Annex 2, including on progress towards
global nutrition targets and of the potential impact of the COV ID-19 pandemic on child stunting and
wasting by 2030, with input from Julia Krasevec and Vrinda Mehra (UNICEF).
Support for report production came from Giovanni Carrasco Azzini, Andrew Park (consulting editor) and
Daniela Verona in the FAO Economic and Social Development Stream.
The FAO Meeting Branch and Lang uage Ser vices Branch of Governing Bodies Ser vicing Division (CSG)
carried out the translations, in addition to the contributors mentioned above.
The Publishing Group (OCCP) of the FAO’s Office of Communications provided editorial support, design
and layout, as well as production coordination, for editions in all six official lang uages.
|x|
ACRONYMS AND ABBREVIATIONS
AARR
Average annual rate of reduction
IDP
Internally displaced person
ADER
Average dietary energy requirement
IFAD
ASAP
Anomaly Hotspots of
Agriculture Production
International Fund for Agricultural
Development
ILO
International Labour Organization
ASEAN
Association of Southeast Asian Nations
IMF
International Monetary Fund
BMI
Body mass index
IPC
CGE
Computable general equilibrium
Integrated Food Security Phase
Classification
CH
Cadre Harmonisé (harmonized
framework)
IQ
Intelligence quotient
JME
Joint Malnutrition Estimates
LIFDCs
Low-income food-deficit countries
LMICs
Low- and middle-income countries
MDD
Minimum Dietary Diversity
MDD-W
Minimum Dietary Diversity for Women
MDER
Minimum dietary energy requirement
MIRAGRODEP
Modelling International Relations under
Applied General Equilibrium
MPP
Mountain Partnership Products
NCD
Non-communicable disease
NoU
Number of undernourished
PoU
Prevalence of undernourishment
PPP
Purchasing power parity
PPPP
Public-private-producer partnership
SD
Standard deviation
CHIRPS
Climate Hazards Group Infrared
Precipitation with Stations
CPI
Consumer price index
CRED
Centre for Research on the
Epidemiology of Disasters
CSA
Climate-smart agriculture
CV
Coefficient of variation
CV|r
CV due to energy requirements
CV|y
CV due to income
DEC
Dietary energy consumption
DES
Dietary energy supply
ECMWF
European Centre for Medium-Range
Weather Forecasts
FAO
Food and Agriculture Organization
of the United Nations
FBDGs
Food-based dietary guidelines
SDGs
Sustainable Development Goals
FBS
Food Balance Sheet
SMEs
Small and medium-sized enterprises
FIES
Food Insecurity Experience Scale
UCDP
Uppsala Conflict Data Program
FImod+sev
Prevalence of moderate or severe
food insecurity
UNICEF
United Nations Children's Fund
USD
FIsev
Prevalence of severe food insecurity
United States dollar
VCC
GDP
Gross domestic product
Virtual call centre
WEAI
GHG
Greenhouse gas
Women’s Empowerment in
Agriculture Index
GWP
Gallup World Poll
WEO
World Economic Outlook
HCES
Household Consumption and
Expenditure Survey
WFP
World Food Programme
WHA
HDP
Humanitarian-development-peace
World Health Assembly
WHO
HGSF
Home-grown school feeding
World Health Organization
| xi |
KEY MESSAGES
è Well before the COVID-19 pandemic, we were
already not on track to meet our commitments to
end world hunger and malnutrition in all its forms by
2030. Now, the pandemic has made this significantly
more challenging. This report presents the first global
assessment of food insecurity and malnutrition for
2020 and highlights the need for a deeper reflection
on how to better address the global food security and
nutrition situation.
è While the global prevalence of moderate or severe
food insecurity (measured using the Food Insecurity
Experience Scale) has been slowly on the rise since
2014, the estimated increase in 2020 was equal to that
of the previous five years combined. Nearly one in three
people in the world (2.37 billion) did not have access
to adequate food in 2020 – an increase of almost
320 million people in just one year.
è Close to 12 percent of the global population was
severely food insecure in 2020, representing 928 million
people – 148 million more than in 2019.
è World hunger increased in 2020 under the
shadow of the COVID-19 pandemic. After remaining
virtually unchanged for five years, the prevalence of
undernourishment (PoU) increased 1.5 percentage
points in just one year – reaching a level of around
9.9 percent, heightening the challenge of achieving the
Zero Hunger target by 2030.
è At the global level, the gender gap in the prevalence
of moderate or severe food insecurity has grown even
larger in the year of the COVID-19 pandemic, with the
prevalence of moderate or severe food insecurity being
10 percent higher among women than men in 2020,
compared to 6 percent in 2019.
è It is projected that between 720 and 811
million people in the world faced hunger in 2020.
Considering the middle of the projected range
(768 million), around 118 million more people were
facing hunger in 2020 than in 2019 – or as many as
161 million more, considering the upper bound of
the range.
è The high cost of healthy diets coupled with persistent
high levels of income inequality put healthy diets out of
reach for around 3 billion people, especially the poor, in
every region of the world in 2019. This number is slightly
less than in 2017 and will likely increase in most regions
in 2020 due to the COVID-19 pandemic.
è More than half of the world’s undernourished are
found in Asia (418 million) and more than one-third
in Africa (282 million). Compared with 2019, about
46 million more people in Africa, 57 million more in Asia,
and about 14 million more in Latin America and the
Caribbean were affected by hunger in 2020.
è Shifting to healthy diets that include sustainability
considerations can contribute to reducing health and
climate change costs by 2030, because the hidden
costs of these diets are lower compared with those of
current consumption patterns.
è New projections confirm that hunger will not be
eradicated by 2030 unless bold actions are taken to
accelerate progress, especially actions to address
inequality in access to food. All other things constant,
around 660 million people may still face hunger in
2030 in part due to lasting effects of the pandemic on
global food security – 30 million more people than in a
scenario in which the pandemic had not occurred.
è Globally, malnutrition in all its forms also remains
a challenge. Although, it is not yet possible to fully
account for the impact of the COVID-19 pandemic
due to data limitations, in 2020 it is estimated that
22.0 percent (149.2 million) of children under 5 years of
age were affected by stunting, 6.7 percent (45.4 million)
were suffering from wasting and 5.7 percent
(38.9 million) were overweight. The actual figures,
particularly for stunting and wasting, are expected to be
higher due to the effects of the pandemic.
| xii |
è Most children with malnutrition live in Africa and
Asia. These regions account for more than nine out of
ten of all children with stunting, more than nine out of
ten children with wasting and more than seven out of ten
children who are affected by overweight worldwide.
è The reversal in the PoU trends in 2014 and
continuous increase, especially pronounced in lowand middle-income countries from 2017, are largely
attributed to countries affected by conflict, climate
extremes and economic downturns, and to countries
with high income inequality.
è An estimated 29.9 percent of women aged 15 to
49 years in 2019 around the world are affected by
anaemia – now a Sustainable Development Goal (SDG)
Indicator (2.2.3). However, the data reveal stark regional
differences: more than 30 percent of women in Africa
and Asia were affected by anaemia, compared with
only 14.6 percent of women in Northern America and
Europe. Adult obesity is increasing sharply in all regions.
è Between 2017 and 2019, the PoU increased by
4 percent in countries affected by one or more of these
major drivers while it decreased by 3 percent in countries
not affected by them. While middle-income countries
affected by these drivers registered only a 2 percent
increase in the PoU, the increase for those with high
income inequality was double – 4 percent.
è Globally, the world is not on track to achieve
targets for any of the nutrition indicators by 2030.
The current rate of progress on child stunting, exclusive
breastfeeding and low birthweight is insufficient, and
progress on child overweight, child wasting, anaemia in
women of reproductive age and adult obesity is stalled
or the situation is worsening.
è In the same period, countries affected by multiple
drivers exhibited the highest increases in the PoU,
12 times larger than those in countries affected by only
a single driver.
è Drivers that are external (e.g. conflicts or climate
shocks) and internal (e.g. low productivity and inefficient
food supply chains) to food systems are pushing up
the cost of nutritious foods which, combined with
low incomes, are increasing the unaffordability of
healthy diets. The percentage of the population who
cannot afford a healthy diet in countries affected by
multiple drivers in 2019 was 39 percent and 66 percent
higher, respectively, than in countries affected by
a single driver or no driver at all. Increases in the
unaffordability of a healthy diet are associated with
higher levels of food insecurity, especially among
lower-middle-income countries.
è The COVID-19 pandemic has likely impacted the
prevalence of multiple forms of malnutrition, and could
have lasting effects beyond 2020, as we are already
seeing in 2021. These will be compounded through
the intergenerational effects of malnutrition and the
resulting impacts on productivity. Exceptional efforts
are required to address and overcome the effects of
the pandemic as part of accelerating progress towards
achieving SDG Target 2.2.
è Conflict, climate variability and extremes, and
economic slowdowns and downturns (now exacerbated
by COVID-19 pandemic) are major drivers of food
insecurity and malnutrition that continue to increase in
both frequency and intensity, and are occurring more
frequently in combination.
è In 2020, almost all low- and middle-income
countries were affected by pandemic-induced economic
downturns, and the increase in their number of
undernourished was more than five times greater than
the highest increase in undernourishment in the last
two decades. When those countries were also affected
by other drivers, particularly climate-related disasters,
conflict, or a combination, the largest increase in
undernourishment was seen in Africa, followed by Asia.
| xiii |
KEY MESSAGES
è Because these major drivers are negatively affecting
food security and nutrition by creating multiple,
compounding impacts throughout our food systems – as
well as through the interaction between these and other
systems – a food systems lens is therefore essential to
better understand these interactions and identify entry
points for interventions to address them.
è Coherence in the formulation and implementation
of policies and investments among food, health, social
protection and environmental systems is also essential
to build on synergies towards more efficient and
effective food systems solutions to deliver affordable
healthy diets, sustainably and inclusively.
è Effective and inclusive governance mechanisms and
institutions, in addition to access to technology, data
and innovation, should serve as important accelerators
in the comprehensive portfolios of policies, investments
and legislation aimed at transforming food systems.
è When transformed with greater resilience to major
drivers, including conflict, climate variability and
extremes, and economic slowdowns and downturns,
food systems can provide affordable healthy diets that
are sustainable and inclusive, and become a powerful
driving force towards ending hunger, food insecurity and
malnutrition in all its forms, for all.
è Systems approaches are needed to build coherent
portfolios of policies, investments and legislation and
enable win-win solutions while managing trade-offs;
these include territorial approaches, ecosystems
approaches, Indigenous Peoples’ food systems
approaches and interventions that systemically address
protracted crisis conditions.
è Depending on context, there are six pathways to
follow towards food systems transformation: integrating
humanitarian, development and peacebuilding policies
in conflict-affected areas; scaling up climate resilience
across food systems; strengthening resilience of the
most vulnerable to economic adversity; intervening
along the food supply chains to lower the cost of
nutritious foods; tackling poverty and structural
inequalities, ensuring interventions are pro-poor and
inclusive; and strengthening food environments and
changing consumer behaviour to promote dietary
patterns with positive impacts on human health and
the environment.
è While 2020 was an immense challenge for the world,
it may also be a warning of unwelcome events to come
if the world does not commit to more resolute actions to
change course. The major drivers that lie behind recent
food security and nutrition trends each have their own
trajectory or cyclicality, which ensures they will continue
to occur and could even worsen in the coming years.
è The UN Food Systems Summit 2021 will bring
forward a series of concrete actions that people from
all over the world can take to support a transformation
of the world’s food systems. The six transformation
pathways identified in this report are needed for greater
resilience to specifically address the negative impacts
of the major drivers behind the recent rise in hunger and
slowing progress to reduce malnutrition in all its forms.
è Given that most food systems are affected by more
than one driver, and also impact on food security and
nutrition outcomes in multiple ways, the formulation of
comprehensive portfolios of policies, investments and
legislation may be elaborated along several pathways
simultaneously. This will allow for maximizing their
combined effects on food systems transformation,
exploiting win-win solutions and mitigating undesirable
trade-offs.
| xiv |
EXECUTIVE SUMMARY
After remaining virtually unchanged from 2014
to 2019, the PoU increased from 8.4 percent
to around 9.9 percent between 2019 and 2020,
heightening the challenge of achieving the
Zero Hunger target in 2030. The 2020 estimate
ranges from 9.2 to 10.4 percent, depending on the
assumptions made to ref lect the uncertainties
around the assessment.
Well before the COV ID-19 pandemic, we were
already not on track to ending world hunger and
malnutrition in all its forms by 2030. Now, the
pandemic has made this goal significantly more
challenging. This report presents the first global
assessment of food insecurit y and malnutrition
for 2020 and offers some indication of what
hunger and malnutrition would look like by
2030, in a scenario further complicated by the
enduring effects of the pandemic. These trends
highlight the need for deeper ref lection on how
to better address the global food securit y and
nutrition situation.
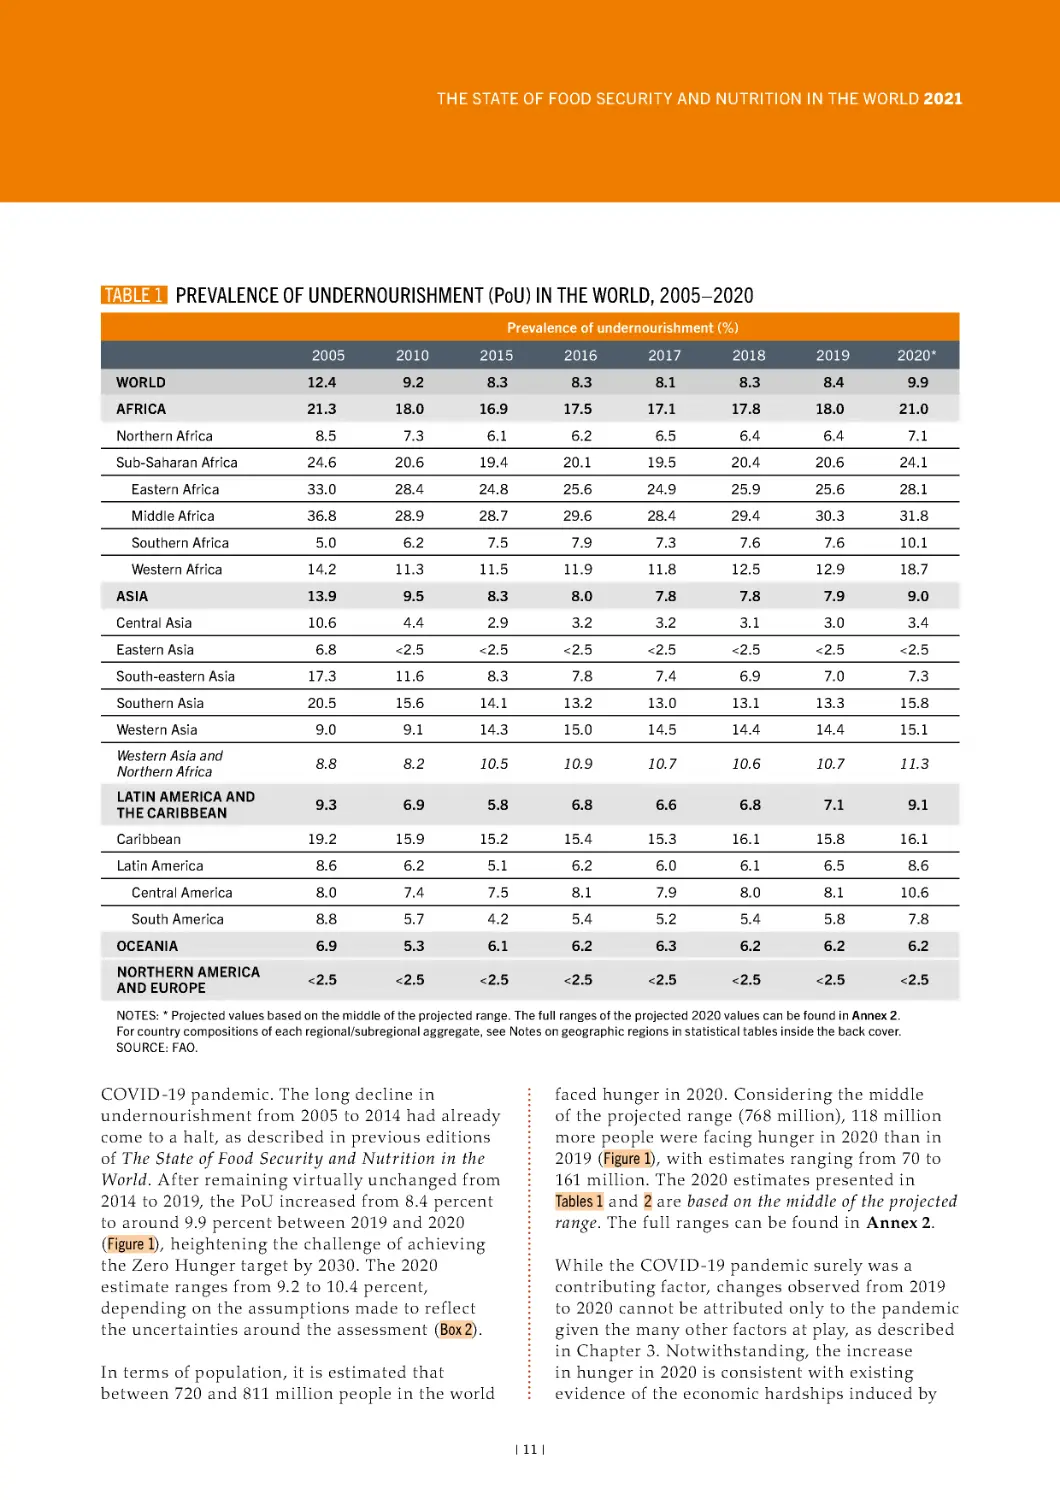
In terms of population, it is estimated that
between 720 and 811 million people in the world
faced hunger in 2020. Considering the middle
of the projected range (768 million), 118 million
more people were facing hunger in 2020 than
in 2019, with estimates ranging from 70 to
161 million.
One of the key questions posed in this year’s
report is – How did the world get to this
critical point? To answer, the report draws on
the analyses of the past four editions, which
have produced a vast, evidence-based body of
knowledge of the major drivers behind the recent
changes in food security and nutrition. This is
updated with new data to feed into a broader
analysis of how these drivers interact, allowing
for a holistic view of their combined effects both
on each other and on food systems. In turn, this
informs an in-depth look at how to move from silo
solutions to integrated food systems solutions that
specifically address the challenges posed by the
major drivers, highlighting also the types of policy
and investment portfolios required to transform
food systems for food security, improved nutrition
and affordable healthy diets for all.
The numbers show enduring and troubling
regional inequalities. About one in five people
(21 percent of the population) was facing
hunger in Africa in 2020 – more than double the
proportion of any other region. This represents
an increase of 3 percentage points in one year.
This is followed by Latin America and the
Caribbean (9.1 percent) and Asia (9.0 percent),
with increases of 2.0 and 1.1 percentage points,
respectively, between 2019 and 2020.
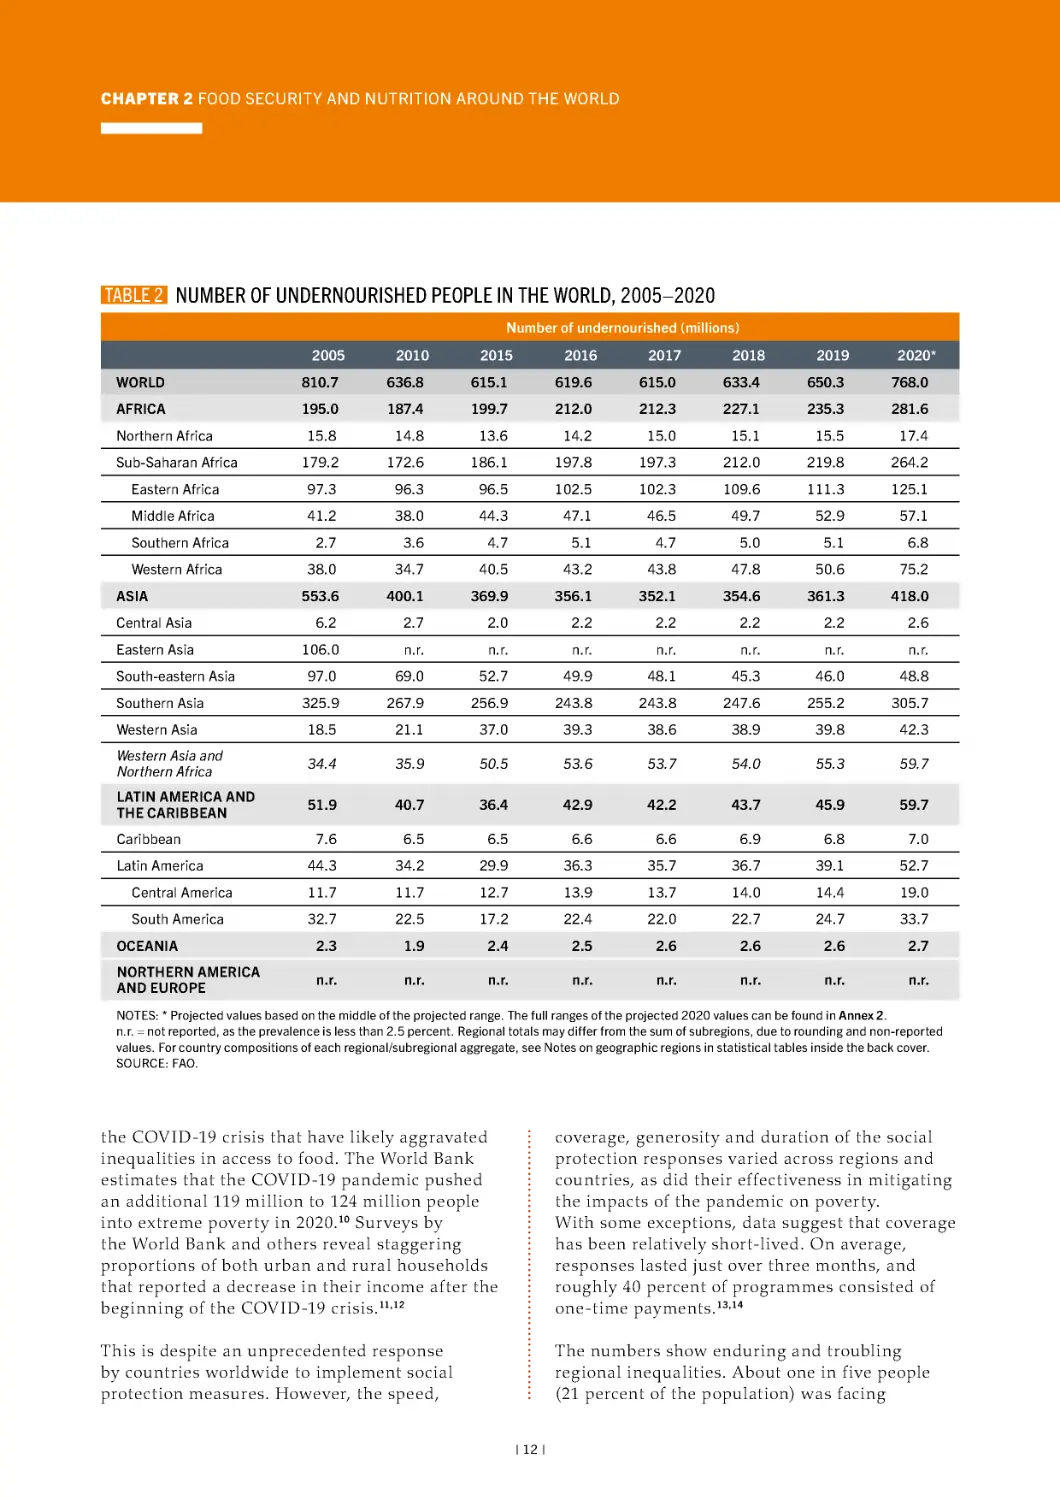
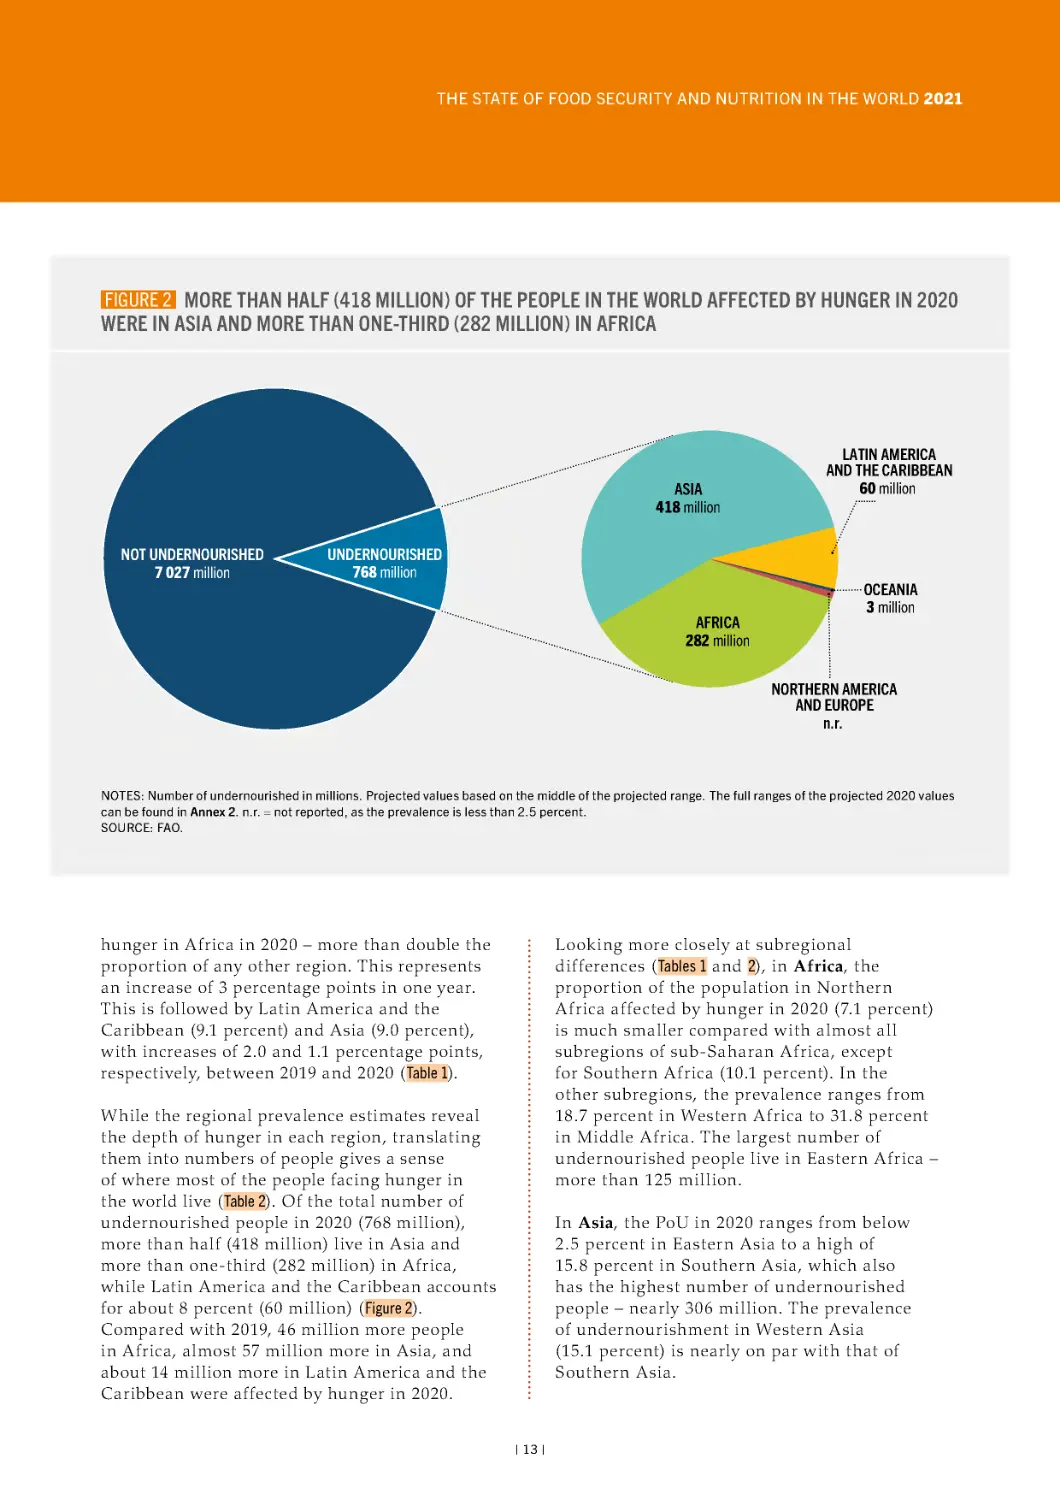
Of the total number of undernourished people in
2020 (768 million), more than half (418 million)
live in Asia and more than one-third (282 million)
in Africa, while Latin America and the Caribbean
accounts for about 8 percent (60 million).
Compared with 2019, 46 million more people
in Africa, almost 57 million more in Asia, and
about 14 million more in Latin America and the
Caribbean were affected by hunger in 2020.
FOOD SECURITY AND NUTRITION
AROUND THE WORLD
Food security indicators – latest updates
and progress towards ending hunger and
ensuring food security
Moderate or severe food insecurit y (based on
the Food Insecurit y Experience Scale) at the
global level has been slowly on the rise, from
22.6 percent in 2014 to 26.6 percent in 2019.
Then in 2020, the year the COV ID-19 pandemic
The number of people in the world affected
by hunger continued to increase in 2020
under the shadow of the COV ID-19 pandemic.
| xv |
EXECUTIVE SUMMARY
Nutrition indicators – latest updates and
progress towards global nutrition targets
spread across the globe, it rose nearly as much
as in the previous five years combined, to
30.4 percent. Thus, nearly one in three people
in the world did not have access to adequate
food in 2020 – an increase of 320 million people
in just one year, from 2.05 to 2.37 billion.
Nearly 40 percent of those people – 11.9 percent
of the global population, or almost 928 million
– faced food insecurit y at severe levels. Close to
148 million more people were severely food
insecure in 2020 than in 2019.
Due to the physical distancing measures taken
to contain the spread of the pandemic, data
on nutrition outcomes were limited in 2020.
Consequently, the latest estimates do not account
for the effects of the COV ID-19 pandemic.
Globally, 149.2 million (22.0 percent) of children
under the age of five years suffered from stunting
(SDG Indicator 2.1.1) in 2020. The prevalence of
stunting has decreased from 33.1 percent in 2000
to 26.2 percent in 2012 and further to 22.0 percent
in 2020. In 2020, nearly three-quarters of the
world’s stunted children lived in just two regions:
Central and Southern Asia (37 percent) and
sub-Saharan Africa (37 percent).
The increases in moderate or severe food
insecurit y from 2019 to 2020 were sharpest in
Latin America and the Caribbean (9 percentage
points) and Africa (5.4 percentage points),
compared with a 3.1-point increase in Asia.
Even in Northern America and Europe, where
the lowest rates of food insecurit y are found, the
prevalence of food insecurit y increased for the
first time since the beginning of Food Insecurit y
Experience Scale (FIES) data collection in 2014.
In 2020, 45.4 million children under five years
(6.7 percent) were wasted. Nearly one-quarter
lived in sub-Saharan Africa and more than half
lived in Southern Asia, the subregion with the
highest prevalence of wasting – above 14 percent.
At the global level, the gender gap in the
prevalence of moderate or severe food insecurit y
has grown even larger in the year of the
COV ID-19 pandemic, with the prevalence
of moderate or severe food insecurit y being
10 percent higher among women than men in
2020, compared with 6 percent in 2019.
In the same year, around 5.7 percent
(38.9 million) of children under five years
were affected by overweight. There has been
little change at global level in two decades –
5.7 percent in 2020 compared with 5.4 percent in
2000, and trends in some regions and in many
settings are on the rise.
Tracking the cost and the number of people who
cannot afford a healthy diet provides valuable
metrics to better understand the link between
these important determinants of access to
food and the trends in the multiple forms of
malnutrition. As a result of the high cost of
healthy diets, coupled with persistent high levels
of income inequality, it is estimated that around
3 billion people were unable to afford a healthy
diet in 2019. Most of these people live in Asia
(1.85 billion) and Africa (1.0 billion), although a
healthy diet is also out of reach for millions living
in Latin America and the Caribbean (113 million)
and Northern America and Europe (17.3 million).
Adult obesit y continues to rise, with the global
prevalence increasing from 11.7 percent in 2012
to 13.1 percent in 2016. All subregions showed
increasing trends in the prevalence of adult
obesit y between 2012 and 2016 and are off track
to meet the 2025 World Health Assembly target
to halt the rise by 2025.
One in seven live births, or 20.5 million
(14.6 percent) babies globally, suffered from
low birthweight in 2015. Low birthweight
newborns have a higher risk of dying in the first
| xvi |
to allow for an official assessment at global and
regional levels. Results of one such analysis
indicate that, under a moderate scenario, an
additional 11.2 million children under five years
of age in low- and middle-income countries would
be affected by wasting from 2020 to 2022 as a
consequence of the pandemic – 6.9 million in 2020
alone. Under a more pessimistic scenario, this
estimate rises to 16.3 million additional children
affected by wasting. For child stunting, the model
predicts that 3.4 million additional children will
be stunted due to the effects of the pandemic
in 2022.
28 days after birth; those who sur vive are more
likely to suffer from stunted growth and lower
intelligence quotient (IQ), and face increased
risk of overweight and obesit y and adult-onset
chronic conditions, including diabetes, later
in life.
Optimal breastfeeding practices, including
exclusive breastfeeding for the first 6 months
of life, are critical for child sur vival and the
promotion of health and brain and motor
development. Globally, 44 percent of infants
under 6 months of age were exclusively breastfed
in 2019 – up from 37 percent in 2012.
Ending hunger and all forms of
malnutrition by 2030
Anaemia in women of reproductive age has
been newly designated as an SDG indicator
(SDG Indicator 2.2.3). Nearly one in three
(29.9 percent) women of reproductive age
globally were still affected by anaemia in 2019,
and no progress has been made since 2012.
Wide variations exist between regions, with
the prevalence in Africa being nearly three
times higher than that of Northern America
and Europe.
With less than a decade left to reach the end of
the time horizon set for achieving the SDGs,
this report presents updated assessments of the
likelihood that SDG Targets 2.1 and 2.2 will be
achieved by 2030.
This year’s projections of the PoU up to 2030
were estimated using a structural approach
based on a global dynamic general equilibrium
model. Two scenarios were modelled: a scenario
aimed at capturing the impact of the COV ID-19
pandemic, and a no-COV ID-19 scenario.
Both scenarios assume that the trajectories are
not disrupted by any of the main drivers of food
insecurit y and that momentous actions needed
to transform food systems for food securit y
and decrease inequalities in access to food are
not implemented.
Countries worldwide are facing many challenges
as they strive to ensure that health, food,
education and social protection systems maintain
essential nutrition ser vices while simultaneously
responding to the COV ID-19 pandemic. Based on
a sur vey tracking the situation of children
during the pandemic, 90 percent of countries
(122 of 135) reported a change in the coverage
of key nutrition ser vices in Aug ust 2020.
Overall, essential nutrition ser vices coverage
declined by 40 percent, and nearly half of the
countries reported a drop of 50 percent or more
for at least one nutrition inter vention.
Under the COV ID-19 scenario, following a
projected peak of around 768 million (9.9 percent
of the population) in 2020, global hunger
would decrease to around 710 million in 2021
(9 percent), and then continue to decrease
marginally to less than 660 million (7.7 percent)
in 2030. However, the evolution from 2020 to
2030 is quite different across regions. While a
substantial reduction is projected for Asia (from
Although data on nutritional outcomes are
missing for 2020, research based on modelled
scenarios can contribute valuable insights to
illustrate the impact of the COVID-19 pandemic
at least until new empirical data are available
| xvii |
EXECUTIVE SUMMARY
MAJOR DRIVERS OF RECENT FOOD
SECURITY AND NUTRITION TRENDS
418 million to 300 million people), a significant
increase is forecast for Africa (from more than
280 million to 300 million people), placing it
on par with Asia by 2030 as the region with the
highest number of undernourished people.
A food systems lens is critical to address
the drivers of recent food security and
nutrition trends
Under the COV ID-19 scenario, about 30 million
more people may face hunger in 2030 than if the
pandemic had not occurred, revealing persistent
effects of the pandemic on global food securit y.
Greater inequalit y in access to food is mostly
responsible for the obser ved difference.
Conf lict, climate variabilit y and extremes, and
economic slowdowns and downturns (now
exacerbated by the COV ID-19 pandemic) are
behind recent rises in hunger and slowing
progress in reducing all forms of malnutrition.
Their adverse inf luence is made all the more
difficult by high and persistent levels of
inequalit y. In addition, millions of people
around the world suffer from food insecurit y
and different forms of malnutrition because
they cannot afford the cost of healthy diets.
These major drivers are unique but not mutually
exclusive, as they interact to the detriment of
food securit y and nutrition by creating multiple,
compounding impacts at many different points
within our food systems.
Globally, progress is being made for some
forms of malnutrition, but the world is not on
track to achieve targets for any of the nutrition
indicators by 2030. The current rates of progress
on child stunting, exclusive breastfeeding and
low birthweight are insufficient, and progress
on child overweight, child wasting, anaemia
in women of reproductive age and adult
obesit y is stalled (no progress) or the situation
is worsening.
As the economic and other impacts of the
COV ID-19 pandemic continue to unfold, the
trajector y over the next years is difficult to
foresee. Evidence is still scarce on the actual
effects of the pandemic on various forms of
malnutrition, including on the prevalence of
child stunting, wasting, overweight; adult
obesit y; anaemia in women of reproductive age;
low birthweight; and exclusive breastfeeding.
These effects will be compounded through the
intergenerational effects of malnutrition and the
resulting impacts on productivit y and, hence,
economic recover y. However, it is clear that the
COV ID-19 pandemic has likely impacted the
prevalence of multiple forms of malnutrition, and
could have lasting effects beyond 2020, as we are
already seeing in 2021. Therefore, exceptional
efforts are required to address and overcome the
effects of the pandemic as part of accelerating
progress towards achieving SDG Target 2.2.
For example, conf lict negatively affects almost
ever y aspect of a food system, from production,
har vesting, processing and transport to input
supply, financing, marketing and consumption.
Direct impacts can include the destruction
of agricultural and livelihood assets and
can severely disrupt and restrict trade and
movements of goods and ser vices, with a
negative effect on the availabilit y and prices of
food, including nutritious foods.
Similarly, climate variabilit y and extremes create
multiple and compounding impacts on food
systems. They negatively affect agricultural
productivit y, and also affect food imports
as countries tr y to compensate for domestic
production losses. Climate-related disasters
can lead to significant impacts across the
food value chain, with negative consequences
on sector growth and on food and non-food
agro-industries.
| xviii |
More than half of the low- and middle-income
countries experienced an increase in the PoU in
correspondence with one or more drivers (conflict,
climate extremes and economic downturns)
between 2010 and 2018. Moreover, several
of these countries faced recurring increases
in correspondence with these drivers during
this period.
On the other hand, economic slowdowns and
downturns primarily impact food systems
through their negative effects on people’s access
to food, including the affordabilit y of healthy
diets, as they lead to rises in unemployment and
declines in wages and incomes. This is the case
irrespective of whether they are driven by market
swings, trade wars, political unrest, or a global
pandemic, such as COV ID-19.
Analysis shows that the reversal in the PoU trends
in 2014 and the continuous increase, especially
pronounced from 2017, are largely attributed
to low- and middle-income countries affected
by conflict, climate extremes and economic
downturns, and to countries with high income
inequality. The PoU is higher and has increased
more in countries affected by these drivers.
The unaffordabilit y of healthy diets is a result
of the effects of other drivers or factors on
people’s income and on the cost of nutritious
foods throughout the food system. As such, it is a
driver that acts within food systems to negatively
affect food securit y and nutrition.
Povert y and inequalit y are critical underlying
structural factors that amplif y the negative
impact of the major drivers. Their impacts are felt
throughout food systems and food environments,
ultimately affecting the affordabilit y of healthy
diets and food securit y and nutrition outcomes.
Focusing on the most recent period of increase
before the COV ID-19 pandemic, between 2017
and 2019, low- and middle-income countries
affected by one or more of the drivers saw an
increase in the PoU, while countries not affected
by any driver saw a decrease. In contrast, the
prevalence of child stunting shows a continuing
declining trend from 2017 to 2019 and an
analysis of countries affected by drivers did
not reveal any notable patterns, indicating
the presence of other stronger drivers behind
this trend.
Beyond their direct impacts on food systems,
these major global drivers and underlying
structural factors weaken food securit y
and nutrition through interconnected and
circular impacts on other systems, including
environmental and health systems.
Impact of major drivers on food security
and nutrition
There are also important differences in trends
depending on whether a countr y is affected
by more than one driver (multiple drivers) and
depending on the countr y income-group and
region. Countries affected by multiple drivers
consistently show the highest increases in
the PoU, 12 times larger than those countries
affected by only a single driver. For all three
regions analysed (Africa, Asia, and Latin
America and the Caribbean), around 36 percent
of low- and middle-income countries were
affected by multiple drivers.
In the last ten years, the frequency and intensity
of conflict, climate variability and extremes,
and economic slowdowns and downturns have
increased and are undermining food security and
nutrition around the world. Of particular concern
are low- and middle-income countries because
the negative impacts on food security and
nutrition are greatest in these countries and they
carr y the biggest burden of the world’s population
who are undernourished, food insecure and
suffer from one or more forms of malnutrition.
| xix |
EXECUTIVE SUMMARY
Those countries also show higher levels of
moderate or severe food insecurit y (47 percent)
– 12 percent higher than countries affected by a
single driver and 38 percent more than countries
not affected by any driver. The unaffordabilit y
of healthy diets tends to be higher where there
is conf lict.
Low-income countries affected by conf lict and
climate extremes show the largest increase in
the PoU, while for middle-income countries,
the largest increase occurs during economic
downturns. Africa is the only region with PoU
increases from 2017 to 2019 associated with all
three drivers (conf lict, climate extremes and
economic downturns). Countries affected by
economic downturns in Africa, Asia, and Latin
America and the Caribbean show the highest
increase in the PoU compared with countries
affected by climate extremes and conf lict,
with the largest increase seen in Africa and
Latin America and the Caribbean.
WHAT NEEDS TO BE DONE TO
TRANSFORM FOOD SYSTEMS FOR FOOD
SECURITY, IMPROVED NUTRITION AND
AFFORDABLE HEALTHY DIETS?
Six pathways to address major drivers
behind recent food security and
nutrition trends
In 2020, almost all low- and middle-income
countries were affected by economic downturns.
The increase in the number of undernourished
was more than five times greater than the highest
increase in undernourishment in the last two
decades, and the economic downturn was twice
as severe as any previously recorded in the same
period. When economic downturns occurred
along with other drivers (either climate-related
disasters, conf lict, or a combination of both), the
largest increase in the PoU was seen in Africa,
followed by Asia.
There are six possible recommended pathways
through which food systems could be transformed
to address the major drivers of food insecurity
and malnutrition and ensure access to affordable
healthy diets for all, sustainably and inclusively.
These are: 1) integrating humanitarian,
development and peacebuilding policies in
conflict-affected areas; 2) scaling up climate
resilience across food systems; 3) strengthening
the resilience of the most vulnerable to economic
adversity; 4) intervening along the food supply
chains to lower the cost of nutritious foods;
5) tackling poverty and structural inequalities,
ensuring interventions are pro-poor and inclusive;
and 6) strengthening food environments and
changing consumer behaviour to promote dietary
patterns with positive impacts on human health
and the environment.
In last year’s edition of this report, it was shown
that the unaffordabilit y of healthy diets in 2017
was strongly associated with undernourishment
and different forms of malnutrition, including
child stunting and adult obesit y. These results
are reconfirmed for 2019, and new analysis shows
that high levels of unaffordabilit y in 2019 are
strongly associated with higher levels of both
severe and moderate or severe forms of food
insecurit y, as measured by the FIES.
As many countries are affected by multiple
drivers, several pathways will apply
simultaneously, calling for coherence among
these pathways to ensure efficiency in
implementation. Comprehensive portfolios of
policies, investments and legislation are therefore
are central to enabling the transformation of food
systems through these pathways.
Countries affected by multiple drivers exhibit
the highest percentage of the population who
cannot afford a healthy diet (68 percent), which
is, on average, 39 percent higher than countries
affected by a single driver, and 66 percent
higher than countries not affected by any driver.
| xx |
policies, investments and legislation from
production to consumption aimed at realizing
efficiency gains and cutting food losses and
waste to help achieve these objectives.
Under conditions of conflict, entire food systems
are often severely disrupted, challenging people’s
access to nutritious foods. Deep economic crises
can unfold where the root causes of conflict
situations are linked to competition over natural
resources, including productive land, forest,
fisheries and water resources. It is imperative
that policies, investments and actions to reduce
immediate food insecurity and malnutrition be
implemented simultaneously with those aimed at
a reduction in the levels of conflict and aligned
with long-term socio-economic development and
peacebuilding efforts.
Empowerment of poor and v ulnerable population
groups, often smallholders with limited access
to resources or those living in remote locations,
as well as the empowerment of women, children
and youth, who may otherwise be excluded,
represents a major lever in transformative change.
Measures of empowerment include increased
access to productive resources, including access
to natural resources, agricultural inputs and
technolog y, financial resources, as well as
knowledge and education. Other empowerment
measures relate to strengthened organizational
skills and, importantly, access to digital
technolog y and communication.
The ways we produce food and use our natural
resources can help deliver a climate-positive
future in which people and nature can coexist
and thrive. This is important, not only because
food systems are affected by climate events, but
also because food systems themselves impact
on the state of the environment and are a
driver of climate change. Central to this effort
are priorities to protect nature, to sustainably
manage existing food production and supply
systems, and to restore and rehabilitate natural
environments. These sustainabilit y efforts will
also strengthen resilience to climate shocks to
ensure food securit y and improved nutrition.
Changing dietar y patterns have had both
positive and negative impacts on human health
and the environment. Based on the specific
countr y context and prevailing consumption
patterns, there is a need for policies, laws
and investments to create healthier food
environments and to empower consumers to
pursue dietar y patterns that are nutritious,
healthy and safe and with a lower impact on
the environment.
Economic and social policies, legislation and
governance structures should be in place well in
advance of economic slowdowns and downturns
to counteract the effects of adverse economic
cycles when they do arrive, and to maintain
access to nutritious foods, especially for the most
v ulnerable population groups, including women
and children. In the immediate term, these
must include social protection mechanisms and
primar y healthcare ser vices.
Building coherent portfolios of policies
and investments
A key challenge that restricts successful
transformation of food systems is that
existing national, regional and global policies,
strategies, legislation and investments are
compartmentalized into distinct dialog ues.
These challenges can be overcome through
the formulation and implementation of
cross-sectoral portfolios of policies, investments
and legislation that comprehensively address the
negative food securit y and nutrition effects of
the multiple drivers impacting on food systems.
Inter ventions along food supply chains are
needed to increase the availabilit y of safe and
nutritious foods and lower their cost, primarily
as a means to increase the affordabilit y of
healthy diets. This calls for a coherent set of
| xxi |
EXECUTIVE SUMMARY
insecurit y and malnutrition. When predictable
and well targeted, social protection can support
households to engage in new economic activities,
and to capitalize on opportunities created by
the continued economic dynamism of food
systems, thereby bringing about longer-term
improvements in access to healthy diets.
These portfolios need to be well targeted and
provide incentives for all actors to engage
constructively in innovative and systemic
changes that will lead to transformed food
systems. Drawing upon best practices and lessons
learned from a series of case studies worldwide,
this report provides many illustrative examples
of what it takes – in ver y practical and innovative
ways – to transform food systems at local,
countr y, regional and global levels to become
more resilient to the drivers behind rising levels
of food insecurit y and malnutrition, and to
improve access to affordable healthy diets.
The effective and efficient implementation of
portfolios of policies and investments requires an
enabling environment of governance mechanisms
and institutions that facilitate consultation across
sectors and key stakeholders. Scaling up the
availabilit y of technologies, data and innovative
solutions is key to accelerating the transformation
of food systems, while ensuring that possible
trade-offs are minimized as a consequence of the
transformative process.
The performance of food systems depends
on their coherence and interaction with
several other systems, including especially
the wider agri-food systems, in addition to
environmental, health and social protection
systems. Other systems, such as education
systems, play a critical role throughout the
food system, from providing nutritious school
meals, the necessar y knowledge and skills
in food production to nutrition education for
school-aged children and raising consumer
awareness towards minimizing the negative
impacts of food consumption on human health
and the environment.
The successful transformation of food systems
towards greater affordabilit y of healthy
diets for all, sustainably produced and with
improved resilience to identified drivers, calls
for win-win solutions to be fully exploited.
As with all systemic changes, there will be
winners and losers, while the introduction of
new technologies, improved access to data and
innovations, and the subsequent changes in food
systems performance, will produce both positive
and negative spillover effects. Coherence among
systems, as well as the cross-cutting accelerators,
play a key role in maximizing the benefits
and minimizing negative consequences
of transformation.
Health systems and their services are vital in
ensuring that people are able to consume foods
and utilize the necessary nutrients for their health
and well-being. Food systems may exert both
positive and negative impacts on human health
through multiple interrelated pathways, which
are influenced by factors arising from within and
outside food systems, including social, economic
and environmental determinants of health.
CONCLUSION
With less than a decade to 2030, the world
is not on track to ending world hunger and
malnutrition; and in the case of world hunger,
we are moving in the wrong direction.
This report has shown that economic downturns
as a consequence of COV ID-19 containment
measures all over the world have contributed to
one of the largest increases in world hunger in
Investments in social protection systems
have ser ved as powerful instruments for
strengthening people’s access to nutritious
food, including during the COV ID-19 pandemic.
Importantly, social protection is more than a
short-term response to acute situations of food
| xxii |
The coherence in policies and actions to
transform food systems, and among systems, as
well as the cross-cutting accelerators play a key
role in maximizing the benefits and minimizing
negative consequences of transformation
through these six pathways. That is why policy
coherence, understood as a situation where
the implementation of policies in one area
does not undermine others (and where policies
even reinforce each other where feasible),
will be critical to building transformative
multisectoral portfolios. Systems approaches
are needed for building coherent portfolios
of policies, investments and legislation that
become win-win solutions; these include
territorial approaches, ecosystems approaches,
Indigenous Peoples’ food systems approaches
and inter ventions that systemically address
protracted crisis conditions. n
decades, which has affected almost all low- and
middle-income countries, and can reverse gains
made in nutrition. The COV ID-19 pandemic
is just the tip of the iceberg, more alarmingly,
the pandemic has exposed the v ulnerabilities
forming in our food systems over recent years
as a result of major drivers such as conf lict,
climate variabilit y and extremes, and economic
slowdowns and downturns. These major drivers
are increasingly occurring simultaneously
in countries, with interactions that seriously
undermine food securit y and nutrition.
The UN Food Systems Summit 2021 will bring
forward a series of concrete actions that people
from all over the world can take to support a
transformation of the world’s food systems.
This report has identified six transformation
pathways that, alone or frequently in
combination, depending on context, are needed
for greater resilience to specifically address the
negative impacts of the major drivers behind
the recent rise in hunger and slowing progress
to reduce malnutrition in all its forms, while
ensuring that ever yone can afford a healthy diet.
| xxiii |
INDIA
A fruit vendor weighing
mangoes using a
manual scale during the
COVID-19 pandemic.
©Mnjpkulkarni |
Dreamstime.com
CHAPTER 1
INTRODUCTION
S
has slowed significantly, and adult overweight
and obesit y continue to increase in rich and
poor countries alike.
ince well before the COV ID-19
pandemic, several major drivers have
put the world off track to ending
world hunger and malnutrition in all its forms
by 2030. Now, the COV ID-19 pandemic and
related containment measures have made
it significantly more challenging to achieve
this goal. But they have also highlighted the
need for deeper ref lection on how to better
address the major drivers that are resulting in
the global food insecurit y and malnutrition
situation we are experiencing right now.
What have we learned from past editions?
How did the world get to this critical
point? – is one of the key questions posed
in this year’s report. In answering it, the
report draws on the analyses of the past
four editions, which have produced a vast,
evidence-based body of knowledge of the
major drivers behind the recent changes in
food securit y and nutrition. This is updated
with new data to feed into a broader analysis
of how these drivers interact, allowing
for a holistic view of their combined
effects both on each other and on food
systems. The knowledge accumulated from
these past editions is grounded in evidence.
The development and monitoring of food
In 2014, the long decline in world hunger that
had beg un in 2005 came to a halt. The number
of people experiencing undernourishment
began to slowly increase until, in 2020, the
world witnessed an unprecedented setback
in its hunger eradication efforts, as the latest
estimates in this year’s report indicate.
Moreover, progress in reducing child stunting
|1|
CHAPTER 1 INTRODUCTION
nutrition in 2020. This year’s report confirms
this evidence, presenting the first global
assessment of food insecurit y and malnutrition
for 2020, which makes use of the most recent
data collected around the world in this
challenging year.
securit y and nutrition indicators have made
it possible to make clear diagnoses at global,
regional and countr y levels. a Furthermore,
analysis of these indicators has allowed us
to statistically associate major drivers with
recent setbacks in ending world hunger
and malnutrition in all its forms by 2030.
This has been fundamental in helping us to
understand entr y points for policy to address
these drivers.
There are, of course, a myriad of other drivers
of food insecurit y and malnutrition; b moreover,
drivers can also be outcomes of other drivers. c
This report, however, focuses on the drivers
outlined in Box 1, and how they interact to
affect food securit y and nutrition. These are
the major drivers behind the recent global rise
in hunger and slowing progress in reducing
malnutrition in all its forms. Unless they are
addressed more boldly, they will continue to
drive obser ved trends in food securit y and
nutrition for many years to come.
Three of the major drivers behind the recent
changes in food securit y and nutrition
identified in the past four editions are
conf lict, climate variabilit y and extremes, and
economic slowdowns and downturns, which
are exacerbated by the underlying causes of
povert y and ver y high and persistent levels
of inequalit y (for example in terms of income,
productive capacit y, assets, technolog y,
education and health) ( Box 1).
The selected major drivers as well as the
underlying causes of povert y and inequalit y
are occurring throughout the world in many
countries, often at the same time, creating
compounding effects that are analysed in
this report. The COV ID-19 pandemic and
the measures to contain it have of course led
to an unprecedented economic downturn.
Moreover, some parts of the world also
continue to experience conf lict, while, globally,
climate-related events remain an ever-present
threat. Particularly worr ying is that, as we
show in this report, several of the countries
most affected by the COV ID-19 pandemic
were already struggling with high levels of
undernourishment and different forms of
malnutrition before the pandemic.
In addition, millions of people around
the world suffer from food insecurit y and
different forms of malnutrition because
they cannot afford the cost of healthy diets.
Unaffordabilit y of healthy diets is the
result of myriad factors driving up the cost
of nutritious food and reducing people’s
incomes. This fourth driver is associated with
increasing food insecurit y and all forms of
malnutrition, including stunting, wasting,
micronutrient deficiencies, overweight and
obesit y, and non-communicable diseases
(NCDs). Last year, this report also presented a
preliminar y assessment that warned us about
the potentially unprecedented effects of the
COV ID-19 pandemic on food securit y and
a In the 2017 edition of this report, FAO’s traditional indicator of the
extent of hunger, the prevalence of undernourishment (PoU) – also
an indicator for monitoring SDG Target 2.1 – began to be
complemented by the Prevalence of Severe Food Insecurity, which is
estimated based on data collected using the Food Insecurity
Experience Scale (FIES). Importantly, as the report began to monitor
progress not only towards the target of ending hunger (SDG Target
2.1), but also that of ending all forms of malnutrition (SDG Target 2.2),
indicators for all forms of malnutrition also began to be monitored
and analysed. The SDG indicators of malnutrition were
complemented with indicators that monitor other related targets
endorsed by the World Health Assembly in 2012. Subsequently, the
2019 edition of this report introduced a second indicator for
monitoring SDG Target 2.1: the Prevalence of Moderate or Severe
Food Insecurity, also based on the FIES. Another innovation was
made a year later, in the 2020 edition, with the introduction of
indicators of the cost and unaffordability of healthy diets.
b Other important drivers of food insecurity and malnutrition are
not considered in this report. Many of these are more localized,
affecting specific regions or countries, or occur infrequently or with
limited long-term effects on world hunger and malnutrition. These
include food price hikes, locust outbreaks and localized disease
outbreaks, among others. Human population growth patterns are
drivers at a broader intergenerational scale. There are also more
specific global drivers of malnutrition, for example, poor sanitation,
health services and childcare feeding practices. But these are more
systematically covered in other global nutrition reports, such as the
Global Nutrition Report.
c All drivers can also be seen as outcomes of other drivers. For
example, economic slowdowns and downturns can be driven by a global
financial crisis or global health pandemic, and the unaffordability of
healthy diets can be driven by income changes and supply and demand
factors that affect food prices.
|2|
»
THE STATE OF FOOD SECURITY AND NUTRITION IN THE WORLD 2021
BOX 1 MAJOR DRIVERS AND UNDERLYING FACTORS CHALLENGING FOOD SECURITY AND NUTRITION IN
THE WORLD: A SYNTHESIS FROM THE PREVIOUS FOUR EDITIONS OF THIS REPORT
©FAO/Cengiz Yar
CONFLICT
©FAO/J. Thompson
CLIMATE VARIABILITY
AND EXTREMES
©FAO/Giuseppe Bizzarri
ECONOMIC SLOWDOWNS
AND DOWNTURNS
©FAO/Vyacheslav Oseledko
UNAFFORDABILITY
OF HEALTHY DIETS
CONFLICT (2017 edition) is a major threat to food security and nutrition
and the leading cause of global food crises. Marked increases in the
number and complexity of conflicts in the last ten years have eroded
gains in food security and nutrition, leading several countries to the brink
of famine. Internal conflicts have surpassed the number of interstate
conflicts, but with a significant rise in internationalized internal conflicts.
More than half of the people who are undernourished and almost
80 percent of stunted children live in countries struggling with some form
of conflict, violence or fragility.1,2
CLIMATE VARIABILITY AND EXTREMES (2018 edition) are a key driver
behind the recent rise in global hunger, one of the leading causes of
severe food crises, and a contributing factor to the alarming levels of
malnutrition seen in recent years. Increasing climate variability and
extremes, linked to climate change, are negatively affecting all dimensions
of food security and nutrition. Hunger is significantly worse in countries
with agri-food systems highly sensitive to rainfall and temperature
variability and extremes, and where a high proportion of the population
depends on agriculture for livelihoods. Alarmingly, countries are
increasingly exposed to multiple types of climate extremes.3,4
ECONOMIC SLOWDOWNS AND DOWNTURNS (2019 edition) are a key
driver behind rises in hunger and food insecurity. They hinder progress
towards elimination of malnutrition in all its forms, irrespective of whether
they are driven by market swings, trade wars, political unrest or a global
pandemic, such as that driven by COVID-19. Most countries where hunger
has increased have experienced these economic slowdown and downturn
episodes. Economic slowdowns and downturns can also result in people
purchasing cheaper, less nutritious foods – contributing to poor nutritional
quality of diets. These episodes are statistically related to rising food
insecurity as well.5,6
The UNAFFORDABILITY OF HEALTHY DIETS (2020 edition of this report)
is associated with increasing food insecurity and all forms of malnutrition,
including stunting, wasting, overweight and obesity. Several factors are
driving the cost of nutritious foods throughout food systems, in the realms
of food production, food supply chains, food environments, as well as
consumer demand and the political economy of food. These, combined
with low incomes, explain why around three billion people cannot afford
even the cheapest healthy diet, one that includes foods from several
groups and has greater diversity within food groups.7,8,9
|3|
CHAPTER 1 INTRODUCTION
BOX 1 (CONTINUED)
UNDERLYING CAUSES OF POVERTY AND INEQUALITY
»
POVERTY AND INEQUALITY (2019 and 2020
editions) are underlying structural causes of
food insecurity and malnutrition in all its forms,
which amplify the negative impacts of the global
drivers above. Poverty negatively impacts on
the nutrition quality of diets. Unsurprisingly,
healthy diets are unaffordable for the poor in
every region of the world.7,8,9 Food insecurity and
malnutrition in all its forms are made worse by
high and persistent levels of inequality – in terms
of income, productive assets and basic services
(e.g. health, education), as well as access to
information and technology (e.g. digital divide)
and, more generally, wealth. Income inequality
in particular increases the likelihood of food
insecurity – especially for socially excluded and
marginalized groups – and undercuts the positive
effect of any economic growth on individual food
security. Structural vulnerabilities, including
inequalities related to gender, youth, ethnicity,
Indigenous Peoples and people with disabilities,
tend to exacerbate poverty, food insecurity
and malnutrition during periods of economic
slowdowns and downturns, or following conflict
and climate-related disasters.5,6 Furthermore,
these levels of inequality are being accelerated by
the COVID-19 pandemic.7,8,9
From synthesis to the way forward
drivers are negatively affecting food securit y
and nutrition through their impact on food
systems and the circular interconnected
impacts of these drivers on other systems,
including environmental and health systems,
among others.
The COV ID-19 pandemic was a powerful
wake-up call that exposed the f leeting nature
of our progress on food securit y and nutrition.
At the same time, however, it has provided
us with the opportunit y to re-evaluate how
we tackle the major drivers of hunger and
malnutrition and refocus our efforts to
build forward better. To make the most of
this opportunit y, though, requires that we
understand the interconnected nature of these
drivers through a food systems lens and that
we inform our actions on the evidence that
emerges from doing so.
Thus, food systems will not become a powerful
force contributing to ending hunger and
malnutrition in all its forms in the world,
unless they are transformed with strengthened
resilience to the major drivers identified in
the four past editions of this report and are
incentivized to provide affordable healthy
diets sustainably and inclusively. While the
calls for broader food systems transformation
for efficiency, resilience, environmental
sustainabilit y and inclusivit y are currently
the centre of global attention, this report
identifies the transformation pathways needed
to specifically address the major drivers behind
the recent rise in hunger and slowing progress
towards reducing malnutrition in all its forms.
As we further elaborate in this report, conf lict,
climate variabilit y and extremes, economic
slowdowns and downturns, and povert y and
inequalit y are external forces acting on food
systems, while the cost and affordabilit y
of diets is an internal force acting within
food systems. These external and internal
|4|
THE STATE OF FOOD SECURITY AND NUTRITION IN THE WORLD 2021
systems lens. This is followed by a chapter
that offers an in-depth look at how to
move from silo solutions to integrated food
systems solutions that specifically address
the challenges posed by the major drivers,
highlighting also the t y pes of portfolios of
policies, investments and legislation required
to transform food systems for food securit y,
improved nutrition and affordable healthy
diets for all. The three chapters are followed
by an overall conclusion. n
This year’s report comprises three main
chapters. It starts with a description of the
latest updates and trends in food securit y
and nutrition, and offers some indication
of what hunger would look like by 2030,
in a scenario further complicated by the
enduring effects of the COV ID-19 pandemic.
The next chapter provides a synthesis of
understanding and empirical analysis of
the major drivers behind these trends,
alone and in combination, through a food
|5|
ETHIOPIA
A local woman collects
yield after her crops
have been heavily
affected by invading
locust swarms.
©FAO/Petterik Wiggers
CHAPTER 2
FOOD SECURITY
AND NUTRITION
AROUND THE
WORLD
T
security indicators in Section 2.1 and the nutrition
indicators in Section 2.2. First presented in The
State of Food Security and Nutrition in the World
2020, these indicators are systematically updated
and disseminated annually in this report.
his chapter presents the first global
assessment of food insecurit y and
malnutrition for 2020, the year the
COV ID-19 pandemic spread rapidly across the
globe. Prior to the pandemic, progress was
already stalled towards meeting SDG Targets 2.1
and 2.2: ending hunger and ensuring access to
safe, nutritious and sufficient food for all people
all year round; and eradicating all forms of
malnutrition. While the pandemic has caused
major setbacks, there is much to be learned
from the v ulnerabilities and inequalities it laid
bare. If taken to heart, these new insights and
wisdom can help get the world back on track
towards achievement of SDG Targets 2.1 and
2.2. This global assessment provides a clear
diagnostic to put in place the policies needed.
Section 2.2 presents the latest available
evidence on the state of nutrition and progress
towards the global nutrition targets defined
by the World Health Assembly in 2012 and the
Sustainable Development Agenda (SDG 2.2).
Updated estimates for four of the nutrition
indicators are provided.
Section 2.3 looks ahead to 2030 with new
projections regarding the state of food securit y
and nutrition in a scenario further complicated by
the COV ID-19 pandemic. Estimates of what the
prevalence of undernourishment may be in 2030
are provided, based on a general equilibrium
model that derives trajectories of food supply,
economic growth, povert y rates and real price
of food. While projections for the nutrition
indicators do not take the COV ID-19 pandemic
into account, modelled projections of its potential
impact on the prevalence of child undernutrition
(stunting and wasting) are presented. n
Section 2.1 presents a comprehensive assessment
of the state of food security and progress towards
achieving the hunger and food insecurity
targets (SDG 2.1). It includes global, regional
and subregional assessments for 2020 based
on the most recent data collected around the
world. Also included are new estimates of the
cost and affordability of healthy diets, which
provide an important link between the food
|7|
CHAPTER 2 FOOD SECURITY AND NUTRITION AROUND THE WORLD
2.1
è The sharpest increases in moderate or severe food
insecurity in 2020 occurred in Latin America and the
Caribbean and in Africa. In Northern America and
Europe, food insecurity increased for the first time since
the beginning of FIES data collection in 2014.
FOOD SECURITY
INDICATORS – LATEST
UPDATES AND
PROGRESS TOWARDS
ENDING HUNGER
AND ENSURING FOOD
SECURITY
è Of the 2.37 billion people facing moderate or
severe food insecurity, half (1.2 billion) are found in
Asia, one-third (799 million) in Africa, and 11 percent
(267 million) in Latin America and the Caribbean.
è Close to 12 percent of the global population was
severely food insecure in 2020, representing 928 million
people – 148 million more than in 2019.
è At the global level, the gender gap in the prevalence
of moderate or severe food insecurity has grown even
larger in the year of the COVID-19 pandemic, with the
prevalence of moderate or severe food insecurity being
10 percent higher among women than men in 2020,
compared with 6 percent in 2019.
KEY MESSAGES
è World hunger increased in 2020 under the
shadow of the COVID-19 pandemic. After remaining
virtually unchanged for five years, the prevalence of
undernourishment (PoU) increased from 8.4 to around
9.9 percent in just one year, heightening the challenge
of achieving the Zero Hunger target by 2030.
è The high cost of healthy diets coupled with
persistent high levels of income inequality put healthy
diets out of reach for around 3 billion people, especially
the poor, in every region of the world in 2019 – slightly
less than in 2017.
è It is projected that between 720 and 811 million
people in the world faced hunger in 2020. Considering the
middle of the projected range (768 million), around
118 million more people were facing hunger in 2020 than
in 2019 – or as many as 161 million more, considering the
upper bound of the projected range.
è Notably, only Africa and Latin America show an
increase in the unaffordability of heathy diets between
2017 and 2019, but it is likely that increases will be seen
in most regions in 2020 due to the COVID-19 pandemic.
è Hunger affects 21.0 percent of the population
in Africa, compared with 9.0 percent in Asia and
9.1 percent in Latin America and the Caribbean.
In terms of numbers, more than half of the world’s
undernourished are found in Asia (418 million) and more
than one-third in Africa (282 million).
Grappling with uncertainty in the face of
the COVID-19 pandemic
One thing is certain: 2020 was a year of great
economic and human losses, provoked by
the onset of a global pandemic that deprived
millions of people of their health, lives and
livelihoods throughout the world. However, the
physical distancing measures taken to contain
the spread of the pandemic also resulted in the
disruption of data collection activities around
the world, posing data and methodological
challenges for the assessment of the state of
food securit y in 2020. As a result, the task
of estimating how many people were thrust
into hunger and food insecurit y globally is
fraught with more uncertaint y this year than in
past years.
è Compared with 2019, about 46 million more people
in Africa, 57 million more in Asia, and about 14 million
more in Latin America and the Caribbean were affected
by hunger in 2020.
è While the global prevalence of moderate or severe
food insecurity (measured using the Food Insecurity
Experience Scale) has been slowly on the rise since
2014, the estimated increase in 2020 was equal to that
of the previous five years combined. Nearly one in three
people in the world (2.37 billion) did not have access
to adequate food in 2020 – an increase of almost
320 million people in just one year.
|8|
»
THE STATE OF FOOD SECURITY AND NUTRITION IN THE WORLD 2021
BOX 2 UPDATES TO THE PREVALENCE OF UNDERNOURISHMENT AND METHODOLOGY
FOR THE 2020 NOWCAST
lack of official data or projections of the level and
inequality in food consumption at country level in 2020,
different methods were developed this year to nowcast
the 2020 values of DEC and CV|y. The following specific
data and procedures were used to project these two
parameters for 2020:
The PoU series is revised annually prior to the
publication of each new edition of The State of Food
Security and Nutrition in the World. This is done to take
into account any new information that FAO has received
since the release of the previous edition. As this process
usually implies backward revisions of the entire PoU
series, readers are warned to refrain from comparing
series across different editions of these reports.
Readers should always refer to the most current edition
of the report, including for values in past years.
Current estimates of per capita, average dietary
energy supply (DES) in 2020, compiled on the basis of
the short-run market outlook exercises conducted by
FAO to inform the World Food Situation,15 were used
to nowcast the 2020 value of DEC for each country,
starting from the last available year in the FBS series.
FIES data collected by FAO in 2020 (see section on
SDG 2.1.2 below) were used to nowcast the values
of CV|y up to 2020. As in past editions of this report,
FIES data collected by FAO from 2014 to 2019
were used to project the changes in the CV|y from
2015 (or from the year of the last food consumption
survey) up to 2019, based on a smoothed (three-year
moving average) trend in severe food insecurity.
However, recognizing that reliance on three-year
moving averages would very likely underestimate
the actual change in CV|y from 2019 to 2020, the
2020 nowcast was instead based on the change
estimated by considering the actual, unsmoothed
change in the prevalence of severe food insecurity
from 2019 to 2020. In addition, recognizing that
the COVID-19 pandemic has created additional
constraints that may have exacerbated an overall
inequality in the ability of people to access food,
an additional component was considered in the
estimates of the total CV of the distribution of dietary
energy consumption in 2020 that is independent
of both monetary incomes and dietary energy
requirements. In practice, the range of values for
the nowcast 2020 CV|y is obtained by parametrically
varying the contribution of the change in CV to
the change in PoU estimates from one-third (as
modelled in the past), which provides the lower
bound, to 100 percent of the observed change in
severe food insecurity, which provides the upper
bound. Further details and the ranges of the PoU at
the regional and subregional levels can be found
in Annex 2.
ROUTINE REVISIONS
The new data used to conduct the routine revisions/
updates to the PoU series are reflected in new series
of the three underlying parameters that inform the
PoU: the average dietary energy consumption (DEC),
the inequality in access to dietary energy (CV) and the
minimum dietary energy requirement (MDER) (see
Annex 1B for details on the methodology). For this
edition of the report, updated Food Balance Sheet (FBS)
series for all countries up to 2018 and for 56 priority
countries up to 2019 were used to revise the series of
the parameter referring to the average value of DEC
at country level. More specifically, updated data on
production and trade was used, as a result of increased
interaction with national data providers, together with
new data of stocks coming from external sources such as
specialized commodity institutions. Furthermore, a new
methodological approach to treat stocks and non-food
industrial utilization was implemented. In the same way,
food consumption data from household consumption
and expenditure surveys from 17 countries and various
years that became available to FAO since last year* were
used to revise the parameter referring to inequality in
access to dietary energy due to income (CV|y).
NOWCAST OF THE PoU IN 2020
The exceptional nature of the COVID-19 pandemic made
it particularly challenging to produce reliable estimates
for 2020, a year like no other in recent history. For this
reason, a range is presented for the value of the 2020
global PoU.
The uniqueness of the 2020 situation makes the
time series-based forecasting methods used in past
editions of this report inappropriate. Considering the
* Afghanistan (2019), Armenia (2018), Bolivia (Plurinational State of) (2014 and 2018), Botswana (2017), Brazil (2018), Burkina Faso (2018), Ethiopia
(2016), Kiribati (2020), Malawi (2017), Mongolia (2016 and 2018), Namibia (2016), Nigeria (2013, 2016 and 2019), Pakistan (2018), Rwanda (2015),
Samoa (2018), Solomon Islands (2013), Uganda (2017).
|9|
CHAPTER 2 FOOD SECURITY AND NUTRITION AROUND THE WORLD
FIGURE 1 THE NUMBER OF UNDERNOURISHED PEOPLE IN THE WORLD CONTINUED TO RISE IN 2020.
BETWEEN 720 AND 811 MILLION PEOPLE IN THE WORLD FACED HUNGER IN 2020. CONSIDERING THE
MIDDLE OF THE PROJECTED RANGE (768 MILLION), 118 MILLION MORE PEOPLE WERE FACING HUNGER IN
2020 THAN IN 2019 – OR AS MANY AS 161 MILLION, CONSIDERING THE UPPER BOUND OF THE RANGE
1 000
19
810.7
720.4
15
PERCENTAGE
800
768.0
606.9
13
650.3
615.1
700
600
500
12.4%
11
10.4%
9.9%
9
400
MILLIONS
17
900
811.0
300
9.2%
8.3%
200
8.4%
8.3%
7
100
0
5
2005
2006
2007
2008
2009
2010
2011
2012
2013
Prevalence of undernourishment (percentage, left axis)
2014
2015
2016
2017
2018
2019
2020*
Number of undernourished (millions, right axis)
NOTES: * Projected values for 2020 in the figure are illustrated by dotted lines. Shaded areas show lower and upper bounds of the estimated range.
SOURCE: FAO.
» In this edition of the report, the nowcast
In contrast, the 2020 assessments of the
prevalence of moderate or severe food insecurit y
based on the Food Insecurit y Experience Scale
(SDG Indicator 2.1.2), also presented in this
section, are informed mainly by sur vey data
collected by FAO through the Gallup © World
Poll (GWP) in over 140 different countries, and
conducted mostly via telephone inter views due to
the restrictions imposed by the pandemic ( Box 3).
(prediction of the recent past) for 2020 of
the global prevalence of undernourishment
(SDG Indicator 2.1.1) is presented as a range to
ref lect the added uncertaint y around the hunger
estimates induced by the unprecedented shock
of the COV ID-19 pandemic. It is important
to note that the 2020 PoU estimates are not
based on data reported by countries for 2020.
Rather, they are derived by nowcasting the
parameters used in the estimation of the PoU,
using the best data available to FAO regarding
the food supply and reasonable assumptions on
the extent of inequalit y in access to food ( Box 2).
SDG Indicator 2.1.1
Prevalence of undernourishment (PoU)
There is no doubt that the number of people
in the world affected by hunger continued
to increase in 2020 under the shadow of the
| 10 |
THE STATE OF FOOD SECURITY AND NUTRITION IN THE WORLD 2021
TABLE 1 PREVALENCE OF UNDERNOURISHMENT (PoU) IN THE WORLD, 2005–2020
Prevalence of undernourishment (%)
2005
2010
2015
2016
2017
2018
2019
2020*
WORLD
12.4
9.2
8.3
8.3
8.1
8.3
8.4
9.9
AFRICA
21.3
18.0
16.9
17.5
17.1
17.8
18.0
21.0
8.5
7.3
6.1
6.2
6.5
6.4
6.4
7.1
Sub-Saharan Africa
24.6
20.6
19.4
20.1
19.5
20.4
20.6
24.1
Eastern Africa
33.0
28.4
24.8
25.6
24.9
25.9
25.6
28.1
Middle Africa
Northern Africa
36.8
28.9
28.7
29.6
28.4
29.4
30.3
31.8
Southern Africa
5.0
6.2
7.5
7.9
7.3
7.6
7.6
10.1
Western Africa
14.2
11.3
11.5
11.9
11.8
12.5
12.9
18.7
ASIA
13.9
9.5
8.3
8.0
7.8
7.8
7.9
9.0
Central Asia
10.6
4.4
2.9
3.2
3.2
3.1
3.0
3.4
Eastern Asia
6.8
<2.5
<2.5
<2.5
<2.5
<2.5
<2.5
<2.5
South-eastern Asia
17.3
11.6
8.3
7.8
7.4
6.9
7.0
7.3
Southern Asia
20.5
15.6
14.1
13.2
13.0
13.1
13.3
15.8
Western Asia
9.0
9.1
14.3
15.0
14.5
14.4
14.4
15.1
Western Asia and
Northern Africa
8.8
8.2
10.5
10.9
10.7
10.6
10.7
11.3
LATIN AMERICA AND
THE CARIBBEAN
9.3
6.9
5.8
6.8
6.6
6.8
7.1
9.1
19.2
15.9
15.2
15.4
15.3
16.1
15.8
16.1
Caribbean
Latin America
8.6
6.2
5.1
6.2
6.0
6.1
6.5
8.6
Central America
8.0
7.4
7.5
8.1
7.9
8.0
8.1
10.6
South America
8.8
5.7
4.2
5.4
5.2
5.4
5.8
7.8
6.9
5.3
6.1
6.2
6.3
6.2
6.2
6.2
<2.5
<2.5
<2.5
<2.5
<2.5
<2.5
<2.5
<2.5
OCEANIA
NORTHERN AMERICA
AND EUROPE
NOTES: * Projected values based on the middle of the projected range. The full ranges of the projected 2020 values can be found in Annex 2.
For country compositions of each regional/subregional aggregate, see Notes on geographic regions in statistical tables inside the back cover.
SOURCE: FAO.
COV ID-19 pandemic. The long decline in
undernourishment from 2005 to 2014 had already
come to a halt, as described in previous editions
of The State of Food Security and Nutrition in the
World. After remaining virtually unchanged from
2014 to 2019, the PoU increased from 8.4 percent
to around 9.9 percent between 2019 and 2020
( Figure 1), heightening the challenge of achieving
the Zero Hunger target by 2030. The 2020
estimate ranges from 9.2 to 10.4 percent,
depending on the assumptions made to ref lect
the uncertainties around the assessment ( Box 2).
faced hunger in 2020. Considering the middle
of the projected range (768 million), 118 million
more people were facing hunger in 2020 than in
2019 ( Figure 1), with estimates ranging from 70 to
161 million. The 2020 estimates presented in
Tables 1 and 2 are based on the middle of the projected
range. The full ranges can be found in Annex 2.
While the COV ID-19 pandemic surely was a
contributing factor, changes obser ved from 2019
to 2020 cannot be attributed only to the pandemic
given the many other factors at play, as described
in Chapter 3. Notwithstanding, the increase
in hunger in 2020 is consistent with existing
evidence of the economic hardships induced by
In terms of population, it is estimated that
between 720 and 811 million people in the world
| 11 |
CHAPTER 2 FOOD SECURITY AND NUTRITION AROUND THE WORLD
TABLE 2 NUMBER OF UNDERNOURISHED PEOPLE IN THE WORLD, 2005–2020
Number of undernourished (millions)
2005
2010
2015
2016
2017
2018
2019
2020*
WORLD
810.7
636.8
615.1
619.6
615.0
633.4
650.3
768.0
AFRICA
195.0
187.4
199.7
212.0
212.3
227.1
235.3
281.6
15.8
14.8
13.6
14.2
15.0
15.1
15.5
17.4
Sub-Saharan Africa
179.2
172.6
186.1
197.8
197.3
212.0
219.8
264.2
Eastern Africa
97.3
96.3
96.5
102.5
102.3
109.6
111.3
125.1
Middle Africa
Northern Africa
41.2
38.0
44.3
47.1
46.5
49.7
52.9
57.1
Southern Africa
2.7
3.6
4.7
5.1
4.7
5.0
5.1
6.8
Western Africa
38.0
34.7
40.5
43.2
43.8
47.8
50.6
75.2
553.6
400.1
369.9
356.1
352.1
354.6
361.3
418.0
Central Asia
6.2
2.7
2.0
2.2
2.2
2.2
2.2
2.6
Eastern Asia
106.0
n.r.
n.r.
n.r.
n.r.
n.r.
n.r.
n.r.
97.0
69.0
52.7
49.9
48.1
45.3
46.0
48.8
Southern Asia
325.9
267.9
256.9
243.8
243.8
247.6
255.2
305.7
Western Asia
18.5
21.1
37.0
39.3
38.6
38.9
39.8
42.3
Western Asia and
Northern Africa
34.4
35.9
50.5
53.6
53.7
54.0
55.3
59.7
LATIN AMERICA AND
THE CARIBBEAN
51.9
40.7
36.4
42.9
42.2
43.7
45.9
59.7
7.6
6.5
6.5
6.6
6.6
6.9
6.8
7.0
ASIA
South-eastern Asia
Caribbean
Latin America
44.3
34.2
29.9
36.3
35.7
36.7
39.1
52.7
Central America
11.7
11.7
12.7
13.9
13.7
14.0
14.4
19.0
South America
32.7
22.5
17.2
22.4
22.0
22.7
24.7
33.7
OCEANIA
2.3
1.9
2.4
2.5
2.6
2.6
2.6
2.7
NORTHERN AMERICA
AND EUROPE
n.r.
n.r.
n.r.
n.r.
n.r.
n.r.
n.r.
n.r.
NOTES: * Projected values based on the middle of the projected range. The full ranges of the projected 2020 values can be found in Annex 2.
n.r. = not reported, as the prevalence is less than 2.5 percent. Regional totals may differ from the sum of subregions, due to rounding and non-reported
values. For country compositions of each regional/subregional aggregate, see Notes on geographic regions in statistical tables inside the back cover.
SOURCE: FAO.
the COV ID-19 crisis that have likely aggravated
inequalities in access to food. The World Bank
estimates that the COV ID-19 pandemic pushed
an additional 119 million to 124 million people
into extreme povert y in 2020. 10 Sur veys by
the World Bank and others reveal staggering
proportions of both urban and rural households
that reported a decrease in their income after the
beginning of the COV ID-19 crisis. 11,12
coverage, generosit y and duration of the social
protection responses varied across regions and
countries, as did their effectiveness in mitigating
the impacts of the pandemic on povert y.
With some exceptions, data suggest that coverage
has been relatively short-lived. On average,
responses lasted just over three months, and
roughly 40 percent of programmes consisted of
one-time payments. 13,14
This is despite an unprecedented response
by countries worldwide to implement social
protection measures. However, the speed,
The numbers show enduring and troubling
regional inequalities. About one in five people
(21 percent of the population) was facing
| 12 |
THE STATE OF FOOD SECURITY AND NUTRITION IN THE WORLD 2021
FIGURE 2 MORE THAN HALF (418 MILLION) OF THE PEOPLE IN THE WORLD AFFECTED BY HUNGER IN 2020
WERE IN ASIA AND MORE THAN ONE-THIRD (282 MILLION) IN AFRICA
ASIA
418 million
NOT UNDERNOURISHED
7 027 million
UNDERNOURISHED
768 million
AFRICA
282 million
LATIN AMERICA
AND THE CARIBBEAN
60 million
OCEANIA
3 million
NORTHERN AMERICA
AND EUROPE
n.r.
NOTES: Number of undernourished in millions. Projected values based on the middle of the projected range. The full ranges of the projected 2020 values
can be found in Annex 2. n.r. = not reported, as the prevalence is less than 2.5 percent.
SOURCE: FAO.
hunger in Africa in 2020 – more than double the
proportion of any other region. This represents
an increase of 3 percentage points in one year.
This is followed by Latin America and the
Caribbean (9.1 percent) and Asia (9.0 percent),
with increases of 2.0 and 1.1 percentage points,
respectively, between 2019 and 2020 ( Table 1).
Looking more closely at subreg ional
differences ( Tables 1 and 2), in Africa, the
proportion of the population in Northern
A frica affected by hunger in 2020 (7.1 percent)
is much smaller compared w ith almost all
subreg ions of sub-Saharan A frica, except
for Southern A frica (10.1 percent). In the
other subreg ions, the prevalence ranges from
18.7 percent in Western A frica to 31.8 percent
in Middle A frica. The largest number of
undernourished people live in Eastern A frica –
more than 125 million.
While the regional prevalence estimates reveal
the depth of hunger in each region, translating
them into numbers of people gives a sense
of where most of the people facing hunger in
the world live ( Table 2). Of the total number of
undernourished people in 2020 (768 million),
more than half (418 million) live in Asia and
more than one-third (282 million) in Africa,
while Latin America and the Caribbean accounts
for about 8 percent (60 million) ( Figure 2).
Compared with 2019, 46 million more people
in Africa, almost 57 million more in Asia, and
about 14 million more in Latin America and the
Caribbean were affected by hunger in 2020.
In Asia, the PoU in 2020 ranges from below
2.5 percent in Eastern Asia to a high of
15.8 percent in Southern Asia, which also
has the highest number of undernourished
people – nearly 306 million. The prevalence
of undernourishment in Western Asia
(15.1 percent) is nearly on par w ith that of
Southern Asia.
| 13 |
CHAPTER 2 FOOD SECURITY AND NUTRITION AROUND THE WORLD
FIGURE 3 ALL SUBREGIONS OF AFRICA AND LATIN AMERICA AND THE CARIBBEAN, AND MOST
SUBREGIONS OF ASIA, SHOW INCREASES IN THE PREVALENCE OF UNDERNOURISHMENT FROM 2019 TO
2020, WITH THE SHARPEST INCREASE IN WESTERN AFRICA
WORLD AND REGIONS
AFRICA
LATIN AMERICA
AND THE CARIBBEAN
ASIA*
35
30
PERCENTAGE
25
20
15
10
5
0
2015
2019 2020** 2015
World
Africa
Asia
Latin America
and the Caribbean
2019 2020** 2015
Africa
Eastern Africa
Middle Africa
Northern Africa
Southern Africa
Western Africa
2019 2020** 2015
Asia
Central Asia
Southern Asia
South-eastern Asia
Western Asia
2019 2020**
Latin America and the Caribbean
Caribbean
Central America
South America
NOTES: * Eastern Asia is not shown because the PoU has been consistently below 2.5 percent since 2010. ** Projected values based on the middle of the
projected range. The full ranges of the projected 2020 values can be found in Annex 2.
SOURCE: FAO.
In Latin America and the Caribbean, the estimates
point to a PoU of 16.1 percent in the Caribbean,
compared with 10.6 in Central America and 7.8 in
South America.
access by the end of 2020 (see Chapter 3).
The sharpest increase in undernourishment was
in Western Africa, of 5.8 percentage points in
just one year, corresponding to 24.6 million more
people. If confirmed, it would be further evidence
of the trends noted by FAO and W FP in 2020 for
several countries in this subregion, 16 signalling
the need for heightened attention as the situation
evolves to prevent further deterioration.
As illustrated in Figure 3, all subregions of Africa
and Latin America and the Caribbean, and most
subregions of Asia, show increases in the PoU
from 2019 to 2020, likely ref lecting the way the
COV ID-19 pandemic exacerbated pre-existing
drivers of food insecurit y and impacted food
| 14 |
THE STATE OF FOOD SECURITY AND NUTRITION IN THE WORLD 2021
SDG Indicator 2.1.2
Prevalence of moderate or severe food
insecurity in the population, based on
the FIES
as much as in the previous five years combined,
to 30.4 percent. Thus, nearly one in three people
in the world did not have access to adequate food
in 2020 – an increase of 320 million people in just
one year, from 2.05 to 2.37 billion ( Table 4).
SDG Target 2.1 challenges the world to go
beyond just ending hunger. For optimal health
and well-being, it is imperative to ensure
access for all to safe, nutritious and sufficient
food all year round. SDG Indicator 2.1.2 – the
prevalence of moderate or severe food insecurit y
in the population, based on the Food Insecurit y
Experience Scale (FIES) – has been specifically
chosen to monitor progress towards ensuring
access to adequate food for all.
Nearly 40 percent of those people – 11.9 percent
of the global population, or almost 928 million –
faced food insecurit y at severe levels, indicating
they had run out of food and, at worst, gone a day
without eating. The increase in the prevalence
of severe food insecurit y from 2019 to 2020 was
also equal to the total increase from 2014 to 2019;
close to 148 million more people were severely
food insecure in 2020.
Although severe food insecurit y normally
correlates with the PoU, it is worth noting that
the increase in the number of severely food
insecure people from 2019 to 2020 is somewhat
greater than the increase in the estimated
number of undernourished presented in the
preceding section, based on the middle range
estimate in Table 2. This is likely due mainly
to the ver y different nature of the indicators.
As explained, the FIES data were collected
directly from respondents in sur veys, with data
collection beginning late in 2020 and extending
into early 2021 when the impacts of
the COV ID-19 pandemic were already more
apparent. The 2020 PoU estimates, on the
other hand, are nowcasts based on data on
food availabilit y and access to food that
may not yet ref lect the full impact of the
COV ID-19 pandemic.
The estimates of the prevalence of food
insecurit y at severe levels only provide a
supplementar y lens for monitoring hunger
to complement the PoU. Although obtained
using ver y different data and methods,
they are expected to correlate with the PoU
across populations. This is because people
experiencing severe food insecurit y are
unlikely to be able to acquire enough food
to continuously fulfil their dietar y energ y
requirements, which is the concept of chronic
undernourishment measured by the PoU. 5,7
The food insecurit y estimates in this report are
based mainly on FIES data collected by FAO
through the GWP ( Box 3). However, a growing
number of countries are adopting the FIES as a
standard food securit y assessment tool, making
FIES data increasingly available from official
national sources. This year, FIES or equivalent
experience-based food securit y data collected
by national institutions were used for more
than 40 countries, covering approximately a
quarter of the world population (see Annex 1B).
In addition, this year’s report is informed by FIES
data collected by FAO in 2020 for a preliminar y
assessment of the food insecurit y situation in the
context of the COV ID-19 pandemic in a group of
20 countries facing food insecurit y crises 17 ( Box 4).
The increases in moderate or severe food
insecurit y from 2019 to 2020 were sharpest in
Latin America and the Caribbean (9 percentage
points) and Africa (5.4 percentage points),
compared with a 3.1-point increase in Asia ( Table 3
and Figure 4). However, Africa still has the highest
prevalence of food insecurit y at both levels of
severit y. Nearly 60 percent of the population
of Africa was affected by moderate or severe
food insecurit y in 2020, and 26 percent faced
severe food insecurit y. In Latin America and
the Caribbean, 41 percent of the population was
moderately or severely food insecure in 2020, and
14 percent was severely food insecure. The food
insecurit y situation was comparatively better
in Asia, where 26 percent of the population was
Since FAO first started collecting FIES data in
2014, moderate or severe food insecurit y at the
global level has been slowly on the rise, from
22.6 percent in 2014 to 26.6 percent in 2019 ( Table 3
and Figure 4). Then in 2020, the year the COV ID-19
pandemic spread across the globe, it rose nearly
| 15 |
CHAPTER 2 FOOD SECURITY AND NUTRITION AROUND THE WORLD
BOX 3 ADAPTING FIES DATA COLLECTION IN THE CONTEXT OF THE COVID-19 PANDEMIC IN 2020
FAO has collected FIES data annually since 2014
through the Gallup© World Poll (GWP) in nationally
representative samples of the population in over 140
different countries, in the context of the Voices of the
Hungry project.18 A major difference in the 2020 round
of GWP data collection is that data were collected
almost exclusively via telephone, due to restrictions
imposed in response to the COVID-19 pandemic that
impeded face-to-face interviews. This represents
an important change with respect to previous years.
GWP data collection in 2020 targeted only countries
where telephone coverage (mobile and/or landline)
exceeded 70 percent. FAO collected additional FIES
data in a group of 20 countries facing food insecurity
crises (see Box 4). This information complemented
the coverage of the GWP data and allowed for a more
comprehensive assessment in 2020.
For the 2020 round of data collection, a modified
version of the FIES survey module was used, with the
objective of also understanding the additional impact
that the COVID-19 pandemic might be having on food
security. In addition to the standard eight questions,
the extended module included follow-up questions
to determine whether the respondent attributed the
reported food insecurity experience mainly to the
COVID-19 crisis. A similar module was used for the
data collection in the countries facing food insecurity
crises not covered by the GWP (Box 4).
In contrast to face-to-face interviewing, using
telephone interviews in surveys that are intended
to cover the general population may induce biases
that needed to be addressed. Given the use of dual
sampling frames (both landline and mobile telephone
numbers) and the potential for the presence of
dual-users in households where both landline and
mobile phones are available, additional weights
were constructed (when relevant) to correct for the
unequal probability of selection of respondents.
The population with access to telephones tends
to be wealthier, more educated and mostly urban,
which implies selection biases that may lead to
underestimating the extent and severity of food
insecurity. Thus, to minimize the risk of biased
estimates, a weighting procedure based on the
sample design was formulated and carried out in
multiple stages. A probability weight factor (base
weight) was constructed to account for selection
of telephone numbers from each mobile stratum.
In a next step, such base weights were further
adjusted depending on the sex, age, employment
and educational level of the respondent, to
adjust for non-response and for the difference in
the composition of the realized sample vis-à-vis
the intended reference population using mostly
country-level population censuses.
affected by moderate or severe food insecurit y
in 2020, and 10 percent was facing severe food
insecurit y. Nevertheless, because of the size of
its population, Asia still accounts for half the
moderately or severely food insecure people in
the world ( Figure 5).
in Oceania: 12 percent of the population was
affected by moderate or severe food insecurit y
in 2020, including 2.6 percent who were facing
severe levels of food insecurit y. It is interesting to
note a small improvement in food securit y in this
region in 2020, at both levels of severit y – a trend
that began in 2017 and seems not to have been
altered by the pandemic.
Even in Northern America and Europe, where
the lowest rates of food insecurit y are found,
the prevalence of food insecurit y increased for
the first time in 2020 since the beginning of
FIES data collection in 2014 ( Table 3). In 2020,
8.8 percent of the population of Northern
America and Europe was moderately or severely
food insecure, and 1.4 percent was severely food
insecure, compared with 7.7 and 1.0 percent in
2019, respectively. The rates were slightly higher
Figure 5 shows that, from a total of 2.37 billion
suffering from food insecurit y, half (1.2 billion)
are in Asia; one-third (799 million) are in Africa;
and 11 percent (267 million) are in Latin America
and the Caribbean. The fig ure also illustrates the
difference across regions in the distribution of
the population by food-insecurit y severit y level.
For example, in addition to being the region with »
| 16 |
THE STATE OF FOOD SECURITY AND NUTRITION IN THE WORLD 2021
TABLE 3 PREVALENCE OF FOOD INSECURITY AT SEVERE LEVEL ONLY, AND AT MODERATE OR SEVERE LEVEL,
BASED ON THE FOOD INSECURITY EXPERIENCE SCALE, 2014–2020
Prevalence of severe
food insecurity (%)
Prevalence of moderate or severe
food insecurity (%)
2014
2015
2016
2017
2018
2019
2020
2014
2015
2016
2017
2018
2019
2020
WORLD
8.3
8.1
8.3
8.7
9.6
10.1
11.9
22.6
22.8
23.6
24.9
25.9
26.6
30.4
AFRICA
17.7
18.3
19.8
20.5
20.6
21.9
25.9
47.3
48.0
50.9
52.5
52.7
54.2
59.6
Northern Africa
10.2
9.0
10.4
10.6
9.3
8.8
9.5
29.7
26.4
30.0
33.1
31.1
28.9
30.2
Sub-Saharan Africa
19.4
20.4
22.0
22.7
23.2
24.9
29.5
51.4
53.0
55.8
57.0
57.6
59.9
66.2
Eastern Africa
23.7
24.1
25.8
25.3
25.0
26.0
28.7
57.7
58.1
62.2
62.1
61.6
63.4
65.3
n.a.
n.a.
n.a.
n.a.
n.a.
n.a.
35.8
n.a.
n.a.
n.a.
n.a.
n.a.
n.a.
70.0
Southern Africa
18.9
18.9
19.0
19.0
19.1
19.2
22.7
43.8
43.9
44.0
44.1
44.2
44.3
49.7
Western Africa
Middle Africa
8.6
10.8
12.9
15.3
16.8
19.6
28.8
39.2
42.8
45.5
48.7
50.6
54.2
68.3
ASIA
7.7
7.2
6.9
7.2
8.6
9.0
10.2
19.1
18.8
18.9
20.3
22.2
22.7
25.8
Central Asia
1.6
1.4
2.0
2.8
2.2
2.3
4.7
8.5
9.1
10.0
13.9
13.6
13.2
18.0
Eastern Asia
0.8
0.8
1.5
1.7
1.9
1.3
2.0
6.0
5.9
6.3
10.0
9.6
7.4
7.8
2.4
2.2
2.5
2.9
2.6
2.6
3.3
15.4
15.3
17.0
17.8
17.3
16.8
18.8
Southern Asia
South-eastern Asia
15.9
14.8
13.1
13.3
16.9
18.3
19.9
31.6
30.8
30.1
29.4
34.6
37.6
43.8
Western Asia
8.2
8.5
8.6
9.6
9.2
8.8
8.9
27.5
27.4
26.3
28.2
27.5
27.9
28.3
Western Asia and
Northern Africa
9.1
8.8
9.4
10.1
9.2
8.8
9.2
28.5
27.0
28.0
30.5
29.2
28.3
29.2
LATIN AMERICA AND
THE CARIBBEAN
7.7
7.5
9.0
10.0
9.6
10.1
14.2
24.9
27.5
31.3
33.2
31.7
31.9
40.9
Caribbean
n.a.
n.a.
n.a.
n.a.
n.a.
n.a.
39.2
n.a.
n.a.
n.a.
n.a.
n.a.
n.a.
71.3
Latin America
5.7
5.6
7.2
8.1
7.6
8.2
12.4
22.0
24.9
28.8
31.0
29.2
29.6
38.7
Central America
6.5
6.7
6.2
6.3
6.9
7.3
11.2
30.2
30.3
27.5
27.9
27.3
28.2
37.5
South America
5.4
5.1
7.6
8.9
7.9
8.6
12.9
18.7
22.7
29.4
32.2
29.9
30.1
39.2
OCEANIA
2.5
2.6
3.3
4.1
3.7
3.8
2.6
11.4
10.0
11.9
14.4
13.1
13.6
12.0
NORTHERN AMERICA
AND EUROPE
1.4
1.4
1.3
1.2
1.0
1.0
1.4
9.3
9.3
8.7
8.4
7.6
7.7
8.8
Europe
1.5
1.6
1.4
1.4
1.0
1.2
1.7
8.7
8.8
8.6
8.3
7.4
7.7
9.3
Eastern Europe
1.4
1.5
1.5
1.1
0.9
1.3
2.2
10.2
11.7
11.7
10.3
9.1
10.4
14.8
Northern Europe
1.8
1.8
1.7
2.2
1.0
0.9
1.2
6.7
6.8
6.6
6.0
5.5
5.1
4.1
Southern Europe
1.8
1.6
1.6
2.0
1.6
1.6
2.3
11.2
9.6
8.8
10.6
9.0
8.7
9.2
Western Europe
1.4
1.4
0.9
0.9
0.8
0.7
0.8
5.7
5.0
4.9
4.6
4.5
4.3
3.9
Northern America
1.0
1.0
1.0
0.8
0.8
0.8
0.8
10.5
10.3
9.0
8.6
8.0
7.6
7.8
NOTES: n.a. = not available, as data are available only for a limited number of countries, representing less than 50 percent of the population in the
region. The estimates for Latin America and the Caribbean from 2014 to 2019 include Caribbean countries whose combined populations represent
only 30 percent of the population of that subregion, while the 2020 estimates include Caribbean countries whose combined populations
represent around 60 percent of the population of the subregion. The countries included in the 2020 estimate for the Caribbean subregion are:
Dominican Republic, Grenada, Haiti, Jamaica, Saint Lucia, and Saint Vincent and the Grenadines.
SOURCE: FAO.
| 17 |
CHAPTER 2 FOOD SECURITY AND NUTRITION AROUND THE WORLD
TABLE 4 NUMBER OF PEOPLE EXPERIENCING FOOD INSECURITY AT SEVERE LEVEL ONLY, AND AT MODERATE
OR SEVERE LEVEL, BASED ON THE FOOD INSECURITY EXPERIENCE SCALE, 2014–2020
Number of severely food insecure people
(millions)
2014
2015
2016
2017
2018
WORLD
604.5 598.4
620.2
656.8
731.3 779.9
927.6 1 645.5 1 680.1 1 762.9 1 881.6 1 978.7 2 049.9 2 368.2
AFRICA
203.5 215.9
240.1
254.7
262.9 286.7
346.6
545.0
567.2
617.8
653.3
671.8
708.6
798.8
23.7
24.6
23.4
65.1
59.1
68.6
77.0
73.7
69.8
74.5
230.1 241.0 265.5 323.2
479.8
508.1
549.2
576.3
598.1
638.8
724.4
104.2 105.6 113.0 127.9
218.7
226.3
248.9
255.4
260.5
275.0
290.9
Northern
Africa
Sub-Saharan
Africa
Eastern
Africa
Middle
Africa
Southern
Africa
Western
Africa
ASIA
22.4
20.2
181.0 195.7 216.5
89.9
94.0 103.2
22.0
2019
Number of moderately or severely food insecure people
(millions)
21.2
2020
2014
2015
2016
2017
2018
2019
2020
n.a.
n.a.
n.a.
n.a.
n.a.
n.a.
64.3
n.a.
n.a.
n.a.
n.a.
n.a.
n.a.
125.7
11.7
11.9
12.1
12.3
12.6
12.8
15.3
27.2
27.7
28.1
28.6
29.0
29.5
33.5
29.6
38.0
46.8
56.9
63.9
76.7 115.7
134.0
150.5
164.4
180.7
192.8
212.0
274.3
337.2 319.9
918.2 1 014.0 1 043.2 1 198.7
308.0
323.7
471.1
840.1
834.6
846.8
Central Asia
1.1
1.0
1.4
2.0
1.6
1.6
3.5
5.7
6.3
7.0
9.9
9.8
9.6
13.4
Eastern Asia
13.2
12.6
24.6
28.4
31.3
21.7
33.8
98.0
97.1
104.1
166.2
159.5
124.6
130.8
South-eastern
Asia
15.2
13.6
16.1
18.5
17.1
16.9
22.1
96.3
96.8
109.1
115.5
113.6
111.0
125.5
249.1 319.5 350.3 386.8
570.6
563.8
557.7
551.3
656.5
721.4
849.8
Southern Asia 287.2 270.7 243.3
394.5 414.7
Western Asia
20.7
22.0
22.7
25.7
24.9
24.2
24.9
69.6
70.7
69.0
75.2
74.5
76.7
79.2
Western Asia
and Northern
Africa
43.1
42.2
46.4
50.3
46.9
45.4
48.3
134.7
129.8
137.5
152.2
148.2
146.5
153.6
LATIN
AMERICA
AND THE
CARIBBEAN
47.6
46.6
56.6
63.6
61.7
65.3
92.8
153.8
171.8
197.0
211.2
203.3
207.0
267.2
Caribbean
n.a.
n.a.
n.a.
n.a.
n.a.
n.a.
17.0
n.a.
n.a.
n.a.
n.a.
n.a.
n.a.
31.0
33.1
32.3
42.0
48.3
45.4
49.7
75.8
126.5
145.0
169.2
183.6
174.7
178.8
236.1
10.9
11.3
10.5
10.9
12.1
13.0
20.2
50.3
51.2
47.0
48.3
47.9
50.0
67.4
22.2
21.0
31.5
37.3
33.3
36.7
55.6
76.2
93.8
122.2
135.3
126.8
128.8
168.7
1.0
1.1
1.3
1.7
1.5
1.6
1.1
4.5
4.0
4.8
5.9
5.5
5.7
5.1
NORTHERN
AMERICA
AND EUROPE
15.2
15.0
14.1
13.2
10.7
11.6
15.9
102.1
102.5
96.4
93.0
84.2
85.4
98.3
Europe
11.4
11.6
10.4
10.4
7.7
8.7
12.8
64.9
65.7
64.2
61.9
55.0
57.4
69.5
4.1
4.5
4.3
3.2
2.6
3.8
6.3
29.9
34.4
34.4
30.4
26.8
30.4
43.3
1.8
1.9
1.8
2.3
1.1
1.0
1.3
6.9
7.0
6.8
6.3
5.8
5.4
4.4
2.8
2.5
2.5
3.1
2.5
2.4
3.6
17.1
14.7
13.5
16.2
13.8
13.3
14.1
2.8
2.7
1.8
1.8
1.5
1.4
1.6
10.9
9.7
9.5
8.9
8.8
8.4
7.7
3.7
3.4
3.8
2.8
3.0
3.0
3.1
37.2
36.8
32.2
31.1
29.1
27.9
28.9
Latin America
Central
America
South
America
OCEANIA
Eastern
Europe
Northern
Europe
Southern
Europe
Western
Europe
Northern
America
NOTES: n.a. = not available, as data are available only for a limited number of countries, representing less than 50 percent of the population in the
region. The estimates for Latin America and the Caribbean from 2014 to 2019 include Caribbean countries whose combined populations represent
only 30 percent of the population of that subregion, while the 2020 estimates include Caribbean countries whose combined populations
represent around 60 percent of the population of the subregion. The countries included in the 2020 estimate for the Caribbean subregion are:
Dominican Republic, Grenada, Haiti, Jamaica, Saint Lucia, and Saint Vincent and the Grenadines.
SOURCE: FAO.
| 18 |
THE STATE OF FOOD SECURITY AND NUTRITION IN THE WORLD 2021
FIGURE 4 MODERATE OR SEVERE FOOD INSECURITY HAS BEEN CLIMBING SLOWLY FOR SIX YEARS AND
NOW AFFECTS MORE THAN 30 PERCENT OF THE WORLD POPULATION
70
59.6
60
50.9
50
52.7
54.2
47.3
40.9
PERCENTAGE
33.7
40
31.1
30.4
30
25.9
22.6
32.3
31.3
29.6
26.6
25.8
23.6
22.2
19.1
18.5
20
14.3
15.3
16.3
8.3
9.6
10.1
19.8
20.6
21.9
25.9
11.5
22.0
21.9
17.2
12.0
11.9
7.7
13.7
31.9
26.7
22.3
13.6
31.7
24.9
18.9
15.7
17.7
8.3
22.7
16.5
10
0
32.0
8.6
6.9
9.0
10.2
14.2
7.7
9.0
9.6
10.1
9.3
8.7
7.9
1.4
8.8
7.6
7.7
7.5
6.6
6.6
7.4
1.3
1.0
1.0
1.4
2014 2016 2018 2019 2020 2014 2016 2018 2019 2020 2014 2016 2018 2019 2020 2014 2016 2018 2019 2020 2014 2016 2018 2019 2020
WORLD
Severe food insecurity
AFRICA
ASIA
LATIN AMERICA
AND THE CARIBBEAN
NORTHERN AMERICA
AND EUROPE
Moderate food insecurity
NOTE: Differences in totals are due to rounding of figures to the nearest decimal point.
SOURCE: FAO.
» the highest overall prevalence of food insecurit y,
in those two subregions mirrored the same
trends, increasing sharply in Western Africa from
19.6 to 28.8 percent during 2019–2020, but much
less so in Eastern Africa, from 26 to 28.7 percent.
Moderate increases were seen in Southern Africa,
where the prevalence of moderate or severe food
insecurit y rose from 44.3 to 49.7 percent, and
severe food insecurit y increased from 19.2 to
22.7 percent. Much smaller increases of around
1 percentage point were obser ved in Northern
Africa, where 30.2 percent of the population was
affected by moderate or severe food insecurit y in
2020, about one-third of whom were facing severe
food insecurit y (9.5 percent of the population).
Africa is also the region where severe levels
represent the largest share of the combined
total of moderate plus severe food insecurit y –
43 percent, compared with 39 percent in Asia and
35 percent in Latin America and the Caribbean.
In Northern America and Europe, the proportion
of food insecurit y experienced at severe levels is
much smaller.
Within the regions, there are important
differences in food insecurit y at subregional
level ( Table 3). In Africa, moderate or severe
food insecurit y increased significantly in the
Western subregion, from 54.2 percent in 2019
to 68.3 percent in 2020, surpassing the level
obser ved in Eastern Africa (65.3 percent) where
the increase was smaller. Severe food insecurit y
In Asia, the largest increases occurred in the
Southern subregion, where moderate or severe
food insecurit y jumped from 37.6 percent in
| 19 |
CHAPTER 2 FOOD SECURITY AND NUTRITION AROUND THE WORLD
FIGURE 5 THE CONCENTRATION AND DISTRIBUTION OF FOOD INSECURITY BY SEVERITY DIFFERS GREATLY
ACROSS THE REGIONS OF THE WORLD
NUMBER (MILLIONS) IN 2020
Total population
7 794 million
Total population
4 641 million
Total population
1 341 million
2 368
928
WORLD
1 199
471
799
ASIA
Total population
347
AFRICA
Moderate or severe food insecurity
Total population
1 117 million
98
16
NORTHERN AMERICA
AND EUROPE
Total population
654 million
267
93
LATIN AMERICA
AND THE CARIBBEAN
Severe food insecurity
SOURCE: FAO.
Marked increases in food insecurit y were
obser ved in most subregions of Latin America
and the Caribbean. In Central and South America,
less than 40 percent of the population is facing
moderate or severe food insecurit y, and levels
of severe food insecurit y are 11 and 13 percent,
respectively. However, both subregions registered
9-point increases in moderate or severe food
insecurit y, and 4-point increases in severe food
insecurit y, in 2020. In the Caribbean subregion, d
for which estimates are being reported this year
for the first time, the prevalence of moderate or
severe food insecurit y was 71.3 percent in 2020 –
nearly three-quarters of the population. Of those,
more than half faced severe food insecurit y –
39 percent of the population.
2019 to 43.8 percent in 2020. There was already
a notable increase in this subregion since
2017 when the prevalence was 29.4 percent.
Severe food insecurit y also rose in Southern
Asia in one year, from 18.3 percent to nearly
19.9 percent. There was a small increase in
moderate or severe food insecurit y in Western
Asia, which has the second highest prevalence
of food insecurit y in the region – 28.3 percent in
2020. A small increase in severe food insecurit y
was also obser ved, from 8.8 percent in 2019 to
8.9 percent in 2020. Relatively large increases
in food insecurit y were obser ved from 2019 to
2020 in Central Asia, from 13.2 to 18 percent for
moderate or severe, and 2.3 to 4.7 percent for
severe only. Despite the increase, the subregion is
second only to Eastern Asia in having the lowest
food insecurit y rates in the region, followed by
South-eastern Asia. It is worth noting that the
prevalence of moderate or severe food insecurit y
in Eastern Asia is below the average for Northern
America and Europe.
d Estimates are being reported for the first time for the Caribbean
subregion, as FIES data became available in 2020 for enough countries
to achieve 50 percent of population coverage in the subregion. The
countries included in the 2020 estimate for the Caribbean subregion
are: Dominican Republic, Grenada, Haiti, Jamaica, Saint Lucia, and
Saint Vincent and the Grenadines.
| 20 |
THE STATE OF FOOD SECURITY AND NUTRITION IN THE WORLD 2021
The lowest levels of food insecurit y in Northern
America and Europe – and in the world – are
found in Northern and Western Europe, where
about 4 percent of the population is affected
by moderate or severe food insecurit y. In fact,
moderate or severe food insecurit y declined
slightly in these subregions in 2020. In Northern
America and Southern Europe, however,
moderate or severe food insecurit y rose slightly
from 2019 to 2020, reaching 7.8 and 9.2 percent,
respectively. A notable rise in moderate or severe
food insecurit y was obser ved in Eastern Europe
in the same period, from 10.4 to 14.8 percent.
Severe food insecurit y has remained low in
all subregions, with increases from 2019 to
2020 in all but Northern America. The largest
increases occurred in Eastern Europe (from 1.3 to
2.2 percent) and Southern Europe (from 1.6 to
2.3 percent).
COV ID-19 pandemic on employment and
income were included in the same 2020 GWP
as the FIES module, providing the opportunit y
to explore the relationship between food
insecurity severity and income loss induced by
the COVID-19 crisis. Respondents were asked
whether, due to the COV ID-19 situation, they
had: 1) temporarily stopped working at their
job or business; 2) lost their job or business;
3) worked less hours at their job or business;
and 4) received less money than usual from
their employer or business. As expected, results
of the analysis e point to a higher likelihood of
being food insecure among respondents whose
employment and income had been negatively
impacted by the COV ID-19 pandemic. Loss of
job or business had the strongest negative
effect on food securit y status, followed by
receiving less money and temporar y work
disruptions (32, 20 and 19 percent higher odds
of being moderately or severely food insecure,
respectively).
Towards an assessment of the impact of the
COVID-19 crisis on food security
In summar y, the estimates based on the FIES
point to a worse food securit y situation in
2020 compared with 2019 in most parts of the
world. There is little doubt that the COV ID-19
pandemic contributed to this deterioration of
people’s access to food. As mentioned in Box 3, a
modified version of the FIES sur vey module was
used in the GWP data collection to tr y to assess
the impact of the COV ID-19 pandemic on food
securit y. On average, approximately 60 percent
of respondents experiencing food insecurit y
at moderate or severe level, and 55 percent at
severe level, attributed their poor access to food
mainly to the COV ID-19 pandemic. However, it
is challeng ing to isolate and measure the impact
of the pandemic alone on food insecurit y,
g iven the way it has exacerbated pre-existing
v ulnerabilities and affected so many aspects
of people’s lives. Therefore, the results should
not be interpreted as referring to the isolated
impact of the COV ID-19 pandemic on food
insecurit y, but rather as an indication that
people perceive it as being an important factor
in their diminished access to food.
The effect was stronger for moderate or severe
food insecurit y than it was for severe food
insecurit y. Moreover, the higher the income
of the respondent, the less food securit y was
affected by the impacts of the COV ID-19
pandemic on employment. These findings
may ref lect a strong negative impact of the
pandemic on the food securit y of those in the
middle-income range who normally count
on stable employment, offering hope of rapid
improvement in food securit y once people are
able to resume normal work activities.
Gender differences in food insecurity
The individual-referenced questions that
constitute the FIES sur vey module also enable a
comparison between the food insecurit y status
of men and women. Figure 6 shows the prevalence
of food insecurit y at different levels of severit y
among adult men and women worldwide and
in all regions, highlighting the evolution from
2014 to 2020. At the global level, the gender
gap in the prevalence of moderate or severe
Another way to explore the impacts of the
COV ID-19 pandemic on food securit y is
to examine the effects on specific drivers
of food insecurit y, such as loss of income.
Questions related to the impacts of the
e The analysis was performed through a fixed effect regression model,
using food insecurity status as outcome variable and responses to the
four questions about the pandemic’s impact on employment and
income as explanatory variables. Education, employment status,
gender, urban/rural area and world region were considered as controls.
See Annex 2 for more details.
| 21 |
CHAPTER 2 FOOD SECURITY AND NUTRITION AROUND THE WORLD
FIGURE 6 GLOBALLY AND IN EVERY REGION, THE PREVALENCE OF FOOD INSECURITY IS HIGHER AMONG
WOMEN THAN MEN
60
50
PERCENTAGE
40
30
20
10
0
2014
2016
2018
2020 2014
WORLD
Men − moderate or severe
food insecurity
2016
2018
2020 2014
2016
AFRICA
2018
ASIA
Men − severe
food insecurity
2020 2014
2016
2018
LATIN AMERICA
AND THE CARIBBEAN
Women − moderate or severe
food insecurity
2020 2014
2016
2018
2020
NORTHERN AMERICA
AND EUROPE
Women − severe
food insecurity
NOTE: The shaded area represents the margins of error around the estimates.
SOURCE: FAO.
the prevalence is also higher among women
than men. The difference increased from
2019 to 2020, with women being 11 percent
more food insecure than men in 2020 versus
9 percent more than men in 2019. Thus, the
widening of the gap between men and women
at the global level in a year impacted by the
COV ID-19 pandemic was more pronounced for
moderate or severe food insecurit y.
food insecurit y grew even larger during the
year the COV ID-19 pandemic spread across
the world, with the prevalence of moderate or
severe food insecurit y being 10 percent higher
among women than men in 2020, compared
with 6 percent in 2019. This is mostly due to the
widening of the gap in Latin America and the
Caribbean (30 percent in 2020 versus 24 percent
in 2019) and Asia (10 percent in 2020 versus
4 percent in 2019). For severe food insecurit y,
| 22 |
»
BOX 4 USING THE FIES TO GUIDE AND TARGET
RESPONSES
TOSECURITY
THE COVID-19
PANDEMICIN THE WORLD 2021
THE STATE
OF FOOD
AND NUTRITION
AT SUBNATIONAL LEVEL
The full potential of the FIES to generate information
to guide policies is realized when applied in large
national surveys that allow more detailed analyses
of the food insecurity situation at subnational level.
The surveys described in this box were conducted to
provide food insecurity assessments useful to inform
the planning of responses to the COVID-19 pandemic
in 20 countries facing food insecurity crises, in
addition to computing SDG Indicator 2.1.2.17
Between October 2020 and January 2021, FIES
data were collected in the following 20 countries:
Afghanistan, Burkina Faso, Cameroon, Central
African Republic, Chad, Democratic Republic
of the Congo, El Salvador, Ethiopia, Guatemala,
Haiti, Iraq, Liberia, Mozambique, Myanmar, Niger,
Nigeria, Sierra Leone, Somalia, South Africa
and Zimbabwe. The surveys were conducted via
mobile telephone with samples intended to be
representative at the national level as well as the
first subnational administrative unit (admin-1) level.
Approximately 200 interviews were conducted in
each admin-1 area, resulting in samples ranging
from slightly more than 1 000 to more than 8 300
across the 20 countries. A stand-alone FIES module
was used with adaptations included to assess the
degree to which the COVID-19 pandemic may have
exacerbated food insecurity.19 Post-hoc adjustments
were applied to the sample data to control for the
potential bias that might have arisen due to the
relatively low mobile telephone penetration in some
of the countries surveyed (see Box 3).
Results show that there was an increase in the
prevalence of food insecurity in most countries
for which previous assessments are available
for comparison (Figure A). The increases were, on
average, of about 10 percentage points for moderate
or severe food insecurity and 5 percentage points for
severe food insecurity.
FIGURE A FOOD INSECURITY IN 2020 COMPARED WITH 2019 (OR LAST AVAILABLE YEAR)
IN COUNTRIES FACING FOOD INSECURITY CRISES
100
90
80
PERCENTAGE
70
Moderate or
severe food
insecurity
60
50
40
100
30
90
20
80
PERCENTAGE
10
70
0
60
50err
Si
40
e
aL
on
e
Ce
Ha
nt
r
A
al
iti
fri
ca
e
nR
pu
b li
c
L ib
er
ia
So
ma
lia
Zim
ba
bw
e
Ni
ge
r
Mo
m
za
30
biq
ue
Ni
ge
r ia
Ch
ad
Af
De
mo
a
cr
tic
a
gh
Re
nis
b
pu
ta
n
li c
of
e
th
Co
ng
o
a
Gu
te
ma
la
Bu
in
rk
as
aF
o
m
Ca
er
oo
n
E
a
lS
l va
do
r
Et
hio
pia
So
h
ut
Af
r ic
a
Ir a
q
My
an
ma
r
Severe food
insecurity
Moderate or
severe food
insecurity
20
10
Statistically significant increase
No statistically significant change
No assessment for comparison
Severe food
insecurity
SOURCE: FAO.
0
i
r
r
r
e
e
e
q
ia
ia
it
a
o
so
li c
lia
ca
go
an
ad
on
r ia
ala
ge
on
er
Ir a
bw
iqu
ad
ro
fri
Fa
Ha
iop
ub
on
is t
ge
nm
Ch
Ni at the
ma sample
em
and
The representativeness
Le
ba
Lib ofSothe
th to help
Ni
ep
an
alv tool
ya
mb admin-1
na a powerful
me
h A policymakers
e C constitute
at
i
E
m
t
ra
a
h
S
R
a
i
h
M
u
k
r
z
l
u
g
t
C
Z
G
E
ur
an
Af
So which provinces or
Sie enabled
of
programme
planners
visualize
level
Mo of the
B
c
rf ic a more detailed assessment
li
lA
ub
regions are most in need and, therefore, should be
food insecurity
situation in the countries surveyed.
ra
ep
nt
R
e
ic
C
at
targeted for interventions aimed at guaranteeing the
Maps illustrating
the geographical distribution of
r
oc
right to adequate food.
food insecurity, like the ones below for AfghanistanDem
and the Democratic Republic of the Congo (Figure B),
Statistically significant increase
No statistically significant change
| 23 |
No assessment for comparison
CHAPTER 2 FOOD SECURITY AND NUTRITION AROUND THE WORLD
BOX 4 (CONTINUED)
FIGURE B PREVALENCE OF MODERATE OR SEVERE FOOD INSECURITY IN AFGHANISTAN
AND THE DEMOCRATIC REPUBLIC OF THE CONGO BY PROVINCE IN 2020
AFGHANISTAN
Jawzjan
Takhar
Samangan
Faryab
Badakhshan
Kunduz
Balkh
Baghlan
Sar-e-Pul
Badghes
Bamyan
Ghazni
Paktya
Kunarha
Nangarhar
Logar
Daykundi
Nuristan
Laghman
Kabul
Maydanwardag
Ghor
Hirat
Panjsher
Kapisa
Parwan
Khost
Uruzgan
Farah
DEMOCRATIC REPUBLIC
OF THE CONGO
Pakteka
Zabul
Hilmand
Kandahar
Nemroz
Nord-Ubangi
Bas-Uélé
Haut-Uélé
Sud-Ubangi
Mongala
Ituri
Tshopo
Équateur
Nord-Kivu
Tshuapa
Mai-Ndombe
Sankuru
Maniema
Sud-Kivu
Kinshasa
Kwilu
Kongo Central
Kasaï
Kasaï-Central
Kasaï
Oriental
Lomami
Tanganyika
Kwango
Haut-Lomami
Prevalence of moderate or severe
food insecurity
10–20%
20–30%
30–40%
40–50%
50–60%
60–70%
70–80%
80–90%
90–100%
Lualaba
Haut-Katanga
NOTE: The boundaries and names shown and the designations used on these map(s) do not imply the expression of any opinion whatsoever on the part of
FAO concerning the legal status of any country, territory, city or area or of its authorities, or concerning the delimitation of its frontiers and boundaries.
SOURCE: FAO.
| 24 |
THE STATE OF FOOD SECURITY AND NUTRITION IN THE WORLD 2021
» Historically, women tend to be disproportionally
10 percent of total energ y intake from free sugars
(preferably less than 5 percent); consumption of
at least 400 g of fruits and vegetables per day;
and less than 5 g per day of salt (to be iodized).
While the exact make-up of a healthy diet varies
depending on individual characteristics, as well
as cultural context, locally available foods and
dietary customs, the basic principles of what
constitutes a healthy diet are the same. 22,23
affected by health and economic crises in a
number of areas, including but not limited to
food securit y and nutrition, health, time burden,
and productive and economic dimensions.
The results of this analysis support existing
evidence of the disproportionate impact of the
pandemic on women’s economic opportunities
and access to nutritious foods. 20
Affordability of healthy diets: a link
between food security and nutritional
outcomes
Healthy diets can also play an important
role in increasing the sustainabilit y of food
systems. As shown in the 2020 edition of this
report, shifting to healthy diets that include
sustainabilit y considerations g can contribute
to reducing health and climate change costs
by 2030, because the hidden costs of these
diets are lower compared with those of current
consumption patterns. The adoption of healthy
diets is projected to lead to a reduction of up to
97 percent in direct and indirect health costs and
41– 47 percent in the social costs of greenhouse
gas emissions (GHG) in 2030. 7
The cost and affordabilit y of healthy diets are
important determinants of a person’s food
choices, and ultimately, of their food securit y,
nutrition and health. 7,21 Cost refers to what
people have to pay to secure a healthy diet,
while affordabilit y refers to the cost relative
to a person’s income, minus other required
expenses. f Tracking the cost and the number of
people who cannot afford a healthy diet provides
valuable metrics to better understand the link
between these important determinants of access
to food and the trends in the multiple forms
of malnutrition described in the next section.
More importantly, they can be used to inform a
wide range of policies and programmes at the
global, national and subnational levels.
Estimates of the cost and affordabilit y of healthy
diets around the world in 2017, by region and
income group, were first presented in last year’s
edition of this report. 7 This year, the estimates
were updated to 2019 using the latest available
data to monitor the progress towards ensuring
affordable, healthy diets for all. While the price
and income distribution data needed to update
the estimates to 2020 are not yet available,
trends in consumer food prices and incomes are
discussed with likely implications for the cost
and affordabilit y of healthy diets in 2020 and into
2021. For a full description of the methodolog y
and data sources, see Annex 2.
According to WHO, healthy diets protect
against malnutrition in all its forms, including
non-communicable diseases (NCDs) such as
diabetes, heart disease, stroke and cancer.
Healthy diets contain a balanced, diverse and
appropriate selection of foods eaten over a period
of time. In addition, a healthy diet ensures that a
person’s needs for macronutrients (proteins, fats
and carbohydrates, including dietary fibre) and
essential micronutrients (vitamins and minerals)
are met, specific to their gender, age, physical
activity level and physiological state. Healthy diets
include less than 30 percent of total energ y intake
from fats, with a shift in fat consumption away
from saturated fats to unsaturated fats and the
elimination of industrial trans fats; less than
Cost of healthy diets
As seen in last year’s edition of this report,
the cost of a diet increases as the diet qualit y
increases, across all regions and countr y
income groups. That analysis was based on
three reference diets that simulate incremental
levels of diet qualit y, starting from an “energ y
g Healthy diets that include sustainability considerations are diets that
are not only optimized for health, but also include environmental
sustainability considerations. Not all healthy diets are sustainable and
not all diets designed for sustainability are always healthy or adequate
for all population groups. See the 2020 edition of this report for a full
discussion and analysis.7
f In this report, the cost of a diet refers to the sum of the value of all
the least expensive food items needed to reach a given level of diet
quality. The value, in turn, is the price per unit for each food item
multiplied by the quantity of the food item.
| 25 |
CHAPTER 2 FOOD SECURITY AND NUTRITION AROUND THE WORLD
sufficient”, to a “nutrient adequate” diet and
then a “healthy” diet. 8 On average, the cost of a
healthy diet was 60 percent more than a diet that
just meets requirements for essential nutrients,
and almost five times as much as a diet that
just meets the minimum dietar y energ y needs
through a starchy staple.
of a diet relative to income, changes over time
can be the result of changes in the cost of a diet,
people’s income, or both. Rising food costs,
if not matched by rising income, could result
in more people being unable to afford healthy
diets. Moreover, wider problems in the economy,
such as economic slowdowns and downturns
that lead to increases in unemployment and
declines in wages, could result in more people
finding healthy diets unaffordable, irrespective
of price trends.
Updated results indicate that in 2019, at the
global level, the cost of a healthy diet was
USD 4.04 per person per day. However, the
average cost of the diet and the change in the
cost between 2017 and 2019 varies by region and
countr y income group ( Table 5).
As a result of the high cost of healthy diets,
coupled with persistent high levels of income
inequality, it is estimated that around 3 billion
people were unable to afford a healthy diet in
2019 ( Table 5). Most of these people live in Asia
(1.85 billion) and Africa (1.0 billion), although a
healthy diet is also out of reach for millions living
in Latin America and the Caribbean (113.0 million)
and Northern America and Europe (17.3 million).
The cost of a healthy diet increased by 7.9 percent
globally between 2017 and 2019, but differences are
notable across regions ( Table 5). All regions except
Africa present lower increases than the global
average. Africa had the largest increase in the cost
of a healthy diet from 2017 to 2019 – 12.9 percent. h
The second largest increases were in Northern
America and Europe and Latin America and the
Caribbean, which both had an average regional
increase of 6.8 percent. Asia registered marginal
increases of 4.1 percent. Among the subregions,
Eastern Africa had the highest increase (33 percent)
followed by South America (9.2 percent). i
The total number of people in the world who
could not afford a healthy diet in 2019 j is
slightly lower than the 2017 estimate published
in last year’s report by around 21 million. k
There are, however, important differences
across regions, with Latin America and the
Caribbean and Africa registering an increase,
while Asia, Northern America and Europe and
Oceania show a decrease. The highest increase
in the number of people who cannot afford a
healthy diet was seen in Latin America and the
Caribbean (8.4 percent), which is largely driven
by increases in South America (14.3 percent). l In
Africa, the number of people who cannot afford
a healthy diet increased by 5.4 percent between
2017 and 2019, ranging from 2.0 percent in
Southern Africa to 6.8 percent in Middle Africa. »
The analysis of the cost of a healthy diet by
countr y income group shows that the largest
increases in the cost of a healthy diet occurred in
lower-middle-income and high-income countries
(14.3 and 6.6 percent, respectively). Increases in
the cost of a healthy diet are much smaller in
low-income and upper-middle-income countries
(5.4 and 5.7 percent, respectively).
Affordability of healthy diets prior to the
COVID-19 pandemic
Affordabilit y is a key component of food
securit y and nutrition and is a measure of
economic access to food and healthy diets.
Because affordabilit y is a measure of the cost
j 2019 estimates are updated using the 2019 food CPI-inflated cost
and PovcalNet income distributions; see Annex 2 for methodology and
data sources.
k After March 2021 PovcalNet updates, sensitivity analysis was
conducted on affordability computed in 2017, using different income
distributions that showed similar results. The number reported in the
2020 edition of this report for 2017 is 3.02 billion; this number slightly
decreases to 2.97 billion if the updated 2018 income data of PovcalNet
are used, while the number is slightly higher (3.05 billion) if instead the
2017 income distribution is used. See background methods paper to
The State of Food Security and Nutrition in the World 2021 report. 302
h This increase is largely due to an increase in the cost of a healthy
diet in Zimbabwe. The percentage increase for Africa would be
4.3 percent, excluding Zimbabwe.
i The increase in Eastern Africa was largely driven by an increase in
the cost of a healthy diet in Zimbabwe; and for South America, by an
increase in Argentina. The percentage change for Eastern Africa would
be 2.7 percent, excluding Zimbabwe. The percentage change for South
America would be 5.2 percent, excluding Argentina.
l This increase is largely attributable to Argentina, which had a
49 percent increase in the cost of a healthy diet between 2017 and 2019.
| 26 |
THE STATE OF FOOD SECURITY AND NUTRITION IN THE WORLD 2021
TABLE 5 HEALTHY DIETS WERE STILL UNAFFORDABLE FOR AROUND 3 BILLION PEOPLE IN THE WORLD IN
2019. THE NUMBER OF PEOPLE UNABLE TO AFFORD HEALTHY DIETS INCREASED IN AFRICA AND IN LATIN
AMERICA AND THE CARIBBEAN BETWEEN 2017 AND 2019
People unable to afford
a healthy diet in 2019
Cost of a healthy diet in 2019
Cost
(USD per person
per day)
Change between
2017 and 2019
(percent)
WORLD
4.04
7.9
AFRICA
4.37
Northern Africa
Total number
(millions)
Change between
2017 and 2019
(percent)
41.9
3 000.5
-0.7
12.9
80.2
1 017.0
5.4
4.35
5.6
60.5
141.8
4.2
Sub-Saharan Africa
4.37
13.7
84.7
875.2
5.6
Eastern Africa
4.88
33.0
85.0
342.2
5.3
Middle Africa
3.81
2.2
87.9
152.0
6.8
Southern Africa
4.07
2.1
61.8
41.2
2.0
Western Africa
4.30
6.8
86.8
339.7
5.9
ASIA
4.13
4.1
44.0
1 852.8
-4.2
Central Asia
3.42
0.9
16.9
5.8
-22.0
Eastern Asia
4.99
6.4
13.5
213.5
-7.4
South-eastern Asia
4.41
4.9
49.5
316.1
-2.9
Southern Asia
4.12
1.2
71.3
1 281.5
-4.2
Western Asia
3.77
5.3
20.3
35.9
8.1
LATIN AMERICA AND THE CARIBBEAN
4.25
6.8
19.3
113.0
8.4
Caribbean
4.49
6.7
48.5
12.9
-1.0
Latin America
4.00
6.8
17.9
100.1
9.7
Central America
3.93
3.1
20.0
32.0
1.2
South America
4.05
9.2
17.1
68.1
14.3
OCEANIA
3.25
6.2
1.8
0.5
-14.9
NORTHERN AMERICA AND EUROPE
3.43
6.8
1.6
17.3
-3.6
Low-income
4.06
5.4
87.6
463.0
4.8
Lower-middle-income
4.49
14.3
69.5
1 953.2
-1.4
Upper-middle-income
4.20
5.7
21.1
568.5
-2.0
High-income
3.64
6.6
1.4
15.8
-9.9
Percent
COUNTRY INCOME GROUPS
NOTES: The table shows the cost and unaffordability of a healthy diet by region and country income group in 2019. The cost of a healthy diet is the
2017 USD cost per person per day (published in last year’s edition of this report), updated using FAOSTAT country-level food consumer price index
(CPI) and purchasing power parity (PPP) in 2019. Unaffordability of a healthy diet is the weighted percentage (%) and the total number (million) of
population in each region and country income group who cannot afford the diet in 2019. For country income groups, the most recent 2019 World
Bank income classification is used for both years 2017 and 2019. This implies that cost and affordability indicators shown by income groups in last
year’s edition of this report differ from this year’s edition as some countries may have changed income status between 2017 and 2019. See Annex 2
for methodology and data sources.
SOURCE: FAO.
| 27 |
CHAPTER 2 FOOD SECURITY AND NUTRITION AROUND THE WORLD
» Both Asia and Northern America and Europe, on
therefore small increases in the cost of a diet
can be significant in countries where the poor
make up a large percentage of the population.
For example, small increases in the cost of the
diet in Africa affect a larger proportion of the
population – an estimated 80 percent of the
population cannot afford a healthy diet.
the other hand, had a decrease in the number of
people who cannot afford a healthy diet between
2017 and 2019 (4.2 and 3.6 percent, respectively).
All subregions in Asia, except Western Asia,
show a decrease in the number of people who
cannot afford a healthy diet, with large decreases
in Central Asia (22 percent) m and Eastern Asia
(7.4 percent). Western Asia shows an increase
of 8.1 percent. South America experienced the
largest decrease.
The level of income inequalit y in a countr y is
also critical, as income inequalit y shapes the
impact of economic growth and deceleration
on average incomes. As shown in the 2019
edition of this report, where inequalit y is
greater, economic slowdowns and downturns
have a disproportionate effect on low-income
populations, since they use large portions of
their income to buy food. In Latin America
and the Caribbean, the combination of ver y
high income inequalit y, an economic slowdown
and downturn o and a high increase in the cost
of a healthy diet had a compounding effect,
leading to one of the highest increases in the
unaffordabilit y of a healthy diet between 2017
and 2019. In contrast, Asia, with lower levels
of income inequalit y and economic growth
during this same period, was able to offset high
increases in the cost of the diet, leading to one of
the highest improvements in affordabilit y.
The comparison of cost and affordability over time
points to the important roles of changes in income
as well as prices in determining affordability.
In Asia, the increased cost of a healthy diet
coincided with higher incomes, so that the
number of people unable to afford a healthy diet
decreased. On the other hand, Africa n was one of
the regions with the smallest increases in the cost
of a healthy diet but where the highest increase
was observed in the number of people unable
to afford one, pointing to the role of declining
incomes. Economic growth and increases in
income were lower in Africa over this period.
In comparison, the large increase in the cost of
healthy diets in Latin America and the Caribbean
coincided with a growing number of people
who were unable to afford them. This contrasts
sharply with Northern America and Europe,
which saw a similar increase in the cost of
healthy diets, but with fewer people unable to
afford them. In the case of Latin America and
the Caribbean, the increased cost of the diet was
compounded by falling incomes, resulting in a
double hit to the unaffordabilit y of healthy diets,
whereas in Northern America and Europe, the
rise in the cost was offset by rising incomes.
These findings illustrate that a broader policy
approach is needed to improve the affordabilit y
of healthy diets, one which focuses not only on
improving incomes and reducing the costs of
healthy diets, but also on addressing inequalit y
(see Chapters 3 and 4).
Affordability of healthy diets in 2020
There is no room for complacency about access
to affordable healthy diets – especially given the
emergence of the pandemic in 2020 – even in
those regions where improvements are obser ved
between 2017 and 2019. While it is not possible to
update estimates to 2020 at this time, the number
of people who cannot afford a healthy diet is
There are important dynamics at play behind
these obser ved differences related to the context
and structural features of a countr y, notably
levels of povert y and income inequalit y. The poor
spend a large proportion of their income on food,
o Latin America and the Caribbean has the highest level of income
inequality in the world, both in terms of the Gini coefficient and the ratio
between the income share of the richest and the poorest 20 percent of
the population. See Figure 34 in FAO, IFAD, UNICEF, WFP and WHO
(2019).5 The region also experienced economic slowdowns in 2017 and
2018, and downturns in 2016 and 2019. The annual percentage change
in GDP per capita was -1.4 in 2016, 0.8 in 2017, 0.6 in 2018 and
-0.1 percent in 2019. 319
m This decrease is largely driven by Kyrgyzstan, where the percentage
of the population who cannot afford a healthy diet decreased from
60 percent in 2017 to 48 percent in 2019. This was due in part to the
income needed to afford a healthy diet (i.e. accounting for 63 percent of
income spent on food), which decreased from USD 5.40 to USD 5.23.
n Excluding Zimbabwe, the percent increase for Africa would only be
4.3 percent.
| 28 |
THE STATE OF FOOD SECURITY AND NUTRITION IN THE WORLD 2021
likely to have increased due to the compounding
effects of inf lation in consumer food prices and
income losses, stemming from the economic
impacts of the COV ID-19 pandemic and the
measures put in place to contain it.
Estimates of the cost and affordabilit y of healthy
diets will be updated annually and disseminated
in this report, ref lecting the most recent data
as they become available. Once new data for
2020 are available, it will be possible to estimate
the overall economic impact of the COV ID-19
pandemic on the cost and affordabilit y of healthy
diets. Regional, subregional, national and even
subnational differences are expected, given
the different timing, duration and intensit y of
lockdowns, as well as differential impacts of
economic shocks on countries. n
By December 2020, global consumer food prices
were at their highest for any month in the last
six years, and they continued to increase into the
first quarter of 2021. Consumer food prices in
Latin America and the Caribbean, for example,
increased by 16 percent between Januar y and
December 2020, with the largest increase in
South America. p
2.2
The global economic recession that started in
2020 has extended into 2021, with record levels of
unemployment, lost livelihoods and rising poverty
levels in many countries around the world (see
Chapter 3). One study using modelled estimates q of
changes in income in 63 low- and middle-income
countries (total population of 3.5 billion) points
to a deeper affordability gap in 2020 due to the
COVID-19 pandemic, putting healthy diets even
further out of reach. 24,25 The analysis suggests
that the pandemic led to an additional 141 million
people being unable to afford a healthy diet in the
countries studied. Strikingly, the number of people
unable to afford even half the cost of a healthy diet
was also estimated to have risen from 43 percent
to 50 percent. Where the affordability gap is this
large, filling nutrient intake gaps among the most
nutritionally vulnerable during the first 1 000 days
of life, from conception to the second birthday,
should be an urgent priority, because of the severe
and lasting consequences of undernutrition early
in life.
NUTRITION
INDICATORS – LATEST
UPDATES AND
PROGRESS TOWARDS
GLOBAL NUTRITION
TARGETS
KEY MESSAGES
è Globally, malnutrition in all its forms remains a
challenge. Although it is not yet possible to fully account
for the impact of the COVID-19 pandemic due to data
limitations, in 2020, it is estimated that 22.0 percent
(149.2 million) of children under 5 years of age were
affected by stunting, 6.7 percent (45.4 million) were
suffering from wasting and 5.7 percent (38.9 million)
were affected by overweight. The actual figures,
particularly for stunting and wasting, are expected to be
higher due to the effects of the COVID-19 pandemic.
p Calculated as the annual percentage change in the consumer price
index for a country. See FAO (2020). 320
q The methodology for this study differs significantly from the methods
used to estimate the cost and affordability of the diet reported in Table 5
of this report (and therefore are not comparable). While the study uses
the 2017 cost estimates of diets from the 2020 edition of this report, the
updated cost and affordability estimates are modelled estimates, which
are derived after the authors have applied exogenous changes into
IFPRI’s global computable general equilibrium (CGE) model,
MIRAGRODEP (Modelling International Relations under Applied General
Equilibrium) model enhanced for the AGRODEP modeling consortium –
www.agrodep.org/models/library). Such changes are implemented
through a number of parameters to approximate the socio-economic
impacts of the COVID-19 pandemic resulting from health impacts,
physical distancing, restrictions on (labour) mobility, international
transport and the closure of some business activities. In this way, the
authors simulate endogenous impacts on economic growth, incomes,
employment, consumption, prices, trade and, ultimately, poverty. 25
è Most children under five years with malnutrition live
in Africa and Asia. These regions account for more than
nine out of ten of all children with stunting, more than
nine out of ten children with wasting and more than
seven out of ten children who are overweight worldwide.
è There has been some progress towards increasing
the percentage of infants 0–5 months of age who are
fed exclusively with breastmilk – 44 percent in 2019
compared with 37 percent in 2012.
| 29 |
CHAPTER 2 FOOD SECURITY AND NUTRITION AROUND THE WORLD
è Anaemia in women aged 15–49 years is now an
SDG indicator (2.2.3). Globally, 29.9 percent of women
aged 15 to 49 years are affected by anaemia; however,
the data reveal stark regional differences. In 2019,
more than 30 percent of women in Africa and Asia were
affected by anaemia, compared with only 14.6 percent
of women in Northern America and Europe.
height and weight were limited this past year
due to physical distancing measures to contain
the spread of the pandemic; only four national
sur veys with at least some field work in 2020
are ref lected in these updated estimates.
Nevertheless, some obser ved and modelled
impacts of the COV ID-19 pandemic on nutrition
are discussed at the end of this section.
è These estimates do not take into account the impact
of the COVID-19 pandemic, given the challenges it
posed for data collection in 2020. However, telephone
surveys during 2020 showed disruptions in essential
nutrition interventions and negative impacts on dietary
patterns. The modelled impact of economic shocks and
service disruptions show the pandemic’s potential to
increase all forms of malnutrition.
One in seven live births, or 20.5 million
(14.6 percent) babies globally, suffered from
low birthweight in 2015. 29 Low birthweight
newborns have a higher risk of dying in the
first 28 days after birth; those who sur vive
are more likely to suffer from stunted growth
and lower intelligence quotient (IQ), and face
increased risk of overweight and obesit y and
adult-onset chronic conditions, including
cardiovascular diseases and diabetes, later in
life. 30,31 Data show that little progress has been
made to reduce low birthweight since 2012.
New low birthweight estimates will be released
in early 2022.
è With increased momentum towards the UN Food
Systems Summit in September 2021 and the Tokyo
Nutrition for Growth Summit in December 2021, now is
the opportunity to secure concrete commitments and
plans towards eliminating all forms of malnutrition over
the second half of the UN Decade of Action on Nutrition
by 2025 and towards the 2030 SDGs.
Optimal breastfeeding practices, including
exclusive breastfeeding for the first 6 months
of life, are critical for child sur vival and the
promotion of health and of brain and motor
development. Globally, 44 percent of infants
under 6 months of age were exclusively
breastfed in 2019 – up from 37 percent in 2012.
Oceania (excluding Australia and New Zealand)
demonstrated the highest levels of exclusive
breastfeeding, at 61.3 percent. More than
two in five infants under 6 months in Africa
(43.6 percent) and Asia (45.3 percent) were
exclusively breastfed in 2019, compared with
only one in three infants in Northern America
(34.7 percent). This practice, however, varies
considerably among the subregions of Asia and
Africa. Three out of five subregions in Asia have
a higher prevalence than the global estimate.
Southern Asia has the highest prevalence,
with 57.2 percent of infants being exclusively
breastfed compared with only 22.0 percent of
infants in Eastern Asia. Similarly, in Africa, the
prevalence of exclusive breastfeeding is nearly
twice as high in Eastern Africa (60.7 percent)
compared with Southern (33.5 percent) and
Western Africa (32.3 percent). Though many
regions have demonstrated progress, two
subregions in particular have demonstrated
Global trends
This section assesses progress towards the seven
global nutrition targets. These include the six
nutrition targets endorsed by the World Health
Assembly ( W H A) in 2012 to be achieved by
2025, for which 2030 targets 26 were subsequently
proposed ( Table 6). Four out of the six indicators
were also selected to monitor progress towards
SDG Target 2.2, including anaemia in women
15 – 49 years which has been newly designated
as an SDG indicator (SDG Indicator 2.2.3). 27 The
seventh target is to halt the rise in adult obesit y,
which is part of the Global Action Plan for the
Prevention and Control of Noncommunicable
Diseases adopted by the W H A in 2013. 28
Progress towards each of the seven nutrition
targets is summarized in Figure 7. The latest
estimates do not account for the effects of the
COV ID-19 pandemic because data on nutrition
outcomes were not collected or have not yet
been fully estimated. The 2020 estimates of
childhood stunting, wasting and overweight
presented in this edition are based almost
entirely on data collected before 2020 as the
collection of household sur vey data on child
| 30 |
THE STATE OF FOOD SECURITY AND NUTRITION IN THE WORLD 2021
TABLE 6 THE GLOBAL NUTRITION TARGETS ENDORSED BY THE WORLD HEALTH ASSEMBLY AND THEIR
EXTENSION TO 2030
2025 Target
2030 Target
Stunting (SDG)
40 percent reduction in the number of
children under five who are stunted.
50 percent reduction in the number of
children under five who are stunted.
Anaemia (SDG)
50 percent reduction in anaemia in women of
reproductive age.
50 percent reduction in anaemia in women of
reproductive age.
Low birthweight
30 percent reduction in low birthweight.
30 percent reduction in low birthweight.
Childhood overweight (SDG)
No increase in childhood overweight.
Reduce and maintain childhood overweight to
less than 3 percent.
Breastfeeding
Increase the rate of exclusive breastfeeding in
the first six months up to at least 50 percent.
Increase the rate of exclusive breastfeeding in
the first six months up to at least 70 percent.
Wasting (SDG)
Reduce and maintain childhood wasting to
less than 5 percent.
Reduce and maintain childhood wasting to
less than 3 percent.
NOTE: Targets were set considering the baseline year 2012.
SOURCES: WHO & UNICEF. 2017. The extension of the 2025 Maternal, Infant and Young Child nutrition targets to 2030. Discussion paper. Geneva,
Switzerland, WHO. (also available at www.who.int/nutrition/global-target-2025/discussion-paper-extension-targets-2030.pdf).
Estimates of childhood stunting and overweight,
presented below, have been generated using
a new countr y-level model (see Annex 1B for
details). However, as mentioned above, the full
impact of the COV ID-19 pandemic on child
malnutrition is still unfolding and is not captured
in the 2020 estimates.
stunting prevalence declining by nearly half,
from 26.1 percent in 2000 to 13.4 percent in
2020. Progress on stunting has been slower in
Africa, declining from 41.5 percent in 2000 to
30.7 percent in 2020 (only a 26 percent decline in
relative terms); the slower decline in prevalence
combined with population increases make it the
only region where the number of children with
stunting has increased since 2000. Some African
subregions have shown slower progress.
For example, Middle Africa and Southern Africa
have decreased their stunting prevalence by less
than 20 percent, in relative terms, since 2000.
Globally, 149.2 million (22.0 percent) children
under the age of five years suffered from
stunting (SDG Indicator 2.2.1) in 2020. 32
Stunting (defined as being too short for one’s
age) undermines children’s physical growth
and cognitive development and increases their
risk of dying from common infections. It is also
associated with increased risk of developing
NCDs later in life. The prevalence of stunting
has decreased from 33.1 percent in 2000 to
26.2 percent in 2012 and further to 22.0 percent
in 2020. In 2020, nearly three-quarters of the
world’s stunted children lived in just two regions:
Central and Southern Asia (37 percent) and
sub-Saharan Africa (37 percent). Eastern Asia
and South-eastern Asia have made the greatest
progress over the past two decades, with
Child wasting (part of SDG Indicator 2.2.2)
is a life-threatening condition resulting from
poor nutrient intake and frequent or prolonged
illnesses. Affected children are dangerously thin,
have weakened immunity and face an increased
acute risk of death. In 2020, 32 45.4 million children
under five years (6.7 percent) were wasted.
Nearly one-quarter lived in sub-Saharan Africa
and more than half lived in Southern Asia, the
subregion with the highest prevalence of wasting –
above 14 percent. This form of malnutrition is
the most impacted by the COVID-19 pandemic
in the short term, as it is an acute condition
with potential to manifest quickly in the face of
shocks. The pandemic has likely shifted the global
prevalence even further from the global targets.
As mentioned above, the estimate of 45.4 million »
worr ying declines in exclusive breastfeeding
prevalence, with levels decreasing from
29.7 percent to 25.9 percent in the Caribbean and
from 28.5 percent to 22.0 percent in Eastern Asia
between 2012 and 2019.
| 31 |
CHAPTER 2 FOOD SECURITY AND NUTRITION AROUND THE WORLD
FIGURE 7 REACHING THE 2025 AND 2030 GLOBAL NUTRITION TARGETS REMAINS A CHALLENGE. IN 2020,
AN ESTIMATED 22 PERCENT OF CHILDREN UNDER 5 YEARS OF AGE WERE AFFECTED BY STUNTING,
6.7 PERCENT BY WASTING AND 5.7 PERCENT BY OVERWEIGHT. NEARLY 30 PERCENT OF WOMEN AGED
15 TO 49 YEARS WERE AFFECTED BY ANAEMIA IN 2019
70.0
70
60
50.0
50
PERCENTAGE
44.0
40
37.0
28.5
30
29.9
26.2
22.0
15.4
14.3 14.3
12.8
10.5 10.5
10
6.7
5.0
3.0
5.6
5.6 5.7
11.8
13.1 11.8
2016
15.0 14.6
2012
20
3.0
Low
birthweight
Exclusive
breastfeeding
2025
2030
2025
2019
2012
2030
2025
Stunting
Wasting
Overweight
Anaemia
Obesity
(under 5 years)
(under 5 years)
(under 5 years)
(women of
reproductive age)
(adults)
(< 6 months)
2025 WHA Global Nutrition Targets
2020
2012
2030
2025
2020
2030
2025
2020
2012
2030
2025
2019
2012
2030
2025
2015
2012
0
2025 targets extended to 2030
to be aligned with the SDG timeline
NOTES: The potential impact of the COVID-19 pandemic is not reflected in the estimates. Wasting is an acute condition that can change frequently and
rapidly over the course of a calendar year. This makes it difficult to generate reliable trends over time with the input data available – as such, this report
provides only the most recent global and regional estimates.
SOURCES: Data for stunting, wasting and overweight are based on UNICEF, WHO & World Bank. 2021. UNICEF-WHO-World Bank: Joint child malnutrition
estimates - Levels and trends (2021 edition) [online]. https://data.unicef.org/resources/jme-report-2021, www.who.int/data/gho/data/themes/topics/jointchild-malnutrition-estimates-unicef-who-wb, https://datatopics.worldbank.org/child-malnutrition; data for exclusive breastfeeding are based on UNICEF.
2020. UNICEF Global Database on Infant and Young Child Feeding. In: UNICEF [online]. New York, USA. [Cited 19 April 2021]. data.unicef.org/topic/
nutrition/infant-and-young-child-feeding; data for anaemia are based on WHO. 2021. Global Health Observatory (GHO). In: WHO [online]. Geneva,
Switzerland. [Cited 26 April 2021]. www.who.int/data/gho/data/themes/topics/anaemia_in_women_and_children; data for adult obesity are based on
WHO. 2017. Global Health Observatory (GHO). In: WHO [online]. Geneva, Switzerland. [Cited 2 May 2019]. www.who.int/data/gho/data/indicators/
indicator-details/GHO/prevalence-of-obesity-among-adults-bmi-=-30-(age-standardized-estimate)-(-); data for low birthweight are based on UNICEF &
WHO. 2019. UNICEF-WHO Low Birthweight Estimates: Levels and trends 2000–2015 [online]. [Cited 4 May 2021]. data.unicef.org/resources/lowbirthweight-report-2019
| 32 |
THE STATE OF FOOD SECURITY AND NUTRITION IN THE WORLD 2021
» children does not include the impact of the
pointing to the need for consolidated attention
and action. Similar patterns hold for anaemia in
pregnant women, as well. 36
pandemic given the inability to measure children
while physical distancing policies were in place.
However, one study based on modelling indicates
that wasting may have affected around 15 percent
more children in 2020 than estimated, putting the
lives of tens of millions of children at risk. 33
Adult obesity is a diet-related risk factor for
several NCDs. Adult obesit y continues to rise,
with the global prevalence increasing from
11.8 percent in 2012 to 13.1 percent in 2016.
All subregions showed increasing trends in
the prevalence of adult obesit y between 2012
and 2016, and are off track to meet the 2025
W H A target. Northern America, Western
Asia, and Australia and New Zealand had the
highest levels, at 35.5 percent, 29.8 percent
and 29.3 percent, respectively, as of 2016.
Latin America and the Caribbean, and Oceania
excluding Australia and New Zealand, also show
levels above 20 percent. Updated adult obesit y
estimates will be released in late 2021.
Childhood overweight (part of SDG Indicator 2.2.2)
has immediate impacts on children’s health and
well-being and increases the risk of diet-related
NCDs later in life. It has been on the rise in many
countries, boosted by industry-led marketing
and greater access to highly processed foods,
often high in energ y, fats (particularly saturated
and trans fats), free sugars and salt, 34 along with
inadequate levels of physical activity. For example,
a study in Europe found that over half of
commercial complementary infant foods contained
excessive levels of sugar. 35 In 2020, 5.7 percent
(38.9 million) of children under five years were
overweight. 32 There has been little change at the
global level in two decades – 5.7 percent in 2020
compared with 5.4 percent in 2000 – and trends in
some regions and in many settings are on the rise.
While the prevalence of child overweight in Africa
is similar to the global prevalence (5.3 percent
in 2020), subregional levels show differences,
reaching 13.0 and 12.1 percent in Northern Africa
and Southern Africa, respectively. There have been
notable increases in child overweight between
2000 and 2020, 32 especially in two regions, Eastern
and South-eastern Asia, and Australia and
New Zealand, where levels have increased from
5.2 to 7.7 percent and from 7.7 to 16.9 percent,
respectively. A reversal in trajectory is needed to
achieve the 3 percent global target for 2030.
The regional trends described above are
summarized in Figure 8 and subregional trends are
presented in Table 7 in the next section.
As has been touched upon previously in this
report, hundreds of millions of people were
already suffering from hunger and malnutrition
before the onset of the COV ID-19 pandemic.
In the long term, without large-scale coordinated
action, the combined effects of COV ID-19
infection, as well as corresponding mitigation
measures and the emerging global recession,
could disrupt the functioning of food systems
with disastrous consequences for health and
nutrition. In the following section, we examine
some of the evidence of the impacts of the
COV ID-19 pandemic on nutrition.
Impact of the COVID-19 pandemic
on nutrition
New updates from 2019 on anaemia in women
of reproductive age (SDG Indicator 2.2.3) are
presented in this year’s report. Nearly one in
three (29.9 percent) women of reproductive
age globally were still affected by anaemia
and no progress has been made since 2012.
Wide variations exist between regions, with the
prevalence in Africa being nearly three times
higher than that of Northern America and
Europe. The prevalence is particularly high in
Western Africa, representing 51.8 percent, with
little progress since 2012 (52.9 percent). No region
has shown a significant decline in the prevalence
of anaemia among women of reproductive age,
The COV ID-19 pandemic has led to multiple
economic, food and health system shocks that
threaten to reverse the progress made to date in
tackling all forms of malnutrition. 37 It will likely
be some time before empirical data are available
on a global scale that allow proper assessment of
the impact of the pandemic on nutritional status.
However, results of the studies described below
provide insight into how the COV ID-19 pandemic
has impacted nutrition-related factors that
ultimately inf luence nutrition outcomes.
»
| 33 |
CHAPTER 2 FOOD SECURITY AND NUTRITION AROUND THE WORLD
FIGURE 8 STUNTING IS THE ONLY INDICATOR SHOWING SUBSTANTIAL IMPROVEMENTS IN MULTIPLE
REGIONS SINCE 2000. TWO INDICATORS – CHILD OVERWEIGHT AND ANAEMIA AMONG WOMEN OF
REPRODUCTIVE AGE – HAVE SEEN NO PROGRESS IN TWO DECADES. ADULT OBESITY IS RISING SHARPLY IN
ALL REGIONS
STUNTING
PREVALENCE (%)
LOW
BIRTHWEIGHT
WASTING1,2
(under 5 years)
(under 5 years)
45
45
45
45
40
40
40
40
35
35
35
35
30
30
30
30
25
25
25
25
20
20
20
20
15
15
15
15
10
10
10
10
5
5
5
5
0
2012 2015
2000
2020
0
2000
2012
EXCLUSIVE BREASTFEEDING2
20203
0
2000
0
2012
60
50
45
45
40
40
35
35
30
30
40
25
25
30
20
20
15
15
10
10
5
5
20
10
0
2000
2012
World
Africa
2019 2020
Asia4
Northern America, Europe and
Australia and New Zealand
0
2000
2012
20203
(adults)
(women of reproductive age)
70
20203
OBESITY
ANAEMIA
(< 6 months)
PREVALENCE (%)
OVERWEIGHT
(under 5 years)
2019 2020
0
2000
2012
2016
2020
Latin America and the Caribbean
Oceania excluding Australia and New Zealand
NOTES: 1 Wasting is an acute condition that can change frequently and rapidly over the course of a calendar year. This makes it difficult to generate
reliable trends over time with the input data available and, as such, this report provides only the most recent global and regional estimates. 2 For wasting
and exclusive breastfeeding, estimates are not shown for regions/years where population coverage was below 50 percent. 3 The collection of household
survey data on child height and weight were limited in 2020 due to the physical distancing measures required to prevent the spread of COVID-19. Only
four national surveys included in the database were carried out (at least partially) in 2020. The estimates on child stunting, wasting and overweight are
therefore based almost entirely on data collected before 2020 and do not take into account the impact of the COVID-19 pandemic. 4 For wasting and low
birthweight, the Asia estimate excludes Japan.
SOURCES: Data for low birthweight are based on UNICEF & WHO. 2019. UNICEF-WHO Low Birthweight Estimates: levels and trends 2000–2015, May
2019. In: UNICEF data [online]. New York, USA, UNICEF [Cited 19 April 2021]. data.unicef.org/resources/unicef-who-low-birthweight-estimates-levelsand-trends-2000-2015; data for stunting, wasting and overweight are based on UNICEF, WHO & World Bank. 2021. UNICEF-WHO-World Bank: Joint child
malnutrition estimates - Levels and trends (2021 edition) [online]. https://data.unicef.org/resources/jme-report-2021, www.who.int/data/gho/data/themes/
topics/joint-child-malnutrition-estimates-unicef-who-wb, https://datatopics.worldbank.org/child-malnutrition; data for exclusive breastfeeding are based
on UNICEF. 2020. UNICEF Global Database on Infant and Young Child Feeding. In: UNICEF [online]. New York, USA. [Cited 19 April 2021]. data.unicef.
org/topic/nutrition/infant-and-young-child-feeding; data for anaemia are based on WHO. 2021. Global Health Observatory (GHO). In: WHO [online].
Geneva, Switzerland. [Cited 26 April 2021]. www.who.int/data/gho/data/themes/topics/anaemia_in_women_and_children; data for adult obesity are
based on WHO. 2017. Global Health Observatory (GHO). In: WHO [online]. Geneva, Switzerland. [Cited 19 April 2021]. www.who.int/data/gho/data/
indicators/indicator-details/GHO/prevalence-of-obesity-among-adults-bmi-=-30-(age-standardized-estimate)-(-)
| 34 |
THE STATE OF FOOD SECURITY AND NUTRITION IN THE WORLD 2021
» Changes in food and diet patterns
The study revealed sociodemographic
inequalities in dietar y qualit y in Brazil: people
in the lower wealth quintiles, those who became
unemployed, people of colour and respondents
from the poorer Northeastern region of the
countr y reported increased consumption of
highly processed food. The findings highlight
the need for policies to focus on the promotion
of healthy diets while providing social protection
schemes to support v ulnerable groups during
the COV ID-19 pandemic. Similar patterns
were obser ved across the Latin America and
Caribbean region as well. 41
Some data collection efforts have continued
during the pandemic through phone and online
sur veys, and through modified in-person sur veys
employing infection prevention and control
measures. Many nutrition-related sur veys
undertaken in 2020 included questions on coping
strategies adopted by households in the face
of the COV ID-19 pandemic, shedding light on
changes in dietar y patterns.
One national survey in Indonesia found that
31 percent of households reported food shortages
and 38 percent reported eating less than
usual, compared with 3 percent and 5 percent,
respectively, the previous year. 11 Survey results
show that foods consumed by households were
neither sufficient in amount nor in diversity,
increasing the risk of nutritional deficiencies
and irreversible physical and cognitive deficits
to children, as well as adult underweight,
overweight and obesity, and of developing NCDs.
Another study in Yemen found that the dietary
diversity of households already consuming poor
diets had deteriorated between February and April
2020, with the share of households consuming
only three or fewer food groups increasing
from 22 to 30 percent during that period.
These households reported eating mainly cereals,
fats and sugar, instead of nutritious foods. 38
Disruption of essential nutrition services
Countries worldwide are facing many challenges
as they strive to ensure that health, food,
education and social protection systems maintain
essential nutrition ser vices while simultaneously
responding to the COV ID-19 pandemic. Based on
a sur vey tracking the situation of children
during the pandemic, 42 90 percent of countries
(122 of 135) reported a change in the coverage
of key nutrition ser vices in Aug ust 2020 ( Figure 9).
Overall, essential nutrition ser vices coverage
declined by 40 percent, and nearly half of the
countries reported a drop of 50 percent or
more for at least one nutrition inter vention.
Nutrition programmes in schools were the most
affected, with an overall 60 percent reduction
in ser vice coverage, followed by iron–folic acid
supplementation for adolescent girls (45 percent).
In most countries reporting data on school-based
nutrition programmes, including school feeding
and take-home rations (39 of 68 countries with
available data), school nutrition programmes
were disrupted by as much as 75 –100 percent due
to COV ID-19 mitigation measures ( Figure 9).
Conditions imposed by the COVID-19 pandemic,
such as mobility restrictions, closures or limited
operating hours of food markets, and price
increases of perishable, often more nutritious
foods, 39 have all provoked changes in dietary
patterns. These conditions, along with reduced
incomes, can induce families to choose cheaper,
highly processed foods with a longer shelf life
– often of high energ y density and minimal
nutritional value – over fresh and more nutritious
foods. Forty-nine percent of survey respondents
in Brazil reported that their food habits had
changed during quarantine and social isolation
periods. Among households with children and
adolescents under 17 years, this proportion
increased to 58 percent. Almost one-third
(31 percent) of households with children increased
their consumption of highly processed foods,
compared with 18 percent of households without
children, highlighting how deteriorations in diet
quality are taking the greatest toll on children. 40
The findings from the sur vey demonstrate that
the most v ulnerable regions were also the most
affected by the COV ID-19 pandemic. Africa and
Asia, regions that bear the greatest share of all
forms of child malnutrition, also reported the
biggest overall drops in coverage of essential
nutrition ser vices of 27 percent and 49 percent,
respectively. Similarly, over 90 percent of all
countries in fragile r situations reported some
level of ser vice disruption compared with
r Based on World Bank FY19 List of Fragile and Conflict-affected
Situations.
| 35 |
CHAPTER 2 FOOD SECURITY AND NUTRITION AROUND THE WORLD
FIGURE 9 AROUND 90 PERCENT OF COUNTRIES SURVEYED REPORTED CHANGES IN COVERAGE OF KEY
NUTRITION SERVICES DUE TO COVID-19 IN AUGUST 2020. WHILE 80 PERCENT REPORTED DISRUPTIONS IN
COVERAGE, A SMALL PROPORTION WITNESSED IMPROVED COVERAGE
Food subsidies (n=36)
Treatment of child wasting (n=83)
Early detection of wasting (n=103)
Large-scale fortification (n=69)
Nutrition support for pregnant, lactating mothers (n=99)
Iron–folic acid (IFA) supplementation for adolescent girls (n=28)
Nutrition programmes in schools (n=68)
Vitamin A supplementation (n=87)
Home fortification with multiple micronutrient powders (MNPs) (n=55)
Promotion of nutritious diets for children 6–23 months (n=114)
Protection and promotion of breastfeeding (n=118)
0
10
20
30
40
50
60
70
80
90
100
PERCENTAGE
No change
<25% drop
25–49% drop
50–74% drop
75–100% drop
New/increased coverage
SOURCE: UNICEF. 2020. Tracking the situation of children during COVID-19. In: UNICEF [online]. [Cited 21 May 2021]. https://data.unicef.org/resources/
tracking-the-situation-of-children-during-covid-19-august-2020
of countries (11 percent) even reported increased
coverage of nutrition ser vices during this period.
75 percent of countries not in fragile situations.
Worldwide, countries attempted to adapt
their programmes to continue to provide key
nutrition inter ventions during the pandemic.
For example, over 70 countries implemented
measures, such as physical distancing at clinics,
to ensure continuation of high-dose vitamin A
supplementation for children. A small proportion
The COVID-19 pandemic has not only disrupted
health systems but also impacted the global
community’s ability to monitor nutrition outcomes
for children and adults. While in 90 percent of
countries, routine information systems continued
| 36 |
THE STATE OF FOOD SECURITY AND NUTRITION IN THE WORLD 2021
to function in some capacity, almost half of the
countries reported an inability to implement
surveys, which are the leading source of data for
the monitoring of global nutrition targets.
infection, resulting in early developmental
deficits, and may not be as easily reversed. 7
Three different scenarios were modelled based
on trajectories of economic recovery and service
disruptions from the COVID-19 pandemic in 2021
and 2022: a rapid recovery in 2021 (optimistic), a
scenario with a second wave of infections in 2021
(moderate), and a scenario of persistent disruptions
and protracted recovery (pessimistic). A global
computable general equilibrium model s linked to
country-specific household survey data was used
to predict the effects of the pandemic's disruptions
on gross national income (GNI) per capita,
household incomes and USD 1.90/day poverty
rates between 2020 and 2022 for each scenario.
These were then used to predict country-specific
changes in the prevalence of wasting based on
observed historical associations. Estimates of
poverty and wasting, and assumptions about levels
of disruption of health and nutrition services,
were imputed into the Lives Saved Tool (LiST)
to predict changes in stunting. For the analysis
presented below, the results of this model for
118 countries were extrapolated to estimate the
potential impact if all 135 low- and middle-income
countries experienced similar relative increases in
malnutrition (see Box 6 in the next section).
In addition to key nutrition ser vices being
suspended, countries also reported disruptions
to other health ser vices such as mass vaccination
campaigns, with measles campaigns suspended
in 27 countries, putting children with suboptimal
growth at a higher risk of death from such
infections. 43,4 4 Moreover, three-quarters of
countries reported a considerable degree of
disruption of ser vices aimed at the prevention or
treatment of NCDs. 45 According to a sur vey on
continuit y of essential health ser vices during the
COV ID-19 pandemic, management of moderate
and severe malnutrition was one of the most
frequently disrupted ser vices in April 2021
under reproductive, maternal, newborn, child,
and adolescent health and nutrition, affecting
41 percent of reporting countries. 46
Impact on child malnutrition
Research based on modelled scenarios can
contribute valuable insights, at least until new
empirical data for 2020 and 2021 are available
from a large enough number of countries to
allow for an official assessment of the impact
of the COV ID-19 pandemic at the global and
regional levels. One such effort by members of
the Standing Together for Nutrition Consortium
involved the application of a combination of
modelling tools to estimate the joint effects of
economic, food and health systems disruptions
induced by the pandemic on various forms of
maternal and child undernutrition in 118 lowand middle-income countries. 47 They estimated
how many more children may be affected by
wasting in 2020, 2021 and 2022 as a consequence
of the COV ID-19 pandemic. Potential additional
cases of stunting due to the pandemic were
estimated only for 2022 compared with 2019,
given the cumulative nature of stunting.
Increases in wasting among young children living
in communities badly hit by pandemic-related
disruptions in health ser vices, food supply chains
and/or loss of jobs and livelihoods are likely to
be seen within a matter of months, and could
disappear as soon as circumstances improve.
Child stunting, on the other hand, ref lects more
chronic periods of undernutrition or frequent
For child wasting, under the moderate
scenario, this modelling exercise predicts
that an additional 11.2 million children under
five years of age in low- and middle-income
countries would be affected by wasting
from 2020 to 2022 as a consequence of
the pandemic – 6.9 million in 2020 alone.
For the pessimistic scenario, the estimate of
additional cases increases to 16.3 million.
For child stunting, under the moderate
scenario, the model predicts that 3.4 million
more children will be stunted in 2022 due
to the impacts of the COV ID-19 pandemic –
4.5 million more in the pessimistic scenario.
Though not included in the above modelling
study, concerns have been raised over the
potential impact of the pandemic on micronutrient
deficiencies, as well as on overweight and obesity
and the risk of NCDs. The above-mentioned
s See further reference to this model (MIRAGRODEP) in the next
section and in Annex 2. See also IFPRI (2011).55
| 37 |
CHAPTER 2 FOOD SECURITY AND NUTRITION AROUND THE WORLD
negative impacts on the affordability of healthy
diets and diet quality increase the likelihood
of micronutrient deficiencies, and along with
decreased physical activity, may exacerbate
overweight and obesity, as well as NCDs, far
beyond the duration of the pandemic. This is
particularly concerning as the scientific evidence
shows that patients with obesity (including young
adults) hospitalized with COVID-19 experienced
substantially higher rates of severe outcomes. 48
2.3
2021 year of nutrition
KEY MESSAGES
ENDING HUNGER
AND ALL FORMS
OF MALNUTRITION
BY 2030
In summary, malnutrition persists in multiple
forms and the full impact of the COVID-19
pandemic is still unfolding. Many regions
and countries are increasingly dealing with
multiple forms of malnutrition simultaneously.
This coexistence of undernutrition along
with overweight and obesity, associated with
diet-related NCDs, in individuals and within
households and populations, is referred to as the
“double burden of malnutrition”. 49 For example,
wasting and overweight in children under 5 years
can coexist in a population at problematic levels.
In Oceania (excluding Australia and New Zealand)
in 2020, wasting prevalence was 9.0 percent
while overweight prevalence was 8.0 percent.
Different forms of malnutrition can also interact
over the life course and across generations.
In order to reach the global targets, malnutrition
must therefore be addressed holistically in policies
and programmes designed at regional and national
level. 50,51 Identifying opportunities to achieve
multiple malnutrition goals and targets with single
interventions by scaling up so called Double-duty
Actions will be key to achieve this goal. 52,50
è New projections confirm that hunger will not be
eradicated by 2030 unless bold actions are taken to
accelerate progress, especially actions to address
inequality in access to food. The COVID-19 pandemic
has worsened the discouraging trends that already
existed prior to the crisis.
è Projections that consider the potential impact
of the COVID-19 pandemic suggest that, following a
peak of more than 760 million people in 2020, global
hunger will decline slowly to fewer than 660 million in
2030. Nevertheless, this represents 30 million more
people than projected for 2030 had the pandemic not
occurred, revealing lasting effects of the pandemic on
global food security.
è While a substantial reduction in hunger is
projected for Asia by 2030 (from 418 million in
2020 to 300 million people), a significant increase
is forecasted for Africa (from more than 280 to
300 million people), placing it by 2030 on par
with Asia as the region with the highest number of
undernourished people.
è Globally, progress is being made for some forms
of malnutrition, but the world is not on track to
achieve targets for any of the nutrition indicators by
2030. The current rate of progress on child stunting,
exclusive breastfeeding and low birthweight is
insufficient, and progress on child overweight, child
wasting, anaemia in women of reproductive age and
adult obesity is stalled or the situation is worsening.
Various nutrition initiatives and efforts have
culminated in notable progress achieved
globally in exclusive breastfeeding and stunting.
However, accelerated actions are needed, not only
to maintain progress, but also to make greater
strides towards the global nutrition targets
– particularly in the wake of the COV ID-19
pandemic. With increased momentum towards
the UN Food Systems Summit in September 2021
and the Tokyo Nutrition for Growth Summit in
December 2021, now is the time to make concrete
commitments and plans towards eliminating all
forms of malnutrition over the second half of the
UN Decade of Action on Nutrition until 2025 53,54
and towards the 2030 SDGs. n
è Despite poor progress at the global level, notable
improvements are occurring in some areas, with about
one-quarter of countries confirmed to be on track to
reach the 2030 SDG targets for childhood stunting
and wasting and about one in six countries on track to
achieve the target on child overweight.
| 38 |
THE STATE OF FOOD SECURITY AND NUTRITION IN THE WORLD 2021
è The COVID-19 pandemic has likely impacted the
prevalence of multiple forms of malnutrition, and could
have lasting effects beyond 2020, as we are already
seeing in 2021. These will be compounded through
the intergenerational effects of malnutrition and the
resulting impacts on productivity. Exceptional efforts
are required to address and overcome the effects of
the pandemic as part of accelerating progress towards
achieving SDG Target 2.2.
This year’s projections of the elements that
determine the PoU values up to 2030 were
estimated using a structural approach based on
MIR AGRODEP, 55 a dynamic general equilibrium
model that reproduces the functioning of world
agricultural and non-agricultural markets,
considers developments in agricultural markets
and applies them to the economy as a whole
to generate new equilibrium values of a set of
macroeconomic parameters. The MIR AGRODEP
model was calibrated to the pre-COV ID-19
situation of the world economy in 2018 and
used to generate projections of macroeconomic
fundamentals into 2019–2030 under two
scenarios: a reference scenario, aimed at
capturing the macroeconomic impact of the
COV ID-19 pandemic as ref lected in the latest
available update of the IMF’s World Economic
Outlook ( W EO), published in April 2021, hereby
referred to as the COV ID-19 scenario; and a
no-COV ID-19 scenario based on economic
growth projections presented in the October
2019 edition of the W EO, the last one before
the pandemic.
With ten years left to reach the end of the
time horizon set for achieving the SDGs, last
year’s edition of this report presented a first
assessment of the likelihood that Targets 2.1 and
2.2 would be achieved. 7 The forecast depicted
a world that was not on track to achieve Zero
Hunger by 2030. Projections also highlighted the
tremendous challenges, despite some progress
on child stunting and low birthweight, to
achieving all global nutrition targets by 2030.
This year, with nine years remaining to achieve
the targets, renewed efforts were made to look
ahead to 2030 in a scenario further complicated
by the COV ID-19 pandemic.
Towards ending hunger: projections
to 2030
Specifically, trajectories of food supply, economic
growth and real price of food were derived from
the COV ID-19 scenario for 171 countries, and of
povert y rates for 85 countries. These were used,
in turn, to predict the evolution of the DEC for
all countries and of the C V for 85 countries.
Together with projections of population size
and growth rates as provided by the 2019 UN
World Population Prospects, these were then
used to project the future trajectories of the
three fundamental variables that inform the
PoU (see above). These trajectories were then
linked to the 2020 nowcasts of the same variables
to generate the projected PoU series from
2021 to 2030. In the case of the no-COV ID-19
scenario, the trajectories of the fundamental
variables beginning from 2019 were linked to the
pre-COV ID-19 situation in 2018 (for details, see
Annex 2). Both scenarios assume the trajectories
are not disrupted by new conf licts, climate
variabilit y and extreme weather events, and
economic downturns, the main drivers of recent
increases in food insecurit y (see Chapter 3).
They also assume that momentous actions needed
to transform food systems for food securit y and
decrease inequalities in access to food (Chapter 4)
are not implemented.
With respect to SDG Target 2.1, the conclusion
presented in last year’s report that the target of
eradicating hunger would be out of reach was
based on extrapolation of recent trends in the
three fundamental variables used to compute
the prevalence of undernourishment for each
country: the total supply of food, the population
size and composition (which determine the total
dietary energ y requirements) and the degree of
inequality in food access within the population.
The simple time-series forecasting methods
applied depicted a scenario in which food
supplies would not keep pace with population
growth, hence reducing the availability of food in
per capita terms, while inequality in food access
continued to increase.
Clearly, a method that projects the future by
extrapolating past trends cannot properly account
for the consequences that an unprecedented
shock like the COV ID-19 pandemic has had –
and may continue to have – on the drivers of
food insecurit y. Therefore, for this edition of the
report, a different approach was used.
| 39 |
CHAPTER 2 FOOD SECURITY AND NUTRITION AROUND THE WORLD
FIGURE 10 THE COVID-19 SCENARIO PROJECTS A SMALL DECREASE IN GLOBAL HUNGER BETWEEN 2021
AND 2030, WITH WIDE VARIATION IN EVOLUTION ACROSS REGIONS
800
768.0
NUMBER OF UNDERNOURISHED (MILLIONS)
700
656.8
650.3
600
624.1
500
418.0
400
361.3
300
281.6
100
45.9
290.8
283.0
235.3
200
299.3
299.5
59.7
52.2
45.4
0
2015
2019
World
Africa
Asia
Projections for the COVID-19 scenario
2020*
2030*
Latin America and the Caribbean
Projections for the no-COVID-19 scenario
NOTES: * Projected values. The 2020 projected values are based on the middle of the projected range. The full ranges can be found in Annex 2.
SOURCE: FAO.
Figure 10 shows the projected series of the
number of undernourished globally and
at regional level. Under the COV ID-19
scenario, following a projected peak of around
768 million (9.9 percent of the population) in
2020, global hunger would decrease to around
710 million in 2021 (9.0 percent), and then
continue to decrease marginally to less than
660 million (7.7 percent) in 2030. However, the
evolution from 2020 to 2030 is quite different
across regions. While a substantial reduction
is projected for Asia (from 418 to 300 million
people), a significant increase is forecast for
Africa (from more than 280 to 300 million
people), placing it on par with Asia by 2030
as the region with the highest number of
undernourished people. Numbers remain
stable in Latin America and the Caribbean, and
marginal in other regions.
Comparing the COV ID-19 scenario to the
hy pothetical no-COV ID-19 scenario, we see that
global hunger in 2030 is projected to be above the
level it would have been had the pandemic not
occurred. About 30 million more people may face
hunger in 2030 compared with the no-COV ID-19
scenario, revealing possible persistent effects of
the pandemic on global food securit y.
A closer look at the underlying parameters
that inform the estimates of the number of
undernourished (see Box 2 and Annex 2) sheds
| 40 |
THE STATE OF FOOD SECURITY AND NUTRITION IN THE WORLD 2021
light on what is driving this higher projected
number due to the COV ID-19 pandemic in
2030. We obser ve that while the COV ID-19
scenario indicates that food supplies will return
to levels that would have prevailed under the
no-COV ID-19 scenario, it also predicts the
pandemic will have a lasting impact on GDP
growth rates, income inequalit y and povert y
rates that will not be fully absorbed by 2030, thus
inducing higher levels of inequalit y in food access
in the COV ID-19 scenario compared with the
no-COV ID-19 scenario. This greater inequalit y
in access to food would therefore be mostly
responsible for the obser ved difference.
the COV ID-19 pandemic, does not give weight
to the more recent trends and does not factor in
future potential change in trends.
Globally, progress has been made for some forms
of malnutrition, but the world is not on track to
achieve targets for any of the nutrition indicators
by 2030. The current rate of progress on child
stunting, exclusive breastfeeding and low
birthweight is insufficient, and progress on child
overweight, child wasting, anaemia in women of
reproductive age and adult obesit y is stalled (no
progress) or the situation is worsening ( Table 7).
Progress has been uneven across regions ( Table 7
and Figure 11). While almost all subregions are
either on track or making some strides towards
reducing child stunting, too many are still
off track to reach the other global nutrition
targets, pointing to the need for accelerated
actions to change course between now and
2030. The current level of wasting remains well
above the 5 percent global target for 2025 and
the 3 percent global target for 2030. While Latin
America and the Caribbean is on track for
wasting, other regions remain off track, with
many children suffering from this life-threatening
condition. Most regions are showing no progress
or are worsening with respect to the prevalence
of children under 5 who are overweight.
Particularly concerning are the worsening trends
seen in Eastern Asia and South-eastern Asia, and
Australia and New Zealand. The prevalence of
overweight is greater among older age groups,
and preventive interventions in early childhood
are critical to reduce the risk of overweight
and obesity across the life course. 5 Meaningful
progress in this area is needed to reduce child
overweight to less than 3 percent; such efforts
would also likely contribute to stem the alarming
rise in adult obesity, which is worsening in all
subregions. No subregion is on track to achieve
either the 2025 or 2030 targets on reducing
anaemia in women of reproductive age, with
trends stagnating or worsening in all regions
except Latin America and the Caribbean.
Likewise, based on the latest estimates, no
subregion is on track to reach the 2025 or 2030
global targets for low birthweight.
The structural approach used to inform the
new projections confirms the fundamental
result anticipated last year: hunger will not be
eradicated by 2030 unless exceptional efforts
are deployed. The prospects were already
discouraging before the COV ID-19 pandemic,
which has aggravated the situation. Bold actions
are needed to accelerate progress – especially
actions to address inequalit y in access to food
(see Chapter 4).
Towards ending all forms of malnutrition:
projections to 2030
With respect to SDG Target 2.2 and the W H A
global nutrition targets, last year’s report also
pointed to insufficient progress towards ending
malnutrition in all its forms, even without
taking the impact of the COV ID-19 pandemic
into account. Like the projections for hunger,
estimates regarding levels of malnutrition in 2030
are characterized by a high level of uncertaint y.
Household sur vey data on child height and
weight were, in most cases, not collected in 2020
due to physical distancing measures; moreover,
the future of the COV ID-19 pandemic, and its
impacts over the next decade, are unknown.
For this reason, the same approach applied
in the last edition of this report to project
the nutritional indicators was used, which is
based on the rate of obser ved trends before the
pandemic. This rate was then compared with
the rate of progress required to achieve the 2030
targets to provide an assessment of progress
towards the global nutrition targets (see Box 5
and Annex 2). The limitations of this approach,
however, are that it does not include the effect of
If current trends continue, the world is
expected to reach the 2025 target for exclusive
| 41 |
»
CHAPTER 2 FOOD SECURITY AND NUTRITION AROUND THE WORLD
TABLE 7 MOST REGIONS HAVE MADE SOME PROGRESS, BUT NOT ENOUGH TO ACHIEVE GLOBAL TARGETS IF
TRENDS (BEFORE COVID-19) CONTINUE; NO SUBREGION IS ON TRACK FOR THE LOW BIRTHWEIGHT TARGET,
AND ADULT OBESITY HAS BEEN WORSENING IN ALL SUBREGIONS
5.0
5.3
6.0
14.1 13.7
35.5 43.6
39.2 38.9
10.4 11.8
Northern Africa
22.7 21.4
12.0 13.0
6.6
12.4 12.2
40.7 42.1
31.9 31.1
22.5 25.4
Sub-Saharan Africa
36.6 32.3
3.8
4.0
5.9
14.4 14.0
34.5 44.0
41.2 40.7
6.9
8.0
Eastern Africa
38.9 32.6
4.0
4.0
5.2
13.8 13.4
48.6 60.7
31.4 31.9
4.3
5.2
Middle Africa
38.0 36.8
4.4
4.8
6.2
12.8 12.5
28.5
n.a.
46.1 43.2
5.5
6.6
Southern Africa
24.3 23.3
12.1 12.1
3.2
14.3 14.2
n.a. 33.5
28.5 30.3
Western Africa
34.9 30.9
2.3
2.7
6.9
15.6 15.2
22.1 32.3
52.9 51.8
6.4
7.7
Asia
28.1 21.8
4.9
5.2
8.9
17.8 17.3
39.0 45.3
31.1 32.7
6.0
7.3
Central Asia and
Southern Asia
39.2 29.8
3.1
2.7
13.6
26.4 25.5
46.6 56.6
47.5 47.5
4.6
5.7
Central Asia
15.4 10.0
8.5
5.6
2.3
5.4
29.2 44.8
28.8 28.1
Southern Asia
40.2 30.7
2.9
2.5
14.1
27.2 26.4
47.4 57.2
48.3 48.2
4.2
5.2
Eastern Asia and
South-eastern Asia
16.0 13.4
6.5
7.7
4.1
8.0
8.0
30.4 29.8
18.2 19.5
5.1
6.5
4.9
6.8
7.9
1.7
5.1
5.1
28.5 22.0
15.5 16.1
5.0
6.4
30.5 27.4
5.8
7.5
8.2
12.4 12.3
33.5 47.9
25.0 27.2
5.3
6.7
Western Asia
17.8 13.9
9.0
8.3
3.5
10.0
9.9
32.3 33.1
31.7 32.5
25.7 28.6
Western Asia and
Northern Africa
20.3 17.8
10.5 10.8
5.1
11.2 11.1
37.4 38.7
31.8 31.8
24.2 27.2
Latin America
and the Caribbean
12.8 11.3
7.3
7.5
1.3
8.7
8.7
33.4
n.a.
18.2 17.2
21.7 24.1
Caribbean
13.2 11.8
6.4
6.6
2.8
10.1
9.9
29.7 25.9
28.7 29.2
21.9 24.8
Central America
17.9 16.6
6.6
6.3
0.9
8.8
8.7
21.6 33.2
15.2 14.6
24.2 26.6
South America
10.2
8.6
7.7
8.2
1.4
8.6
8.6
41.9
n.a.
18.4 17.3
20.8 23.0
Oceania excluding
Australia and
New Zealand
40.3 41.4
7.3
8.0
9.0
10.0
9.9
56.9 61.3
32.9 33.9
20.1 22.4
12.9 16.9
n.a.
6.2
6.4
n.a.
n.a.
9.3
8.6
n.a.
7.0
7.0
n.a.
Europe
5.3
4.5
9.6
8.3
n.a.
6.6
6.5
n.a.
Northern America
2.8
3.2
8.8
9.1
0.2
7.9
7.9
| 42 |
23.2 25.6
14.4 16.8
8.8
28.2 30.7
n.a.
13.1 14.6
26.7 29.0
n.a.
14.5 16.0
23.4 25.4
25.5 34.7
9.9 11.7
34.1 36.7
2025
34.5 30.7
4.0
2016
Africa
4.4
2012
11.7 13.2
Northern America
and Europe
2030
28.5 29.9
7.6
2019
37.0 44.0
2.3
2012
15.0 14.6
2.4
2030
6.7
Australia and New
Zealand
2019
2012
2030
2012
2030
2020
2020
5.7
South-eastern
Asia
2030
2012
Adult obesityc
(percent)
5.6
7.5
2030
Anaemia in
women of
reproductive
age (percent)
26.2 22.0
Eastern Asia
2020
2012
Exclusive
breastfeedingb
(percent)
World
5.6
2015
Low
birthweighta
(percent)
Child
Child stunting Child overweight
wastinga
(percent)
(percent)
(percent)
THE STATE OF FOOD SECURITY AND NUTRITION IN THE WORLD 2021
TABLE 7 (CONTINUED)
Child stunting, child overweight,
child wasting and anaemia
Low birthweight and exclusive
breastfeeding
On track
On track
On track
Off track – some progress
Off track – some progress
Off track – worsening
Off track – no progress
Off track – no progress or
worsening
Assessment not possible
Off track – worsening
Assessment not possible
Adult obesity
Assessment not possible
NOTES: Details on the methodology to assess progress can be found in Annex 2; n.a. shown where population coverage is under 50 percent. a Wasting
and low birthweight regional aggregates exclude Japan. b Exclusive breastfeeding: Regional averages are population weighted using the most recent
estimate for each country between 2005 and 2012 (2012 column) and 2014 to 2019 (2019 column), except for China where a 2013 estimate is used for
2019 aggregates; estimates in the 2012 and 2019 columns do not have the same subset of countries. c Adult obesity: There is no official target for adult
obesity for 2030.
SOURCES: UNICEF, WHO & World Bank. 2021. UNICEF-WHO-World Bank: Joint child malnutrition estimates - Levels and trends (2021 edition) [online].
https://data.unicef.org/resources/jme-report-2021, www.who.int/data/gho/data/themes/topics/joint-child-malnutrition-estimates-unicef-who-wb,
https://datatopics.worldbank.org/child-malnutrition; NCD Risk Factor Collaboration (NCD-RisC). 2017. Worldwide trends in body-mass index,
underweight, overweight and obesity from 1975 to 2016: a pooled analysis of 2416 population-based measurement studies in 128·9 million children,
adolescents and adults. The Lancet, 390(10113): 2627–2642; UNICEF & WHO. 2019. UNICEF-WHO Joint Low Birthweight Estimates [online]. [Cited 28
April 2020]. www.unicef.org/reports/UNICEF-WHO-low-birthweight-estimates-2019; www.who.int/nutrition/publications/UNICEF-WHO-lowbirthweightestimates-2019; UNICEF. 2020. UNICEF Global Database on Infant and Young Child Feeding. In: UNICEF [online]. New York, USA. [Cited 19 April 2021].
data.unicef.org/topic/nutrition/infant-and-young-child-feeding; data for anaemia are based on WHO. 2021. Global Health Observatory (GHO). In: WHO
[online]. Geneva, Switzerland. [Cited 26 April 2021] www.who.int/data/gho/data/themes/topics/anaemia_in_women_and_children; data for adult obesity
are based on WHO. 2017. Global Health Observatory (GHO). In: WHO [online]. Geneva, Switzerland. [Cited 2 May 2019]. www.who.int/data/gho/data/
indicators/indicator-details/GHO/prevalence-of-obesity-among-adults-bmi-=-30-(age-standardized-estimate)-(-)
BOX 5 ASSESSMENT OF PROGRESS TOWARDS 2030 TARGETS FOR NUTRITION INDICATORS
experienced to date is calculated using a trendline
comprising all*** estimates available between 2012
(baseline) and the latest available estimate for that
indicator. For example, for child overweight, the
trendline to assess the actual AARR uses the nine
annual point estimates from 2012 (baseline) to 2020
(the latest available estimate). For a region to be
considered “on track” towards a specific target, the
actual AARR must be higher than the required AARR
for that target.**** For the “off track” categories, the
AARR ranges associated with each category (some
progress, no progress, worsening) vary by indicator.
See Annex 2 for further details.
To determine which progress assessment category
to use for each indicator and for each region, two
distinct average annual rates of reduction (AARR)*
are calculated: (i) the AARR required for the
region to reach the 2030 target and (ii) the actual
AARR that the region has experienced to date.
The required AARR is calculated using the baseline
prevalence for the region in 2012 and the target
prevalence as noted in the 2030 Maternal Infant
and Young Child Nutrition targets.** For example,
for child overweight, the required AARR at the
global level is the annual rate of change needed
to go from a prevalence of 5.6 percent in 2012 to
the targeted 3.0 percent in 2030. The actual AARR
* See technical note on how to calculate AARR (available at: https://data.unicef.org/resources/technical-note-calculate-average-annual-rate-reductionaarr-underweight-prevalence). Note that for wasting, AARR based on trend estimates from the UNICEF-WHO-World Bank Joint Malnutrition Estimates are
used even if trends are unpublished.
** The 2030 targets for six of the seven indicators are available from The extension of the 2025 Maternal, Infant and Young Child nutrition targets to
2030. 26 Please note that only a 2025 target is available for adult obesity.
*** Multiple years of data are used to calculate the actual AARRs experienced to date for all indicators except exclusive breastfeeding, for which modelled
estimates are not available and which is calculated using only two estimates: the baseline (2012) and the latest year available (2019).
**** A static threshold for the latest prevalence is also used for some indicators; for example, any country for which the most recent stunting prevalence is
below 3 percent is considered “on track”, even if the AARR is less than the required AARR (see Annex 2).
| 43 |
CHAPTER 2 FOOD SECURITY AND NUTRITION AROUND THE WORLD
FIGURE 11 SOME PROGRESS HAS BEEN MADE ON MALNUTRITION, BUT THE PACE MUST BE ACCELERATED,
AND TRENDS IN SOME FORMS OF MALNUTRITION MUST BE REVERSED TO ACHIEVE THE 2025 AND 2030
GLOBAL NUTRITION TARGETS
STUNTING
LOW
BIRTHWEIGHT
PREVALENCE (%)
WASTING1,2
(under 5 years)
(under 5 years)
20
45
10
10
18
40
9
9
35
8
8
7
7
6
6
5
5
4
4
16
14
30
12
25
10
20
8
15
3
3
4
10
2
2
2
5
1
1
6
0
2012
20304
20254
2015
0
2012
EXCLUSIVE BREASTFEEDING2
20203
20254
20304
0
40
70
35
35
60
30
30
50
25
25
40
20
20
30
15
15
20
10
10
10
5
5
20254
2019
World
Africa
20304
Asia5
0
2012
20254
2019
Latin America and the Caribbean
Oceania excluding Australia and New Zealand
Global targets
20304
20254
20304
0
2030 target
20203
(adults)
40
2012
20254
2025 target
OBESITY
(women of reproductive age)
80
0
20203
2012
ANAEMIA
(< 6 months)
PREVALENCE (%)
OVERWEIGHT
(under 5 years)
20304
0
2012
2016
Northern America, Europe and
Australia and New Zealand
NOTES: 1 Wasting is an acute condition that can change frequently and rapidly over the course of a calendar year. This makes it difficult to generate
reliable trends over time with the input data available and, as such, this report provides only the most recent global and regional estimates. 2 For wasting
and exclusive breastfeeding, estimates are not shown for regions/years where population coverage was below 50 percent. 3 The collection of household
survey data on child height and weight were limited in 2020 due to the physical distancing measures required to prevent the spread of COVID-19. Only
four national surveys included in the database were carried out (at least partially) in 2020. The estimates on child stunting, wasting and overweight are
therefore based almost entirely on data collected before 2020 and do not take into account the impact of the COVID-19 pandemic. 4 For methods on
projections to 2025 and 2030, see Annex 2. 5 For wasting and low birthweight, the Asia estimate excludes Japan.
SOURCES: Data for low birthweight are based on UNICEF & WHO. 2019. UNICEF-WHO Low Birthweight Estimates: levels and trends 2000–2015, May
2019. In: UNICEF [online]. New York, USA, UNICEF [Cited 19 April 2021]. https://data.unicef.org/resources/unicef-who-low-birthweight-estimates-levelsand-trends-2000-2015; data for stunting, wasting and overweight are based on UNICEF, WHO & World Bank. 2021. UNICEF-WHO-World Bank: Joint child
malnutrition estimates - Levels and trends (2021 edition) [online]. https://data.unicef.org/resources/jme-report-2021, www.who.int/data/gho/data/themes/
topics/joint-child-malnutrition-estimates-unicef-who-wb, https://datatopics.worldbank.org/child-malnutrition; data for exclusive breastfeeding are based
on UNICEF. 2020. UNICEF Global Database on Infant and Young Child Feeding. In: UNICEF [online]. New York, USA. [Cited 19 April 2021]. data.unicef.
org/topic/nutrition/infant-and-young-child-feeding; data for anaemia are based on WHO. 2021. Global Health Observatory (GHO). In: WHO [online].
Geneva, Switzerland. [Cited 26 April 2021] www.who.int/data/gho/data/themes/topics/anaemia_in_women_and_children; data for adult obesity are
based on WHO. 2017. Global Health Observatory (GHO). In: WHO [online]. Geneva, Switzerland. [Cited 2 May 2019]. www.who.int/data/gho/data/
indicators/indicator-details/GHO/prevalence-of-obesity-among-adults-bmi-=-30-(age-standardized-estimate)-(-)
| 44 |
THE STATE OF FOOD SECURITY AND NUTRITION IN THE WORLD 2021
» breastfeeding, but not the 2030 target.
progress towards the global nutrition targets
if the trends prior to the pandemic were to
continue to 2030. This section presents a scenario
(see Box 6) of how the COV ID-19 pandemic could
potentially affect the prevalence of child stunting
and wasting by 2030. While any such projections
are highly speculative, they nevertheless
illustrate one important point: in a context in
which additional effort, attention and action
were already called for prior to the pandemic,
even more will be needed now – in a situation
worsened by the COV ID-19 pandemic – to get on
track to reach the 2030 targets.
Most subregions are making at least some
progress towards the 2030 target, except
Eastern Asia and the Caribbean – the only
subregions experiencing a decline in prevalence.
Central America is nearly on track to reach the
2030 target for exclusive breastfeeding, missing
the target by only one year if current trends
continue. If current rates of progress for exclusive
breastfeeding are maintained in Central Asia and
Southern Asia, these subregions will reach the
2030 target.
Most regions are making some progress, but not
enough to achieve the global nutrition targets.
Where progress is being made at the regional
level, it can often mask the lack of countr y-level
progress. Figure 12 shows the percentage of
countries in each region that are on track and
off track, with off track countries differentiated
by whether they are making some progress, no
progress or worsening. For the target to reduce
the number of children affected by stunting
by 50 percent, only 25 percent of countries are
confirmed to be on track, and within the Africa
region, only 9 percent of countries are on track
(five countries). For the target to reduce wasting
levels to less than 3 percent, only 28 percent of
countries seem to be on track based on available
data (57 countries). Particularly concerning
are the trends in Africa and Asia, where more
than half of the countries with data are off
track or worsening. Globally, a mere 17 percent
of countries are confirmed to be on track to
achieve the target of reducing child overweight
prevalence to less than 3 percent; no countries
are on track in Latin America and the Caribbean
and only 2 percent of countries are on track in
Northern America and Europe, and Australia and
New Zealand. In 2020, about half of the world’s
children under five lived in countries that were
not on track to achieve any of the three 2030
SDG targets for stunting, wasting or overweight.
This analysis provides clear evidence of the need
to step up efforts to eliminate child malnutrition
if the targets are to be met by 2030.
Under a no-COV ID-19 scenario, if the A A RR of
child stunting before the COV ID-19 pandemic
were to continue, 23.2 percent of children under
five years would be expected to be stunted
in 2022. In comparison, projections from our
COV ID-19 scenario indicate that 23.9 percent
of children under five years would be stunted
in the year 2022 under the pessimistic scenario
( Figure 13A), and 23.7 percent under the moderate
scenario. While this represents only a small
increase in prevalence, even this marginal
increase would result in 4.5 and 3.4 million
additional stunted children in the year 2022
alone under the pessimistic and moderate
scenarios, respectively.
When making projections to 2030, it is important
to consider the cumulative and chronic nature
of childhood stunting, as once a child is
stunted, he or she will most likely remain
stunted in subsequent years. This will result
in double-counting if the number of additional
stunted children is aggregated ever y year.
To avoid this, we assume that 35 percent of
the total number of stunted children each year
contributes to the additional stunted population
in subsequent years. Furthermore, if we assume
that from 2022 to 2030, trends in stunting follow
the pre-COV ID-19 trajector y, an additional 16 to
22 million children in low- and middle-income
countries will be stunted between the years 2020
and 2030 under the moderate and pessimistic
scenarios, respectively, compared with the
scenario without the COV ID-19 pandemic.
Potential additional cases of stunting and wasting
due to the COVID-19 pandemic
The projected additional numbers of stunted
children almost certainly underestimate the full
impact of the COV ID-19 pandemic on stunting
The projections presented above do not account
for the effect of the COV ID-19 pandemic on
malnutrition. They describe the projected
| 45 |
CHAPTER 2 FOOD SECURITY AND NUTRITION AROUND THE WORLD
FIGURE 12 AROUND HALF OF CHILDREN LIVE IN COUNTRIES THAT ARE NOT ON TRACK TO REACH ONE OF
THE 2030 SDG TARGETS FOR CHILD STUNTING, WASTING AND OVERWEIGHT
Progress towards the child malnutrition SDG targets by:
Percentage* of COUNTRIES
Percentage* of CHILDREN
Africa
25%
STUNTING
8%
REGIONAL
GLOBAL
GLOBAL
2% 5%
n=54
25%
Asia
n=48
42%
Latin America and the Caribbean
n=37
5%
Oceania***
8%
42%
n=15
Northern America, Europe and
Australia and New Zealand
36%
n=48
Africa
14%
WASTING
36%
Latin America and the Caribbean
n=37
Oceania***
8%
8%
21%
6%
9%
n=15
Northern America, Europe and
Australia and New Zealand
n=48
Africa
6%
OVERWEIGHT
Asia
n=48
49%
21%
n=54
28%
25%
Asia
n=48
42%
27%
n=54
17%
9%
Latin America and the Caribbean
n=37
Oceania***
17%
22%
n=15
32%
2%
Northern America, Europe and
Australia and New Zealand
n=48
0
On track**
Off track – some progress**
Off track – no progress**
20
Off track – worsening**
40
60
80
100
Assessment not possible**
NOTES: * Percentages may not add up to 100 percent due to rounding. ** See notes on progress assessment categories in Annex 2. *** Oceania excluding
Australia and New Zealand.
SOURCE: UNICEF, WHO & World Bank. 2021. UNICEF-WHO-World Bank: Joint child malnutrition estimates - Levels and trends (2021 edition) [online].
https://data.unicef.org/resources/jme-report-2021, www.who.int/data/gho/data/themes/topics/joint-child-malnutrition-estimates-unicef-who-wb,
https://datatopics.worldbank.org/child-malnutrition
in the conditions that contribute to increased
stunting, such as poor nutrition and disruptions
in access to health and nutrition ser vices, it is
possible that the additional number of children
who are stunted will increase over time (scenario
not shown). Furthermore, there will also be
an intergenerational effect from deteriorating
maternal nutrition during the COV ID-19
pandemic (not shown), leading to more mothers
for several reasons. The effects of stunting will
last beyond age 5 throughout the life course and
can have intergenerational effects, as stunted
adults are more likely to earn less income
and stunted mothers are more likely to give
birth to children who will be stunted, leading
to intergenerational effects of povert y and
stunting. Also, if there are persistent effects of
the COV ID-19 pandemic and no improvement
| 46 |
THE STATE OF FOOD SECURITY AND NUTRITION IN THE WORLD 2021
BOX 6 METHODOLOGY: ESTIMATES OF POTENTIAL ADDITIONAL CASES OF STUNTING AND WASTING DUE
TO THE COVID-19 PANDEMIC BASED ON A SCENARIO
Given the interest in understanding how the
COVID-19 pandemic may shape progress towards
2030 global nutrition targets, and the lack of
global data directly measuring malnutrition status
during the pandemic in 2020, a crude scenario was
developed to consider potential implications.
As described in Section 2.2, results of one
published modelling exercise covering 118 lowand middle-income countries estimated how the
prevalence of childhood stunting and wasting may
increase between 2020 and 2022 under moderate
and pessimistic assumptions.47 These estimates of
increased wasting and stunting in 118 countries
were extrapolated to all 135 low- and middle-income
countries for 2020–2022. For the projection of
additional cases between 2020 and 2030 due to
the COVID-19 pandemic in this section, a scenario
where low- and middle-income countries no longer
experience an increase in stunting and wasting after
2022, but rather return to the pre-COVID annual
average rate of reduction (AARR), was applied to
hypothesize a potential scenario.
For the three-year period of 2020–2022, the
increase in prevalence of wasting (and stunting) due
to the COVID-19 pandemic was calculated for the
moderate and pessimistic scenarios of a modelling
exercise of 118 countries.47 First, the additional
prevalence was estimated by dividing the predicted
additional cases from the modelling exercise by the
projected populations of the UN World Population
Prospects. Then the increased prevalence in wasting
(or stunting) was derived by calculating the ratio
of the additional prevalence compared with the
wasting (or stunting) prevalence estimates for lowand middle-income countries from the UNICEF/
WHO/World Bank Joint Malnutrition Estimates
(JME) Working Group. This increase in prevalence
due to the COVID-19 pandemic under the moderate
and pessimistic scenarios was extrapolated to all
135 low- and middle-income countries for each of
the three years to calculate the projected relative
increase in prevalence and number of children
stunted and wasted for 2020, 2021 and 2022.
To generate projections for the prevalence
of stunting and wasting from 2022 to 2030, the
trajectory (AARR) for the pre-COVID-19 scenario was
applied to the 2022 prevalence under each scenario.
The pre-COVID-19 AARR was calculated from all
data points available from 2012 to 2020 of the
JME estimates.
This COVID-19 scenario was created for
illustrative purposes to discuss the potential impact
of the COVID-19 pandemic on wasting and stunting.
The real impact of the pandemic on child stunting
and wasting, as well as other forms of malnutrition,
by 2030 is difficult to predict and is influenced by
multiple pathways. There are many unknown factors,
such as the extent and scope of virus mutations;
potential resurgence of the epidemic and associated
mitigation practices in various settings; the trajectory
of economic recovery; the speed at which any
disruptions of essential nutrition services and food
access will subside; and whether there may be other
shocks and what the lasting effects of those shocks
might be. This section presents merely a scenario to
illustrate potential repercussions.
with inadequate nutrition giving birth to a
cohort of children who are more likely to be
stunted (and to experience wasting), which would
increase the number of stunted children above
our current scenario. 56
children under 5 would be stunted in 2030 in the
135 low- and middle-income countries, which is
well above 85 million, the 2030 SDG target of a
50 percent reduction in the number of children
under five who are stunted. Our COV ID-19
scenario projects 125 to 127 million stunted
children in the year 2030 (20.4 to 20.7 percent),
which is 5 to 7 million more children than
if pre-COV ID trends continued without the
effect of COV ID-19, and 42 million above the
Of the seven global nutrition targets, the most
progress in the past two decades has been
achieved on child stunting. Still, even before
the pandemic, it was projected that 119 million
| 47 |
CHAPTER 2 FOOD SECURITY AND NUTRITION AROUND THE WORLD
FIGURE 13 CONSERVATIVE ESTIMATES OF THE POTENTIAL IMPACTS OF THE COVID-19 PANDEMIC INDICATE
THAT AN ADDITIONAL 5 TO 7 MILLION CHILDREN MAY BE STUNTED, AND 570 THOUSAND TO 2.8 MILLION
MORE WASTED, IN LOW- AND MIDDLE-INCOME COUNTRIES IN THE YEAR 2030. HOWEVER, THE ESTIMATE
OF ACCUMULATED ADDITIONAL CASES OF WASTING FROM 2020 TO 2030 IS 16 TO 40 MILLION
A) CHILD STUNTING
B) CHILD WASTING
10
30
9
8
PERCENTAGE
25
7
6
20
5
15
2012
2020
2022
Trend and pre-COVID-19 projections
2030
4
2012
Moderate scenario and projections
2020
2022
Pessimistic scenario and projections
NOTES: Wasting is an acute condition that can change frequently and rapidly over the course of a calendar year. This makes it difficult to generate
reliable trends over time with the input data available; this trend is not an official estimate but is shown as a scenario for this exercise.
SOURCES: UNICEF and WHO analysis of potential impact of the COVID-19 pandemic on stunting and wasting, based on extrapolation of increase in
wasting and stunting from a modelling exercise 47 and joint malnutrition estimates of trends and average annual rate of reduction before the COVID-19
pandemic. 32 See Box 6 for more details.
SDG target ( Figure 13A). Comprehensive efforts to
address the detrimental impacts of the COV ID-19
pandemic on maternal and child nutrition are
crucial to return to the pre-COV ID-19 level of
progress, and achieve the 2030 global target for
childhood stunting.
countries is projected to increase to
8.0 percent in 2020, 7.8 percent in 2021 and
7.2 percent in 2022 ( Figure 13B), resulting in
an additional 16 million children affected by
wasting between 2020 and 2022. Under the
moderate scenario, 11 million additional
children in low- and middle-income countries
will suffer from wasting in the three-year
period. If we assume that after 2022, trends in
wasting follow a similar pattern to the trend
before the COV ID-19 pandemic, an additional
16 to 40 million children will be affected by
wasting between 2020 and 2030, under the
moderate and pessimistic modelled scenarios,
respectively.
With respect to child wasting, under a
no-COV ID-19 scenario, it is estimated that
6.8 percent of children under 5 years in lowand middle-income countries were affected
by this acute form of undernutrition in 2020. 32
If the effect of the COV ID-19 pandemic is
considered, under the pessimistic scenario, the
wasting prevalence in low- and middle-income
| 48 |
2030
THE STATE OF FOOD SECURITY AND NUTRITION IN THE WORLD 2021
This does not take into account any large future
shocks or emergencies that could cause a spike
in the number of children affected by wasting.
The application of the pre-COV ID-19 A A RR
from 2022–2030 also may not take into account
relevant seasonalities associated with wasting.
This is because the A A RR used represents trends
in sur vey time points that capture a specific
cross-section of f luctuating wasting caseload
and may not be representative of overall trends.
Nevertheless, the immediate effects of the
COV ID-19 pandemic are manifested first in the
acute condition of child wasting and, if economic
conditions, food access and dietar y patterns do
not recover fully, levels of child wasting globally
will be elevated. Moreover, the management of
moderate and severe undernutrition was one of
the most frequently disrupted ser vices.
continue to unfold, the trajectory over the next
years is difficult to foresee. Evidence is still scarce
on the actual effects of the COVID-19 pandemic
on various forms of malnutrition, including on the
prevalence of child stunting, wasting, overweight,
adult obesity, anaemia in women of reproductive
age, low birthweight and exclusive breastfeeding.
These effects will be compounded through the
intergenerational effects of malnutrition and
the resulting impact on productivity and, hence,
economic recovery. However, it is clear that the
COVID-19 pandemic has likely impacted the
prevalence of multiple forms of malnutrition, and
could have lasting effects beyond 2020, as we are
already seeing in 2021. Therefore, exceptional
efforts are required to address and overcome the
effects of the pandemic as part of accelerating
progress towards achieving SDG Target 2.2.
Based on the scenarios accounting for
COV ID-19, it is projected that 6.1 to 6.5 percent
of children under five (37.3 to 39.6 million
children) will be wasted in 2030 under the
moderate and pessimistic scenarios, respectively,
in low- and middle-income countries ( Figure 13B).
This represents 570 thousand to 2.8 million
more children compared with the no-COV ID-19
scenario, and implies a level of wasting which
is twice as high as the global target of 3 percent
in 2030. Thus, if the rise in child wasting is
not prevented, and there are disruptions in
caring for these children, child mortalit y will
increase as well. Clearly, the prevention, care,
management and treatment of child wasting
requires urgent attention.
While the simple projected scenarios showing
a reversal in progress are discouraging, if the
right policies and actions are put in place now,
it is possible to get the world on track towards
zero hunger and malnutrition. In the context
of declining Overseas Development Assistance
projections, this would require sufficient and
innovative financing, strong commitment and
efficient deliver y to ensure essential nutrition
ser vices are provided to the population in
need. Just as the v ulnerabilities of food systems
have been laid bare by the pandemic, so have
many of the actions needed to strengthen their
resilience to the various drivers that have been
undermining progress. Chapter 3 provides an
integrated analysis of these drivers and Chapter 4
lays out pathways for transforming food systems
that can help get the world back on track towards
zero hunger and malnutrition. n
As the pandemic continues with no clear end
in sight, and the economic and other impacts
| 49 |
UGANDA
Agro-pastoralist women
collect harvest greens
next to their crops near
the Kenyan border.
©FAO/Luis Tato
CHAPTER 3
MAJOR DRIVERS
OF RECENT FOOD
SECURITY AND
NUTRITION TRENDS
è High income inequality magnifies the negative
impact of these drivers on food insecurity for
middle-income countries. While middle-income
countries affected by these drivers show a 2 percent
increase in the PoU between 2017 and 2019, for those
countries with high income inequality, the increase is
double – 4 percent.
KEY MESSAGES
è In the last ten years, the frequency and intensity
of conflict, climate variability and extremes, and
economic slowdowns and downturns have increased
significantly. The increased occurrence of these major
drivers, now exacerbated by the COVID-19 pandemic,
has led to a rise in hunger and has undermined
progress in reducing all forms of malnutrition,
particularly in low- and middle-income countries.
è Low-income countries affected by these drivers
show the largest increase in the PoU from 2017 to 2019;
the increases in their PoU are 2.5 times greater than
increases in middle-income countries affected by these
drivers during the same period.
è Economic downturns in 2020, including those
resulting from COVID-19 containment measures,
contributed to one of the largest increases in world
hunger in decades, affecting almost all low- and
middle-income countries. When economic downturns
occurred along with other drivers, particularly
climate-related disasters, conflict, or a combination
of both, the largest increases in the PoU occurred in
Africa, followed by Asia.
è Countries affected by economic downturns in Africa,
Asia, and Latin America and the Caribbean show the
highest increase in the PoU compared with countries
affected by climate extremes and conflict from 2017
to 2019. Africa is the only region where such a surge is
associated with all three major drivers.
è New evidence suggests that recent increases in
the unaffordability of healthy diets are associated with
increases in both severe and moderate forms of food
insecurity, especially in lower-middle-income countries.
è Each of these major drivers is unique and, while
they are external to food systems, they interact to
create multiple, compounding impacts at many
different points within food systems, to the detriment
of food security and nutrition.
è Drivers that are external (e.g. conflict and climate
shocks) and internal (e.g. low productivity and inefficient
food supply chains) to food systems are pushing up
the cost of nutritious foods which, combined with low
incomes, is increasing the unaffordability of healthy diets.
è Seventy percent of low- and middle-income
countries are affected by at least one of the drivers
and 41 percent also have high income inequality (38 of
93 countries), which worsens their impact.
è Countries affected by multiple drivers exhibited in
2019 the highest percentage of the population who
cannot afford a healthy diet (68 percent), which is, on
average, 39 and 66 percent higher than that of countries
affected by a single driver or not affected by any driver,
respectively. The unaffordability of healthy diets tends
to be higher where there is conflict.
è The majority of undernourished people and stunted
children live in countries affected by multiple drivers.
Between 2017 and 2019, in all regions, countries
affected by multiple drivers exhibit the highest
increases in the PoU – 12 times larger than those in
countries affected by only a single driver.
| 51 |
CHAPTER 3 MAJOR DRIVERS OF RECENT FOOD SECURITY AND NUTRITION TRENDS
3.1
and inclusivit y, are broader as they encompass
both agricultural and food systems and focus on
both food and non-food agricultural products,
with clear overlaps (see Chapter 4, Figure 29).
While broader agri-food systems transformation
is of utmost importance, it is beyond the scope of
this report.
A FOOD SYSTEMS
LENS IS CRITICAL TO
ADDRESS THE MAJOR
DRIVERS OF RECENT
FOOD SECURITY AND
NUTRITION TRENDS
Importantly, food systems perform a central role
not only in determining the quantit y, qualit y,
diversit y and nutritional content of the foods
available for consumption, but also in sustaining
the livelihoods of millions of people around
the world. In addition, food systems have a
major impact on human health (both positive
and negative) through a variet y of different
channels, 66 and on the environmental and
ecosystem health of our planet. As such, how
food systems function, the cost and qualit y of
the food they deliver, and the impact they have
on the health of people and our planet, directly
and indirectly impacts outcomes of food securit y
and nutrition. Therefore, any analysis of the
after-mentioned drivers and their impacts must
be viewed through a food systems lens, which
involves considering trade-offs and synergies
between these different outcomes.
As highlighted in the last four editions of
this report, as well as Chapter 1 (see Box 1),
conf lict, climate variabilit y and extremes, and
economic slowdowns and downturns are
challenging efforts to end hunger and all forms
of malnutrition. Their adverse inf luence is made
all the more difficult by high and persistent levels
of inequalit y. In addition, millions of people
around the world suffer from food insecurit y
and different forms of malnutrition because they
cannot afford the cost of healthy diets. 7 This is
because other drivers are pushing up the cost
of nutritious foods throughout the food system,
including low productivit y, inefficient food
supply chains and trade policies, among others, t
while the income of millions of people cannot
keep up. Put simply, unaffordable healthy diets
can be seen as a driver that is the result of other
drivers and low incomes. They are associated
with increasing food insecurit y and all forms
of malnutrition, including stunting, wasting,
micronutrient deficiencies, overweight and
obesit y, and NCDs.
The previous editions of this report, which
analysed in depth each driver separately, taught
us that these drivers are not mutually exclusive,
as they interact to the detriment of food securit y
and nutrition by creating multiple, compounding
impacts at many different points within our
food systems. We also learned that drivers do
not necessarily move in the same direction,
and that there are trade-offs and synergies
associated with the policies enacted in response
to these drivers. A food systems lens, therefore,
becomes essential to better understand how the
negative impacts of these drivers interact, and
to facilitate the identification of targeted entr y
points for inter ventions to address the significant
challenges presented by the drivers.
Food systems are extensive networks made
up of ever ything – and ever ybody – involved
in producing, storing, packing, processing,
distributing, marketing, consuming and
disposing of food, including the social,
political, economic, legal and environmental
systems. 57,58,59,60,61,62,63,23,64,65 Agri-food systems,
a term increasingly used in the context of
transforming food systems for sustainabilit y
This perspective also allows for an examination
of the synergies and trade-offs between policy
inter ventions and how addressing one driver can
have positive and negative impacts on different
outcomes. For example, an effective response to
recover from an economic downturn can improve
both food access and utilization, with either
t Factors driving up the cost of nutritious foods are found in the
realms of food production, food supply chains, food environments, as
well as consumer demand and the political economy of food. The State
of Food Security and Nutrition in the World 2020 provides an in-depth
examination of each of these.
| 52 |
THE STATE OF FOOD SECURITY AND NUTRITION IN THE WORLD 2021
FIGURE 14 IMPACTS OF VARIOUS DRIVERS ARE TRANSMITTED THROUGHOUT FOOD SYSTEMS,
UNDERMINING FOOD SECURITY AND NUTRITION
ECONOMIC
SLOWDOWNS AND
DOWNTURNS
CLIMATE
VARIABILITY AND
EXTREMES
BIO-PHYSICAL AND
ENVIRONMENTAL
DRIVERS
TECHNOLOGY
AND INNOVATION
DRIVERS
ECONOMIC AND
MARKET DRIVERS
CONFLICT
POVERTY AND
INEQUALITY
POLITICAL AND
INSTITUTIONAL
DRIVERS
ECONOMIC AND
SOCIOCULTURAL
DRIVERS
DEMOGRAPHIC
DRIVERS
FOOD SYSTEMS
SYSTEMS SUPPORTING
FOOD PRODUCTION
FOOD SUPPLY
CHAINS
CONSUMER
BEHAVIOUR
DIETS
• QUANTITY
NUTRITION
AND
HEALTH
• QUALITY
• DIVERSITY
AFFORDABILITY
OF HEALTHY DIETS
• SAFETY
• ADEQUACY
BROADER
IMPACTS
FOOD ENVIRONMENTS
POLICY AND GOVERNANCE
FOOD SECURITY: AVAILABILITY - ACCESS - UTILIZATION - STABILITY - AGENCY - SUSTAINABILITY
SOURCE: Adapted from HLPE. 2020. Food security and nutrition: building a global narrative towards 2030. A report by the High Level Panel of Experts on
Food Security and Nutrition of the Committee on World Food Security. Rome.
negative or positive effects on the environment.
A disconnected approach is unable to address
the interconnected nature of the challenges,
both within food systems and also in the
intersection of food systems and other systems,
including environmental, health and social
protection systems.
(availability, access, utilization and stability), as well
as the two additional dimensions of agency and
sustainability. u These drivers have impacts on
attributes of diets (quantity, quality, diversity, safety
and adequacy) and nutrition and health outcomes
(nutrition and health). While Figure 14 includes
other drivers in addition to those identified in
Figure 14 presents a food systems diagram to
illustrate how the drivers behind recent food
security and nutrition trends specifically create
multiple impacts throughout food systems ( food
systems, including food environments), leading to
impacts on the four dimensions of food security
u While these two new dimensions are proposed by the High Level
Panel of Experts (HLPE) of the Committee on World Food Security
(CFS), they are not formally agreed upon by FAO or other bodies, nor is
there an agreed language on the definition. However, due to their
relevance in the context of this report, they are included here. For
definitions, see Annex 6 Glossary in this report.
| 53 |
CHAPTER 3 MAJOR DRIVERS OF RECENT FOOD SECURITY AND NUTRITION TRENDS
this report, such as demographic drivers v and
technolog y and innovation drivers, w these are not
elaborated upon as these tend to be long-term
drivers in their effects on food security and
nutrition, whereas in this report we focus more on
the short term. The report specifically focuses on
the major drivers (dark blue boxes in Figure 14) that
are behind the recent rise in hunger and slowdown
in progress in reducing all forms of malnutrition.
The orange text in parenthesis throughout this
section refers to specific element names in Figure 14
for emphasis and to ease cross-referencing with
the figure.
tend to create multiple, compounding impacts on
food systems that negatively affect food securit y
and nutrition. Because the drivers coexist and
interact, this complexit y must be fully understood
and addressed when designing programme and
policy responses.
For example, as shown in the 2017 edition of
this report, conflict negatively affects almost
every aspect of food systems, 1 from production,
harvesting, processing and transport to input
supply, financing, marketing and consumption.
Direct impacts can be significant, particularly
in regard to the destruction of agricultural and
livelihood assets (such as land, livestock, crops,
seed stocks or irrigation infrastructure), the
forced or corrupt seizure of natural resources,
and displacement from land, livestock grazing
areas and fishing grounds. When conflict and
civil insecurity severely disrupt and restrict trade
and movements of goods and services, there can
also be a negative effect on the availability of
food, including nutritious foods that constitute
a heathy diet, and upward pressure on prices
of traded goods, which negatively affects food
access and food utilization at the household level.
Conflict disrupts the flow of food, funds, labour
and other essential items through markets; creates
shortages; and contributes to price hikes, thereby
damaging market functionality. Conflicts can
also erode finances for social protection and
healthcare and so damage health and nutrition. 1
The diagram also accounts for circular feedback
loops that can create compounding impacts
that occur over time. For example, economic
downturns that reduce the affordability of
nutritious foods and increase the consumption
of unhealthy diets not only negatively affect
people’s nutrition and health, but can also
(as shown in the 2020 edition of this report)
contribute to broader effects on the environment
and climate change, through increased
greenhouse gas (GHG) emissions.
Rather than one single
impact, drivers tend to create
multiple, compounding
impacts on food systems
In Figure 14, conf lict
( political and institutional
drivers), climate
variabilit y and
extremes ( bio-physical
and environmental drivers),
economic slowdowns and downturns (economic
and market drivers), and povert y and inequalit y
(economic and sociocultural drivers) are external
drivers that act upon food systems (yellow box).
Rather than one single impact, these drivers
Similarly, the 2018 edition of this report analysed
how climate variability and extremesx create
multiple and compounding impacts on food
systems. 3 They negatively affect agricultural
productivit y (crop yields and cropping intensit y),
and also affect food imports as countries tr y
to compensate for domestic production losses.
Medium- and large-scale climate-related
disasters can lead to significant impacts across
the food value chain, with negative consequences
on sector growth and on food and non-food
agro-industries. Food price spikes and volatilit y
tend to follow climate extremes (often in
combination with losses in agricultural income),
v Population dynamics and urbanization are expected to result in
growing populations and increasing food demand. These changes are
most evident in sub-Saharan Africa and South Asia. In addition to
population growth, other factors relative to the different locations – for
example, ageing in rural areas and changes in high-income countries –
are also important. Other social aspects, such as spatial location or
gender, are also subject to change as a result of internal and
international migration. 321
w For example, currently, several technologies in agri-food systems
contribute to degradation of natural resources. This is due to intensive
production systems focusing on profitability over environmental
aspects. Technical progress, including the emergence of more
“systemic” technologies, digitalization, biotechnologies and other
innovative approaches, implies opportunities to achieve the dual aim of
producing sufficient food and safeguarding the environment. Research
is ongoing to ensure safety and acceptability, gender-balanced access
and inclusion of low-income countries to avoid technological divides. 321
x While increasing climate variability and extremes can be attributed
to climate change, in this chapter we do not focus on the cause of the
increase, but analyse the occurrence of climate variability and extremes
and their association with food insecurity and malnutrition. See the
2018 edition of this report for further details.
| 54 |
THE STATE OF FOOD SECURITY AND NUTRITION IN THE WORLD 2021
reducing access to food and negatively affecting
the quantit y, qualit y and dietar y diversit y of
food consumed. In addition, more erratic rainfall
and higher temperatures jeopardize the qualit y
and safet y of food and increase instances of
crop contamination and outbreaks of pests and
diseases. y Nutrition is highly susceptible to
changes in climate and bears a heav y burden as
a result, as seen in the impaired nutrient qualit y
and dietar y diversit y of foods produced and
consumed, the impacts on water and sanitation,
and the effects on patterns of health risks and
disease, as well as changes in maternal care,
child care and breastfeeding. 3
(e.g. reduced abilit y to invest in the next planning
cycle) and because of urban–rural linkages.
These impacts can be especially harmful to
countries lagging behind in terms of economic
development, as the food and agriculture sectors
account for substantial shares of employment
and output in these countries. The need to
change consumption patterns can lead v ulnerable
households to shift away from nutritious foods
towards more energ y-dense foods with minimal
nutritional value, or to cut spending on a range of
basic ser vices for health and disease prevention.
Economic slowdowns and downturns also reduce
the fiscal space for government to provide
support to the poor.
Economic slowdowns and downturns, in turn,
primarily impact food systems through their
negative effects on people’s access to food,
including the affordabilit y of healthy diets,
as they lead to rises in unemployment and
declines in wages and incomes. 5 This is the case
irrespective of whether they are driven by market
swings, trade wars, political unrest, or a global
pandemic such as COV ID-19 ( Box 7). As shown
in the 2019 edition of this report, for countries
dependent on primar y commodit y trade, food
securit y and nutrition is especially v ulnerable
when economic slowdowns and downturns are
linked to international trade shocks. 5 In all
countries, the poor who spend a large share of
their income on food and depend on markets
for a significant portion of their diets, are
especially v ulnerable to economic slowdowns
and downturns. z With reduced incomes, healthy
diets become even more unaffordable, due to the
higher relative cost compared with a basic diet.
The unaffordability of healthy dietsaa is regarded
here as an internal driver resulting from the effect
of other drivers or factors that directly affect
the cost of nutritious foods throughout the food
system. Affordabilit y of a diet is determined
by the cost of food relative to people’s income.
As such, this internal driver acts within food
systems, and more specifically within food
environments ( food environment, affordability of
healthy diets) to negatively affect food securit y
and nutrition ( Figure 14). Food environment refers
to the physical, economic, sociocultural and
policy conditions that shape access, affordabilit y,
safet y and food preferences. 58,67,68,69 Clearly, the
unaffordabilit y of healthy diets can be driven
by income changes (which can in turn be driven
by conf lict, climate variabilit y and extremes,
and economic slowdowns or downturns, among
others), as well as determined by supply and
demand factors within the food system that affect
food prices. 7
The impacts of economic slowdowns and
downturns can also be felt particularly hard
in the food and agriculture sectors, both
because of what happens within the sector
As shown in the 2020 edition of this report, the
factors that drive the cost of nutritious foods
are found throughout the food system. On the
food production or supply side, low levels of
productivity, 70,71 high production risks and
insufficient diversification towards the production
of more nutritious foods are key drivers of the
cost of healthy diets, especially in low-income
countries. In food supply chains, inadequate food
handling and storage, 72 poor road infrastructure 7 »
y For example, higher intensity rainfall can create conditions that lead
to mould growth and the subsequent contamination of crops in the field
with mycotoxin contamination, while higher temperatures can lead to
pest and fungi development during storage. Climate extremes such as
temperature and humidity alter survival and transmission patterns and
can lead to increased bacterial, viral and pathogenic contamination in
water (for both consumption and for irrigation of crops) and food. See
FAO (2018), 3 p. 74.
z In a review of studies of dietary diversity that included a measure of
market access and production diversity, five of six studies showed a
statistically significant positive relationship between market access and
dietary diversity in at least some models. 322
aa For the definition of a healthy diet, see Chapter 1, Section 2.1
Affordability of healthy diets: a link between food security and
nutritional outcomes.
| 55 |
CHAPTER 3 MAJOR DRIVERS OF RECENT FOOD SECURITY AND NUTRITION TRENDS
BOX 7 IMPACT CHANNELS OF THE COVID-19 PANDEMIC ON FOOD SECURITY AND NUTRITION
©FAO/Ismail Taxta
recent past. People employed in the informal sector
in many countries around the world saw their incomes
significantly reduced or disappear. In high-income
countries, governments provided support to employers
to retain employees, albeit at reduced salaries.
While food supply chains have proven to be more
robust than originally predicted, the pandemic is
eroding people’s ability to purchase food as they lose
their incomes and livelihoods. As a result, not only are
more people unable to afford healthy diets, increasing
their risk of any form of malnutrition, but more people
are going hungry because they lack sufficient quantities
of food. In addition, school closures have led to the
suspension of critically important school food and
nutrition programmes. Food assistance programmes
such as food banks and various other initiatives have
experienced a significant and continuous increase
in demand for their services throughout 2020, in
both developing and developed countries. This rise
in demand stems from income loss and subsequent
increased unaffordability of foods resulting in many
more people depending on food assistance to maintain
a healthy diet and avoid food insecurity.
This economic downturn translates directly into
increased unaffordability of food and greater food
insecurity and malnutrition – as people have less
income to buy food, let alone more expensive nutritious
foods required for healthy diets. Migrant workers have
been affected by lockdowns, trade disruptions, layoffs
and illness,76 although remittances sent to their home
countries show a smaller decline than previously
predicted.77 Women have been particularly hard hit
by the economic and social fallout of the COVID-19
pandemic. The pandemic has pushed more women
into extreme poverty than men, with women also
facing higher job losses, shrinking work hours and
greater care burdens.74 As highlighted in Chapter 2,
the gender gap has grown even larger in the year of the
pandemic – with the prevalence of moderate or severe
food insecurity being 10 percent higher among women
than men in 2020, compared with 6 percent in 2019.
(see Chapter 2, Figure 6).
But the COVID-19 pandemic is not only having
multiple demand-side effects on access to food; there
are also supply-side effects that are negatively affecting
people’s capacity to access food and healthy diets.
These include border closures, travel restrictions,
quarantines, and market, supply chain and trade
disruptions. These negative effects restrict people’s
physical access to sufficient, diverse and nutritious
The COVID-19 pandemic and the measures put in
place to counter it have delivered one of the most
devastating blows to global food security and nutrition
in recent times, with multiple impacts on food systems
(Figure 14) and the channels through which food systems
affect diets, including the affordability of healthy diets
(systems supporting food production, food supply chains,
food environments, consumer behaviour).74 The number
of people suffering from chronic hunger in the world, as
measured by the prevalence of undernourishment (PoU),
increased by up to 161 million more people in 2020 –
the largest single-year increase in decades (Figure A).
Additionally, by the end of 2020, at least 155 million
people suffered from acute food insecurity* requiring
urgent humanitarian assistance in 55 countries/
territories (Integrate Food Security Phase Classification/
Cadre Harmonisé [IPC/CH] Phase 3 or above).75 Of
these, economic shocks were a primary driver of acute
food insecurity in 17 food crisis countries affecting
40 million people in Crisis or worse (IPC/CH Phase 3
or above). By comparison, in 2019, economic shocks
constituted the primary driver in just eight countries
with around 24 million people in Crisis or worse (IPC/CH
Phase 3 or above), or equivalent.
The most destructive effects of the COVID-19
pandemic on food security and nutrition emanate
from the unprecedented reach and scale of the
economic downturns caused by the pandemic
containment measures (economic and market drivers).
These plunged the world and most countries into
economic recession in 2020, with per capita incomes
contracting in more countries than at any time in the
* Acute food insecurity is a severe form of food insecurity that threatens lives and/or livelihoods, requiring urgent humanitarian assistance. Generally, it
reflects short-term fluctuations, typical of acute crises, which are the main focus of the indicators. On the other hand, chronic food insecurity is food
insecurity that persists over time mainly due to structural causes. This measure has relevance in providing strategic guidance to actions that focus on the
medium- and long-term improvement of the quality and quantity of food consumption for an active and healthy life. See Box 5 in FAO, IFAD, UNICEF, WFP
and WHO (2019) 5 for a discussion of the comparison of different objectives and assessments of acute and chronic food insecurity indicator measures.
| 56 |
THE STATE OF FOOD SECURITY AND NUTRITION IN THE WORLD 2021
BOX 7 (CONTINUED)
FIGURE A THE COVID-19 PANDEMIC CONTRIBUTED TO THE LARGEST SINGLE-YEAR
INCREASE IN GLOBAL HUNGER IN DECADES
1 000
140
160.7
900
800
120
100
117.6
80
700
600
60
500
40
20
17.6
21.7
18.3
8.2
70
16.9
0
400
300
-20
200
NUMBER OF UNDERNOURISHED (MILLIONS)
ANNUAL CHANGE IN NUMBER OF UNDERNOURISHED (MILLIONS)
160
-40
100
-60
-80
2000 2001 2002 2003 2004 2005 2006 2007 2008 2009 2010
2011
2012 2013
2014
2015
2016
2017
2018 2019 2020
Annual change in NoU pre-COVID-19 (left axis)
Annual change in NoU in 2020, lower bound (left axis)
Number of undernourished people (right axis)
Annual change in NoU in 2020, middle point (left axis)
0
Annual change in NoU in 2020, upper bound (left axis)
NOTES: The blue bars show the annual change in the number of undernourished people (NoU) between 2000 and 2019 (left y-axis). Selected numbers in
correspondence of the blue bars denote the highest annual changes in the NoU. The orange line shows the total number of undernourished people in
2000–2019 (right y-axis). The stacked bar for year 2020 shows the additional number of undernourished people in 2020, which ranges from 70 million
people (lower bound) to 160.7 million people (upper bound).
SOURCE: FAO for NoU and PoU.
impacts may be less than expected and more evidence
is needed, there are some reports of food losses and
waste, especially of fruits and vegetables, fish, meat
and dairy products.80 Furthermore, travel restrictions
are causing severe labour shortages in food and
agriculture production and processing industries,
leading to production and supply disruptions.
Moreover, school closures have led to missed meals
normally provided through school food and nutrition
programmes. As a response, some countries have
started door-to-door meal delivery service to children.**
The COVID-19 pandemic and related containment
measures have exacerbated other drivers, widened
inequalities, and exposed structural vulnerabilities of
local and global food systems. While the COVID-19
sources of food, especially in countries hit hard by the
pandemic or already affected by high levels of food
insecurity and malnutrition. High-value perishable
commodities are going to waste along the chains, as
essential workers in food and agriculture are barred
from crossing borders and food supply chains are
being disrupted. Closure of markets, including informal
markets, also exacerbates the unaffordability of
healthy diets.
The adverse effects of the pandemic physical
distancing measures have tended to be more
immediate and pronounced for highly perishable
fruits and vegetables, for which production and trade
are more labour-intensive as compared with other
food commodities such as staple foods.78,79,80 While
** There are a number of other impacts not highlighted, including observed changes in purchasing patterns in favour of products with longer shelf lives
and often poorer nutrition profiles, which could lead to higher levels of undernutrition, as well as overweight and obesity. Although many negative
consequences have been noted, positive consequences have also been observed such as increased opportunities for online food purchases, home
delivery of meals to the elderly, or setup of community kitchens to serve free meals to vulnerable populations.
| 57 |
CHAPTER 3 MAJOR DRIVERS OF RECENT FOOD SECURITY AND NUTRITION TRENDS
BOX 7 (CONTINUED)
pandemic is itself driving a global economic downturn,
it has negatively affected several regions of the world
while interacting with conflict or climate variability
and extremes, or a combination of both (see analysis
below and Figures 19 and 24) as well as more localized
drivers, such as the locust outbreaks in East Africa
(Kenya and Somalia) and South Asia (India and
Pakistan). It has also combined to worsen food
crises in emergency contexts.75 For example, acute
food insecurity requiring emergency response has
increased in El Salvador, Honduras and Nicaragua
due to the double impact of hurricanes Eta and Iota
and the economic effects of the COVID-19 pandemic.
In the Democratic Republic of the Congo and South
Sudan, the combined effects of conflict and climate
variability and extremes, including droughts, cyclones
or seasonal flooding, have been aggravated by the
economic effects of the pandemic.75,81
The global economic recession that started in
2020 is extending into 2021 for many countries,
with regional and international trade impacts,
record levels of unemployment, lost livelihoods
and rising poverty levels in many countries around
the world.82,25,10 The uneven pace of recovery
from the effects of the COVID-19 pandemic and
containment measures will mean that some
countries will continue to face significant food
security and nutrition challenges related to these
in 2021, and possibly beyond, especially in
contexts where this is combined with conflict and
climate-related disasters. As shown in Figure 24, in
2020, in countries affected by economic downturns
combined with climate-related disasters and
conflict, increases in undernourishment were
more than five times greater than in countries only
affected by economic downturns.
» and limited food preser vation capacity lead to
broader sense (i.e. multidimensional), including
inequalit y in access to resources (land, water)
and basic ser vices (health, education, etc.).
Their impacts are felt throughout food systems
and food environments, ultimately affecting the
affordabilit y of healthy diets and food securit y
and nutrition outcomes. The 2019 edition of this
report analysed the nexus between economic
growth, povert y, and food securit y and nutrition,
factoring in inequalit y. Analysis reconfirmed
that economic slowdowns and downturns are
associated with increases in food insecurit y, but
also showed that not only does income inequalit y
increase the likelihood of food insecurit y, but
high income inequalit y amplifies the negative
effect of economic slowdowns or downturns on
individual food securit y. 5,6
food losses (especially for highly perishable
foods) 73 and inefficiencies along the food supply
chain that drive up the cost of nutritious foods. 7
On the demand side, food environments influence
consumer behaviour; moreover, the preferences
of consumers also represent an important factor
driving the cost and affordability – and the
availability – of healthy diets. 7 Rapid rates of
urbanization have resulted in more work-away
and eat-away-from-home habits, with a direct
impact on the demand for easy-to-prepare, highly
processed foods or convenience foods that are
often energ y dense and high in fat, sugar and/or
salt. Such foods have also become more widely
available and affordable, but do not necessarily
contribute to healthy diets. However, consumer
demand can also be a positive force: for example,
increased demand can also encourage production
of nutritious foods, making it more available at a
lower cost.
Beyond their direct
There are circular
impacts on food
interconnected impacts of
systems, these major
drivers on other systems,
global drivers weaken
including
environmental and
food securit y and
nutrition through
health systems
interconnected and
circular impacts on other systems, including
environmental and health systems. For example,
as explored in depth in the 2020 edition of this
report, diets of poor qualit y and insufficient
quantit y have broader impacts on human health
and the environment, including increased
morbidit y, mortalit y and the social costs
associated with multiple forms of malnutrition,
Inequality and sociocultural
stratification magnify the
negative effects of other
drivers
Poverty and
inequality (economic
and market drivers)
and sociocultural
stratification and
empowerment,
including gender and power dynamics
(sociocultural drivers), are important external factors
( Figure 14) that tend to magnif y the negative
effects of other drivers. Importantly, inequalit y
is related to economic and market drivers in a
| 58 |
THE STATE OF FOOD SECURITY AND NUTRITION IN THE WORLD 2021
marketing policies, can also shape healthier
food environments.
including stunting, wasting, micronutrient
deficiencies, overweight and obesit y, as
well as costs associated with environmental
degradation and GHG emissions (broader
impacts: economic, socio-economic, environmental )
( Figure 14).
On the other hand, some economic policies may
result in an economic slowdown, or governance
may trigger conf lict. For example, protectionar y
trade measures and input subsidy programmes
tend to protect and incentivize the domestic
production of staple foods, such as rice and
maize, often to the detriment of more nutritious
foods, such as fruits and vegetables. 7,8 4,85
These measures and programmes can also
keep the cost of fruits and vegetables above
the world market rate or restrict farmers to
just producing the staple crops – both of which
also reduce consumer access to a diverse diet.
Similarly, liberalization of trade and investment
rules can also reshape food systems and thus
inf luence food securit y and nutrition in both
positive and negative ways – whether by
improving access to diverse, nutritious foods or
by increasing the availabilit y and affordabilit y
of foods that are high in fat, sugar or salt.
Finally, non-tariff trade measures can help
improve food safet y, qualit y standards and
the nutritional value of food, and minimize
any unintended consequences, but they can
also drive up the costs of trade and hence food
prices, negatively affecting the affordabilit y of
healthy diets. 7
Current food consumption patterns are a
leading cause of morbidit y and disabilit y
– with poor diets accounting for 8 million
premature deaths globally ever y year 83 – which
require higher spending on healthcare, placing
significant burdens on national healthcare
systems and economies. 59 The 2020 edition
of this report estimated that if current food
consumption patterns continue, diet-related
health costs linked to NCDs and their mortalit y
are projected to exceed USD 1.3 trillion per
year by 2030. 7 At the same time, current food
consumption patterns are leading to significant
environmental impacts and associated costs.
The diet-related social costs (i.e. economic costs)
of GHG emissions associated with current
dietar y patterns is projected to exceed
USD 1.7 trillion per year by 2030. 7
These broader impacts – and their repercussions
on other systems – are important as they fuel
a circular feedback loop impacting drivers that
affect the food system, for example in the way
diets affect GHG emissions, which are a driver of
climate change that then affects the food systems
( bio-physical and environmental drivers) ( Figure 14).
Other factors that
need to be taken into
consideration are the
policies and governance
– including legislation
and finance – that
shape food systems,
and hence food
securit y and nutrition
outcomes ( policy and governance) ( Figure 14). They can
be a positive force, but also a negative one.
It is, however, not only about having the right
policies; governance, legislation and institutions
are key to the implementation of policies and
to ensuring they consider the impacts on all
dimensions of food securit y and nutrition (policy
coherence) and on all stakeholders, especially the
most v ulnerable. For policies to be enforceable,
they need to be grounded in legislation. This
highlights the importance of an enabling
legislative environment for food securit y and
nutrition. Such a legal framework is composed of
complex networks of interlinked legal areas and
is best construed through a food systems lens to
ensure consistency and coherence.
For example, food and agricultural policies
have the power, either directly or indirectly,
to positively affect the availabilit y, access to
and cost of nutritious foods. Policy measures,
including food standards, fiscal, labelling,
reformulation, public procurement and
In particular, it is also ver y important to consider
institutional deficits and power imbalances.
For example, poorer households, even net-food
sellers, are exposed to volatilit y in food prices,
owing to their weak bargaining position in
food chains that keeps them from capturing
Governance and policy
shape how food systems
function and the outcomes
they produce, including
both positive and negative
food security and nutrition
outcomes
| 59 |
CHAPTER 3 MAJOR DRIVERS OF RECENT FOOD SECURITY AND NUTRITION TRENDS
3.2
the benefits from higher prices. 86 The agency
dimension of food securit y is also key to
addressing power asymmetries and reducing
inequalit y, for example, by enhancing the
participation of the rural poor in food systems
transformation and its benefits. Agency goes
beyond access to material resources in that it
includes empowerment – the abilit y of people
to take actions that help improve their own
well-being, including food securit y and nutrition,
as well as their abilit y to engage in societ y in
ways that wield inf luence. 58
IMPACT OF MAJOR
DRIVERS ON FOOD
SECURITY AND
NUTRITION
As highlighted above, conf lict, climate variabilit y
and extremes, and economic slowdowns and
downturns can negatively affect food securit y
and nutrition through their impacts on our food
systems. As a result, all dimensions of food
securit y and nutrition are likely to be affected,
including food availabilit y, access, utilization and
stabilit y. This is corroborated by the association
found between the occurrence of these drivers
and the food securit y and nutrition indicators, as
we detail in this section.
These drivers differ from countr y to countr y
and even within countries, and in the way they
interact. They also increase and decrease in
intensit y, and may disappear altogether for a
time. However, what is common across countries
is the lack of resilience of food systems to the
negative effects of these drivers and their lack
of capacit y to deliver food securit y and good
nutrition under these circumstances.
Drivers are increasing in frequency and
intensity, undermining food security
and nutrition
Analysis shows that this food systems
v ulnerabilit y is further compromised and made
worse by high and persistent levels of inequalit y
– in terms of income, productive assets and basic
ser vices (e.g. health, education). Income and
wealth inequalities are closely associated
with access to food and, as a consequence,
to hunger. If we are to end hunger, food
insecurit y and malnutrition in all its forms, food
systems need to be transformed and inequalit y
reduced in order to strengthen resilience to
the negative effects of these drivers. A food
systems approach is necessar y to overcome the
complexit y of this challenge, by gaining an
understanding of the interrelationships among
key drivers and their negative impacts to help
formulate appropriate solutions. Only then will
a global transformation be possible to achieve
well-functioning, resilient food systems that
deliver affordable healthy diets. n
In the last ten years, the frequency and intensit y
of conf lict, climate variabilit y and extremes,
and economic slowdowns and downturns have
increased and are undermining food securit y
and nutrition around the world. Of particular
concern are low- and middle-income countries
because the negative impacts on food securit y
and nutrition are greatest in these countries:
they carr y the biggest burden of the world’s
population who are undernourished (13 percent)
and children who are stunted (24 percent).
Further, these countries experience multiple
forms of malnutrition, including child
overweight (6 percent) and adult obesit y
(18 percent).
High-income countries also face the increased
occurrence of some of these major drivers,
notably climate variabilit y and extremes, and
economic slowdowns and downturns. In the
context of these countries, some people will
become food insecure and malnourished as a
result of the drivers, particularly during the
COV ID-19 pandemic. However, the analysis here
focuses on low- and middle-income countries,
| 60 |
THE STATE OF FOOD SECURITY AND NUTRITION IN THE WORLD 2021
FIGURE 15 LOW- AND MIDDLE-INCOME COUNTRIES FACE INCREASING FREQUENCY
AND INTENSITY OF DRIVERS
40
700
38
36
600
34
500
32
30
400
28
300
26
200
24
100
22
20
0
2000–2004
2005–2009
PERCENTAGE OF COUNTRIES EXPOSED TO THREE
OR FOUR CLIMATE EXTREMES
Total number of conflicts
2010–2014
2015–2019
PERCENTAGE OF TIME COUNTRIES WERE
EXPOSED TO CONFLICTS
800
Percentage of time countries were exposed to conflict
B) CLIMATE EXTREMES (2000–2020)
60
100
90
50
80
70
40
60
30
50
40
20
30
20
10
10
0
0
2000–2004
2005–2009
2010–2014
Percentage of countries exposed to three or four different types of climate extremes
PERCENTAGE OF COUNTRIES EXPOSED
TO CLIMATE EXTREMES
NUMBER OF CONFLICTS
A) CONFLICTS (2000–2019)
2015–2020
Percentage of countries exposed to climate extremes
6
Conflict
4
where the major drivers exhibit the most
2
significant
impacts on hunger and malnutrition.
0
There has been a notable and significant
-2
increase
in the frequency and intensit y of
conf lict, climate variabilit y and extremes, and
-4
economic slowdowns and downturns in the
-6 years among low- and middle-income
last ten
countries ( Figure 15). For our analysis of the latter
-8
two drivers,
we focus
specifically
on
climate2015
2011
2012
2013
2014
extremes and economic downturns.
GDP per capita growth: sub-Saharan Africa,
Latin America, Western Asia
GDP per capita growth: other subregions
2016
60
30
The number of countries, as well as the specific
countries, experiencing violent conf licts has0
remained fairly stable over the last ten years.-30
However, there is a marked increase in the
-60
number of conf licts per year and the percentage
of time countries experienced conf lict ( Figure -90
15A).
There has also been a resurgence in the number
-120
of violent conf licts, with conf lict-related
-150
deaths
increasing
from
an all-time
low
in
2017
2018
2019
2020
2021
2005. The number of conf licts that include
Percentage of countries with economic downturns:
sub-Saharan Africa, Latin America, Western Asia
| 61 |
90
PERCENTAGE OF COUNTRIES WITH
ECONOMIC DOWNTURNS
ANNUAL PER CAPITA GDP GROWTH (%)
C) ECONOMIC DOWNTURNS (2011–2021)
Percentage of countries with economic downturns: other subregions
80
70
40
60
30
50
40
CHAPTER
3 MAJOR DRIVERS OF RECENT FOOD SECURITY AND NUTRITION TRENDS
20
30
20
10
10
0
0
2000–2004
2005–2009
2010–2014
PERCENTAGE OF COUNTRIES EX
TO CLIMATE EXTREMES
PERCENTAGE OF COUNTRIES EXPOSE
OR FOUR CLIMATE EXTREM
50
2015–2020
of countries exposed to three or four different types of climate extremes
FIGURE 15 Percentage
(CONTINUED)
Percentage of countries exposed to climate extremes
6
90
4
60
2
30
0
0
-30
-2
-60
-4
-90
-6
-120
PERCENTAGE OF COUNTRIES WITH
ECONOMIC DOWNTURNS
ANNUAL PER CAPITA GDP GROWTH (%)
C) ECONOMIC DOWNTURNS (2011–2021)
-150
-8
2011
2012
2013
2014
2015
2016
2017
2018
2019
2020
2021
GDP per capita growth: sub-Saharan Africa,
Latin America, Western Asia
Percentage of countries with economic downturns:
sub-Saharan Africa, Latin America, Western Asia
GDP per capita growth: other subregions
Percentage of countries with economic downturns: other subregions
NOTES: Figure 15A shows the total number of violent conflicts in the five-year subperiods that were caused by internal or intrastate conflict (blue bars), and
the percentage of time countries were exposed to conflict (yellow line). Globally, 98 countries were affected by conflict during 2000–2019. Figure 15B
shows the percentage of countries where at least one climate extreme (yellow line) occurred, and the percentage of countries exposed to three or four
climate extremes (orange bars). There are 127 low- and middle-income countries with information available on climate extremes. Figure 15C refers to the
occurrence of economic downturns, for years 2011–2019 and 2020–2021, respectively. There are 129 low- and middle-income countries with
information available on GDP per capita growth: 71 countries in sub-Saharan Africa, Latin America and Western Asia, and 58 countries in the other
regions. See Annex 3 for methodology.
SOURCES: Violent conflict data based on the Uppsala University. 2021. Uppsala Conflict Data Program (UCDP). In: UCDP [online]. Uppsala, Sweden.
[Cited 10 June 2021]. ucdp.uu.se; for years 2000–2005 updated drought provided by UCT using data from the European Centre for Medium-Range
Weather Forecasts (ECMWF). 2021. Datasets. In: ECMWF [online]. Reading, United Kingdom. [Cited 10 June 2021].www.ecmwf.int/en/forecasts/datasets
and for years 2006–2020 provided by EU-JRC using data from the European Commission. 2021. Anomaly Hotspots of Agricultural Production (ASAP). In:
ASAP [online]. Brussels. [Cited 10 June 2021]. mars.jrc.ec.europa.eu/asap; updated flood data provided by UCT using Climate Hazards Center of the
University of California - Santa Barbara. 2021. CHIRPS: Rainfall estimates from rain gauge and satellite observations. In: CHIRPS [online]. Santa Barbara,
USA. [Cited 10 June 2021]. www.chc.ucsb.edu/data/chirps; updated heat spell data provided by UCT using data from the European Centre for MediumRange Weather Forecasts (ECMWF). 2021. Datasets. In: ECMWF [online]. Reading, United Kingdom. [Cited 10 June 2021]. www.ecmwf.int/en/forecasts/
datasets; updated storm data based on Centre for Research on the Epidemiology of Disasters (CRED). 2021. EM-DAT: the international disasters
database. In: EM-DAT [online]. Brussels. [Cited 10 June 2021]. public.emdat.be; annual per capita GDP based on IMF. 2021. World Economic Outlook
Database - April 2021. In: IMF [online]. Washington, DC. [Cited 10 June 2021]. www.imf.org/en/Publications/WEO/weo-database/2021/April
one-sided, state- and non-state violence have
increased dramatically (by 86 percent since
2010, and at 145 conf licts as of 2019) ab and now
are at an all-time high. 1 These increases have
been accompanied by increasing numbers of
displaced people. The number of refugees and
internally displaced persons (IDPs) has increased
significantly with the increase in conf licts, nearly
doubling from 40 million in 2010 to more than
70 million in 2019; this number reached more
than 80 million in 2020. 87,88
The nature of conf lict is also changing
– conf licts are becoming more complex,
protracted and intractable. Internal conf licts
have surpassed the number of interstate
conf licts and there is a significant rise in
internationalized internal conf licts (internal
conf licts that have spread to involve other
nations). 87,88 Coupled with large outf lows of
displaced people and the entanglement of
external international actors, conf licts are
also increasingly a regional problem, with
cross-border armed networks that are all
too ready to share resources to further their
ab Data are not updated to 2020 because at the time of writing, the
Uppsala Conflict Data Program (UCDP) dataset was only updated to 2019.
| 62 |
THE STATE OF FOOD SECURITY AND NUTRITION IN THE WORLD 2021
common goals. ac Conf licts also tend to have
multiple layers in many countries, making
concepts like onset and cessation analytically
difficult to disentangle in practice. Even in
post-conf lict contexts, violence can simply
change its form as settings, actors and drivers
change. 89 Sometimes the factors that lead to a
conf lict may not disappear when the conf lict is
seemingly over; what is more, conf licts can take
on a cyclical nature if underlying causes are not
addressed. ad
by 39 percentage points for countries in Africa,
from 10 percent in 2000 –2004 to 49 percent in
2015 –2020. Similarly, the percentage of Asian
countries experiencing multiple t y pes of climate
extremes increased to 57 percent in 2015 –2020,
up from 11 percent in 2000 –2004. The intensit y
of climate extremes in Latin America and
the Caribbean also moved from 9 percent in
2000 –2004 to 57 percent in 2015 –2020.
Climate extremes
Even before the COV ID-19 pandemic, global
economic reports had highlighted that economic
slowdowns, stagnation and outright recessions
were evident in several economies and already
leading to increased unemployment and
declines in income. 5,90,91 The economic growth
rate, as measured by the percent variation of
real GDP per capita growth from one period
to another, is t y pically used to gauge whether
an economy is slowing down or contracting.
In most regions, this rate rebounded after the
sharp 2008 –2009 global economic downturn.
But the recover y was uneven and short lived, as
many countries experienced generally declining
trends in growth since 2011. Since 2014,
poor and uneven growth has been especially
pronounced in sub-Saharan Africa, Latin
America and Western Asia. The percentage of
countries experiencing economic downturns
within these regions increased from 25 percent
in 2014 to 38 percent in 2019. As a result, these
regions experienced a severe reduction in their
GDP per capita growth compared with other
regions from 2014 to 2019 ( Figure 15C).
Economic downturns
Countries face increasing climate variabilit y
and more frequent climate extremes, linked
in part to climate change. 4 The number of
low- and middle-income countries exposed to
climate extremes has steadily been on the rise
over the past twent y years, from 76 percent
of countries in 2000 –2004 to 98 percent
in 2015 –2020. More strikingly, countries’
exposure to climate extremes has significantly
magnified in terms of intensit y (three or four
t y pes of climate extremes in a five-year period)
( Figure 15B). The frequency, or number of years a
countr y is exposed in each subperiod, increased
by 42 percentage points, from 30 percent in
2000 –2004 to 72 percent in 2015 –2019 (not
shown in fig ure). In terms of increasing
intensit y, 52 percent of countries were exposed
to three or four t ypes of climate extremes (heat
spell, drought, f lood, or storm) in 2015 –2020,
compared with 11 percent in 2000 –2004.
In other words, the number has almost
quintupled in the last 20 years (see Annex 3 for
definitions, methodolog y and data sources).
The measures put in place to contain the
COV ID-19 pandemic delivered a significant
economic hit, sending most countries
into recession during 2020. For low- and
middle-income countries, per capita income
contracted in 117 of 129 countries with
information available on GDP per capita
growth. Specifically, 94 percent of the countries
in sub-Saharan Africa, Latin America and
Western Asia experienced an economic
downturn in 2020, and 86 percent in other
regions ( Figure 15C). The 2020 global recession
proved to be the deepest in decades, despite
the extraordinar y efforts of governments to
counter the downturn with fiscal and monetar y
The analysis at the regional level confirms the
intensit y of climate extremes found at the global
level. For instance, the occurrence of three or
more t ypes of climate extremes has increased
ac The mapping of conflict events in Africa, across time and by
magnitude, draws a startling picture of their cross-border and regional
nature. These include some of the most protracted conflicts, including
those in the Horn of Africa, the Great Lakes region and in northern
Cameroon, Chad and northern Nigeria across the Sahel. But there are
also examples in other regions, such as in Afghanistan, India and
Pakistan in Asia. 2
ad For example, in Africa and Asia, actors of violence during conflict
and war often reconstitute themselves in post-conflict periods to take
economic and political advantage of fragile and vulnerable
environments.1,2
| 63 |
CHAPTER 3 MAJOR DRIVERS OF RECENT FOOD SECURITY AND NUTRITION TRENDS
FIGURE 16 WHILE POVERTY DECLINES AROUND THE WORLD, INCOME INEQUALITY REMAINS HIGH,
WITH AN INCREASE IN 2020 IN LOW- AND MIDDLE-INCOME COUNTRIES
AVERAGE POVERTY AND INCOME INEQUALITY (%)
50
40
30
20
10
0
2001–2005
Average poverty
2006–2010
2011–2016
2017–2018
2020
Average inequality (Gini index)
NOTES: The figure shows the average poverty and income inequality by five-year subperiods in low- and middle-income countries. Shaded columns for
year 2020 report IMF projections of the Gini index and poverty, as expressed by the percentage of the population living below USD 1.90 (PPP 2011).
Poverty projections for 2020 are based on the October World Economic Outlook database. Income inequality in 2020 is expressed as a median. Poverty
and inequality are shown for the sample of 133 low- and middle-income countries. See Annex 3 for definitions.
SOURCES: World Bank. 2021. World Development Indicators. In: World Bank [online]. Washington, DC. [Cited 24 April 2020]. datatopics.worldbank.org/
world-development-indicators for poverty and Gini index data between 2001–2018; and IMF. 2020. Fiscal Monitor: policies for the recovery. Washington,
DC. (also available at www.imf.org/en/Publications/FM/Issues/2020/09/30/october-2020-fiscal-monitor) for poverty and the Gini index data in 2020.
Poverty and inequality
policy support. While some countries have seen
their economies begin to recover in 2021, it is
forecasted that many will not. One of the factors
that will make recover y in 2021 less likely in
some countries is the growing external debt
burden, which could crowd out investments in
economic recover y and social protection, as a
result of which food securit y and nutrition could
worsen. The global economic recession that
started in 2020 has extended into 2021, with
record levels of unemployment, lost livelihoods
and rising povert y levels in many countries
around the world.
Povert y and inequalit y are critical underlying
structural factors that amplif y the negative
impact of conf lict, climate variabilit y and
extremes, and economic slowdowns and
downturns. While povert y has declined, income
inequalit y – as measured by the Gini index
– has remained high and persistent over the
last 20 years at the global level ( Figure 16).
As shown in the 2019 edition of this report,
a closer look at countr y level data shows that
income inequalit y is rising in nearly half the
countries in the world, including many low| 64 |
THE STATE OF FOOD SECURITY AND NUTRITION IN THE WORLD 2021
and middle-income countries. 5 As a region,
Latin America and the Caribbean shows the
most progress in reducing income inequalit y,
but still exhibits the highest levels of inequalit y
globally. ae For the first time in more than
20 years, povert y and income inequalit y at the
global level increased in 2020 as a result of the
COV ID-19 pandemic and the measures put
in place to contain it ( Figure 16). The number of
“new poor” (i.e. in addition to the number of
people who were already poor), resulting from
the pandemic was estimated to be between 119
and 124 million in 2020. In 2021, this number
is set to rise to between 143 and 163 million. 10
Income inequalit y increased from 38 to
41 percent in 2020.
inequalit y. For example, as shown in the 2018
edition of this report, climate variabilit y and
extremes contribute to greater risk of food
insecurit y and malnutrition, but if prolonged
or recurrent they lead to diminished coping
capacit y, loss of livelihoods, distress migration
and destitution. In other words, they not only
contribute to increased food insecurit y and
malnutrition, but can create and sustain povert y,
as well as contribute to increased inequalit y. 3af
This creates further circular associations,
contributing to increased food insecurit y and
malnutrition, as well as current and future
v ulnerabilit y to climate extremes.
The Dr y Corridor in Central America –
in particular in El Salvador, Guatemala
and Honduras – is highly v ulnerable to
climate-related disaster risks due to its
geographical location, high occurrence of
climate extremes, including recurrent droughts,
excessive rains and severe f looding, and
institutional and socio-economic weaknesses. 3,4
People’s livelihoods are ver y climate-sensitive,
with more than 1 million families relying on
subsistence farming. Moreover, levels of povert y,
inequalit y, food insecurit y and malnutrition are
alarming, particularly among rural populations
and Indigenous Peoples. The reoccurring and
increasing cycles of climate variabilit y and
extremes are not only a threat to food securit y
and nutrition, but often trigger large-scale
human displacement and migration – with those
left behind being mostly the elderly, women and
children. This exodus creates a breeding ground
for conf lict, and feeds a circular association
of increased povert y, inequalit y and greater
v ulnerabilit y to climate extremes.
Nexus between drivers and underlying
causes and interconnected circular
associations
Although the trends in the occurrence of
conf lict, climate variabilit y and extremes,
economic slowdowns and downturns, and
underlying causes of povert y and inequalit y are
presented separately, in fact, they often interact,
and tend to create interconnected circular
associations. For example, as highlighted in the
2017 edition of this report, conf lict can wreak
havoc on economic production and growth,
causing deep economic recessions. In turn,
economic recessions that drive up inf lation
and lead to sharp increases in food prices tend
to exacerbate the risk of political unrest, as
witnessed in 2007–2008 when food riots broke
out in more than 50 countries. 1 Similarly,
increasing climate variabilit y and extremes,
especially severe droughts, tend to jeopardize
food securit y in terms of food availabilit y and
access, which is found to increase the risk of
conf lict. 1
Disentangling the nexus, and the causal factors
between the drivers and underlying factors of
povert y and inequalit y, is often so complex and
challenging that it is not always clear which
comes first and what follows. However, it
is possible to obser ve the occurrence of the
drivers simultaneously or over time, and their
associated links with changes in food securit y
and nutrition.
There are also interconnected circular
associations between conf lict, climate variabilit y
and extremes, and economic slowdowns and
downturns – especially if these are severe,
prolonged or recurrent – and povert y and
ae Nonetheless, this progress in reducing income disparity in Latin
America and the Caribbean does not seem to be reflected in the
distribution of workers’ wages. See Figure 34 in FAO, IFAD, UNICEF,
WFP and WHO (2019) 5 and associated analysis.
af
| 65 |
Also see Charles, Kalikoski and Macnaughton (2019).113
»
CHAPTER 3 MAJOR DRIVERS OF RECENT FOOD SECURITY AND NUTRITION TRENDS
FIGURE 17 MORE THAN HALF OF LOW- AND MIDDLE-INCOME COUNTRIES EXPERIENCED INCREASING PoU
CHANGE POINTS IN CORRESPONDENCE WITH ONE OR MORE DRIVERS (CONFLICT, CLIMATE EXTREMES,
AND ECONOMIC SLOWDOWNS AND DOWNTURNS) BETWEEN 2010 AND 2018
20
DEMOCRATIC REPUBLIC
OF THE CONGO
GAMBIA
SAO TOME
AND PRINCIPE
DOMINICAN
REPUBLIC
SUDAN
GABON
INDONESIA
MEXICO
SOUTH AFRICA
TURKMENISTAN
ANGOLA
MAURITANIA
BELIZE
EGYPT
LEBANON
KIRIBATI
GEORGIA
PAKISTAN
YEMEN
CHAD
NUMBER OF COUNTRIES
15
VENEZUELA
(BOLIVARIAN
REPUBLIC OF)
10
5
0
CÔTE D’IVOIRE
DEMOCRATIC
REPUBLIC
OF THE CONGO
MALI
JORDAN
JAMAICA
RWANDA
COSTA RICA
GEORGIA
ECUADOR
BELIZE
SIERRA LEONE
SOUTH AFRICA
CENTRAL
AFRICAN
REPUBLIC
SUDAN
IRAQ
AFGHANISTAN
MOZAMBIQUE
BOTSWANA
MALAWI
LEBANON
CUBA
ANGOLA
VANUATU
GAMBIA
BURKINA FASO
AFGHANISTAN
HAITI
SURINAME
LESOTHO
LEBANON
GHANA
SOLOMON
ISLANDS
MADAGASCAR
PERU
2010
2011
2012
2013
VENEZUELA
CONGO
2014
Climate extremes
Conflict and climate extremes
Climate extremes and economic slowdowns and downturns
DEMOCRATIC
REPUBLIC
OF THE CONGO
BOLIVIA
INDIA
SRI LANKA
(PLURINATIONAL
STATE OF)
JORDAN
UNITED REPUBLIC
OF TANZANIA
CENTRAL AFRICAN
REPUBLIC
MADAGASCAR
COLOMBIA
PARAGUAY
MALI
MOROCCO
NEPAL
BRAZIL
THAILAND
KENYA
LESOTHO
NIGERIA
DOMINICA
ARMENIA
CÔTE D’IVOIRE
GAMBIA
(BOLIVARIAN
REPUBLIC OF)
2015
2016
2017
2018
Economic slowdowns and downturns
Conflict and economic slowdowns and downturns
Conflict, climate extremes, and economic slowdowns and downturns
NOTES: The figure shows the number of low- and middle-income countries with an increasing change point in the prevalence of undernourishment (PoU)
occurring in any year between 2010 and 2018, and in correspondence with any one of the three drivers (conflict, climate extremes, or economic
slowdowns and downturns). Of the 110 low- and middle-income countries with available information on the PoU, this analysis excludes one country for
which the PoU was imputed. The figure shows 60 countries (of 109) with 79 increasing PoU change points in correspondence of one or more drivers. See
Annex 3 for methodology.
SOURCES: PoU based on FAO; conflict data based on Uppsala University. 2021. Uppsala Conflict Data Program (UCDP). In: UCDP [online]. Uppsala, Sweden.
[Cited 10 June 2021]. ucdp.uu.se; updated drougth provided by EU-JRC using data from the European Commission. 2021. Anomaly Hotspots of Agricultural
Production (ASAP). In: ASAP [online]. Brussels. [Cited 10 June 2021]. mars.jrc.ec.europa.eu/asap; updated flood provided by UCT using data from Climate
Hazards Center of the University of California - Santa Barbara. 2021. CHIRPS: Rainfall estimates from rain gauge and satellite observations. In: CHIRPS
[online]. Santa Barbara, USA. [Cited 10 June 2021]. www.chc.ucsb.edu/data/chirps; updated heat spells provided by UCT using data from the European
Centre for Medium-Range Weather Forecasts (ECMWF). 2021. Datasets. In: ECMWF [online]. Reading, United Kingdom. [Cited 10 June 2021]. www.ecmwf.
int/en/forecasts/datasets; updated storm data based on Centre for Research on the Epidemiology of Disasters (CRED). 2021. EM-DAT: the international
disasters database. In: EM-DAT [online]. Brussels. [Cited 10 June 2021]. public.emdat.be; annual per capita GDP based on IMF. 2021. World Economic
Outlook Database - April 2021. In: IMF [online]. Washington, DC. [Cited 10 June 2021]. www.imf.org/en/Publications/WEO/weo-database/2021/April
| 66 |
THE STATE OF FOOD SECURITY AND NUTRITION IN THE WORLD 2021
»
Increases in undernourishment
occur in correspondence with conflict,
climate extremes and economic downturns
characterized by increasing undernourishment
after years of reduction or stabilization for
109 low- and middle-income countries with
available information. ah It indicates that
among the 109 countries combined, there were
87 increasing PoU change points during this
period in 65 low- and middle-income countries.
Of these, 79 increasing PoU change points in
60 countries were in correspondence with one
or more drivers (conf lict, climate extremes, and
economic slowdowns and downturns) ( Figure 17).
This means that more than half of the countries
(55 percent) experienced increasing PoU in
correspondence with at least one of these drivers
during 2010 –2018.
Conf lict, climate extremes and economic
downturns critically challenge food systems –
either through effects on systems supporting
food production, food supply changes, food
environments or consumer behaviour, or any
combination of these – with impacts on food
securit y and nutrition. This is particularly the
case where a countr y’s food system is highly
v ulnerable to the impacts of the drivers and
the countr y has high levels of povert y and
inequalit y but does not have sufficient support
in place to counter the fallout.
Around 45 percent, or 27 of the 60 countries,
experienced an increase in the PoU in
correspondence with one driver. Of these
countries, most were in correspondence with
economic slowdowns or downturns (18 countries),
followed by climate extremes (9 countries),
while, interestingly, conflict always occurs in
combination with other drivers. However, seven
of these countries not only experienced an
increase in PoU in correspondence with one driver
in a given year, but also experienced increases in
other years in correspondence with a combination
of drivers. As a result, 52 of the 79 PoU increases
occurred in correspondence with a combination
of drivers (in 40 of the 60 countries): 32 change
points in 26 countries with climate extremes and
economic slowdowns and downturns, 10 change
points in nine countries with all three drivers
combined, 5 change points in five countries with
conflict and climate extremes, and the remaining
5 change points in five countries with conflict and
economic slowdowns and downturns.
Although it is difficult to establish a direct
causal relationship considering there is limited
year-on-year variation in estimated PoU
values, ag it is possible to examine whether
increasing change points in the PoU time series
correspond to the occurrence of the drivers.
The identification of an increasing change point
refers to the statistically significant increase in
the PoU for two consecutive years before and
after the year of the change point (see Annex 3
for the methodolog y). A change point analysis
was presented in the 2018 edition of this report
for severe drought and in 2019 for economic
slowdowns and downturns. Here we update the
analysis for the first time to consider conf lict,
climate extremes, and economic downturns and
slowdowns together, which provides further
insights on the possible inf luences of multiple
driver events in countries that concurrently
experience PoU increases. Because the
methodolog y requires two years before and two
years after the year of the point of change, the
latest change point that can be estimated is 2018.
As seen from this analysis, there are more
PoU increases (79) than there are countries
(60), which also means that several countries
experienced more than one increase in the PoU
during the period 2010 –2018. In other words,
several countries faced recurring PoU increases
during this period. Although most countries
(44 of 60) experienced PoU increases while at
The change point analysis of PoU time series
presented here covers changes between 2010 and
2018, and within this period identifies the years
ag The PoU is used to monitor progress towards the achievement of
SDG Target 2.1.As this indicator changes slowly over time, direct
regression with other indicators is inappropriate. However, the PoU
change point analysis allows the identification of increasing change
points in the prevalence of undernourishment in the years when a
subsequent increasing tendency in the PoU time series occurs.
Therefore, it is possible to examine when major drivers, such as conflict,
climate extremes and/or economic downturns, occur in correspondence
with increasing change points in the PoU.
ah Of the 133 low- and middle-income countries analysed in the
chapter, information on PoU is available for 110 countries. Furthermore,
the PoU change point analysis excludes one country for which the
prevalence of undernourishment was imputed. Therefore, the analysis
includes 109 countries.
| 67 |
CHAPTER 3 MAJOR DRIVERS OF RECENT FOOD SECURITY AND NUTRITION TRENDS
FIGURE 18 THE 2020 INCREASE IN THE NUMBER OF UNDERNOURISHED WAS MORE THAN FIVE TIMES
GREATER THAN THE HIGHEST INCREASE IN UNDERNOURISHMENT IN THE LAST TWO DECADES, AND
THE ECONOMIC DOWNTURN WAS TWICE AS SEVERE THAN PREVIOUSLY RECORDED IN LOW- AND
MIDDLE-INCOME COUNTRIES
120
109.6
100
10
8
60
6
40
4
20.7
20
(28)
11.8
3.1
(29)
14.4
2
(29)
0
(27)
0
(29)
(30)
-20
-24.5
-2
-4
(57)
-40
-6
-60
-80
(99)
2000 2001 2002 2003 2004 2005 2006 2007 2008 2009 2010
Annual change in NoU (left axis)
2011
2012 2013
2014
2015
2016
2017
2018 2019
2020
ANNUAL CHANGE IN GDP PER CAPITA (PERCENTAGE POINTS)
NUMBER OF ECONOMIC DOWNTURNS IN SELECTED YEARS
12
80
ANNUAL CHANGE IN NoU (MILLIONS)
14
-8
-10
Annual change in GDP per capita growth and number
of economic downturns (in parenthesis) (right axis)
NOTES: The blue bars show the annual change in the number of undernourished people (NoU) between 2000 and 2020 (left axis) in low- and
middle-income countries. Selected numbers in correspondence of the blue bars denote the highest annual changes in the NoU. The orange line shows
the annual change in GDP per capita growth in the same period (right axis); the number in parenthesis refers to the total number of countries that
experienced an economic downturn in selected years. The figure analyses the sample of 107 low- and middle-income countries with information available
on NoU and GDP per capita. This sample includes only countries for which official Food Balance Sheets exist. See Annex 4 for definitions.
SOURCES: FAO for PoU data and annual per capita GDP based on IMF. 2021. World Economic Outlook Database - April 2021. In: IMF [online].
Washington, DC. [Cited 10 June 2021]. www.imf.org/en/Publications/WEO/weo-database/2021/April
(Democratic Republic of the Congo, Gambia and
Lebanon) witnessed it for three years.
the same time being affected by one driver or a
combination of drivers in a single year, several
countries (16) experienced an increase in the
PoU in correspondence with any of the drivers
for two or three years. In particular, for 13 of
the countries, this simultaneous occurrence
is recorded for two years; three countries
Importantly, reoccurring PoU change points are
seen where different drivers prevail. Only in
4 of the 16 countries with reoccurring increases
in the PoU did these changes coincide with
| 68 |
THE STATE OF FOOD SECURITY AND NUTRITION IN THE WORLD 2021
FIGURE 19 IN 2020, MOST LOW- AND MIDDLE-INCOME COUNTRIES HIT BY ECONOMIC DOWNTURNS
EXHIBIT AN INCREASE IN THE PoU, BUT OFTENTIMES ECONOMIC DOWNTURNS OCCUR SIMULTANEOUSLY
WITH CLIMATE-RELATED DISASTERS AND CLIMATE EXTREMES
20
DOMINICAN REPUBLIC
BOSNIA AND HERZEGOVINA
SERBIA
RWANDA
NUMBER OF COUNTRIES
15
GEORGIA
GAMBIA
ANGOLA
SIERRA LEONE
BRAZIL
BELIZE
NEPAL
BENIN
(PLURINATIONAL STATE OF)
DJIBOUTI
TUNISIA
UNITED REPUBLIC OF TANZANIA
MADAGASCAR
MONTENEGRO
SAO TOME AND PRINCIPE
MEXICO
TOGO
KYRGYZSTAN
GUATEMALA
ECUADOR
MALAWI
UZBEKISTAN
NORTH MACEDONIA
RUSSIAN FEDERATION
KENYA
BULGARIA
SAMOA
PERU
PARAGUAY
YEMEN
INDIA
ETHIOPIA
ESWATINI
HONDURAS
JAMAICA
PAKISTAN
COLOMBIA
VIET NAM
COSTA RICA
EL SALVADOR
MOROCCO
NIGERIA
THAILAND
CHINA
BOLIVIA
10
5
IRAN
(ISLAMIC
REPUBLIC OF)
NAMIBIA
MALI
SRI LANKA
SENEGAL
BURKINA FASO
LEBANON
PHILIPPINES
SOUTH AFRICA
IRAQ
MOZAMBIQUE
MAURITANIA
UKRAINE
JORDAN
SUDAN
TURKEY
ALGERIA
GUYANA
0
TYPE OF DRIVERS
Economic downturns
Economic downturns – climate-related disasters
Economic downturns – conflict (food crisis) – climate-related disasters
Economic downturns – conflict – climate-related disasters
No downturn
Economic downturns – conflict (food crisis)
Economic downturns – climate extremes
Economic downturns – conflict (food crisis) – climate extremes
Economic downturns – conflict – climate extremes
NOTES: Of the 107 low- and middle-income countries with available information on the prevalence of undernourishment (PoU) and GDP per capita, the
figure shows 66 countries with an increase in the PoU from 2019 to 2020 that is higher than the increase from 2017 to 2019. Of the 66 countries, 60 have
an increase in the PoU along with an economic downturn in 2020. For these countries, the PoU increase in 2020 may occur in correspondence with an
economic downturn as well as other drivers: conflict, climate extremes or climate-related disasters. See Annex 5 for definitions and methodology.
SOURCES: PoU based on FAO; see sources of Figure 17 for data on drivers (conflict, climate extremes and economic downturns); data on climate-related
disasters (extreme temperatures, floods, storms) based on Centre for Research on the Epidemiology of Disasters (CRED). 2021. EM-DAT: the international
disasters database. In: EM-DAT [online]. Brussels. [Cited 10 June 2021]. public.emdat.be; conflict as a primary driver of acute food insecurity in countries
in a food crisis situation based on FSIN & Global Network Against Food Crisis. 2021. Global Report on Food Crises 2021. Rome. (also available at
www.fsinplatform.org/sites/default/files/resources/files/GRFC 2021 050521 med.pdf).
Similarly, the Democratic Republic of the
Congo reported increasing change points in
correspondence with all three drivers in two
years (2011 and 2017) and with conf lict and
climate extremes in 2014. Afghanistan also
experienced increasing PoU change points in
correspondence with all three drivers in 2011,
and with conf lict and economic slowdowns and
downturns in 2014.
the occurrence of the same driver(s), while the
remaining 12 countries experienced different
drivers or combinations of drivers. For instance,
Côte d’Ivoire, Lebanon and Lesotho first
experienced increasing PoU change points in
correspondence with economic slowdowns and
downturns (in 2010, 2014 and 2013, respectively)
and then in combination with climate extremes
(Lebanon in 2018, and the other two in 2017).
| 69 |
CHAPTER 3 MAJOR DRIVERS OF RECENT FOOD SECURITY AND NUTRITION TRENDS
While a PoU change point analysis is usually
needed to detect statistically significant
inf lection points and increases in the PoU from
year to year, the sharp and unprecedented rise
in the PoU from 2019 to 2020 allows for a more
direct approach. In this case, it is possible to
detect an increase in 2020 by comparing the 2019
to 2020 PoU increase with the increase from
2017 to 2019 (see Annex 5 for methodolog y).
This approach is applied to examine the 2020
increase in the PoU and whether one or more of
the drivers exerted inf luence at the same time.
only, while for the rest of the countries, the
increases occurred under the inf luence of
economic downturns and a combination of
other drivers.
The most frequently occurring combination of
drivers in 2020 was economic downturns with
climate extremes or climate-related disasters
(34 of 60) ( Figure 19). Most striking is that in
most (19) of these 34 countries, the climate
impacts were severe, qualif ying as mediumand/or large-scale climate-related disasters. aj
Climate-related disasters have come to dominate
the risk landscape to the point where they now
account for more than 80 percent of all major
internationally reported disasters. 92,93 There were
two countries (Iraq and Mali) that had an increase
in the PoU and were simultaneously affected by
both economic downturns and conflict; both are
food crisis countries with high levels of acute food
insecurity requiring emergency humanitarian
assistance. Thirteen of the 60 countries
experienced an economic downturn along with
conflict and climate extremes or climate-related
disasters; seven of these are food crisis countries
with high levels of acute food insecurity that also
experienced climate-related disasters (Burkina
Faso, Jordan, Lebanon, Nigeria, Pakistan,
Ukraine and Yemen). As will be seen in the
analysis below, some of the largest increases
in the PoU from 2019 and 2020 were seen in
countries where economic downturns combined
with climate-related disasters, or with food crisis
countries with conflict as a primary driver.
The annual change in the number of
undernourished people living in low- and
middle-income countries was 110 million from
2019 to 2020, far exceeding any single year
increase in decades ( Figure 18). This unprecedented
increase in undernourishment was primarily
driven by the equally exceptional economic
downturns that hit most countries around the
world as a result of the COV ID-19 pandemic
containment measures (see Box 7). Among lowand middle-income countries, GDP per capita
growth declined, on average, by 6.7 percentage
points in 2020, which is more than double
the severit y of the 2009 global financial crisis
and economic downturn ( Figure 18). ai Economic
downturns in 2020 also occurred in almost
twice as many countries compared with 2009
(99 countries affected by economic downturns in
2020, compared with 57 in 2009).
Most low- and middle-income countries for
which there are PoU and GDP per capita data
for 2020 (81 of 107) registered an increase in the
PoU from 2019 to 2020. The magnitude of this
single-year increase in the PoU is higher than
the increase from the previous two years in most
countries (66 of 81) ( Figure 19). Only 15 countries
with a PoU increase from 2019 to 2020 did not
have an increase higher than the one from 2017
to 2019.
Highest levels of food insecurity and
malnutrition seen in countries affected
by multiple drivers
The extent to which a driver or factor negatively
affects people’s food securit y and nutrition
depends on their degree of exposure and their
v ulnerabilit y to its impact. In the analysis that
follows, countries are categorized based on
whether they are “affected” by a driver or factor,
i.e. countries affected by conf lict, countries
affected by climate extremes, countries affected
Almost all the low- and middle-income countries
with an increase in PoU in 2020 higher than the
increase during the previous two years (60 of 66)
show this increase amid an economic downturn
( Figure 19). Of these, 11 countries show an increase
in the PoU occurring with economic downturns
ai
aj Climate-related disasters are based on the Centre for Research on
the Epidemiology of Disasters (EM-DAT)326 datasets of medium- and
large-scale disasters and include disasters caused by droughts, floods,
extreme temperatures and storms. See EM-DAT for definitions and
sources.
See trend analysis of economic downturns.
| 70 |
THE STATE OF FOOD SECURITY AND NUTRITION IN THE WORLD 2021
BOX 8 DEFINITION OF COUNTRIES AFFECTED BY CONFLICT, CLIMATE EXTREMES, ECONOMIC DOWNTURNS
AND WITH HIGH INCOME INEQUALITY
period. Climate-related vulnerability is identified
when at least one of the following conditions occur:
i) a country shows a high and statistically significant
association between cereal production or imports and
at least one climate factor (temperature, precipitation
and vegetation growth) during the years 2001–2020;
ii) a country is highly dependent on agriculture,
measured by 60 percent or more people employed in
the agriculture sector in 2019; iii) a country shows an
increasing PoU change point in correspondence with a
severe drought warning.
Countries affected by economic downturns are
those experiencing an economic downturn, coinciding
with an increasing PoU change point during any year
between 2010 and 2018. This definition captures both
the occurrence of an economic downturn, as well as
vulnerability in terms of a corresponding increase in
undernourishment. Specifically, a PoU change point
characterized by an increasing tendency between t-2
and t+2 is identified at time t, and it should occur in
correspondence with an economic downturn reported at
time t, or at time t-1.
Countries with high income inequality are those
countries with a Gini index during 2010–2018
that is higher than the median value of the income
inequality distribution.
A further breakdown of this analysis considers all
possible combinations of multiple drivers that can
affect low- and middle-income countries. Eight mutually
exclusive categories of countries are identified.
The following definitions are applied to categorize
countries affected by a driver (conflict, climate
extremes and economic downturns) and with high
inequality across 133 low- and middle-income
countries. Countries can be categorized as affected by
more than one driver (or factor) if they meet the criteria.
Countries affected by conflict are those experiencing
conflict that resulted in a significant loss of human life,
i.e. that suffered 500 or more battle deaths for at least
one of the four subperiods considered in the analysis
(2000–2004; 2005–2009; 2010–2014; 2015–2019).
This definition includes both aspects of occurrence of
conflict, as well as vulnerability in terms of a significant
loss of life. As highlighted above, a longer time period
is necessary to define countries affected by conflict;
because of the changing nature of conflict where even
in post-conflict contexts, violence can simply change
its form as settings, actors and drivers change, may
not disappear when the conflict is seemingly over
and conflicts structural impacts can be seen in other
locations and years.
Countries affected by climate extremes are those
experiencing a combination of high exposure to
climate extremes (i.e. drought, flood, heat spell, storm)
and vulnerability to climate factors. High exposure
is defined as when a country experiences three or
four different typologies of climate extremes during
2010–2014 or 2015–2019 (among drought, flood,
heat spell, storm), or when any of these extremes
occur for at least seven years in the 2010–2019
See Annex 4 for the methodology and the list of countries affected by different combinations of drivers.
is an increased probability that these climate
extremes will result in negative outcomes of food
insecurity and malnutrition (vulnerability). If both
conditions are met, then a country is categorized
as a “country affected by climate extremes”.
A country can be affected by more than one type
of driver if it meets the criteria, e.g. a country can
be affected by both climate extremes and conflict.
by economic downturns and countries with
high inequalit y. The variables used to define the
different categories are provided in Box 8.
In summar y, two criteria are used for a countr y
to be categorized as being affected by a driver:
(i) evidence of the occurrence of an event related
to the driver in a countr y, for example, the
occurrence of a conf lict, a climate extreme, or
an economic downturn; and (ii) evidence of a
v ulnerabilit y to the impacts of such an event,
which refers to conditions that increase the
probabilit y that the occurrence of the driver event
will negatively affect the countr y’s food securit y
and nutrition situation.
Although there are many vulnerability factors
related to each driver, many are problematic to
define consistently across countries for a global
analysis due to the lack of data and comparability.
In this analysis, a small subset of indicators are
selected for the analyses that serve as a proxy
for best measure of, vulnerability related to the
drivers and their relative importance to food
security and nutrition, and measurability across
the 133 low- and middle-income countries
(LMICs).
For example, a country affected by climate
extremes is a country where there is evidence
of the occurrence of climate extremes over
agricultural areas (exposure) and where there
| 71 |
CHAPTER 3 MAJOR DRIVERS OF RECENT FOOD SECURITY AND NUTRITION TRENDS
As seen above, 2020 represents a unique year
in that most low- and middle-income countries
experienced steep economic downturns. As a
result, for that year there is an unusually high
number of countries affected by multiple
drivers, with economic downturns combed
with climate extremes and conf lict. For this
reason, it is important to separate this analysis
and first examine the pre-COV ID-19 period.
A salient finding is that most of the hungr y
people live in countries affected by multiple
drivers: 381.4 million of the 650.3 million
chronically undernourished globally in 2019
( Figure 20A).
Child stunting shows a similar pattern. In 2019,
for countries with available information, the
unweighted average prevalence of stunted
children in countries affected by a combination
of drivers was 6 percentage points higher
than in countries affected by one driver
only, and 9 percentage points higher than in
countries not affected by any driver (28.5,
22.6 and 19.6 percent, respectively) ( Figure 20B).
Around 130 million, or 90 percent, of the total
number of stunted children under the age of
five lived in countries affected by one or more
drivers ( Figure 20B). However, the drivers are
not the only inf luencing factors determining
food securit y and nutrition outcomes in these
countries, and a deeper analysis is therefore
called for.
In the pre-COV ID-19 period, most or
70 percent of low- and middle-income countries
were affected by at least one of the drivers (93
of 133). Of the 133 low- and middle-income
countries, only 40 countries are not affected by
any of the three drivers, while most countries
are affected by either one driver (52 countries)
or a combination of drivers (41 countries).
For countries affected by one driver, most are
affected by climate extremes (38 countries),
followed by conf lict (8 countries) and economic
downturns (6 countries). Climate extremes are
the most common driver affecting countries,
either as a single driver or in combination
with other drivers (75 countries). Conf lict is
the second most common driver affecting
countries, either as a single driver or in
combination with other drivers (40 countries),
followed by economic downturns (24 countries).
For countries affected by one or more drivers
41 percent also have high income inequalit y
(38 of 93 countries).
If we update the analysis to identif y countries
affected by the different drivers including
year 2020, of 133 low- and middle-income
countries, the number of countries not affected
by any of the drivers decreases from 40 to only
14 (compared with 2010 –2019), while most
of the countries (80 countries) are affected
by a combination of drivers, and only a few
are affected by one driver (39 countries).
Climate extremes continue to be the most
common driver affecting countries, either
as a single driver or in combination with
other drivers (104 countries). Economic
downturns, however, either as a single or in
combination, are the second most common
driver affecting countries (72 countries),
followed by conf lict (40).
For countries affected by multiple drivers, more
countries are affected by conf lict and climate
extremes (23 countries), followed by climate
extremes and economic downturns (9 countries).
Five countries are affected by all three drivers.
See Annex 4 for a list of countries affected
by drivers.
The majorit y of chronically undernourished
people and stunted children live in countries
affected by multiple drivers ( Figure 20).
Moreover, countries affected by multiple drivers
also have a significantly higher prevalence of
undernourishment and of stunted children.
In 2019, the unweighted average of the PoU
in countries affected by multiple drivers
(17 percent) was 6 percentage points higher
than in countries affected by one driver or
countries not affected by any driver ( Figure 20A).
Consequently, in 2020, the number of
undernourished people who live in low- and
middle-income countries affected by multiple
drivers increases significantly to more
than 585 million people (no fig ure shown).
Countries affected by multiple drivers also have
a much higher prevalence of undernourishment
in 2020 (16 percent) compared with countries
affected by one driver or not affected by
any driver (10 and 8 percent, respectively).
»
| 72 |
THE STATE OF FOOD SECURITY AND NUTRITION IN THE WORLD 2021
FIGURE 20 THE MAJORITY OF UNDERNOURISHED PEOPLE AND STUNTED CHILDREN LIVE IN COUNTRIES
AFFECTED BY MULTIPLE DRIVERS (2019)
A) PREVALENCE OF UNDERNOURISHMENT (PoU)
20
17
NUMBER OF UNDERNOURISHED (MILLIONS)
400
16
350
14
300
250
18
11
11
13
12
10
200
150
8
8
6
100
4
4
50
2
0
0
NO DRIVER
SINGLE DRIVER
PREVALENCE OF UNDERNOURISHMENT (%)
450
MULTIPLE DRIVERS
Prevalence of undernourishment 2019 (weighted)
Number of undernourished 2019 (millions)
Prevalence of undernourishment 2019 (unweighted)
B) STUNTED CHILDREN UNDER THE AGE OF FIVE
31.9
30
90
28.5
70
50
35
23.1
20.4
22.6
25
20
19.6
15
30
10
10
5
-10
PREVALENCE OF STUNTED CHILDREN (%)
NUMBER OF STUNTED CHILDREN (MILLIONS)
110
0
NO DRIVER
SINGLE DRIVER
MULTIPLE DRIVERS
Prevalence of stunted children 2019 (weighted)
Number of stunted children 2019 (millions)
Prevalence of stunted children 2019 (unweighted)
NOTES: Figure 20A shows the total number (bars) and prevalence of undernourishment (circles), and Figure 20B shows the total number (bars) and
prevalence of stunted children (circles) in 2019, for low- and middle-income countries exposed to no driver, a single driver or multiple drivers. The
analysis in Figure 20A (PoU) is shown for 110 low- and middle-income countries with available information in 2019, with 29 countries affected by no driver,
45 countries by one driver, and 36 countries by multiple drivers. The analysis in Figure 20B (stunting) is shown for 84 low- and middle-income countries
with available information (17 countries affected by no driver, 37 countries by a single driver, and 30 countries by multiple drivers). See Annex 4 for
definitions and methodology of countries affected by multiple drivers.
SOURCES: PoU based on FAO; child stunting data based on UNICEF, WHO & World Bank. 2021. UNICEF-WHO-World Bank: Joint child malnutrition
estimates - Levels and trends (2021 edition) [online]. https://data.unicef.org/resources/jme-report-2021, www.who.int/data/gho/data/themes/topics/jointchild-malnutrition-estimates-unicef-who-wb, https://datatopics.worldbank.org/child-malnutrition; see sources of Figure 17 for data on drivers (conflict,
climate extremes and economic downturns).
| 73 |
CHAPTER 3 MAJOR DRIVERS OF RECENT FOOD SECURITY AND NUTRITION TRENDS
FIGURE 21 HUNGER IS HIGHER AND HAS INCREASED MORE IN COUNTRIES AFFECTED BY CONFLICT,
CLIMATE EXTREMES OR ECONOMIC DOWNTURNS, OR WITH HIGH INEQUALITY
PREVALENCE OF UNDERNOURISHMENT (%)
22
20
18
16
14
12
10
2010
2011
2012
2013
2014
Affected by conflict
Affected by climate extremes
High income inequality
Affected by economic downturns
2015
2016
2017
2018
2019
2020
Not affected by conflict
Not affected by climate extremes
Low income inequality
Not affected by economic downturns
NOTES: The figure shows the prevalence of undernourishment between the years 2010 and 2020 for low- and middle-income countries affected by any of
the three drivers (conflict, climate extremes or economic downturns), and for countries with high income inequality. PoU estimates are unweighted. The
analysis is shown for 110 low- and middle-income countries with available PoU information. See Annex 4 for definitions and methodology of countries
affected by the different drivers.
SOURCES: PoU based on FAO; Gini index of income inequality data based on World Bank. 2021. World Development Indicators. In: World Bank [online].
Washington, DC. [Cited 24 April 2020]. datatopics.worldbank.org/world-development-indicators; see sources of Figure 17 for data on drivers (conflict,
climate extremes and economic downturns).
Hunger increases the most where there is
conflict, climate extremes, economic
downturns and high income inequality
» Similarly, in 2020 the highest prevalence of
22
stunting occurred in countries affected by
multiple drivers (23 percent), compared with
countries affected by one driver or not affected
by any driver (18 and 14 percent, respectively).
However, child stunting decreased from
24 percent in 2019 to 21 percent in 2020 for lowand middle-income countries.
12
14
16
18
20
As shown in the previous chapter, world hunger,
as measured by the PoU, reversed course after
a long period of decline and began to slowly
increase in 2014. Given the reversal in the
downward trend and the recent increases in
undernourishment, even before the COV ID-19
pandemic, it is important to examine trends more
closely in low- and middle-income countries
affected by conf lict, climate extremes and
20
20
19
20
18
20
17
20
16
20
15
20
14
20
13
20
12
20
11
20
20
10
10
| 74 |
THE STATE OF FOOD SECURITY AND NUTRITION IN THE WORLD 2021
economic downturns, as well as differences for
countries with high income inequalit y.
increase in the PoU of 4 percent, while countries
not affected by any driver show a decreaseof
3 percent. Overall, between 2017 and 2019,
countries affected by multiple drivers exhibit the
highest increases in the PoU (6 percent), which is
12 times larger than those in countries affected
by only a single driver (0.5 percent).
This analysis shows that the reversal in the
PoU trends in 2014 and the continuous increase
(especially pronounced from 2017) is largely
attributed to low- and middle-income countries
affected by conf lict, climate extremes and
economic downturns, and to countries with high
income inequalit y ( Figure 21). The PoU is higher
and has increased more in countries affected by
these drivers.
Considering all low- and middle-income
countries, 24 of the countries affected by
economic downturns show the largest increase in
PoU (1.5 percentage points), while 36 countries
affected by multiple drivers show the second
largest increase (1.0 percentage point) ( Figure 22).
This compares with a 0.1 percentage point
increase for the 45 countries affected by a single
driver, and a 0.3 percentage point reduction for
the 29 countries not affected by any driver.
Of the 110 low- and middle-income countries
with available information, the largest increase
in the PoU is obser ved in countries affected by
economic downturns. The group of countries
affected by economic downturns have had
increases in the PoU that started as early as
2010, surpassing countries affected by other
drivers to have the highest PoU ( Figure 21).
A further breakdown of this analysis considers
all possible combinations of multiple drivers that
can affect low- and middle-income countries.
Given 110 countries with available information
on undernourishment, eight mutually exclusive
groups are created. Figure A4.1 shows countries
grouped by the eight categories denoting
different combinations of drivers and Table A4.1
provides the countr y list. The largest increases
in the PoU (not shown in fig ure) are seen by the
nine countries affected by both climate extremes
and economic downturns, with a 2.1 percentage
point increase during 2017–2019, followed by
the five countries affected by all three drivers,
which feature an increase of 2 percentage
points (Afghanistan, Central African Republic,
Democratic Republic of the Congo, Nigeria and
Yemen). Countries experiencing the combination
of conf lict and climate extremes (18 countries) or
conf lict and economic downturns (4 countries),
feature a 0.4 and a 0.5 percentage point increase
in the PoU, respectively.
Countries affected by conf lict exhibit a small
but increasing trend in their PoU from 16 to
16.9 percent between 2017 and 2019. Though not
shown in Figure 21, the PoU is even higher and
with greater increases in countries where conf lict
is compounded by protracted crisis. During the
years 2010 –2019, countries in protracted crises
reported the highest PoU at an average level of
30 percent, with an increase of 1.5 percentage
points between 2017 and 2019 (from 28.7 to
30.2 percent).
It is strikingly clear from Figure 21 that 2020
represents a clear departure from previous years,
as surges in the PoU are seen across all low- and
middle-income countries. As seen earlier, the
economic downturns resulting from the COVID-19
pandemic and its containment measures delivered
the hardest blow in decades to world hunger,
contributing to a sharp and significant increase in
undernourishment in a single year.
Between 2017 and 2019, low-income countries
affected by the drivers show the largest increase
in the PoU (from 30.8 to 32.4 percent), which is
2.5 times higher than to the increase reported by
middle-income countries affected by the drivers
over the same period (from 8.9 to 9.1 percent)
( Figure 22). Specifically, there is a 1.6 percentage
point PoU increase in low-income countries,
which is higher than the 0.2 percentage point
PoU increase for middle-income-countries (no
There are also important differences in trends
depending on whether a countr y is affected
by more than one driver (multiple drivers) and
depending on the countr y income group ( Figure 22).
Focusing on the most recent period of increase
before the COV ID-19 pandemic, between 2017
and 2019, low- and middle-income countries
affected by one or more of the drivers show an
| 75 |
CHAPTER 3 MAJOR DRIVERS OF RECENT FOOD SECURITY AND NUTRITION TRENDS
DIFFERENCE IN THE PoU FROM 2017 TO 2019 (PERCENTAGE POINTS)
FIGURE 22 LOW-INCOME COUNTRIES AFFECTED BY CONFLICT AND CLIMATE EXTREMES SHOW THE
LARGEST INCREASE IN THE PoU, WHILE FOR MIDDLE-INCOME COUNTRIES, THE LARGEST INCREASE
OCCURS DURING ECONOMIC DOWNTURNS
2.5
2.0
1.5
1.0
0.5
0.0
-0.5
-1.0
Low-income
countries
Lower-middle-income
countries
Upper-middle-income
countries
Middle-income
countries
WORLD BANK INCOME GROUP
Affected by conflict
No driver
Affected by climate extremes
Single driver
ALL COUNTRIES
Affected by economic downturns
Multiple drivers
High income inequality
NOTES: The figure shows the difference in the PoU, measured in percentage points, from 2017 to 2019 for low- and middle-income countries affected by
conflict, climate extremes and economic downturns, and for countries with high income inequality. The figure also shows the difference in the PoU by
different combinations of drivers (no driver, single, multiple drivers). The analysis is shown by country income group for a sample of 110 low- and middleincome countries with available PoU information. See Annex 4 for definitions and methodology.
SOURCES: PoU based on FAO; Gini index of income inequality data based on World Bank. 2021. World Development Indicators. In: World Bank
[online]. Washington, DC. [Cited 24 April 2020]. datatopics.worldbank.org/world-development-indicators; see sources of Figure 17 for data on drivers
(conflict, climate extremes and economic downturns).
increase for lower-middle-income countries
and 0.4 for upper-middle-income countries).
Low-income countries also feature high
increases across all three drivers, as well as when
affected by a single driver or multiple drivers.
Low-income countries affected by conf lict (11
countries) and climate extremes (14 countries)
feature increases that are, respectively, 2.3 and
1.4 percentage points, which are higher compared
with middle-income countries affected by these
drivers ( Figure 22). Furthermore, the 2.3 percentage
point increase in low-income countries affected
by conf lict is higher also compared with
low-income countries not affected by conf lict (no
increase in the PoU).
In contrast with low-income countries, increases
in the PoU among middle-income countries
during this period are primarily seen for
countries affected by economic downturns
and multiple drivers ( Figure 22). Middle-income
countries affected by economic downturns (16
countries) feature a 1.7 percentage point increase
in the PoU, compared with middle-income
| 76 |
THE STATE OF FOOD SECURITY AND NUTRITION IN THE WORLD 2021
Regional differences in drivers and
impacts on food security and nutrition
countries not affected by economic downturns
(74), which show a 0.3 percentage point
reduction. Of these, 8 lower-middle-income
countries had a 1.9 percentage point increase,
and 8 upper-middle-income countries had a
1.4 percentage point increase.
A regional analysis shows differences in trends
related to the different drivers. The analysis in
this section focuses on low- and middle-income
countries in Africa, Asia, and Latin America and
the Caribbean. These are the three regions of the
world where most of the undernourished people
and stunted children are located and where there
are sufficient data for analysis. We first analyse
the period 2017–2019, followed by a focused look
at 2020.
High income inequalit y is also a factor in the
PoU increases during this period, especially
in middle-income countries. Middle-income
countries with high income inequalit y
(39 countries) have a higher increase in the
PoU than middle-income-countries without
high income inequalit y. Specifically, the
former had a 0.3 percentage point increase,
and the latter a 0.3 percentage point reduction.
Furthermore, considering middle-income
countries affected by one or more drivers, they
show a 2 percent increase in the PoU between
2017 and 2019, while those with the additional
burden of high income inequalit y had a double
increase in the PoU (4 percent).
In the period 2017–2019, for all three reg ions
analysed, around 78 percent of low- and
middle-income countries are affected by at
least one of the three drivers (conf lict, climate
extremes and economic downturns) ( Figure 23).
Of these countries, 45 percent (33 of 74 countries)
also have high income inequalit y, which
worsens the impact of these drivers. There is a
0.6 percentage point increase in the PoU between
2017 and 2019 for countries affected by drivers
with high income inequalit y (not shown in the
fig ure), compared with a slight decrease in the
PoU for countries affected by drivers but with
low income inequalit y. Of the 44 countries from
these reg ions that have high income inequalit y,
26 are located in Africa, 5 in Asia, and 13 in
Latin America and the Caribbean. ak
In contrast to recent trends in the prevalence
of undernourishment, the prevalence of child
stunting shows a continuing declining trend
from 2017 to 2019. However, an analysis of
child stunting for countries affected by conf lict,
climate extremes and economic downturns,
as well as differences for countries with
high income inequalit y, did not reveal any
notable patterns, indicating the presence of
other stronger drivers behind these trends.
Similarly, while there is an increase in adult
obesit y from 2012 to 2016 that is obser ved across
low- and middle-income countries, the analysis
indicates that this increasing trend is driven
by structural factors related to the economic
development of a countr y and associated
changes in food environments, rather than by
contingencies related to the drivers. In fact,
the increase in adult obesit y is correlated with
countr y income level and with the nutrition
transition that often accompanies economic
development. Indeed, middle-income countries
feature a statistically significant higher increase
than low-income countries (1.9 compared with
1.4 percentage points), with the highest increase
reported by upper-middle-income countries
(2.1 percentage points).
Countries affected by economic downturns in
Africa, Asia, and Latin America and the Caribbean
show the highest PoU increase from 2017 to 2019,
compared with countries affected by climate
extremes or conflict ( Figure 23). The largest increase
is seen in Africa and Latin America and the
Caribbean (2 percentage points). Africa is the only
region where a surge in PoU is associated with all
three major drivers. Of the 24 countries affected by
economic downturns, 11 are in Africa (27 percent
of countries), 6 in Asia (19 percent of countries) and
5 in Latin America and the Caribbean (22 percent
of countries). There are also countries outside these
regions affected by economic downturns but not
shown in the figure: two in Oceania.
ak There are also low- and middle-income countries in two other
regions, but these are not included in the analysis due to limited number
of countries and data on drivers for these countries. There are three
countries outside the three regions analysed with high income inequality,
of which two are in North America and Europe, and one in Oceania.
| 77 |
CHAPTER 3 MAJOR DRIVERS OF RECENT FOOD SECURITY AND NUTRITION TRENDS
FIGURE 23 LATIN AMERICA AND THE CARIBBEAN FEATURE THE HIGHEST INCREASE IN THE PoU FROM
MULTIPLE DRIVERS, WHILE AFRICA IS THE ONLY REGION WHERE THE PoU INCREASED UNDER THE
INFLUENCE OF ALL THREE DRIVERS FROM 2017 TO 2019
100
94
93
85
2.0
78
90
80
1.5
70
60
1.0
50
0.5
40
30
0.0
20
-0.5
10
PERCENTAGE OF COUNTRIES AFFECTED BY AT LEAST ONE DRIVER
DIFFERENCE IN THE PoU FROM 2017 TO 2019 (PERCENTAGE POINTS)
2.5
0
-1.0
AFRICA
ASIA
LATIN AMERICA
AND THE CARIBBEAN
Affected by conflict
Affected by climate extremes
Affected by economic downturns
No driver
Single driver
Multiple drivers
ALL COUNTRIES
Percentage of countries affected
by at least one driver
NOTES: In the figure, the left axis shows the difference in the PoU, measured in percentage points, from 2017 to 2019 for all low- and middle-income
countries affected by conflict, climate extremes and economic downturns, and for each selected region (bars). The right axis shows the percentage of
countries that were exposed to at least one driver in each region compared with all countries in the region (circles). The analysis is shown for a sample of
110 low- and middle-income countries with available PoU information. See Annexes 3 and 4 for definitions and methodology.
SOURCES: PoU based on FAO; see sources of Figure 17 for data on drivers (conflict, climate extremes and economic downturns).
2017–2019 ( Figure 23). In contrast, the one countr y
affected by conf lict in Latin America and the
Caribbean (Colombia) shows no increase in
the PoU.
Climate extremes are an important driver
in Africa, with countries affected by climate
extremes in this region showing a 1.2 percentage
point PoU increase from 2017 to 2019, whereas
Asia reports a 0.4 percentage point reduction
( Figure 23). There are 21 countries in Africa affected
by climate extremes (51 percent of countries) and
24 countries in Asia (77 percent of countries).
Africa is the only region with PoU increases
from 2017 to 2019 associated with all three
drivers (conf lict, climate extremes and economic
downturns) ( Figure 23). Moreover, countries
affected by conf lict and climate extremes
in Africa show a higher increase in the PoU
Countries affected by conf lict in Africa show a
1.7 percentage point increase in the PoU during
| 78 |
THE STATE OF FOOD SECURITY AND NUTRITION IN THE WORLD 2021
FIGURE 24 IN 2020, AFRICA, ASIA, AND LATIN AMERICA AND THE CARIBBEAN WITNESSED SIGNIFICANT
60
6.0
49
5.0
49
50
4.0
40
35
3.0
30
2.0
20
7
1.0
7
9
0
0.0
-1.0
10
NUMBER OF COUNTRIES AFFECTED
BY A SPECIFIC DRIVER
DIFFERENCE IN PoU FROM 2019 TO 2020
(PERCENTAGE POINTS)
INCREASES IN THE PoU WHILE BEING HIT BY ECONOMIC DOWNTURNS COMBINED WITH CLIMATE-RELATED
DISASTERS, CONFLICT, OR A COMBINATION OF BOTH
Economic downturns
and multiple drivers
Economic downturns
AFFECTED BY
MULTIPLE DRIVERS
World
Africa
Economic downturns
and climate-related
disasters
Economic downturns
and conflict (food crisis)
Economic downturns,
climate-related disasters
and conflict (food crisis)
Countries not affected
by economic downturns
-10
AFFECTED BY COMBINATION OF DRIVERS
Asia
Latin America and the Caribbean
Number of countries
NOTES: In the figure, the left axis shows the difference in the PoU, measured in percentage points, from 2019 to 2020 in each selected region, and for all
low- and middle-income countries affected by economic downturns, and by specific combinations of economic downturns with other drivers (bars). The
right axis shows the number of low- and middle-income countries that were exposed to each combination of drivers (circles). The analysis is shown for a
sample of 107 low- and middle-income countries with available information on PoU and GDP per capita growth in 2020. See Annex 5 for definitions and
methodology.
SOURCES: PoU based on FAO; conflict data based on Uppsala University. 2021. Uppsala Conflict Data Program (UCDP). In: UCDP [online]. Uppsala,
Sweden. [Cited 10 June 2021]. ucdp.uu.se; climate-related disasters (extreme temperatures, flooding, storms) data based on Centre for Research on the
Epidemiology of Disasters (CRED). 2021. EM-DAT: the international disasters database. In: EM-DAT [online]. Brussels. [Cited 10 June 2021]. public.
emdat.be; annual per capita GDP based on IMF. 2021. World Economic Outlook Database - April 2021. In: IMF [online]. Washington, DC. [Cited 10 June
2021]. www.imf.org/en/Publications/WEO/weo-database/2021/April; conflict as a primary driver of acute food insecurity in countries in a food crisis
situation based on FSIN & Global Network Against Food Crisis. 2021. Global Report on Food Crises 2021. Rome. (also available at www.fsinplatform.org/
sites/default/files/resources/files/GRFC 2021 050521 med.pdf).
compared with countries affected by the same
drivers in Asia and Latin America and the
Caribbean. Interesting differences in the change
in the PoU from 2017 to 2019 are found within
the regions. African countries affected by
conf lict and economic downturns show higher
increases in the PoU than African countries not
affected by the same drivers (the latter show
a small increase around 0.3 – 0.4 percentage
point). Similarly, countries affected by economic
downturns in Asia and Latin America and the
Caribbean have higher PoU increases than
countries not affected by this driver, which show
a 0.6 percentage point reduction in Asia, and a
0.2 percentage point increase in Latin America
and the Caribbean.
The highest increase in the PoU, a 2.1 percentage
point increase, is obser ved in countries affected
by multiple drivers in Latin America and the
Caribbean ( Figure 23). Africa also registered
ver y high increases in the PoU for countries
affected by multiple drivers (1.9 percentage point
increase). The most frequent combination of
drivers in Africa is conf lict and climate extremes
(five countries). In Latin America and the
| 79 |
CHAPTER 3 MAJOR DRIVERS OF RECENT FOOD SECURITY AND NUTRITION TRENDS
Caribbean, four countries are affected by multiple
drivers: three by climate extremes and economic
downturns, and one by conf lict and climate
extremes (Colombia).
There are many countries (49 of the 107 countries)
with an increase in the PoU in 2020 that were
affected only by the single driver of economic
downturns, but the PoU increase on average,
was much smaller than the increase in countries
affected by economic downturns combined with
other drivers ( Figure 24). On average at the world
level, the increase was 1.1 percentage point lower,
and 1.5 percentage points lower for both Africa
and Asia.
Countries affected by multiple drivers (one or
more of the drivers) consistently show among the
highest PoU increases during 2017–2019. In this
period, for all three regions analysed (Africa,
Asia, and Latin America and the Caribbean),
around 36 percent of low- and middle-income
countries were affected by multiple drivers, of
which 15 are in Africa, 15 in Asia and 4 in Latin
America and the Caribbean. Countries affected
by multiple drivers show a 1.9 percentage point
increase in Africa and a 2.1 percentage point
increase in Latin America and the Caribbean,
and no increase in Asia ( Figure 23). On the other
hand, while almost half the countries affected
by drivers experience multiple drivers in Asia,
during this period, it is only countries affected
by economic downturns that show an increase in
the PoU.
Economic downturns combined with
climate-related disasters affected 35 countries
and led to significant increases in the PoU in
all three regions ( Figure 24). The largest increase
is seen in Latin America and the Caribbean
(2.1 percentage points), followed by Africa
(1.6 percentage points) and Asia (1 percentage
point). Of the 35 countries, 9 are in Africa (9 of
41 African countries), 12 are in Asia (12 of 30
Asian countries) and 8 are in Latin America and
the Caribbean (8 of 21 countries in that region).
In 2020, countries affected by conf lict combined
with other drivers had a high PoU increase.
Countries in Africa affected by all three drivers
of economic downturns, climate-related
disasters and conf lict show the highest
increase in the PoU (5.2 percentage points),
while countries in Asia affected by economic
downturns and conf lict show the second highest
increase (3.1 percentage points).
In 2020, all low- and middle-income countries
with available information were affected by
economic downturns, with the exception of
nine countries (Bangladesh, China, Eg ypt,
Ethiopia, Guyana, Iran, Myanmar, Turkey and
Viet Nam). Guyana, for instance, grew at a
rate of 43.5 percent in 2020, having completed
an extraordinar y year of oil production.
Similarly, Iran’s GDP grew by 8 percentage
points in 2020, due to favourable oil revenues in
the second half of the year.
Increasing unaffordability of healthy diets
is strongly associated with severe and
moderate forms of food insecurity
Figure 24 shows PoU increases for economic
downturns and various combinations with other
drivers in 2020. When economic downturns occur
along with other drivers (either climate-related
disasters, conflict, or a combination of both),
the largest PoU increase is seen in Africa
(5.2 percentage points), followed by Asia
(3.1 percentage points). Of the 49 countries
affected by multiple drivers, 16 are in Africa
(16 of 41 African countries), 18 are in Asia (18 of
30 Asian countries), 8 are in Latin America and
the Caribbean (8 of 21 countries in Latin America
and the Caribbean), and the remaining 7 countries
in North America and Europe and Oceania. Of the
7, 3 countries are in North America and Europe
(3 of 9) and 4 countries in Oceania (4 of 6).
FAO has beg un to systematically monitor the
cost and affordabilit y of healthy diets around
the world in this report. The new 2019 estimates
presented in Chapter 2 provide an important
opportunit y to better understand how these are
related to food insecurit y, and how changes over
time affect food insecurit y and the different
forms of malnutrition.
In last year’s edition of this report, it was
shown that the unaffordabilit y of healthy
diets in 2017 was strongly associated with
undernourishment and different forms of
malnutrition, including child stunting and
adult obesit y. These results are reconfirmed
| 80 |
»
THE STATE OF FOOD SECURITY AND NUTRITION IN THE WORLD 2021
FIGURE 25 THE UNAFFORDABILITY OF HEALTHY DIETS IN 2019 IS STRONGLY ASSOCIATED WITH HIGHER
LEVELS OF BOTH SEVERE AND MODERATE OR SEVERE FOOD INSECURITY
R-squared=0.4332
PREVALENCE OF SEVERE FOOD INSECURITY (LOG)
4
2
0
-2
-4
-2
0
2
4
6
UNAFFORDABILITY OF HEALTHY DIET (LOG)
Low-income countries
Lower-middle-income countries
Upper-middle-income countries
Quadratic fit
PREVALENCE OF MODERATE OR SEVERE FOOD INSECURITY (LOG)
R-squared=0.4738
5
4
3
2
1
-2
0
2
4
6
UNAFFORDABILITY OF HEALTHY DIET (LOG)
Low-income countries
Lower-middle-income countries
Upper-middle-income countries
Quadratic fit
NOTES: The figure shows simple regression analyses by country income group between the prevalence of severe food insecurity and the unaffordability
of a healthy diet (top), and between the prevalence of moderate or severe food insecurity and the unaffordability of a healthy diet (bottom). The
unaffordability of a healthy diet (horizontal axis) identifies the percentage of the population in a country that cannot afford a healthy diet in 2019. Higher
values on the horizontal axis reflect higher levels of food insecurity on the vertical axes. All variables are expressed in logarithms. The R-squared denotes
the percent of the variance in the variable on the vertical axes explained by unaffordability of the healthy diet. The analysis is shown for 86 low- and
middle-income countries with available information on both unaffordability and food insecurity. See Annex 2 for definitions and methodology.
SOURCES: FAO for severe food insecurity and moderate or severe food insecurity indicators based on the FIES, and for unaffordability of healthy diets.
| 81 |
CHAPTER 3 MAJOR DRIVERS OF RECENT FOOD SECURITY AND NUTRITION TRENDS
PERCENTAGE OF THE POPULATION WHO CANNOT AFFORD A HEALTHY DIET
PREVALENCE OF MODERATE OR SEVERE FOOD INSECURITY (%)
FIGURE 26 IN 2019, COUNTRIES AFFECTED BY MULTIPLE DRIVERS AND COUNTRIES AFFECTED BY
CONFLICT (ALONE OR COMBINED WITH OTHER DRIVERS) EXHIBITED AMONG THE HIGHEST PERCENTAGE
OF THE POPULATION WHO CANNOT AFFORD A HEALTHY DIET AND ARE MODERATELY OR SEVERELY
FOOD INSECURE
100
94
90
82
80
74
72
70
59
60
50
41
44
44
Economic
downturns
Climate
extremes
40
30
20
10
0
NO DRIVER
Conflict
AFFECTED BY SINGLE DRIVER
Prevalence of moderate or severe food insecurity (%)
Conflict - climate
extremes
Climate extremes - Conflict - economic
economic downturns
downturns
All three
AFFECTED BY MULTIPLE DRIVERS
Percentage of the population who cannot afford a healthy diet
NOTES: The figure shows the percentage of the population who cannot afford a healthy diet (blue diamonds) and the percentage of the population with
moderate or severe food insecurity (orange bars). Both indicators are shown for the year 2019 and for all possible combinations of drivers. The analysis is
shown for 100 low- and middle-income countries with available information on unaffordability of a healthy diet, and for 88 countries with available
information on moderate or severe food insecurity. See Annexes 2 and 4 for definitions and methodology.
SOURCES: FAO for moderate or severe food insecurity indicator based on the FIES, and for unaffordability of healthy diets. See sources of Figure 17 for
data on drivers (conflict, climate extremes and economic downturns).
» this year by an analysis of estimates for 2019,
who are moderately or severely food insecure,
and whether or not these populations live in
countries affected by drivers reveals interesting
patterns ( Figure 26). In countries affected by one
or more drivers, on average, the percentage of
the population who are moderately or severely
food insecure is almost 10 percentage points
higher (44 percent) than that of countries not
affected by any driver (34 percent). Moreover,
a larger percentage of the population cannot
afford a healthy diet (57 percent) compared
with the percentage in countries not affected
by any driver (41 percent). Countries affected
which shows that high levels of unaffordabilit y
of healthy diets are strongly correlated with
high levels of both severe and moderate or
severe food insecurit y, as measured by the FIES
( Figure 25). As expected, the lower the income
of the countr y, the higher the levels of both
unaffordabilit y of healthy diets and severe and
moderate or severe forms of food insecurit y.
Looking at the intersection between the
percentage of the population that cannot afford
a healthy diet, the percentage of the population
| 82 |
THE STATE OF FOOD SECURITY AND NUTRITION IN THE WORLD 2021
diet between 2017 and 2019. However, severe
food insecurit y and moderate or severe food
insecurit y, as measured using the FIES, do not
show such variabilit y in such a short period of
time, so this analysis uses their levels for 2019,
rather than their 2017–2019 change. al
by multiple drivers exhibit the highest levels
of unaffordabilit y (68 percent), which is, on
average, 39 percent higher than countries
affected by a single driver and 66 percent
higher than countries not affected by any
driver. Those countries also show higher
levels of moderate or severe food insecurit y
(47 percent), 12 percent higher than countries
affected by a single driver (42 percent) and
38 percent more than countries not affected by
any driver (34 percent).
The analysis shows (not presented graphically
here) that there is a positive correlation between
the 2017–2019 change in the number of people
who cannot afford a healthy diet, for both
moderate or severe food insecurit y, and severe
food insecurit y in 2019. While the former variable
may not explain much of the variabilit y in the
FIES-based indicators given a low coefficient of
determination (R-squared of around 0.06), the
correlation is statistically significant.
Countries affected by conf lict have among
the highest levels of moderate or severe food
insecurit y and unaffordabilit y of healthy
diets in 2019, irrespective of whether they
are affected by conf lict alone, or by conf lict
in combination with other drivers. The only
exception is countries affected by conf lict in
combination with climate extremes, which
have a lower level of moderate or severe food
insecurit y than countries affected by climate
extremes combined with economic downturns
( Figure 26). The few countries that were affected
by all three drivers of conf lict, climate extremes
and economic downturns show the highest
levels of unaffordabilit y (94 percent of their
population) and moderate or severe food
insecurit y (69 percent of their population).
Thus, countries where the unaffordability of a
healthy diet increased between 2017 and 2019 also
show higher levels of food insecurity (both severe
and moderate or severe). Further descriptive
statistics and tests of significance suggest that
this positive association is attributable mainly to
lower-middle-income countries.
FAO has only beg un to systematically monitor
the cost and affordabilit y of healthy diets.
Therefore, it is expected that, as more data
points over time become available, the capacit y
to analyse and better understand how changes
in the cost and affordabilit y of healthy diets
affect food insecurit y and the different forms
of malnutrition will significantly improve.
Furthermore, a systematic price collection of
the key food items that form healthy diets will
allow to build a healthy food basket populated
with countr y-relevant food items that can be
compared across countries while capturing local
realities at the same time. n
Importantly, we now have the first
opportunit y to extend the analysis and look
at the relationship between the change in the
unaffordabilit y of healthy diets, comparing
2017 and 2019 data, and the levels of food
insecurit y as measured by the two FIES-based
indicators. Even though, at the global level,
the total number of people who cannot afford
a healthy diet in 2019 is slightly lower than the
2017 estimate published in last year’s report, in
several reg ions, the number actually increased
(see Chapter 2, Table 5). Latin A merica and
the Caribbean reg istered the largest increase
(8.4 percent), with even higher subreg ional
increases for Latin A merica (9.7 percent) and
South A merica (14.3 percent). High increases
were also reg istered in A frica (5.4 percent),
notably in Middle A frica (6.8 percent) and
Western A frica (5.9 percent). There is sufficient
variabilit y with both increases and decreases
across countries with respect to the total
number of people who cannot afford a healthy
al An analysis was attempted to correlate the variation in the
unaffordability of healthy diets from 2017 to 2019, and the variation in
the levels of food insecurity as measured by the FIES-based indicators
in the same period. However, due to the lack of variation in the data of
the latter, the results did not turn out to be statistically significant.
Although variation may be higher for specific subregions or countries, at
the global level, both FIES-based indicators changed on average only by
around 1 percentage point from 2017 to 2019, compared with a
3.6 percentage point change in the unaffordability variable.
| 83 |
AFGHANISTAN
Vendors carry onions to
sell at a market in Herat.
©FAO/Farshad Usyan
CHAPTER 4
WHAT NEEDS TO BE DONE TO
TRANSFORM FOOD SYSTEMS FOR
FOOD SECURITY, IMPROVED
NUTRITION AND AFFORDABLE
HEALTHY DIETS?
KEY MESSAGES
è When transformed with greater resilience to major
drivers, food systems can provide affordable healthy
diets that are sustainable and inclusive, and become
a powerful driving force towards ending hunger, food
insecurity and malnutrition in all its forms.
è Comprehensive policies aimed at both the food and
natural environments, reinforced by regulations and
legislation, can result in behavioural changes along the
food supply chain and among consumers, thus shifting
dietary patterns to the benefit of human health and
the environment.
è In conflict-affected areas, maintaining
conflict-sensitive food systems functions to the
extent possible, while aligning actions for immediate
humanitarian assistance to protect lives and livelihoods,
long-term development and sustaining peace, is key to
building resilience of the most vulnerable in these areas.
è Coherence in the formulation and implementation of
policies and investments among agri-food, health, social
protection and environmental systems is essential to build
on synergies towards more efficient and effective food
systems solutions to deliver affordable healthy diets for all.
è Innovative mechanisms to reduce climate-related
risks, widespread adoption of climate-smart and
environmentally sound production techniques, and the
conservation and rehabilitation of natural environments
will strengthen the resilience of food systems against
increased climate variability and extremes.
è Effective and inclusive governance mechanisms and
institutions, in addition to access to technology, data
and innovation, should serve as important accelerators
in the comprehensive portfolios of policies, investments
and legislation aimed at transforming food systems to
increase the affordability of healthy diets.
è The economic fallout from the COVID-19 pandemic
has demonstrated that during economic slowdowns
and downturns, it is critical to keep food supply chains
operational, while providing adequate support to the
livelihoods of the most vulnerable, ensuring continued
production and access to nutritious foods, including
through enhanced social protection programmes.
è Given that food systems are affected by more than
one driver, and also impact on food security and nutrition
outcomes in multiple ways, comprehensive portfolios
of context-specific policies, investments and legislation
should be formulated to maximize their combined effects
on food systems transformation, while recognizing that
financial resources are limited.
è The persistence of socio-economic inequalities
amplifies the need for systemic changes in food systems
to provide vulnerable and historically marginalized
populations with greater access to productive
resources, technology, data and innovation to empower
them to become agents of change towards more
sustainable food systems.
è Systems approaches that contribute to win-win
solutions and help manage trade-offs are needed to build
coherent portfolios of policies, investments and legislation;
these include territorial approaches, ecosystems
approaches, Indigenous Peoples’ food systems approaches
and coordinated policy actions under protracted crisis
conditions, complementing peacebuilding efforts.
| 85 |
CHAPTER 4 WHAT NEEDS TO BE DONE TO TRANSFORM FOOD SYSTEMS
Global calls for action towards food
systems transformation
with greater resilience to the identified drivers,
and incentives are put in place for food systems to
provide affordable healthy diets sustainably and
inclusively, they can become a powerful driving
force towards ending hunger, food insecurity and
malnutrition in all its forms – and put us on track
towards achieving SDG 2, while also triggering
important synergies for other SDGs.
Over the past several decades, food systems
have delivered a wide variet y of foods needed to
feed a fast-growing and more urbanized world
population. But many of these food systems have
not succeeded in providing safe and nutritious
foods to nourish the entire world’s population
adequately, as nearly three billion people
could not even afford a healthy diet before the
onset of the COV ID-19 pandemic. Moreover, a
growing proportion of the world’s population
now consumes diets containing highly processed
energ y-dense foods and beverages high in fats,
sugars and/or salt. 94
This transformation of food systems demands
innovative systemic changes supported by an
enabling environment of institutions, policies,
laws, reg ulations and investments with
coherent and complementar y objectives, across
sectors. 86,95 In addition, incremental transitions
at small scale and structural changes to
institutions, legislation and standards at larger
scale are needed – in coordinated and integrated
ways – to achieve the desired transformation. 96
Importantly, coordinated action by all key
players in public and private sectors, academia,
civil societ y and international institutions is
essential, as is recognized by the aforementioned
global events. The challenges associated with
achieving such changes are immense, and
require significant mobilization of financial
resources, while ensuring the identification of
win-win solutions and managing trade-offs.
The inability of food systems to provide
households with adequate access to nutritious
foods that contribute to healthy diets – especially
in the aftermath of containment measures
aimed at stemming the still ongoing COVID-19
pandemic – has amplified the call for a
transformation of food systems 7 to make healthy
diets available and affordable to all. The urgent
need for this transformation has become central
to a global debate aimed at addressing some of the
greatest challenges to sustainable development,
specifically the challenge of ending hunger, food
insecurity and malnutrition in all its forms by
2030. Three global summits to be held during the
course of 2021 will address issues central to this
debate, including the UN Food Systems Summit
in New York (and the Pre-Summit held in Rome),
the 26th UN Climate Change Conference of
the Parties (COP26) in Glasgow, and the Tokyo
Nutrition for Growth Summit.
Best practices help illustrate
transformative changes needed
As already shown in Chapter 3, a number of
major drivers, through their impact on food
systems, have had increasingly negative effects on
food security and nutrition outcomes worldwide.
Major drivers include conflict, climate variability
and extremes, and economic slowdowns and
downturns, whose impacts are intensified
by poverty and inequality. In spite of these
challenges, if food systems are transformed am
Drawing upon best practices an and lessons
learned from a series of case studies worldwide, 97
this chapter provides policy g uidance for actors
at the local, countr y, regional and global levels
to transform food systems to be more resilient to
the major drivers behind recent increases in food
insecurit y and malnutrition, while improving
access to affordable healthy diets for all through
environmentally sustainable approaches.
It highlights the importance of understanding
specific contexts in addition to the needs of
v ulnerable population groups, including women,
children and youth, Indigenous Peoples, and
people living in conf lict-affected countries and in
remote areas.
am In the context of this report, food systems transformation happens
when profound and purposeful departures from business as usual are
introduced into any of the food system components, 3 resulting in
greater resilience to drivers of food insecurity and malnutrition, and in
greater affordability of healthy diets.
an A “best practice” can be defined as a practice that has proven to
work well, has produced good results through a sound evaluation, and is
therefore recommended as a model to be scaled up. It is a successful
experience, which has been tested, validated and repeated, and thus
deserves to be shared so that a greater number of people can adopt it.
| 86 |
THE STATE OF FOOD SECURITY AND NUTRITION IN THE WORLD 2021
As there are no one-size-fits-all solutions,
countr y-level experiences provide illustrative
examples of what it takes – in ver y practical and
innovative ways – to transform food systems.
In particular, coherence of policy measures and
investments between food systems and closely
related systems, such as agri-food, health,
environmental and social protection systems,
are considered. The examples demonstrate how
transformative measures, especially inclusive
governance mechanisms, technolog y, data and
innovation (in addition to legislation, standards
and other measures), can lead to successful
transformation of food systems.
4.1
Well over 100 contributions were received
in response to a global “call for best practices
in transforming food systems for affordable
healthy diets and addressing major drivers of
food insecurity and malnutrition”98 issued for
this report, supplemented by a questionnaire
circulated among partner agencies. Examples of
best practices and the lessons drawn from
them are detailed in the sections below.
The contributions demonstrate how major
drivers of food insecurit y and malnutrition
can be addressed and which key policy actions
are needed along one or more of six identified
pathways. In all cases, the importance of
ensuring better integration of various policy
platforms, and of measures and actions across
and within sectors is highlighted, with emphasis
on sectors covering natural resources, food,
agriculture, health, social welfare, education,
marketing, trade and investment. n
A key challenge that restricts successful
transformation of food systems is that
existing national, regional and global policies,
strategies, investments and legislation are
compartmentalized into distinct dialog ues:
for example, separate discussions on priorities
for political stabilit y or economic recover y,
disaster risk reduction and climate resilience,
trade and development in food and agriculture
sectors, or restoring health systems and ensuring
adequate social protection. 1,3,5,7 Too often, there
is insufficient recognition – or lack of action,
where there has been recognition – of important
relationships and complementarities among
these dialog ues and their relevance to key
functions of the food systems, such as ensuring
the sufficient production and supply of nutritious
foods and the affordabilit y of healthy diets.
SIX PATHWAYS TO
ADDRESS MAJOR
DRIVERS BEHIND
RECENT FOOD
SECURITY AND
NUTRITION TRENDS
Even though it is easier said than done,
these challenges can only be overcome
through the formulation and implementation
of cross-sectoral portfolios of policies and
investments that comprehensively address the
major drivers whose widespread effects on
food systems are resulting in negative food
securit y and nutrition outcomes (as presented
and analysed in Chapter 3). These portfolios
need to be well targeted and provide incentives
for all actors to change behaviour and to
engage constructively in innovative and
systemic changes that will lead to transformed
food systems.
The sections below discuss six possible pathways
( Figure 27) along which food systems can be
transformed to address the major drivers of
| 87 |
CHAPTER 4 WHAT NEEDS TO BE DONE TO TRANSFORM FOOD SYSTEMS
FIGURE 27 POSSIBLE PATHWAYS TOWARDS FOOD SYSTEMS TRANSFORMATION TO ADDRESS MAJOR
DRIVERS OF FOOD INSECURITY, MALNUTRITION AND UNAFFORDABILITY OF HEALTHY DIETS
One or more possible pathways towards transformation of food systems:
1
Integrating humanitarian, development and peacebuilding policies in
conflict-affected areas
2
Scaling up climate resilience across food systems
3
Strengthening resilience of the most vulnerable to economic adversity
4
Intervening along the food supply chains to lower the
cost of nutritious foods
5
Tackling poverty and structural inequalities,
ensuring interventions are pro-poor and inclusive
6
Strengthening food environments and changing consumer behaviour to promote
dietary patterns with positive impacts on human health and the environment
COUNTRY CONTEXT
Major drivers of food
insecurity and malnutrition:
conflict
climate variability
and extremes
economic slowdowns
and downturns
unaffordability of
healthy diets
underlying poverty
and inequality
Transformation of
food systems for
food security,
improved nutrition
and access to
affordable healthy
diets for all
SOURCES: FAO, IFAD, UNICEF, WFP & WHO. 2017. The State of Food Security and Nutrition in the World 2017. Building resilience for peace and food
security. Rome, FAO; FAO, IFAD, UNICEF, WFP & WHO. 2018. The State of Food Security and Nutrition in the World 2018. Building climate resilience for
food security and nutrition. Rome, FAO; FAO, IFAD, UNICEF, WFP & WHO. 2019. The State of Food Security and Nutrition in the World 2019. Safeguarding
against economic slowdowns and downturns. Rome, FAO; FAO, IFAD, UNICEF, WFP & WHO. 2020. The State of Food Security and Nutrition in the World
2020. Transforming food systems for affordable healthy diets. Rome, FAO.
food insecurit y and malnutrition identified
and reviewed in previous chapters – and as
summarized in Box 1. Ever y one of the pathways
builds on key recommendations from the
previous four editions of this report (2017–2020)
and corresponds to one or more of the major
drivers discussed and analysed in Chapter 3.
combination of drivers impacts most on the
identified food system and on related food
securit y and nutrition outcomes. The pathways
may also complement and reinforce each other.
Drawing upon illustrative examples from
country case studies, in addition to policy
recommendations from the scientific community
and previous editions of this report, the remainder
of this chapter reviews practical steps for
building the recommended portfolios of policies
and investments along the six transformation
pathways. Figure 28 illustrates the recommended
steps in the entire process towards food systems
transformations that address the major drivers of
These transformation pathways form a basis
for formulating a coherent set of policy
and investment portfolios to enable the
transformation of food systems (see also Figures 28
and 29). The relevant set of pathways is derived
from a context-specific situation analysis
(see below) that determines which driver or
| 88 |
THE STATE OF FOOD SECURITY AND NUTRITION IN THE WORLD 2021
FIGURE 28 STEPS TOWARDS FOOD SYSTEMS TRANSFORMATION FOR MORE AFFORDABLE HEALTHY DIETS
FOOD SYSTEMS TRANSFORMATION
Situation analysis:
food systems performance,
food security and nutrition
situation
Ensure coherence with other
systems: agri-food,
environmental, health, social
protection and others
Identify win-win
opportunities and
trade-offs
6 possible pathways towards
transformation
1 2 3 4 5 6
Major drivers drivers impacting on
food systems (driving recent food
security and nutrition trends)
SITUATION ANALYSIS
Identify actions to
address drivers
along alternative
pathways
(best practices)
Identify
accelerators to
support and speed
up transformative
processes
BUILDING PORTFOLIOS
Scale up and re-evaluate
food systems performance
and food security and
nutrition situation
Formulate
portfolios of
policies,
investments and
legislation for
food systems
transformation
Implementation:
monitoring and
evaluation,
accountability
Transformation of
food systems for
food security,
improved nutrition
and access
to affordable
healthy diets
IMPLEMENTATION
SOURCE: FAO.
food insecurity, malnutrition and unaffordability
of healthy diets for all. Broadly speaking, the
process requires (i) an in-depth context-specific
situation analysis; (ii) the formulation of coherent
cross-sectoral portfolios of policies, investments
and legislation, and including accelerators that
spur the transformative processes; and (iii)
the implementation of these portfolios with
adequate monitoring and evaluation, as well as
accountability mechanisms in place.
decide where in the food system systemic
changes are needed to achieve desired outcomes.
Furthermore, through a multi-stakeholder
consultation, the relevant policy, investment and
governance environments in the country are
identified, taking into account the most relevant
institutions and any political economy issues. 7
All of the above will help identify which pathways
towards food systems transformation are most
appropriate within a given context.
The situation analysis covers a context-specific and
comprehensive assessment of which major drivers
impact negatively on food systems and result in
poor food security and nutrition outcomes, based
on available data and information as provided
annually in this report (and in other key references
at global, national and local levels). 99,100,101,102,103,104
Depending on which drivers of food insecurity
and malnutrition are present, stakeholders
For each applicable pathway, recommended
policy options and best practices are then
reviewed to illustrate the t y pe of actions that
could be taken and to inform the formulation
of policy and investment portfolios – and
associated accelerators – for food systems
transformation. This part of the process is
illustrated in the section below. The disastrous
impact of the ongoing COV ID-19 pandemic on
| 89 |
CHAPTER 4 WHAT NEEDS TO BE DONE TO TRANSFORM FOOD SYSTEMS
human health and economies worldwide, and
the importance of social protection systems
to help ensure adequate access to nutritious
foods for the most v ulnerable, demonstrate the
interconnectedness of, especially, the agri-food,
health, environmental and social protection
systems. Ensuring coherence among these and
other relevant systems is a sine qua non condition
to facilitate the transformative processes.
This and other key building blocks of policy and
investment portfolios ( Figure 29) are discussed in
more detail in Section 4.2.
food environment and consumer behaviour,
generally apply to challenges faced by most
food systems. 7
1. Integrating humanitarian, development and
peacebuilding policies in conflict-affected areas
It is important to recall that the majorit y of
the chronically food insecure and many of the
malnourished live in countries affected by
insecurit y and conf lict. Therefore, it is imperative
that conf lict-sensitive policies, investments and
actions to reduce immediate food insecurit y and
malnutrition be implemented simultaneously
with those aimed at a reduction in the levels
of conf lict, and aligned with long-term
socio-economic development and peacebuilding
efforts. 1 Under conditions of violent conf lict,
entire food systems are often severely disrupted,
challenging people’s access to nutritious foods.
Emergency food assistance programmes,
emergency support to ensure clean water, qualit y
health ser vices and sanitation, and inter ventions
to maintain livelihoods are among the t y pical
crisis response and social protection mechanisms
implemented to ensure minimum levels of food
securit y and nutrition.
Examples of best practices along six
pathways towards food systems
transformation
Upon completion of an in-depth context-specific
situation analysis of major drivers and their
impact on food systems and on food insecurit y
and malnutrition in all its forms, the chosen
pathways indicate which transformative measures
to consider. Illustrative examples of best practices
and important policy measures in each of these
transformation pathways are provided below. ao
As many countries are affected by the major
drivers, which also interact (elaborated in
Chapter 3), several pathways will apply
simultaneously, calling for coherence among
them to ensure efficiency in implementation.
Similarly, many of the best practices and
policy measures discussed in this section
are supportive of more than one pathway.
For example, best practices in building
resilience to climate variabilit y and extremes
(pathway 2) may also provide increased levels
of resilience in countries affected by economic
slowdowns and downturns (pathway 3) or
conf lict (pathway 1). Furthermore, given
persistent and high levels of income inequalit y
in most LMICs, in particular, best practices and
policy measures elaborated under pathway 5
apply to many countries. Similarly, the best
practices and policy measures discussed
under pathway 6, which focuses on the
In Yemen, conf lict is the main driver of
severe food insecurit y and malnutrition,
requiring a large-scale humanitarian response.
Acute malnutrition has reached record levels,
affecting half the children under five years
of age. 105 Among the major causes are a high
prevalence of communicable diseases due to
poor water qualit y. Near the capital Sana’a, a
breakdown of a major wastewater treatment
plant in 2017 resulted in contaminated
water being used for vegetable production,
causing cholera outbreaks and a scarcit y
of fresh vegetables in peri-urban areas.
Through an emergency inter vention in
2018 –2019, cost-effective small-scale water
treatment plants were built and water-efficient
drip irrigation systems installed covering 60 ha
of irrigated land for vegetable production.
The inter vention produced multiple benefits,
including clean water provision, availabilit y
of uncontaminated vegetables, and restored
livelihoods. 97,106 This example highlights the
importance of ensuring local food systems
provide minimum levels of access to safe and
nutritious foods, also in conf lict-affected areas.
ao For each pathway, key policy areas and associated goals are
summarized (Tables 8–13). Importantly, key policy recommendations
provided are not exhaustive. Rather, for a more in-depth discussion of
recommended policies and actions needed to comprehensively address
the major drivers behind recent food security and nutrition trends, the
four most recent editions of this report (2017–2020) should be consulted.
| 90 |
THE STATE OF FOOD SECURITY AND NUTRITION IN THE WORLD 2021
In conflict-affected areas, peacebuilding efforts
are of paramount importance in achieving
long-term food security and improved nutrition.
Furthermore, resilience-building programmes, as
well as social protection mechanisms, should be put
in place without delay; otherwise, individuals and
households may engage in increasingly destructive
and irreversible coping strategies (such as selling
productive assets) that threaten future livelihoods
as well as their food security and nutrition.1
Conflict-affected countries have been particularly
hard hit during the COVID-19 pandemic.
For example, due to movement restrictions, it has
often been difficult to reach refugees and internally
displaced persons (IDPs) with humanitarian
assistance and other forms of support needed to
ensure sufficient access to nutritious foods.
households were provided with seeds and tools
for home gardening, and pastoralists were given
support for livestock, which improved animal
health and milk production. The programme has
increased access to food by households under
emergency conditions, improved the qualit y
and diversit y of their diets, and enhanced
the nutrition knowledge of the programme’s
participants through nutrition and food
safet y education.
In a context of escalating conflict, displacement,
climate shocks and commodity price fluctuations
in the Central Sahel (Burkina Faso, Mali and
Niger), a multi-pronged food systems approach
has been implemented, where food production,
transformation, logistics, retail and consumption
are aligned with the objectives of responding
to the food security and nutrition crises, while
also strengthening systems to better respond to,
manage and prevent future crises. At the food
production level, farmers are supported with
productive assets, training in climate-smart
agriculture practices and improved market access.
At the food processing level, the capacities of
women’s groups and local agribusinesses are
strengthened to produce fortified blended foods
and fortified staples to improve the nutritional
quality of food available on the market. And at the
food environment level, to prevent malnutrition,
access to nutritious foods and protection against
price fluctuations is provided through a food
voucher system for locally available nutritious
foods that are otherwise not affordable.
In addition, nutritionally vulnerable women
and children are supported with programmes
to prevent acute malnutrition. Hence, multiple
entry points are used to ensure linkages among
food, health and social protection systems, and to
develop the capacity of governments to improve
food quality and safety, and to systematically
analyse food price data for decision-making.
In this way, short-term emergency needs are met,
and the resilience of individuals, households and
communities strengthened. 109
Deep economic crises can unfold where the
structural causes of conf lict situations are linked
to competition over natural resources, including
productive land, forest, fisheries and water
resources. Policies supported by institutional
and legal reforms, where needed, should address
these causes and aim to mitigate – and if
possible, prevent – their impact on food systems,
food securit y and nutrition, and the economy
at large. Especially in the context of protracted
crisis situations, with possible periods of low
(but persistent) levels of conf lict and prolonged
periods of displacement, it is critical to maintain
food and agricultural production, sustain food
supply chains and ensure people’s access to
nutritious foods and healthy diets. 5
The above scenario applies in Somalia, where
people have experienced a three-decade-long
protracted crisis with periods of severe food
insecurit y and malnutrition (and including
famine in 2011), in addition to frequent extreme
climate events (mainly droughts and f loods).
In recent years, appropriate action has been taken
as, for example, in response to drought-induced
large-scale food insecurit y and malnutrition
that affected up to 6 million people during
2017–2019, including acute malnutrition among
900 000 children. 107 A nutrition-sensitive “Cash+”
programme was implemented in 2018 that
combined unconditional long-term cash transfers
with livelihood support to build resilience to
future shocks, while maintaining productive
capacit y and food supply chains. 108 Agricultural
Prior to the recent violent and deadly conflict
with Israel, Palestine had already endured a
fragile security situation for decades, affecting
food security and nutrition. Restrictions on the
movement of people and goods, as well as limited
access to natural resources and international
| 91 |
CHAPTER 4 WHAT NEEDS TO BE DONE TO TRANSFORM FOOD SYSTEMS
TABLE 8 KEY POLICY AREAS AND GOALS FOR INTEGRATING HUMANITARIAN, DEVELOPMENT
AND PEACEBUILDING EFFORTS IN CONFLICT-AFFECTED AREAS
Policy area
Goals
Peacebuilding efforts linked
to livelihood support
} Ensure that conflict-sensitive policies and actions at a minimum do no harm.
} Reduce/avoid conflict over access to and use of natural resources, while
maintaining productive capacity.
} Prevent destructive coping mechanisms (sale of assets).
} Meet immediate food security and nutrition needs.
Nutrition-sensitive social protection and
food production and supply programmes
} Livelihood support and social protection measures to ensure food security and
nutrition and a robust recovery.
Maintaining key functions of food
supply chains
} Re-engage smallholders, both during and in the aftermath of conflicts, to ensure a
rapid stabilization of food supply for own consumption and commercialization.
Community-based approaches in
post-conflict policies
} Foster trust and social cohesion for reduced uncertainties, reinforced positive
aspirations and improved well-being.
SOURCE: FAO, IFAD, UNICEF, WFP & WHO. 2017. The State of Food Security and Nutrition in the World 2017. Building resilience for peace and food
security. Rome, FAO.
2. Scaling up climate resilience across food systems
markets, had placed a heav y burden on local food
systems and people’s livelihoods. In spite of the
difficult circumstances, there have been efforts
to strengthen the resilience of food systems
within the context of periodic conflict, as well
as social, environmental and economic shocks.
Some food systems have been transformed into
more resource-efficient and diversified market-led
systems through improved agricultural knowledge,
strengthened post-production and market
capacities, increased value chain services and
empowered producer cooperatives. Results (prior
to the recent conflict) show a 12 percent
improvement in land productivity, 10 percent
improvement in marketing values, 15 percent
reduction in production costs and an overall
10 percent increase in profitability among the
agribusinesses run by small- and medium-scale
farmers supported by the project. 97 Production of
high-value crops, compliant with international
quality and safety standards, and strengthened
linkages between small-scale producers (and
their cooperatives) and other value chain actors,
including distributors and marketers, have raised
export revenues, in addition to nutritious and safe
foods being made available on local markets.
The ways we produce food and use our natural
resources can help deliver a climate-positive
future in which people and nature can coexist
and thrive. 110 This is important, not only because
food systems are affected by environmental
degradation and climate events, but also
because food systems themselves impact on
the state of the environment and are a major
driver of climate change. Central to this effort
are priorities to protect nature, to sustainably
manage existing food production and supply
systems, and to restore and rehabilitate natural
environments. 111,112
Solutions require increased partnerships and
multi-year, large-scale funding in support
of (among others): integrated disaster risk
reduction and management programmes; climate
change adaptation policies; and practices that
are short-, medium- and long-term in scope 3
to mitigate the impact of climate variabilit y
and extremes, including on persistent povert y
and inequalit y. 113 Adopting climate-sensitive
approaches in food and agricultural investments
can reduce food securit y risks associated with
climate extremes, build long-term resilience
and strengthen coping mechanisms along food
supply chains. 114
Drawing upon key policy recommendations from
the 2017 edition of this report, complemented
by more recent evidence, Table 8 provides a short
list of the most important policy measures to
be considered for integrating humanitarian,
development and peacebuilding efforts in
conf lict-affected areas.
The implementation of climate resilience
policies and programmes requires adapting
and refitting tools and inter ventions such as
risk monitoring and early warning systems,
| 92 |
THE STATE OF FOOD SECURITY AND NUTRITION IN THE WORLD 2021
emergency preparedness and response,
v ulnerabilit y reduction and resilience-building
measures, shock-responsive social protection
mechanisms, risk transfers (including climate
risk insurance) and forecast-based financing, in
addition to strong risk governance structures in
the environment–food–health system nexus. 3
To ensure their enforceabilit y, such tools may
need to be grounded in legislation. Climate risk
and food insecurit y are deeply intertwined
in rural areas of the developing world, which
has led to the development of various asset
insurance schemes targeted specifically at poor
and v ulnerable households. The challenges
of making micro-insurance markets work
are multiple; nevertheless, available analysis
suggests the potential gains to solving these
challenges are substantial. 115
in Mexico, the CADENA Programme has scaled
up smallholder access to agricultural insurance
through a subsidized public–private insurance
scheme, which promotes the engagement of the
private insurance sector in small-scale agriculture
in providing insurance coverage related to a wide
variety of climate-related risks. 116
In Zambia, new initiatives aimed at raising
climate resilience include the introduction
of agricultural insurance for v ulnerable
households. Households that adopt conser vation
agriculture techniques are provided with
access to agricultural insurance, which in turn
allows for investment in riskier projects with
potentially higher revenues. Under this approach,
agricultural insurance is not only important for
building climate resilience but could also lead to
poverty reduction and increased food security
and improved nutrition. Elsewhere, different
types of agricultural insurance schemes aimed
specifically at poor and v ulnerable smallholder
households have been developed.
In Lao People’s Democratic Republic, diversified
and climate-resilient agricultural practices
introduced in 2016 through farmer field schools
and farmer nutrition schools resulted in positive
impacts on soil conservation, biodiversity, and
income and nutritional outcomes. In particular,
community-based approaches with a strong focus
on women’s empowerment resulted in increased
purchasing power and higher dietary diversity
among women and children, in addition to
positive impacts on children’s health. 97
A proven approach to building climate resilience
is climate-smart agriculture (CSA), which
builds resilience in multiple ways through
climate-sensitive and socio-economically
beneficial approaches that have demonstrated
triple wins in food systems transformation: CSA
approaches sustainably increase agricultural
productivity and improve incomes, build
resilience to the impacts of climate change and
reduce GHG emissions. 117
In Ethiopia, during 2015–2020, a CSA project
focused on supporting women resulted in
increased crop revenue while reducing the
risk of food deficits that many participants
had experienced before the implementation of
the project. Other examples worldwide have
demonstrated that the adoption of sustainable
agricultural practices raises productivity
and enhances food systems resilience, while
helping to reduce poverty, food insecurity and
malnutrition. 3
Implementing insurance schemes against disaster
risk in agriculture is a costly endeavour that
faces several challenges and constraints (e.g.
infrastructural, reg ulator y and socio-economic).
Nevertheless, integrating agricultural insurance
schemes as a component of broader social
protection programmes can lead to increased
smallholder resilience and reduced rural poverty,
while also reducing the cost of existing social
protection mechanisms and strengthening the
planning capacities of public agencies, when it
comes to mitigating and transferring the risk of
natural disasters. This has been demonstrated
by a number of successful agricultural insurance
schemes implemented in recent years, such as
the Index-based Livestock Insurance (IBLI)
programme in Ethiopia and Kenya.115 Likewise,
Access to water is essential for smallholders
to build climate resilience while also working
towards more equitable and sustainable
livelihoods. It is estimated that 77 percent of
small-scale farms across LMICs are located
in water-scarce regions, while only 37 percent
have access to irrigation. 118 In arid areas of the
Sahel region, climate change has exacerbated
irreg ular rainfall and other climate extremes,
| 93 |
CHAPTER 4 WHAT NEEDS TO BE DONE TO TRANSFORM FOOD SYSTEMS
The territorial management and knowledge
systems of Indigenous Peoples are useful for
improving climate resilience, as these systems
have enabled them to generate food in some
of the most hostile environments and fragile
ecosystems in the world. 112,123,124 In Guatemala,
the Maya Ch'orti' Indigenous Peoples living in
the Dr y Corridor (Corredor Seco) have subsisted
on farming in a dr y environment for years, but
increasing drought fuelled by climate change
has led to increasing rates of food insecurit y
and malnutrition. A reforestation and water
management project is now bringing renewed
impetus to the use and conser vation of endemic
vegetal and animal species that are well adapted
to the dr y environment. The Maya Ch'orti' have
benefited from this support, which has led to a
reduction of stunting by 51 percent following
improved food consumption and diet qualit y. 98
such as repeated droughts and f loods.
The consequences have been devastating for
the poorest rural households, who have seen
their v ulnerabilit y worsen as they struggle to
cope with these shocks. Efficient, sustainable
and fair management of water resources is more
than ever a priorit y to improve the resilience
of v ulnerable communities and raise their
levels of food securit y and nutrition. 119 Many
studies have documented how investments in
water-har vesting techniques and irrigation
infrastructure result in win-win solutions as
the increased water-use efficiency also rises
crop yields. 118
In Kiribati, the combination of climate change,
limited access to clean water, and unreliable
imported food supplies have contributed to
growing malnutrition and unhealthy diets.
A community development project began in 2014
to provide rainwater-har vesting infrastructures
and training related to household food production
(home gardening and poultr y). As a result,
households reported an 80 percent reduction of
cases of diarrhoea and dysenter y and a 90 percent
improvement in terms of access to clean water. 120
In Colombia, the Tikuna, Cocama and Yagua
Indigenous Peoples living in the Tarapoto Lakes
complex maintained sophisticated food systems
for hundreds of years that were adapted to a
unique forest and aquatic flooding-ecosystem,
which later became a Ramsar Convention ap
Amazon protected area. 112 But with the rapid
growth of food markets in urban areas, increased
demand for fish and wild animals provoked
new extractive fishing and hunting methods.
These unsustainable fishing practices, such
as the replacement of traditional traps with
metal and nylon wires, led to the depletion of
fish and game stocks. Calling upon traditional
indigenous knowledge and governance systems,
a community-based fishing agreement was
drawn up and complemented by an educational
programme for indigenous youth to re-establish
sustainable fishing practices. The agreement,
based on collective rights, regulates the use of
fishing tools, includes temporary bans on certain
species and establishes fishing standards. 112,125
Today, healthy fish populations provide essential
protein within a thriving indigenous food system
counting over 153 different foods – largely wild
and semi-wild foods. 126,127,128
Land is another crucial natural resource to build
resilience to climate extremes. Many v ulnerable
producers face degradation in the qualit y of their
land, which is increasingly linked to povert y and
food insecurit y, and higher levels of v ulnerabilit y
to climate change. A vast majorit y of people
living on degraded agricultural land live in
LMICs. 121 In Ethiopia, a 2015 –2020 landscape
restoration project not only helped raise farm
productivit y through soil and water conser vation,
but also successfully linked farmers to markets,
thereby raising their income-generating
potential. Households reported improvements in
food securit y, average household income grew
significantly and minimum dietar y diversit y
scores increased. 98 In India, a 2012–2016 land
restoration and crop intensification project used
traditional water storage systems (haveli) in
combination with infrastructure investment and
technolog y transfers, with positive effects on
degraded and rainfed lands: crop yields increased
by 10 to 70 percent, and average household
incomes grew by 170 percent. 97,122 This approach
also enabled groundwater recharges, resulting in
improvements in water-use sustainabilit y.
The utilization of traditional varieties and wild
edible species from local food systems to increase
ap The Ramsar Convention refers to The Ramsar Convention on
Wetlands of International Importance Especially as Waterfowl Habitat.
| 94 |
THE STATE OF FOOD SECURITY AND NUTRITION IN THE WORLD 2021
TABLE 9 KEY POLICY AREAS AND GOALS FOR SCALING UP CLIMATE RESILIENCE ACROSS FOOD SYSTEMS
Policy area
Goals
Reducing climate-related risk and
adapting to climate change
} Increase resilience to climate events along the entire food supply chain to fewer
disruptions in food production and supply.
} Protect smallholders against climate events that could affect their livelihoods,
including through climate risk insurance.
} Create an enabling environment for promoting sustainable investments in
agriculture.
Establishing climate risk monitoring and
early warning systems
} Reduce impact of different hazards, including climate extremes, in both food
systems and livelihoods.
Improving access to, and management
of, natural productive resources
} Sustainable increase in agricultural productivity (with positive effects on natural
resources and the environment), including through climate-smart agricultural
practices.
SOURCE: FAO, IFAD, UNICEF, WFP & WHO. 2018. The State of Food Security and Nutrition in the World 2018. Building climate resilience for food
security and nutrition. Rome, FAO.
climate resilience has also been applied in Brazil,
Kenya, Sri Lanka and Turkey. 97 The approach
seeks out potential improvements along food
value chains, building farmers’ capacit y to
produce traditional crops and species in adequate
quantit y and qualit y, while raising consumer
awareness and demand for these products.
This initiative also builds on linkages with other
programmes: in Brazil, local products have been
included in the public procurement system, and
in the meals that are part of the school feeding
programmes. In Kenya, traditional products
have been included in farm-to-school networks
that provide school meals, while in Sri Lanka,
32 market outlets are now selling products made
from traditional food crops. 129
the importance of building resilience in the
face of economic adversity. 13 Critically, the need
for economic and social policies, institutions,
legislation and other measures to be in place
well in advance of economic slowdowns and
downturns became evident, as these measures
are designed to counteract the effects of adverse
economic cycles when they do arrive, especially
for the most vulnerable population groups,
and to maintain access to nutritious foods and
healthy diets. In the immediate term, such
policies, laws and investments must include social
protection mechanisms and primary healthcare
services, while supporting household income and
livelihoods through social assistance or active
labour market policies.
Countr y examples of best practices presented
above illustrate some of the innovative measures
towards building climate resilience that have
evolved in recent years. Key policy areas and
goals for scaling up climate resilience across food
systems are presented in Table 9. The 2018 edition
of this report contains an in-depth discussion of
policy areas and measures aimed at strengthened
resilience to climate variabilit y and extremes.
Social protection programmes have been
central to government policy responses to the
consequences of the COV ID-19 pandemic on
people’s incomes and livelihoods. By May 2021,
more than 200 countries and territories in the
world had implemented at least one social
protection initiative, comprised mostly of cash
and in-kind transfers, waived or postponed
financial obligations and labour reg ulations.
Together, these measures have benefited just
over 1.5 billion people worldwide. 13 Importantly,
largely due to financial constraints, many
COV ID-19-related social protection responses
had low coverage, provided small transfers
and could be maintained only for a limited
period of time. Cash transfer programmes,
for example, were implemented on average for
only four months. In Timor-Leste, one of the
3. Strengthening resilience of the most vulnerable
to economic adversity
In 2020, as world GDP contracted by an estimated
3.3 percent during the COVID-19 pandemic, 130
counteractive measures, including stepped-up
social assistance, employment and social insurance
programmes, and large-scale emergency measures
to protect economies worldwide, demonstrated
| 95 |
CHAPTER 4 WHAT NEEDS TO BE DONE TO TRANSFORM FOOD SYSTEMS
poorest countries in the world, a universal
cash transfer was established in June 2020,
followed by a subsidy for three months directed
at self-employed and informal workers, 13 which
helped buffer the income shock of measures
taken during the pandemic on the population. 131
on their meals as schools closed to stem the
spread of the COV ID-19 disease. To date, 27
countries have not re-opened schools, seven
of which have important school food and
nutrition programmes.
In several countries, in an effort to further
institutionalize school feeding programmes,
innovative approaches include home-grown
school feeding (HGSF) and school gardens
that improve the nutritional status of school
children while also promoting access to an
increased supply of affordable nutritious foods.
Other benefits of these initiatives include raising
awareness of the importance of healthy diets and
shifting households’ food demand towards more
nutritious foods. Arg uments in favour of HGSF
as a transformative measure to strengthen food
systems are presented in Box 9.
In Panama, an inter-ministerial programme
aimed at providing support to families affected
by the COV ID-19 pandemic has delivered in-kind
food transfers to some of the most v ulnerable
populations. Procured directly from food
producers nationwide, the programme provides
diverse and nutritious foods including animal
source foods, fruits, vegetables, leg umes, roots
and tubers. In Jamaica, rural livelihoods were
supported by reinforcing the Government’s
public procurement mechanism during 2020, with
a focus on female-headed farming households.
In addition, in-kind transfers consisting of
locally grown fresh foods were delivered to the
programme’s beneficiaries, supporting both
household incomes and food intake.
In Ethiopia, a further innovative social protection
scheme provides digital access to monthly food
vouchers, tailored to household size for an amount
based on the cost of a nutritious diet. In rural
areas, mothers with children under two years
of age are provided vouchers for the purchase
of fresh fruits, vegetables and eggs. These are
redeemed with local retailers, who themselves
have received training to improve the quality and
safety of their food supply. As a complementary
action, changes in social behaviour are
encouraged through community counselling and
media campaigns to promote improved dietary
diversity and care practices and to raise demand
for fresh fruits and vegetables. An external
evaluation revealed that the voucher programme
has increased the profits of rural food retailers by
as much as 40 percent and shortened food supply
chains, while also having a positive impact on the
dietary diversity of mothers and their children. 97
Elsewhere, in Brazil, the mandator y closure of
schools due to the pandemic put the continued
implementation of a nationwide school feeding
programme targeting millions of beneficiaries
at risk. The programme was rapidly modified
to enable in-kind food transfers to be
delivered directly to children’s homes instead.
Even under much more difficult circumstances,
food kits include at least 30 percent locally
procured fresh foods, as established by Brazil’s
school feeding law. 97
Before the COV ID-19 pandemic, school feeding
programmes reached 388 million children
worldwide, representing one of the largest
social protection mechanisms. Between 2013
and 2020, the number of children receiving
meals through school feeding grew by 9 percent
globally and by 36 percent in low-income
countries. This growth ref lects a widespread
institutionalization of these programmes, as
80 percent of countries have integrated school
feeding into their policies (up from 42 percent in
2013) with 90 percent of their funding coming
from national budgets. 132 The importance
of school food and nutrition programmes
has been underscored during 2020 –2021, as
millions of children globally have missed out
In Kyrgyzstan, an ongoing “Cash Plus” approach
aims to strengthen the impact of the national
cash transfer programme. Positive results at
household level include increased and more
diversified food production for own consumption
and stepped-up engagement in income-generating
activities. Seventy-four percent of households
increased agricultural productivity, and
90 percent of beneficiaries improved dietary
diversity and nutritional outcomes, for both
mothers and their children. 98
»
| 96 |
THE STATE OF FOOD SECURITY AND NUTRITION IN THE WORLD 2021
BOX 9 HOME-GROWN SCHOOL FEEDING AS A LEVER FOR FOOD SYSTEMS TRANSFORMATION
School feeding programmes, coupled with nutrition
education and other nutrition interventions, support
access to school and learning opportunities, while also
providing school children with food and other services
that contribute to better health and nutrition. They also
improve children’s learning abilities for a better
future.133 The programmes are particularly beneficial in
LMICs, where many children suffer from micronutrient
deficiencies. The school meals are often the only
nutritious meals the children eat;134 moreover, they
provide an incentive to attend school.
When linked to smallholder agriculture, school
feeding programmes and other healthy public food
procurement and service policies135 can promote
additional social, economic and environmental benefits.
Moreover, they can become an entry point for food
systems transformation, especially if they are scaled
up. The home-grown school feeding (HGSF) model
is designed to provide children in schools with safe,
diverse and nutritious food, partially food sourced
locally from smallholders.136 In integrating education,
agriculture, social protection and public procurement
objectives, these programmes provide both educational
and food security and nutrition gains for children,
as well as livelihood gains for smallholders and their
communities. In addition, by changing procurement
practices and creating a demand for healthy diets
through sustainable food systems, HGSF can incentivize
those involved in the supply chain to support a
transition towards more sustainable food production
and consumption patterns. School feeding programmes
can create 1 700 jobs for every 100 000 children fed.132
Kenya and Ethiopia have embraced HGSF
approaches, illustrating the importance of a
multisectoral approach for successful implementation.
In Kenya’s Busia County, challenges related to
poverty, food insecurity and malnutrition, as well as
biodiversity loss, were addressed through a HGSF
approach conceptualized by a Biodiversity for Food
and Nutrition (BFN) project. The combined goal
was to improve student nutrition while promoting
biodiversity conservation, the empowerment of local
farmers and the development of inclusive value
chains.137 Implemented since 2012, the initiative has
triggered local demand for traditional African leafy
vegetables (ALVs), leading to improved nutritional
practices and creating jobs through local public
procurement, while enhancing territorial biodiversity.
The numerous benefits include improved capacity
of smallholders to access new and steady markets,
and increased awareness and interest among youth
in sustainable agriculture and environmental issues.
Moreover, the resilience of local agricultural systems
has been reinforced while crop diversification has been
enhanced; thousands of students have received school
meals enriched with ALVs that improve their nutrition
and health.
In Ethiopia, the HGSF approach has served as a
lever for food systems transformation, specifically
in addressing existing bottlenecks in procurement
and along supply chains.138 The solutions to these
bottlenecks include (i) conducive public procurement
regulatory frameworks and (ii) improving the
inclusivity and efficiency of local supply chains,
using a multisector and multidimensional approach.
Specifically, in reforming its HGSF programme,
Ethiopia has been able to address challenges faced
by smallholders in accessing schools and other formal
markets. Smallholders now have greater access to new
market opportunities and to increased and more stable
sources of income. The programme has also directly
impacted the lives of vulnerable children and their
families, providing daily school meals and contributing
to their nutrition, health and education.
The tremendous potential of HGSF programmes
to enable food systems transformation has become
more evident as a result of COVID-19-induced
economic shocks and crises in the education sector,
which has seen more than 199 countries closing
schools and cutting off school feeding supply chains,
affecting an estimated 370 million children.132 Based
on the Kenyan and Ethiopian experiences, which
demonstrate the potential for positive change, there
is an urgent need to review existing school food
and nutrition practices to build more resilient rural
livelihoods and ensure that vulnerable children,
smallholder farmers and others dependent on
well-functioning food systems are better protected.
| 97 |
CHAPTER 4 WHAT NEEDS TO BE DONE TO TRANSFORM FOOD SYSTEMS
TABLE 10 KEY POLICY AREAS AND GOALS FOR STRENGTHENING RESILIENCE OF THE MOST VULNERABLE TO
ECONOMIC ADVERSITY
Policy area
Goals
Strengthening agri-food productivity and
market linkages along the food supply
chain
} Improve income opportunities for smallholders and other actors of the food supply
chain.
Curbing rises in food prices and excessive
price volatility and/or mitigating their
effects
} Reduce the vulnerability of poor households and net food buyers in accessing food.
} Avoid undesirable coping strategies during periods of extreme food price
fluctuations.
Boosting job creation and expanding
social protection schemes
} Minimize short-term impacts of economic shocks among vulnerable households
through nutrition-sensitive social protection programmes.
} Stabilize incomes and food consumption.
SOURCE: FAO, IFAD, UNICEF, WFP & WHO. 2019. The State of Food Security and Nutrition in the World 2019. Safeguarding against economic
slowdowns and downturns. Rome, FAO.
» As countries move beyond the COV ID-19
4. Intervening along food supply chains to lower the
cost of nutritious foods
pandemic, it is vital that adequate levels of
public spending on health and social protection
systems be maintained. Any cuts would likely
increase hardship among already disadvantaged
groups, weaken performance, increase the risk
of negative health and nutrition outcomes, add
to fiscal pressures and undermine development
gains. 139,140 In the medium term, these
policies should be institutionalized as part of
national social protection systems, together
with increasing access to social ser vices. 5 In
addition, other innovative measures towards
building economic resilience should be
implemented, such as stepping up access to
agricultural insurance for food producers, many
of whom are v ulnerable to both climate-related
and economic shocks. 141 Such insurance
schemes (as discussed under pathway 2) can
help reduce povert y, especially when combined
with social protection schemes. 142
Inter ventions along food supply chains are
needed to increase the availabilit y of safe and
nutritious foods and lower their cost, primarily
as a means to increase the affordabilit y of
healthy diets. This pathway calls for a coherent
set of policies and investments from production
to consumption aimed at realizing efficiency
gains and cutting food losses and waste to help
achieve these objectives. 7 Incentives should,
among others, stimulate diversification of
production in the food and agriculture sectors
towards nutritious foods, including fruits,
vegetables, leg umes and seeds, as well as
animal source foods and biofortified crops,
in addition to investments in innovation,
research and extension to raise productivit y.
Elsewhere in the supply chain, the nutritional
qualit y of food products and beverages can
be improved by post-har vest fortification
of staple foods in line with international
g uidelines. 143,14 4,145,146 Food manufacturers and
retailers can also reformulate their products to
eliminate industrially produced trans-fatt y acids
and reduce levels of saturated fat, sugars and/or
salt (see also pathway 6).
Countr y examples under this third pathway
have highlighted the importance of a number
of innovative social protection mechanisms
aimed in particular at strengthening resilience
of the most v ulnerable populations to economic
slowdowns and downturns, as also experienced
during the COV ID-19 pandemic. There are many
other longer-term policy measures that need to
be considered to strengthen economic resilience
as discussed in detail in the 2019 edition of this
report. Several key policy areas and goals are
presented in Table 10. 5
Fortification and biofortification have been
used as a cost-effective measure to reduce
micronutrient deficiencies while increasing the
availability – and lowering the cost – of nutritious
foods. The fortification of staple foods has been
an effective strateg y to supply micronutrients to
entire populations (such as universal iodization
of salt, and iron and folic acid fortification of
| 98 |
THE STATE OF FOOD SECURITY AND NUTRITION IN THE WORLD 2021
wheat or maize flour). In Peru, the fortification of
rice with 9 vitamins and minerals has been scaled
up, where it has been included in the school
feeding programme and other social protection
programmes. Considering that micronutrient
deficiencies and anaemia are widespread in the
population across socioeconomic groups, the
countr y approved the national rice fortification
law in 2021.
enhancing their role in promoting healthy
diets with sustainabilit y considerations.
Support components include building
capacities to ensure food qualit y and safet y,
improving access to financial resources and
strengthening market linkages. Similarly, in
Myanmar, SMEs at the food production level
have received support to diversif y their
products through direct transfers, increased
access to new technologies and training in
sustainable production techniques. More than
half of the programme’s participants have
seen their incomes increase by 50 percent,
and their expansion of production to include
fresh vegetables has significantly increased the
supply of nutritious foods in local markets. 151
In Sao Tome and Principe, a recent five-year
development project facilitated the marketing
of organic, high qualit y cacao, coffee and
pepper by developing farmer cooperatives and
family plantations to increase sales to domestic
and export markets through public-private
partnerships. Results from the impact
assessment of these programmes demonstrated
positive and significant impacts on agricultural
incomes (by 46 percent) and on increased levels
of dietar y diversit y (5 percent). 152
In Zimbabwe, in the context of a programme
promoting conser vation agriculture for increasing
climate resilience and agricultural productivit y,
farmers participating in the programme
adopted biofortified varieties of different crops.
The increases in productivit y after the adoption
of climate resilient techniques also improved
the availabilit y of micronutrients among
participating households. Finally, in Rwanda,
iron-biofortified beans have been introduced
and rapidly adopted by farmers. By the end of
2018, it was estimated that 20 percent of beans
produced in the countr y were iron-biofortified,
and 15 percent of the population was consuming
these. Reg ular consumption of fortified beans
can provide up to 80 percent of daily iron needs.
Iron-biofortified varieties have also produced
yields with iron levels that are 20 percent above
those of other varieties, turning them into an
attractive alternative for farmers. 97
Rapid rates of urbanization worldwide are
placing tremendous pressure on ever longer
food supply chains to deliver nutritious
foods safely and sustainably to ever more
congested metropolitan areas. In many urban
and peri-urban areas, povert y and inequalit y
prevent the most v ulnerable from accessing
sufficient nutritious foods, while changing
food environments and consumption patterns
have led to rising levels of overweight, obesit y
and diet-related NCDs. Various processes
linked to urbanization pose challenges but also
present opportunities to create food systems
that are more inclusive in providing greater
access to nutritious foods to all, while also
being environmentally sustainable. 153 In this
context, appropriate urban food policies and
efficient rural–urban linkages are critical for
the transformation of food systems for greater
affordabilit y of healthy diets in peri-urban
and urban settings ( Box 10). 154 Small- and
medium-sized cities can play a key role in
strengthening rural–urban linkages because
of their proximit y to surrounding rural areas
Small and medium-sized enterprises (SMEs) play a
central role in maintaining local community-based
food systems, and can help ensure an adequate
supply of safe and nutritious foods. Their role in
achieving food security and good nutrition has
been increasingly recognized. 147 For example,
SMEs engaged in food processing in Africa
procure 95 percent of their food supplies from
smallholders, demonstrating their importance in
the development and transformation of the whole
food system. 148 And while the economic impact of
lockdowns during the COVID-19 pandemic has
hit many SMEs particularly hard, 149 given the way
SMEs are embedded in local communities, they
also play a key role in building forward from crisis
conditions and ensuring sufficient access to safe
and nutritious foods.
In Kenya, SMEs involved in the fruit and
vegetable supply chains have received
government support 150 with the objective of
| 99 |
CHAPTER 4 WHAT NEEDS TO BE DONE TO TRANSFORM FOOD SYSTEMS
BOX 10 THE QUITO AGRI-FOOD PACT: FACILITATING THE TRANSFORMATION OF THE CITY’S FOOD SYSTEMS
Similar to many cities in the world, inequitable income
distribution in Quito, Ecuador, is preventing the most
vulnerable populations from accessing adequate
nutritious foods. Households of the poorest income
decile consume foods that contain 20 percent more
carbohydrates and 50 percent less animal protein
than the richest income bracket.153 The challenges of
Quito’s food system include dependence on long food
supply chains from production to consumption, as
well as vulnerability because of natural and man-made
hazards, insufficient risk reduction measures and
limited supply routes. Moreover, the availability and
quality of food varies significantly across the city.158
In 2015, to address these challenges, the main
stakeholders concerned with Quito’s food system,
including public institutions, the private sector, civil
society organizations and development agencies,
established the Quito Agri-food Pact. The pact
provided a policy coordination space that, jointly with
the municipality, then developed the Quito Agri-food
Strategy to identify the main challenges facing the
city.159 A key challenge was the insufficient availability
of fresh and nutritious foods in some of the most
vulnerable neighbourhoods.
The promotion of urban agriculture represents
an important part of the strategy. The project
“AGRUPAR” has supported the creation of more than
4 400 urban gardens (84 percent of which are led by
women) to increase the availability of nutritious foods
not only for own consumption, but also to be sold
in the city through significantly shorter food supply
chains – thus lowering their cost. Forty-three percent
of the produce from urban gardens is sold in local
food markets, improving access to fresh and
nutritious foods, particularly in the most vulnerable
zones of the city. The network of urban gardens has
played a significant role in improving the resilience
of Quito’s food system, as also demonstrated by
the success of the gardens in continuing to supply
nutritious foods even during the worst period of the
COVID-19 pandemic.
Urban policies formulated and implemented
through the engagement of all key stakeholders, as
in the case of Quito, represent an excellent model
of how to build coherent and integrated portfolios
of policies to enable the transformation of urban
food systems. The territorial approach and the
development of appropriate governance mechanisms,
among other important elements, can be replicated
or adapted to similar contexts elsewhere to
effectively provide healthy diets to all through
sustainable food systems.
(referred to as a “functional territor y”) and
in addressing key social, economic and
environmental challenges. 155 Appropriate policy
action can play a major role in supporting such
functional territories to improve livelihoods
and strengthen the resilience of people and of
agri-food systems. Development of food systems
in these functional territories furthermore holds
potential for sustainably reducing povert y,
food insecurit y and malnutrition, as food
systems respond to the growth of cities and the
concurrent transformation of diets, which itself
is dependent on rural-urban linkages. 156
has been creating urban gardens in informal
settlements and schools in Rio de Janeiro.
The food produced has been for own consumption
by the engaged households, with surpluses
donated or sold to the neighbouring community,
thus improving access to nutritious foods and
generating income for urban dwellers. As in many
other places, maintaining the supply of nutritious
foods in urban areas has become a great challenge
under the COVID-19 pandemic. In Ecuador,
linkages between some areas of the city of Quito
with a high prevalence of COVID-19 cases and
farmers from the surrounding province have been
strengthened through neighbourhood cultural
societies that have established a marketing and
distribution network, receiving food baskets from
farmers and then distributing them to buyers
Urban agriculture is likely to deliver positive
impacts on both dietary diversity and household
incomes. 157 In Brazil, a longstanding project
| 100 |
THE STATE OF FOOD SECURITY AND NUTRITION IN THE WORLD 2021
TABLE 11 KEY POLICY AREAS AND GOALS FOR INTERVENING ALONG FOOD SUPPLY CHAINS TO LOWER THE
COST OF NUTRITIOUS FOODS
Policy area
Goals
Increasing investments for a more
productive and diverse agriculture sector
} Increase the supply of safe and nutritious foods, lowering their cost.
Increasing the efficiency of food
value chains
} Improve functioning of value chains to realize efficiency gains in storage, processing
and marketing of food, thus lowering the cost of nutritious foods.
} Reduce food loss and waste through a coherent set of policies and investments in
food production, harvesting, handling, packaging, storage, transportation,
processing and marketing.
Creating an environment that promotes
nutritious foods along the supply chain
} Adjust fiscal and other policies to influence relative prices of nutritious foods and of
foods high in fats, sugars and/or salt.
Enacting mandatory food fortification in
line with international guidelines
} Increase supply of fortified foods as part of a programme to address micronutrient
deficiencies.
Promoting biofortification in line with
international guidelines and regulations
} Increase production of foods with higher micronutrient content to address
micronutrient deficiencies.
SOURCE: FAO, IFAD, UNICEF, WFP & WHO. 2020. The State of Food Security and Nutrition in the World 2020. Transforming food systems for
affordable healthy diets. Rome, FAO.
The COV ID-19 pandemic has aggravated
this situation, exacerbating inequalities and
negatively impacting on the lives and well-being
of the rural poor, in particular. 160 If implemented
successfully, this fifth pathway can reduce
extreme povert y and structural inequalities
through accelerated food systems transformation
that is both pro-poor and inclusive.
directly at their homes. These baskets include
fresh fruits and vegetables produced organically,
so urban dwellers have access to nutritious foods
and farmers face a shorter marketing chain, which
allows them to sell their products at a lower
cost. These practices have continued following
the pandemic lockdowns, creating new and
innovative linkages between urban dwellers and
rural food producers. 97
In rural areas in particular, the transformation
of agri-food systems presents an opportunit y
to some of the poorest smallholders who are
not well integrated into food value chains.
In South-eastern Asia, rural povert y among
smallholders is exacerbated by the lack of
access to productive resources and poor
market integration, further compounded by
climate-related and economic shocks, as well as
periodic plant and animal disease outbreaks. 97 In
this region, the integration of poor smallholders
into food value chains has been facilitated
through public-private-producer partnerships
(PPPPs) that provide opportunities to overcome
povert y and structural inequalities, especially
where reinforced by improved governance
mechanisms and multi-stakeholder platforms. 97
The countr y cases under this fourth pathway
highlight some of the key areas where there are
opportunities for inter ventions along the food
supply chain to lower the cost of nutritious foods,
which are listed in Table 11. Additional policy
recommendations aimed at lowering the cost of
nutritious foods are discussed in more detail in
the 2020 edition of this report.
5. Tackling poverty and structural inequalities,
ensuring interventions are pro-poor and inclusive
Persistent and high levels of inequalit y seriously
limit people’s chances to overcome hunger, food
insecurit y and malnutrition in all its forms.
Policies, investments and laws that address
underlying structural inequalities faced by
v ulnerable population groups in both rural and
urban areas are needed, while also increasing
their access to productive resources and new
technologies. About 80 percent of the extreme
poor live in rural areas, where povert y rates
are three times higher than in urban areas.
In Indonesia, in 2017, the total production and
value of cocoa had fallen by 70 percent from its
peak in 2009, hitting smallholders’ incomes and
livelihoods particularly hard. Since 2014, in an
effort to reduce the number of cocoa farmers
| 101 |
CHAPTER 4 WHAT NEEDS TO BE DONE TO TRANSFORM FOOD SYSTEMS
Another initiative concerned with improving
livelihoods of people living in remote areas is the
Mountain Partnership Products (MPP) Initiative
that aims at strengthening the resilience of
mountain peoples, their economies and their
ecosystems in eight countries. 97 In providing
access to a certification and labelling scheme
based on environmentally and ethically sound
approaches, the MPP Initiative promotes short
value chains, while ensuring transparency
and trust between producers and consumers,
fair compensation for the primar y producers,
conser vation of agrobiodiversit y and preser vation
of ancient techniques implemented in several
countries. In Bolivia, for example, women
producing certified honey from a local bee variet y
were able to strengthen their linkages with local
markets, while preser ving cultural traditions and
local biodiversit y.
living below the poverty line and empower them
to engage in a more efficient and resilient cocoa
supply chain, a multi-stakeholder “whole of
value chain” approach was introduced. The PPPP
approach engaging 150 000 smallholders included,
among others, increased access to financing
and productivity-enhancing technologies, the
introduction of traceability systems, product
certification to capture premium prices, improved
primary processing, nutrition education and
the establishment of farmer organizations.
Over a five-year period, cocoa yields increased by
73 percent, while empowered smallholders saw
their incomes increase by more than 200 percent. 97
In Viet Nam, about 500 000 mostly poor
smallholder farmers earn their livelihoods from
coffee production. In mid-2020, coffee prices had
plummeted by 48 percent from a peak in late
2016, before recovering but remaining volatile.
To help reduce smallholder v ulnerabilit y to both
economic and climate-related shocks, provincial
and district-level coffee boards were established
to assist smallholders with improved technologies
and good environmental practices in coffee
production. The improved practices allowed the
coffee to be certified for a premium on producer
prices, while also strengthening the resilience
of coffee growers not only to climate shocks,
but also to likely future economic shocks. 97
In Nepal, during 2011–2018, an agriculture
project covering some of the most remote hilly
and mountainous areas of Karnali province
adopted a whole value chain approach, to bridge
information and access gaps between producers
and markets. Targeted actions sought to make
the new value chains more inclusive by breaking
down the barriers that t y pically hold back
participation of under-represented groups such as
women and ethnic minorities. Results show that
the project was successful in increasing annual
income by 32 percent among its target groups,
with crop and livestock income increasing by
47 percent and 44 percent, respectively. 162 Results
show that project participants experienced lower
levels of food insecurit y (by 9 percent) and a
higher food consumption score (by 4 percent).
In Morocco, over the past decade, a cross-sectoral
territorial approach has been implemented to
address regional inequalities within the country.161
A major investment programme has transformed
a large geographic area of 5.2 million people,
covering 16 provinces in the remote oases and
argan tree zones. The programme focused on
transforming the agri-food value chains of date
palm and argan trees, two high-value crops.
The population previously experienced relatively
high levels of poverty, illiteracy and malnutrition,
associated with harsh living conditions and
vulnerability due to various natural and
environmental threats (desertification, soil erosion,
water scarcity, extreme weather conditions). 97
Over a ten-year period, the cross-sectoral
territorial investment programme resulted in a
41 percent increase in regional per capita GDP,
a 33 percent increase in farmer incomes and a
50 percent reduction in poverty rates, among many
other positive development indicators.
The Nepal example alludes to a strong and
common theme across many of the best
practice case studies reviewed: the importance
of empowerment, in one way or another,
of poor and v ulnerable population groups,
often smallholders with limited access to
resources or those living in remote locations,
as a major lever in transformative change.
Measures of empowerment var y widely, but
include in particular the need for increased
access to productive resources (access to natural
resources, agricultural inputs and technolog y,
financial resources, as well as knowledge and
education). Other empowerment measures
| 102 |
THE STATE OF FOOD SECURITY AND NUTRITION IN THE WORLD 2021
relate to strengthened organizational skills
(increased engagement in producer groups
and cooperatives), certification programmes
(e.g. for locally produced organic products),
and importantly, access to digital technolog y
and communication.
innovation potential. 171 Young entrepreneurs
engaged in agri-food systems have been
particularly hard hit by the COV ID-19 pandemic,
exacerbating existing challenges that young
people face when engaging in agri-food systems,
notably because of limited access to productive
resources, finance and markets. 172 Generally, a
lack of economic dynamism and employment
opportunities in rural areas leads young people
to migrate out of necessit y. 173 Hence, within
broader efforts to boost responsible investments,
specific action is needed to increase youth
access to productive resources, finance, markets
and connectivit y, as well as decision-making.
Social norms that might prevent young
rural people from taking advantage of new
opportunities, especially v ulnerable groups, such
as young women and indigenous youth, also need
to be addressed. 174
The effects of the COVID-19 pandemic have
furthermore exposed structural inequalities,
as women’s productive and income-generating
capacities have been impacted disproportionately,
because of reduced economic opportunities and
access to nutritious foods, while at the same time
having to increase their workloads. Hence, policy
responses should consider women’s roles in
agri-food systems and ensure that their multiple
needs – as guardians of household food security,
food producers, farm managers, processors,
traders, wage workers and entrepreneurs – are
adequately addressed. 163 Beyond merely “levelling
the playing field”, policies and interventions
that help strengthen women’s roles in food
systems and their decision-making capacity
can be a powerful source of food systems
transformation. 164 The potential of addressing
gender gaps to increase productivity has been
well established, 165 while there is growing
evidence that empowering women also results
in improved nutritional outcomes for their
children. 166 Innovations that support women’s
productive capacity either directly or indirectly
by freeing up women’s time are especially
empowering, such as making drinking water more
easily accessible, and enabling women to engage
in productive activities, such as growing fruits
and vegetables for household consumption. 119
Additional evidence of how the empowerment
of both women and youth could accelerate
food systems transformation for improved food
securit y and nutrition is presented in Box 11.
Community-based approaches are key to building
relationships and strengthening social cohesion,
improving aspirations, confidence and trust, all of
which are critical in tackling structural inequalities
and in ensuring that policies, legislation and
interventions are pro-poor and inclusive, and
deliver equitable services. In Burundi, the Caisse de
Resilience (CdR) is an integrated community-based
and participatory approach that combines
technical, financial and social dimensions in a
mutually reinforcing way. Under this approach,
small groups of rural households receive
training in sustainable agricultural practices
through farmer field schools, while a savings
and loans fund managed by communities
themselves enhances their financial capacities.
This community-based participatory approach has
resulted in increases in agricultural production of
30 to 60 percent, as well as increases in household
income by some 40 to 52 percent. 97
Youth represent a tremendous opportunit y
for transformative change in food systems,
especially in less developed countries, where
more than 80 percent of the youth live. 167 Youth
(aged 15 –24 years) make up about 16 percent
(1.2 billion) of the world’s population, 168 and as
potential young entrepreneurs, they represent
the future agents of change. Yet, the youth of
today face greater constraints when compared
with adults in accessing decent jobs, 169 productive
resources, social capital and governance
mechanisms that shape food systems. 170
Strengthening their skills and agency through
training, positive role models and mentorship
is central to untap their entrepreneurship and
While recognizing the need to combat povert y
in both rural and urban settings, illustrative
countr y examples provided under this fifth
pathway highlight the importance of tackling
structural inequalities (as also illustrated
in Chapter 3), while ensuring inter ventions
| 103 |
»
CHAPTER 4 WHAT NEEDS TO BE DONE TO TRANSFORM FOOD SYSTEMS
BOX 11 ACCELERATING FOOD SYSTEMS TRANSFORMATION BY EMPOWERING WOMEN AND YOUTH
livelihoods for adolescents programme in Uganda showed
how vocational and life-skills training could significantly
increase the likelihood of adolescent girls of legal working
age engaging in safe income-generating activities (by
48 percent), while reducing both teenage pregnancy
(by 34 percent) and the likelihood of entering into early
marriage or cohabitation (by 62 percent).180 Especially
for younger youth below 18, employment-focused
interventions need to avoid drawing children into child
labour situations, and thus need to target only youth of
legal working age (14–15 years old in most countries)
and engage them only in safe tasks. In Senegal, a
comprehensive approach to diversified agricultural
production improved market access of mostly vulnerable
small-scale producers, women and underemployed youth
by strengthening their access to markets and ensuring
access to finance. Smallholders managed to diversify
their production to include poultry rearing and vegetable
production, in addition to groundnuts. Incomes from crop
production increased by 48 percent, and total income
increased by 11 percent among the project’s target
groups.97 In Zambia, a market system approach was used
to create opportunities for rural youth in agribusiness.
During 2014–2019, more than 14 600 enterprises were
supported, creating an additional 5 367 additional jobs
of which more than 40 percent specifically for youth.181
The approach aimed at inspiring companies working in
agri-food value chains to coordinate more effectively,
while developing and refining business models that are
more youth-inclusive.
In Guatemala, rural youth were empowered through
community-based social enterprises, promoting
their role as agents of territorial and food system
development. Following intensive training, young
participants from migration-prone rural areas were able
to assess local markets and community assets, mobilize
both youth and adults in their rural areas and lead
the design of community-based and environmentally
friendly business plans. Over one-third of the young
participants managed to gather small-scale local
agribusiness into community clusters with at least
25 young and adult members. After one year, more than
half of those clusters had been successfully registered
as cooperatives or producer associations, with youth
gaining credibility and self-confidence as changemakers,
with several of them managing to sell directly to schools
under the national school feeding programme.182
Women’s empowerment often leads to improved nutrition
because of positive effects on child and maternal
health. In Ghana, women’s empowerment is strongly
associated with diet quality, and women’s aggregate
empowerment and participation in credit decisions is
positively and significantly correlated with the indicator
estimating Minimum Dietary Diversity for Women
(MDD-W). A study in Nepal measuring outcomes against
three of ten indicators of the Women’s Empowerment in
Agriculture Index (WEAI) found significant associations
between women’s empowerment and improved child
nutrition.175 Moreover, a study using the WEAI in six
countries in Africa and Asia to help identify which
dimensions of women’s empowerment are related to
household, women, and child-level dietary and nutrition
outcomes has found that several indicators are positively
associated with the Household Dietary Diversity Score
(HDDS). The study also found that some trade-offs exist
between increased participation of women in agriculture
on the one hand, and women’s workload and their own
nutrition conditions on the other.176
In Tajikistan, a livestock and pasture development
project addressed the effects of over-grazing and
climate change on degraded pastoral land, with
emphasis on supporting women-headed households.
Among these households, livestock income increased
by 47 percent and livestock ownership by 77 percent.
In addition, women who benefited from the project
realized significantly higher economic decision-making
power. An unintended positive impact was on children’s
school attendance, which increased by 6 percent thanks
to less time spent on water harvesting and livestock
rearing, as well as increased household income.177 In
Indonesia, a coastal community development project
promoted sustainable fishery and aquaculture production
practices by providing production inputs and establishing
processing facilities and market linkages. Women, who
are primarily engaged in fish processing and marketing,178
saw their empowerment increased by 27 percent,
while fish productivity increased by 78 percent and
post-harvest losses reduced by 5 percent. Diets of target
groups became more diverse (by 6 percent) with higher
consumption of seafood, dairy and fruits.179
Young people can similarly benefit from interventions
that remove some of the age-specific constraints to
their ability to productively engage in agriculture and
food systems. Evidence from an empowerment and
| 104 |
THE STATE OF FOOD SECURITY AND NUTRITION IN THE WORLD 2021
TABLE 12 KEY POLICY AREAS AND GOALS FOR TACKLING STRUCTURAL INEQUALITIES, ENSURING
INTERVENTIONS ARE PRO-POOR AND INCLUSIVE
Policy area
Goals
Empowering vulnerable and historically
marginalized populations
} Reduce inequality within households, with positive effects on food security and
nutrition outcomes of women, children and youth.
Reducing gender inequalities in food
security and nutrition and supporting
women’s economic activities in food
value chains
} Increase productive capacity of men and women by ensuring equitable access to
productive resources.
} Implement financial services support mechanisms targeting women’s economic
activities as producers, processors, traders and entrepreneurs.
Enacting reforms with a gender lens to
enable more equal distribution of
resources and access to social services
} Improve access to key agricultural productive assets.
} Increase access of vulnerable populations to essential services, primary healthcare
and expanded social protection mechanisms.
} Improve income distribution within countries.
SOURCE: FAO, IFAD, UNICEF, WFP & WHO. 2019. The State of Food Security and Nutrition in the World 2019. Safeguarding against economic
slowdowns and downturns. Rome, FAO.
» are not only pro-poor and inclusive, but also
The promotion and increased availability of
highly processed foods has led to increased
consumption of unhealthy diets affecting all ages.
Promotion of breastmilk substitutes dissuades
mothers from breastfeeding and weakens the
ability of healthcare workers to fully support
lactating mothers. Large food companies target
much of their marketing to youth, and small-scale
local production of foods of high energ y density
and minimal nutritional value is also expanding
rapidly. As a result of these food environment
changes, childhood overweight and obesity are
rising as fast or faster than underweight is falling
in ever y region of the developing world. 183
empower women and youth as a means of
accelerating transformative change in food
systems. Key policy areas and goals in this
regard are presented in Table 12. Additional policy
recommendations supportive of this pathway can
be found in the 2019 edition of this report.
6. Strengthening food environments and changing
consumer behaviour to promote dietary patterns
with positive impacts on human health and the
environment
Access to nutritious foods and healthy diets
is not only a matter of cost and affordability.
Many elements of the food environment determine
dietary patterns, while culture, language, culinary
practices, knowledge and consumption patterns,
food preferences, beliefs and values all relate to
the way food is sourced, generated, produced and
consumed. Dietary patterns have been changing
and have had both positive and negative impacts
on human health and the environment. 58 Hidden
costs to human health and to the environment
that characterize most food systems today
are ignored. Given that they are mostly not
measured either, they also go unaddressed and
are unaccounted for in food prices, ultimately
jeopardizing the sustainability of food systems.
Therefore, based on the specific country context
and prevailing consumption patterns, there is a
need for policies, laws and investments to create
healthier food environments and to empower
consumers to pursue dietary patterns that are
nutritious, healthy and safe and with a lower
impact on the environment. 7
Early adolescents are seeing the largest increases
in the incidence of overweight, but it should be
noted that it is an issue that has its roots in early
childhood and even during the gestational period.
The promotion and marketing of foods can influence
food preferences and consumption, even in ways
that consumers may not be aware of. 68 This has been
recognized as one of the main drivers that explain
today’s dietary patterns, with children especially
showing a susceptibility to this influence. 184,185
Restrictions on food marketing to children should
be implemented as part of a comprehensive package
of measures to create healthy food environments
that enable dietary choices for optimal nutrition
and good health. International guidelines can
provide clear recommendations on the marketing
of breastmilk substitutes, complementary foods,
and foods and beverages for older children. 186,187,188
Highlights of best practices from several countries
are presented in Box 12.
»
| 105 |
CHAPTER 4 WHAT NEEDS TO BE DONE TO TRANSFORM FOOD SYSTEMS
BOX 12 PROTECTING CHILDREN FROM THE HARMFUL IMPACTS OF FOOD MARKETING
Indian marketing legislation has been proposed as a
factor.209 Exclusive breastfeeding in India increased
from 46 percent in 1992 to 55 percent in 2015.210
Following implementation of Chile’s law of food
labelling and advertising, pre-school children’s and
adolescents’ exposure to advertising for restricted
foods dropped,211 and sales of these foods in school
food kiosks dramatically declined.212 Purchases of foods
and beverages high in salt, sugar, energy or saturated
fat,207 which are required to carry front-of-pack warning
labels, fell by 24 percent following introduction of the
regulation.213
The barriers that countries face in implementing
food marketing laws include opposition from powerful
vested interests, as well as difficulties in addressing
cross-border marketing and monitoring digital
marketing. International guidance is available to support
countries in implementing comprehensive measures to
protect children of all ages.186,187,214 Marketing measures
should be considered as part of a comprehensive
portfolio of policies to reduce all forms of malnutrition
and to support healthy diets.
Protecting children of all ages from the harmful impacts
of food marketing is an essential food system action, a
moral imperative and a human rights obligation.198,199,200
It can be done through a combination of legislation
on marketing of breastmilk substitutes, foods for
infants and young children, and marketing to which
children are exposed in general. Notwithstanding the
existence of global rules on food marketing,186,201,202
no country has yet implemented comprehensive best
practice legislation to protect children from birth to
18 years from the harmful impact of food marketing.
Nevertheless, a number of countries have implemented
elements of best practice, including India,203
Brazil,204,205 the Philippines,206 Chile207 and Turkey208 as
summarized below.
Because the determinants of malnutrition are so
multi-factorial, it is very challenging to unpick the
nutritional impact of any single policy measure, but
data from India and Chile point to how well the laws
are working. In India, sales of infant formula remained
steady between 2002 and 2008, while sales in China,
in comparison, more than tripled; the more robust
ELEMENTS OF BEST PRACTICE TO PROTECT CHILDREN FROM THE HARMFUL IMPACT OF FOOD MARKETING
Element of best practice
Legislation covering
all relevant foods
Country examples
Infants and young children:
complementary foods covered.
Brazil: Legislation covers any complementary foods for young
children up to 36 months.
Marketing of foods to children:
robust, transparent nutrition
criteria used to define foods high
in fats, sugars and/or salt (HFSS).
Chile: The law defines “high” levels for calories, saturated fat, total
sugars and sodium in foods and beverages.
Turkey: Nutrient criteria are closely aligned with WHO European
regional nutrient profile model used to define HFSS foods.
Protection for all
children from birth
to 18 years
Infants and young children:
covers children up to 36 months.
Philippines: The law extends to products marketed or labelled as
being suitable for infants and children up to 36 months.
Marketing of foods to children:
covers children up to 18 years.
Turkey: Broadcast regulations are intended to protect all children up
to 18 years.
All forms of
marketing are
regulated (media
channels and
promotional
techniques)
Infants and young children:
covers children up to 36 months.
Philippines: Prohibition of advertising, provision of samples or gifts,
point-of-sale promotions, with robust provisions to keep industry at
arm’s length from health workers/facilities, and strict rules on
product labelling, as well as the use of cartoons.
Marketing of foods to children:
covers children up to 18 years.
Chile: Wide scope covering: television advertising; use of cartoons
and toys; sale and promotion of food in schools (including
sponsorship or educational resources); product labelling.
Robust monitoring
and enforcement,
with meaningful
sanctions
Infants and young children.
India: A monitoring mechanism, in place from the outset, authorizes
consumer organizations to report violations, which the authorities
are obliged to investigate.
Marketing of foods to children.
Turkey: Baseline study conducted in 2017 (WHO and Ministry of
Health) to monitor digital food marketing to children.
Chile: Enforcement is well coordinated by the Ministry of Health, and
implemented by regional health authorities.
SOURCE: UNICEF/WHO.
| 106 |
THE STATE OF FOOD SECURITY AND NUTRITION IN THE WORLD 2021
BOX 13 NUTRITION POLICY MEASURES TO ENHANCE BENEFITS AND MINIMIZE RISKS OF TRADE
Trade can improve the availability and diversity
of nutritious foods, but it can also increase the
availability, accessibility and affordability of highly
processed foods that are high in fat, sugar and/
or salt.217,218 In response, national policymakers
have implemented different measures to ensure
coherence between trade and nutrition policies,
utilizing available mechanisms under trade
agreements to implement measures to protect
public health, in line with the Framework for Action
recommendation from the Second International
Conference on Nutrition (ICN2).219
Moreover, these standards have been adopted and
implemented without allowing domestic production
of fatty meats to increase to compensate for the
drop in imports.220,221
Enhancing the benefits of increased trade:
Fiscal policies in Fiji
Fiscal policies such as taxes, subsidies and changes
in import tariffs (customs duties), can be used
to minimize the risk and/or enhance the benefits
of increased trade. One example of an approach
to enhance the benefits of trade is the Fijian
Government’s removal of customs duties on imported
vegetables in 2013.222 As in other Pacific Island
countries, globalization and increased international
trade have influenced the nutrition transition in
Fiji, which has contributed to elevated levels of
overweight and obesity in the country (adult obesity
was 30 percent in 2016)210 and the high burden
of NCDs.
Based on advocacy work by the Ministry of
Health with support from the Consumer Council of
Fiji and the academic sector, a new customs policy
was introduced to improve access to vegetables in
Fiji.223 In 2012, customs duty was decreased from
32 percent to 5 percent on vegetables not grown
or produced in Fiji; then in 2013 an excise tax of
10 percent on all imported vegetables was eliminated,
while revenue losses were offset by increasing duty on
less nutritious foods.223
The volume of imported vegetables, which are not
grown in Fiji, including leeks, capsicums, cauliflowers
and celery, increased substantially between 2010
and 2014. Imports of carrots – a vegetable, which
is grown in Fiji – also increased, but not to the same
extent.222 Further research is needed to explore how
this greater availability of vegetables translates to
vegetable consumption in the diet of Fijians.223
Minimizing trade-related risks:
Ghana’s use of food standards
Ghana experienced a dramatic increase in imports
of meat products as a result of trade liberalization in
the late 1980s and early 1990s. The Ghana Health
Service raised particular concerns about rising
consumption of one particular product – namely,
imported turkey tails (known as tsofi locally), which
have a very high fat content (up to 40 percent).
In response to these concerns, the Ministries of
Health, Trade and Agriculture collaborated to
set standards for the maximum amount of fat in
carcasses and cuts of meat, including an upper limit
of 15 percent for poultry, which were applicable
to meats regardless of origin (i.e. applied to both
domestic and imported products).
The overall effect of these standards has been
to reduce the availability of turkey tails in the
Ghanaian food supply for over 20 years. Import data
show that imports of unspecified turkey cuts, which
includes tails, declined following introduction
of the standards in the 1990s. At times, due to
fluctuation in imports, the measure has been
reinforced by enhanced publicity and high-profile
enforcement action, bringing imports down again.
| 107 |
CHAPTER 4 WHAT NEEDS TO BE DONE TO TRANSFORM FOOD SYSTEMS
TABLE 13 KEY POLICY AREAS AND GOALS FOR STRENGTHENING FOOD ENVIRONMENTS AND CHANGING
CONSUMER BEHAVIOUR TO PROMOTE DIETARY PATTERNS WITH POSITIVE IMPACTS ON HUMAN HEALTH AND
THE ENVIRONMENT
Policy area
Goals
Implementing healthy public food
procurement and service policies
} Ensure that food sold or served in schools, hospitals and other public institutions
contributes to healthy diets.
Improving trade standards with a
nutrition-oriented focus
} Enhance the role of trade for increasing the availability and affordability of healthy
diets.
Taxation of energy-dense foods high in
fats, sugars and/or salt and subsidizing
nutritious foods
} Lower consumption of food with negative impact on human health.
} Ensure nutritious foods are more affordable than energy-dense foods.
Enacting legislation on food marketing
} Protect all people, and in particular children from birth to 18 years, from harmful
impacts of food marketing.
Enacting labelling rules, including
interpretive front-of-pack nutrition
labelling
} Help consumers to shift their preference towards nutritious foods, in using
interpretive nutrition labels on the front, as well as nutrition information panels on
the back of food packaging.
Regulating industrially produced trans
fats
} Eliminate industrially produced trans fats from the food supply chain.
Reformulating food products and
beverages
} Reduce levels of salt/sodium, sugars, calories and/or saturated fat in highly
processed food.
SOURCE: FAO, IFAD, UNICEF, WFP & WHO. 2020. The State of Food Security and Nutrition in the World 2020. Transforming food systems for
affordable healthy diets. Rome, FAO.
» Reg ulator y approaches can be used to improve
sweetened beverages within all school premises;
restrictions on marketing for high-calorie,
low-nutrient foods and high-caffeine foods
directed at children and food qualit y certification
for children’s foods. 191,192,193,194
the nutritional qualit y of widely available
processed foods that enable dietar y patterns with
more positive impacts on health. Since 2004,
Argentina has implemented successive policies
to reduce industrial trans fats in the food supply,
including voluntar y reformulation in cooperation
with the food industr y, mandator y trans-fat
labelling and, ultimately, mandator y limits for
levels in foods. 189 By 2015, 93 percent of foods
were reported to be compliant. 190 Multisectoral
cooperation between relevant government
ministries and research institutes, consumer
groups, academia and the food industr y provided
technical support to the process.
Efforts to encourage the consumption of
nutritious foods and avoid negative impact
on human health include the reformulation
of foods, 195 which targets the main sources
of food that are of concern to human health,
such as saturated fat or trans fats, sugars
and/or salt. In Kuwait, the Food and Nutrition
Administration identified locally produced bread
as a key source of salt in the population’s diet
and approached the government-owned f lour
mills and bakeries, which produce most of the
countr y’s bread, about progressively reducing
the levels of salt. 196 Within two months, the salt
content of f lat white bread had been reduced
by 10 percent, and within the year, a 20 percent
reduction of salt content had been achieved. 197
In the Republic of Korea, “green food zones”
were established in 2009–2010, prohibiting the
sale of foods of high energ y densit y and minimal
nutritional value, including fast foods, within
200 metres of selected schools. By 2017, “green
food zones” were established around more than
90 percent of all schools. This was part of a
wider package of reg ulator y measures introduced
to protect the nutrition of children and young
people, including, among others: introduction
of traffic-light nutrition labelling and menu
labelling in chain restaurants; a ban on sales of
Many countries have seen their food systems
transform rapidly as a result of globalization. 7
Over the past several decades, increasing levels
of international trade in food and agricultural
products have played a key role in ensuring
| 108 |
THE STATE OF FOOD SECURITY AND NUTRITION IN THE WORLD 2021
4.2
a sufficient supply of staple foods, while also
maintaining dietar y diversit y in the provision
of nutritious foods, in particular where the
availabilit y of fresh fruits and vegetables may
drop significantly for part of the year. Yet, trade
policies, including protectionar y trade measures,
may affect the availabilit y and cost of nutritious
foods on local markets, as well as the supply and
price of energ y-dense foods. Similarly, while
non-tariff trade measures can help improve food
safet y, qualit y standards and the nutritional
value of food, they can also drive up the costs of
trade and hence food prices, negatively affecting
affordabilit y of healthy diets.
BUILDING COHERENT
PORTFOLIOS OF
POLICIES AND
INVESTMENTS
Key elements of portfolios of policies
and investments
As elaborated above and illustrated in Figure 28,
the formulation of comprehensive portfolios
of policies and investments starts with a
context-specific situation analysis to obtain an
in-depth understanding of the countr y context,
including the nature and intensit y of major
drivers impacting upon food systems and the
prevailing food securit y and nutrition situation,
in addition to the identification of relevant
actors, institutions and governance mechanisms.
The situation analysis will enable countries to
assess which combination of pathways towards
the transformation of food systems is most
relevant, given the way in which the major
drivers of food insecurit y and malnutrition have
affected them, and which policy measures and
investments are most appropriate to form part of
the portfolio ( Figure 29, left-hand side).
In Peru, for example, the US-Peru free trade
agreement eliminated a 25 percent tariff on
soft drinks from the United States of America,
which resulted in increased investment f lows,
followed by an increase of 122 percent in soft
drink production in the countr y (including juices,
bottled water and energ y drinks). 215 An initial
rise in sugar consumption from sugar-sweetened
beverages eventually stagnated at elevated
levels. As part of a comprehensive approach to
NCD prevention in Peru, especially given rising
prevalence of overweight and obesit y, the countr y
has raised taxes on sugar-sweetened beverages. 216
Since 2019, a tiered system of taxation – with
higher tax rates on drinks with higher levels of
sugar – has been in place. As well as the expected
impact on consumer purchases, especially when
combined with the front-of-pack warning label
required on beverages high in sugar, this t ype of
tax can act as a powerful driver for industr y to
reformulate products to reduce the sugar content.
Given the cross-sectoral nature of inter ventions
needed to transform food systems and achieve
food securit y and improved nutrition (as
illustrated in the examples presented in the
previous section), coherence with policies and
investments between agri-food, environmental,
health, social protection and other systems
such as education, energ y, trade and finance is
essential for effective transformative change
( Figure 29, right-hand side). Coherence is needed
not only for effective formulation, but also for the
efficient and accelerated implementation of the
portfolios, all of which call for multi-stakeholder
governance mechanisms and supportive
institutions. Importantly, apart from access to
productive and financial resources, systemic
transformative change requires development
and generation of (and access to) appropriate
technolog y, data and innovation, referred to as
accelerators to spur the transformative processes
( Figure 29, right-hand side).
A number of nutrition policy measures can
enhance benefits and minimize risks of increased
trade and investment in global food systems
( Box 13).
Table 13 summarizes the key policy areas, including
related laws and reg ulations to strengthen food
environments and changing consumer behaviour
to promote dietar y patterns with positive
impacts on human health and the environment.
Additional policy recommendations related to
this pathway can be found in the 2020 edition of
this report. n
| 109 |
CHAPTER 4 WHAT NEEDS TO BE DONE TO TRANSFORM FOOD SYSTEMS
FIGURE 29 KEY ELEMENTS OF A PORTFOLIO OF POLICIES AND INVESTMENTS
COMBINATION OF TRANSFORMATION
PATHWAYS (TPs) DEPENDING ON DRIVERS
(supported by an in-depth
context-specific situation analysis )
TP1
humanitarian-development,
peace nexus
TP2
scale up climate resilience
TP3
strengthen economic resilience
TP4
lower the cost of nutritious
foods along food supply chains
TP5
address poverty and inequality
TP6
shift to sustainable
consumption patterns
PORTFOLIO of POLICIES,
INVESTMENTS and LEGISLATION
to transform food systems with
resilience to drivers
COHERENT POLICIES AND
INVESTMENTS ACROSS SYSTEMS
AGRI-FOOD SYSTEMS
ENVIRONMENTAL SYSTEMS
HEALTH SYSTEMS
SOCIAL PROTECTION SYSTEMS
OTHER RELEVANT SYSTEMS
ACCELERATORS
Governance and institutions
Technology, data and innovation
SOURCE: FAO.
the food system, from providing the necessar y
knowledge and skills in food production to
nutrition education for school-aged children and
raising consumer awareness for better informed
choices towards minimizing the negative impacts
of food consumption on human health and the
environment. Energ y systems are essential to
the functioning of food systems, as they provide
the energ y for food production, transportation,
food processing, storage and consumption. In the
specific context of food systems transformation,
energ y systems are critical in ensuring increased
productivit y and in reducing food losses and
waste. Increased energ y efficiencies may help
lower the cost of safe and nutritious foods.
Following the in-depth discussion of best
practices and policy measures along the six
possible pathways towards the transformation
of food systems in the previous section, the
remainder of this chapter reviews the importance
of coherence across relevant systems, as well as
the role of accelerators. A number of existing
systems approaches that represent useful
frameworks for building coherent portfolios and
facilitating multisectoral investments and action
to achieve food securit y and improved levels of
nutrition are also brief ly discussed.
Coherence of food system policies and
investments with other systems
Given the important interrelationships among
systems, food systems emerge as a potential
common space for advancing co-benefits for a
range of policy goals efficiently and effectively. 57
Hence, apart from the identification of policy and
investment portfolios to transform food systems
The overall performance of food systems depends
on their coherence and interaction with several
other systems, including especially the wider
agri-food systems, in addition to environmental,
health and social protection systems.
Other systems play a critical role throughout
| 110 |
THE STATE OF FOOD SECURITY AND NUTRITION IN THE WORLD 2021
FIGURE 30 ENSURING COHERENCE AND COMPLEMENTARITY AMONG AGRI-FOOD*, ENVIRONMENTAL,
HEALTH, SOCIAL PROTECTION AND OTHER** SYSTEMS FOR FOOD SYSTEMS TRANSFORMATION FOR FOOD
SECURITY, IMPROVED NUTRITION AND AFFORDABLE HEALTHY DIETS FOR ALL
AGRI-FOOD
SYSTEMS
ENVIRONMENTAL
SYSTEMS
FOOD SYSTEMS
SOCIAL
PROTECTION
SYSTEMS
Food systems
transformation for food
security, improved
nutrition and affordable
healthy diets for all
HEALTH
SYSTEMS
OTHER
SYSTEMS
NOTES: * Agri-food systems include fisheries and forestry systems. ** Other systems include additional systems that are critical to food systems
transformation, including among others: education, energy, legal, social, economic, finance, trade and marketing systems.
SOURCE: FAO.
fisheries and forestr y, as well as food
storage, aggregation, post-har vest handling,
transportation, processing, distribution,
marketing, disposal and consumption. 224
Agri-food systems interact with non-food supply
chains through the purchase of agricultural
inputs and by providing intermediate inputs to
the production of non-food commodities, such
as maize for biofuel production or cotton for
textiles. As stated in Chapter 3, while broader
agri-food systems transformation is of utmost
themselves, policy coherence is needed, not only
across the different transformation pathways
described above, but also with other systems that
underpin the long-term sustainabilit y of these
food systems, as shown graphically in Figure 30.
Agri-food systems comprise both agricultural and
food systems and encompass the entire range
of actors and their interlinked value-adding
activities. This includes the primar y production
of food and non-food products in agriculture,
| 111 |
CHAPTER 4 WHAT NEEDS TO BE DONE TO TRANSFORM FOOD SYSTEMS
40 percent of global agricultural land could be
restored without reducing production, if inputs
used and crop distribution were optimized
while respecting biodiversit y hotspots. 225
Sustainably managing existing food production
and supply systems renews ecosystems’
abilit y to provide healthy soil and clean
water, and also supports biodiversit y. This is
accomplished by increasing efficiency while
reducing external inputs, favouring the circular
use of resources, and supporting multiple
ecosystem ser vices (e.g. through rotations
that diminish the need for chemical fertilizers
while promoting soil health and carbon
absorption). A rich menu of options exist
(ranging from regenerative practices based on
intercropping and short rotations to precision
agriculture and innovations for sustainable
agriculture), to be adopted and tailored to the
local context.
Restoring and rehabilitating natural
environments: Nature-positive production can
contribute to restoring the one-third of global
land considered degraded, by either rewilding
it or by restoring its agricultural productivit y
(and therefore helping to avoid additional
land conversion for agriculture), while also
contributing to preser ving the qualit y of all
land resources.
importance, it is covered extensively in the
forthcoming publication on The State of Food and
Agriculture in the World 2021, 224 and is beyond the
scope of this report.
Nevertheless, in the context of building
portfolios of policies and investments towards
the transformation of food systems, ensuring
coherence among those policies and investments
specifically aimed at food systems on the one
hand, and those in the broader agri-food systems
domain on the other, is important for a number
of reasons – not least given the importance
of agri-food systems in providing income
and employment for millions of households.
Clearly, both agri-food systems as well as food
systems (forming an integral part of agri-food
systems) are affected by the same drivers
outlined in Chapter 3, and inf luenced and
shaped by the same social, economic and natural
environments in which their production systems
are embedded.
Environmental systems interact with food systems
primarily at the production level in providing
the necessar y environmental conditions and
nutrients in the agriculture, fisheries and
forestr y sectors for food to be produced.
Food and agricultural production systems, on
the other hand, impact on the environment in
multiple ways, including through their impact on
biodiversit y, soil and water qualit y, animal and
plant health, greenhouse gas emissions, toxicit y,
as well as food loss and waste. Hence, there
is an increased recognition of the need for
nature-positive production and supply models
which “produce more with less” to ensure
sufficient nutritious food supplies for a growing
world population over the coming decades.
Nature-positive production involves actions
aimed at the three interrelated goals of protecting
nature, sustainably managing existing food
production and supply systems, and restoring and
rehabilitating natural environments: 111
Health systems and their ser vices are vital
in ensuring that people are able to consume
foods and utilize the necessar y nutrients for
their health and well-being. Food systems may
exert both positive and negative impacts on
human health through multiple interrelated
pathways, which are inf luenced by factors
arising from within and outside food systems,
including social, economic and environmental
determinants of health. Closer examination of
the food–health nexus indicates that unhealthy
diets are among the key risk factors driving the
global burden of disease; moreover, the negative
health impacts associated with poor qualit y diets
are significant. According to the Global Burden
of Disease initiative, 20 percent of premature
deaths worldwide are associated with a poor
qualit y diet. 226 Poor qualit y diets include those
diets with too high a content of foods high in
fats, sugars and/or salt of minimal nutritional
value and too low levels of protein qualit y.
Adequate breastfeeding and child feeding for
Protecting nature: Given how inefficient
current systems are, it is possible to
maintain production levels, while halting
the encroachment on natural ecosystems and
protecting marginal agricultural areas rich in
biodiversit y, such as peatlands and mangroves.
A recent global estimate suggests that up to
| 112 |
THE STATE OF FOOD SECURITY AND NUTRITION IN THE WORLD 2021
infants and young children are important to
ensure good qualit y diets. With current food
consumption patterns, diet-related health costs
linked to mortalit y and NCDs are projected to
exceed USD 1.3 trillion per year by 2030. 7
drowning and physical injuries) that affect the
health of, among others, farmers, agricultural
workers, fisherfolk, those working within the
food processing and retail sectors, and other food
chain workers. 139
Food systems impact human health and well-being
in several ways, including through: unhealthy
diets and food insecurity; zoonotic pathogens
(originating from both farmed and wild animals)
and antimicrobial resistance (AMR); unsafe and
adulterated foods; environmental contamination
and degradation; and occupational hazards. 139
Illnesses may occur from the ingestion of foods
containing various pathogens and toxicants;
there are also risks with the consumption of
altered and novel foods. Globally, an estimated
33 million healthy life years are lost due to the
consumption of unsafe food. 227 Malnutrition in
all its forms increases susceptibility to foodborne
diseases, zoonosis, physical injuries and mental
health issues and vice versa, while healthy diets
and healthy food systems help protect against
these susceptibilities. With specific reference
to zoonotic diseases, the multisectoral and
multidisciplinary One Health approach builds
national mechanisms to address health threats at
the human-animal-environment interface. 228,229
Policies, laws, reg ulations and investments in
health systems form part of the food–health
nexus. Universal health coverage is essential
to ensure healthy lives and to promote human
well-being. Universal coverage implies that all
people can use the health ser vices they need
and that these ser vices are of sufficient qualit y
and do not expose people to financial hardship.
Inputs from health systems can support and
reinforce food systems transformation, for
example, through the provision of essential
nutrition actions in universal health coverage, 230
including among others:
Nutrition counselling during pregnancy and
support to breastfeeding and complementar y
feeding, alongside food system measures
to reg ulate the marketing and promotion of
breastmilk substitutes and foods for infants
and young children.
Early detection and support for the
management or treatment of different forms
of malnutrition, which is critical in informing
food systems transformation, as well as social
protection needs in crisis situations.
The use of micronutrient supplements for
v ulnerable groups can be an appropriate
interim measure until food systems are
transformed to provide greater dietar y
diversit y and ensure ever yone has access to
affordable healthy diets at all times.
Many of the public health policy goals rely on the
effective functioning of food systems to deliver
safe and nutritious foods in a sustainable way
(as also ref lected in the SDGs). For example,
the nutritional qualit y of foods produced and
supplied affects dietar y goals and diet-related
health goals. At the same time, the ways in which
food is grown, distributed and consumed also
affect environmental goals, while employment
and income generation in agriculture affect
economic goals for producers and farmers,
including strategies aimed at the reduction of
rural povert y and income inequalit y.
Additional health system actions can be reinforced
through nutrition-responsive social protection
systems, including social transfers, maternity leave
protection and breastfeeding support policies.
In the context of the COVID-19 pandemic, it has
been particularly critical to strengthen the health
system response for nutritional care, as already
strained healthcare systems are being forced to
divert resources from essential nutrition-related
services. 37,46,66,231 The inextricable linkages
between food systems and health systems
highlighted above demonstrate the importance
of coherence among food and health systems
policies, laws, regulations and investments.
Povert y and inequalit y make these food
system-related health impacts more likely and
increase their severit y. There can be serious
health consequences from different forms of
environmental contamination – including from
heav y metal contamination, fertilizers, pesticides,
air pollution and smog, GHG emissions and
microplastic pollution. Similarly, there are many
occupational hazards (e.g. the use of pesticides,
| 113 |
CHAPTER 4 WHAT NEEDS TO BE DONE TO TRANSFORM FOOD SYSTEMS
effect on increasing the qualit y of diets and the
affordabilit y of nutritious foods depends on
several factors, including effective targeting,
adequate transfer amounts and modalities,
and effectively integ rating nutrition-specific
components. 235,236,237
Food environment policies that foster food
system changes towards healthy diets are also
important. As illustrated in pathway 6 above,
relevant policies are needed to create healthy
food environments by using standards and
legislation to improve the nutritional qualit y of
food products and beverages; use fiscal policies
to inf luence relative prices of nutritious foods
and foods high in fats, sugars and/or salt; limit
harmful food marketing; require packaged
foods to carr y nutrition labels that help people
to choose healthier diets; and ensure that foods
contributing to healthy diets are ser ved in
schools, hospitals, care homes and other public
institutions, as well as food aid programmes.
In addition, policies that encourage changes in
consumer behaviour to encourage healthier and
more sustainable food consumption and food
waste reduction are needed. 7
Social protection programmes can be effective
in overcoming drivers of food insecurit y and
malnutrition in all its forms and in improving
the affordabilit y of healthy diets in two
principal ways:
Supporting household incomes and livelihoods
for the poorest and most v ulnerable groups.
Measures include boosting job creation and
implementing labour market policies, such as
public works programmes that can be used as
short-term measures to support purchasing
power in times of crisis and for developing
assets that bring future returns to livelihoods;
social assistance initiatives, such as cash
transfer programmes that provide support
to meet the most immediate needs and that
enable households to invest in their productive
activities; 235 and increasing universal access to
healthcare, education and social ser vices that
could safeg uard against setbacks to families,
nations and regions. 5
Improving access and affordability of healthy
diets through school food and nutrition
programmes (among others) especially
designed to improve dietar y diversit y, while
also encouraging the purchase of fresh food
from local producers. In-kind transfers,
especially in places where food markets are
not functioning well, could increase access to
nutritious foods, in addition to food subsidies,
especially those focused on nutritious foods
and targeted at the most v ulnerable. 7
Social protection systems represent a set of
policies and programmes, often grounded in
enforceable legislation, that address economic,
environmental and social v ulnerabilities to
povert y, food insecurit y and malnutrition
by protecting and promoting livelihoods, in
particular through the reduction of financial
and social barriers to accessing food and other
essential needs. 7,232 The impacts of a sudden
loss of income and employment for hundreds
of millions across continents has stretched the
capacit y of social welfare and social protection
systems to the limit, resulting in deeper
inequalities and increased povert y levels. 233
Millions of children have been out of school
for more than a year, losing out not only on
education, but also daily school meals that
make up an important proportion of their daily
nutrient requirements. 234
Nutrition-sensitive social protection prog rammes
are particularly effective in supporting poor
people and those liv ing under crisis conditions
who do not have basic access to sufficient
nutritious food to consume healthy diets nor
to essential complementar y nutrition, health
and sanitation ser v ices. However, social
protection policies and prog rammes do
not always lead to g reater affordabilit y of
healthy diets. Coherent investments in food,
ag riculture and social protection are crucial
for eradicating hunger and povert y, but their
Large-scale investments in social protection
systems have ser ved as powerful instruments for
strengthening people’s access to nutritious food,
particularly for v ulnerable groups in both urban
and rural settings. And while it is recognized
that the capacit y of LMICs to finance such
investments has been limited, with the right
investments, laws, reg ulations and policies in
place, social protection, health systems and food
systems can work together to improve coverage of
a population’s health and nutritional needs. 37
| 114 |
THE STATE OF FOOD SECURITY AND NUTRITION IN THE WORLD 2021
innovative solutions to build resilience to food
insecurit y and malnutrition drivers. These two
broad categories of accelerators of food systems
transformation – effective governance and
institutions, and access to technolog y, data and
innovations – are discussed below.
Importantly, given the impact of measures
to stem the COV ID-19 pandemic, such
complementar y policies and investments should
ensure that public funds are used to keep
local and national food markets functioning,
strengthen health responses for nutritional
care, and empower women and caretakers who
make household decisions, especially about
food choices. Actions to protect food workers
and close gaps in food distribution are critical
to reach the most v ulnerable. 37 Importantly,
social protection is more than a short-term
response to acute situations of food insecurit y
and malnutrition. It is when reliable and
well targeted, social protection can support
households to engage in new economic activities,
and to capitalize on opportunities created by
the continued economic dynamism of food
systems, thereby bringing about longer-term
improvements in access to healthy diets, in
addition to stimulating the development of local
economies. 238,239,240
Governance and institutions
The importance of effective governance and
institutions to the implementation of coherent
and complementar y food systems policies has
been increasingly recognized, especially after
the food price crisis of 2007–2008. 245 There are
many existing mechanisms at global, regional,
national and local levels, all of which aim to
ensure adequate consultation and collaboration
across sectors and among key actors. aq
International coordination mechanisms facilitate,
among others, the setting of standards (such
as harmonized sanitar y and phytosanitar y
reg ulations) and other trade-related measures
to enhance regional and international trade.
At national levels, the most effective governance
mechanisms for the coordination of multisectoral
actions across systems are best located at a
super-ministerial level in close consultation
with sector-specific ministries and institutions.
Importantly, these governance mechanisms
should facilitate engagement of key actors from
public and private sectors and from civil societ y.
The role of accelerators in food systems
transformation
The effective and efficient implementation
of portfolios of policies and investments
requires an enabling environment of
governance mechanisms and institutions that
facilitate consultation across sectors and key
stakeholders. 241 At the same time, scaling
up the availabilit y of technologies, data and
innovative solutions is key to accelerating the
transformative processes. 242 Food systems
transformations are often attributed mainly
to technological innovations, overlooking the
importance of social and political conditions
in enabling its implementation. 243 Importantly,
a wide range of institutional, policy and
socio-cultural innovations are needed to
enable the deployment and adoption of new
technologies and innovations for systemic
transformation of food systems. 24 4
In 2016, more than three-quarters of countries
reported having multisectoral mechanisms
to coordinate nutrition work – most
commonly involving health, agriculture and
education. 246 Such coordination mechanisms
may need to be further expanded to ensure a
whole-of-government approach and for increased
policy coherence. Case studies have identified
strengths and weaknesses in current governance
mechanisms: a 2017 diagnostic study on food
systems governance in South Africa reviewed
what forms of institutional arrangements
are most appropriate. It found that the
Lessons drawn from countr y-level best
practices towards food systems transformation
confirm the relevance of accelerators linked to
institutional, policy and socio-cultural factors
with high transformative potential, combined
with the implementation of new technologies,
the extended use of data and the promotion of
aq At global level, relevant mechanisms for advancing food security,
improved nutrition and healthy diets include the follow-up to the Second
International Conference on Nutrition (ICN2), held in 2014; the UN
Decade of Action on Nutrition (2016–2025); and the UN Food Systems
Summit and the Tokyo Nutrition for Growth Summit (N4G), both to be
held in 2021. Furthermore, the multi-partner global Committee on World
Food Security (CFS) develops and endorses policy recommendations
and guidance on a wide range of food security and nutrition topics.
| 115 |
CHAPTER 4 WHAT NEEDS TO BE DONE TO TRANSFORM FOOD SYSTEMS
systems for reliable and timely data to inform
policy development.
existence of three governance mechanisms
created various challenges as the dominance
of single government bodies in programme
implementation limited f lexibilit y in policy
responses and lacked stakeholder participation. 247
The Association of Southeast Asian Nations
(ASEA N) has made wide use of multi-stakeholder
platforms (MSPs) in seeking transformative
change, including to strengthen food value
chains at countr y and subnational levels, as well
as addressing issues of regional concern (such
as implications of the COV ID-19 pandemic),
in addition to exploring opportunities to
strengthen smallholder engagement in food
value chains through digitization. In six of the
ASEA N member nations, public-private-producer
partnerships (PPPPs) are being supported by
countr y networks and a regional network,
composed of more than 520 organizations
across the region, representing the public sector,
multinational corporations, local agribusinesses,
civil societ y, farmer associations, and academic
and research institutions. 248
In Mexico, an inter-sectoral governance
mechanism was established in 2020 with multiple
objectives to address povert y, inequalit y,
environmental challenges, food insecurit y
and malnutrition through the sustainable
transformation of food systems. The mechanism
involving 18 thematic working groups covering
a wide range of public sector institutions, civil
societ y and UN agencies concerning health,
food and the environment. Over a short period
of time, the body has successfully promoted the
introduction of the front-of-package nutritional
labelling, as well as an agreement to phase out
glyphosate and genetically modified corn for
human consumption. The still pending formal
recognition of this inter-sectoral approach
towards the transformation of food systems in
Mexico remains a constraint, as it prevents the
institutions engaged from raising the necessar y
investment and undermines further progress
towards food securit y and improved nutrition. 97
Technology, data and innovation
Technolog y, data and innovation – at food
production levels, throughout the food value
chain, and in the consumer environment
– represent an essential set of accelerators
to speed up transformative change in food
systems. Technological innovations over the past
centur y have been responsible for fundamental
improvements in food production, processing and
distribution, leading to important improvements
in human well-being. The challenges currently
faced by all actors in introducing systemic
changes towards healthier, more equitable,
resilient and sustainable food systems call for
urgent technological and innovative changes. 249
The list of available technologies at all stages of
the value chain that can increase the availabilit y
of nutritious foods is immense, and ranges
from improved vegetable seed varieties to
hydroponics to vertical farming in urban areas.
Meanwhile, there are numerous new technologies
across the food system with transformational
potential that are ready to be adopted. 24 4
Political dialog ue and advocacy are essential
to generate political commitment and broad
support for food systems transformation.
While policymaking remains the role of
government, a key condition for transformative
change is to create an enabling environment
that allows different actors in public and private
sectors and within civil societ y to interact, while
setting up transparent rules of engagement,
including identif ying and managing conf licts
of interest. Within food systems, interaction is
needed among smallholders and agribusinesses;
among food suppliers, marketing agencies
and consumers; and among reg ulators and
those who must comply with the reg ulations.
Multi-stakeholder mechanisms that engage in
the formulation and implementation of policies
and investments, and that provide robust
safeg uards against possible abuse and conf licts of
interest, have proven to be effective consultative
platforms. Effective governance should also
include built-in accountabilit y mechanisms
and strengthened oversight, monitoring and
evaluation, including multisectoral information
Beyond the data and analytical capacity needed
for an in-depth situation analysis to inform
priority actions in the transformation of food
systems referred to above, there is also a need
for improved data, analysis and decision-making
tools in the implementation of policy and
| 116 |
THE STATE OF FOOD SECURITY AND NUTRITION IN THE WORLD 2021
inputs such as fertilizers and feed, and in
selling their har vested products. There were
significant drops in prices of all perishable
products such as milk, vegetables and fish.
With breaks in the supply chains and increasing
concerns over health risks faced by their
members and farm workers, farmer organizations
facilitated the setting up of virtual call centres
( VCCs). VCCs facilitate local coordination and
communication to support farmers in continuing
to sell their commodities, buying essential inputs
and ser vices, and sharing best practices during
the pandemic. The VCC innovation has improved
efficiency and productivit y through cooperation
and technolog y, and also increased smallholder
incomes. This has strengthened direct linkages
between food producers and traders, while
benefitting local communities through increased
economic activit y. 97
investment portfolios for the accelerated
transformation of food systems. New means are
being explored to fully exploit the ongoing data
revolution to help transform food and agricultural
systems worldwide through evidence-based,
countr y-led and countr y-owned initiatives.
Sophisticated tools are available, including
advanced geo-spatial modelling and analytics
to identif y opportunities to raise incomes and
reduce v ulnerabilities of rural populations, who
constitute the vast majority of the world’s poor. 250
Innovations along the food value chain.
Measures taken to contain the COV ID-19
pandemic have had an unprecedented impact
on food value chains. Both the food supply and
demand side have faced important challenges:
linkages between farmers, intermediaries,
wholesalers, processors and retailers have been
more difficult, due to lockdown measures, while
consumers have had to endure not only physical
challenges in accessing food (with the closure of
retail stores and mandator y stay-at-home orders),
but also drastic reductions in their economic
access to food. Economic recessions have
triggered record losses in income, employment
and livelihoods worldwide, hitting in particular
the most v ulnerable populations the hardest. 251
New and promising technologies can effectively
reinforce food systems’ resilience to the
drivers of food insecurit y and malnutrition,
at the same time that these are transformed
to provide healthy diets with sustainabilit y
considerations. For example, solar powered
irrigation systems are climate-friendly, reliable
and affordable if adequately managed. In the
Near East and North Africa, a regional initiative
has given special focus to the use of solar energ y
for agricultural irrigation and sustainable
development. The system has reduced the
negative environmental impacts of agriculture,
decreasing soil pollution from diesel spillovers
and greenhouse gas emissions. 253
Nevertheless, and contrar y to some initial
assumptions, most food supply chains have
shown to be resilient and have continued
functioning, as innovations were introduced
and speedy decisions were taken to protect food
supply chains as an “essential ser vice” during
the pandemic. 252 And, while these measures
have been applied more widely to modern and
vertically integrated supply chains rather than
to traditional (i.e. much shorter) food supply
chains, measures taken during the COV ID-19
pandemic have accelerated changes in food
supply chains worldwide. Many innovations and
new technologies have spread rapidly, including
an unprecedented expansion of digitization, to
maintain food supply chains during the periods
of lockdown and constrained transportation and
distribution systems. 251
In Benin, the use of biofertilizer and isotopic
techniques has led to a four-fold increase in
soybean production between 2009 and 2019,
raising smallholder incomes and the availabilit y
of healthy soya-based foods, while leading to
significant increases in soil fertilit y as well as
export earnings. In Argentina, Mediterranean
fruit f lies had repeatedly damaged valuable
cash crops (cherries, pears and apples) for
large-, medium- and small-scale producers of
the Patagonia and Mendoza regions, leading
to substantial production losses and reduced
revenues. Furthermore, frequent use of pesticides
had caused health concerns for both producers
and consumers. The introduction of the Sterile
Insect Technique (SIT) to control the fruit f lies
In Bangladesh, COV ID-19 lockdowns put
tremendous pressure on farmers, as the f low of
agricultural products and inputs was heavily
disrupted. Farmers faced challenges in procuring
| 117 |
CHAPTER 4 WHAT NEEDS TO BE DONE TO TRANSFORM FOOD SYSTEMS
led to the suppression and eradication of the
fruit f ly, which subsequently led to substantial
increases in production and international trade in
the fruit sector – i.e. greater economic resilience
and increased revenues for Argentinian farmers
and traders. 97
building transformative multisectoral portfolios.
Below, examples of systems approaches
demonstrate how win-win solutions can help
speed up the t ype of transformative processes
with greater efficiency that this report is calling
for, while at the same time managing necessar y
trade-offs towards more sustainable and
inclusive food systems transformation.
The field of innovation is not only related
to scientific or engineering advances.
For example, the high amount of investment
required for food systems transformation
will require new and innovative financing
mechanisms, in addition to enabling legal
and reg ulator y frameworks, while innovative
components in social protection programmes
can increase their effectiveness and improve
their sustainabilit y and positive effects in
facilitating the access to healthy diets for the
most v ulnerable. 249 The COV ID-19 pandemic
has put a tremendous pressure on these areas,
which have called for innovative solutions:
in some sub-Saharan countries, including
Malawi, Nigeria and Togo, satellite images have
been used, combined with other methods, in
the selection of new beneficiaries entitled to
stepped-up cash transfer programmes following
increased support needed as a consequence of
the COV ID-19 pandemic. 13
Examples of systems approaches for
building coherent portfolios
Territorial approaches
As highlighted under several of the pathways
reviewed in this report, territorial approaches
can facilitate comprehensive and systemic
approaches towards the transformation of
food systems. In policy development and the
implementation of transformative action,
territorial approaches advocate for cross-sectoral
and multi-level governance mechanisms,
as well as coherence across different spatial
levels, while focusing on linkages and
opportunities between systems in a given
territor y. 255 As such, territorial approaches lend
themselves to realizing efficiency gains, while
managing trade-offs in policy implementation.
Hence, with the benefit of involving all relevant
actors in a given space, territorial approaches
represent ideal frameworks for responding to
the particular context, as well as the dynamic
and evolving nature of drivers impacting on
food systems and allow policymakers to design
coherent and more effective multisectoral
policy portfolios.
Capitalizing on win-win solutions
and managing trade-offs
The successful transformation of food systems
towards greater affordabilit y of healthy diets
for all, sustainably produced and with improved
resilience to identified drivers, calls for win-win
solutions to be fully exploited, and for trade-offs
to be carefully managed. As with all systemic
changes, there will be winners and losers,
while the introduction of new technologies and
innovations, and the subsequent changes in
food systems performance, will produce both
positive and negative spillover effects. 249 The
above-mentioned coherence among systems, as
well as the cross-cutting accelerators, play a key
role in maximizing the benefits and minimizing
negative consequences of transformation
for food securit y, improved nutrition and
affordable healthy diets: that is why policy
coherence, understood as a situation where
the implementation of policies in one area
do not undermine others (and even reinforce
each other where feasible), 254 is needed in
This approach has been implemented in
Colombia, where a 50-year conf lict had left
rural areas and populations in povert y and
with limited institutional capacit y. Since the
2016 Peace Ag reement, territorial development
plans have been implemented in 16 territories.
These consist of investment plans g rouped
into eight pillars, including land tenure,
infrastructure, health and education ser v ices,
housing, water and sanitation, among others. 256
The Great Green Wall project in the Sahel
represents another territorial approach: an
ambitious 11-countr y project that seeks to
transform the lives of 100 million people by
focusing on the ag ro-ecolog ical potential of
landscape restoration, while also producing
| 118 |
THE STATE OF FOOD SECURITY AND NUTRITION IN THE WORLD 2021
resilience at all levels (productive, social,
climatic and environmental). To be successful
across livelihoods and food systems and
to address food insecurit y and all forms of
malnutrition, climate resilience policies and
programmes should be built around climate
risk assessments, science and interdisciplinar y
cross-sectoral knowledge, in addition to
“blended” humanitarian, development and
peace approaches that are participator y and
inclusive as well as driven by the needs of
climate-v ulnerable groups. 3
food, increasing food securit y, creating jobs
and promoting peace in a politically frag ile
reg ion. 257 In a context of climate change
and desertification, the project creates
opportunities for increasing biodiversit y and
reversing land deg radation in ways that create
“g reen jobs”. Focusing on enhancing the
abilit y of small-scale producers to cope with
climate change, the project also invests in
improved access to markets and streng thened
value chains, expanding the use of solar
energ y, and capitalizing on ag roforestr y and
communit y-led efforts to achieve food securit y
and improved nutrition. 258
Ecosystem approaches
In regard to coherence among food and
environmental systems, the transformation and
“greening” of food systems can be a powerful
tool to build resilience to climate and economic
shocks simultaneously. The IMF has estimated
that green multipliers are several orders of
magnitude larger than non-green ones. 261 When
portfolios of policies and investments for the
greening of food systems are designed and
implemented in such a way as to be an engine of
economic recover y, they can create viable jobs
and sustainable livelihoods, address inequalit y,
and promote food securit y and nutrition.
Hence, strengthening climate resilience of food
systems is not only good for sustainabilit y
and reducing the carbon footprint – it is also
good for ending hunger and malnutrition in
all its forms. Similarly, developing or updating
national food-based dietar y g uidelines (FBDGs)
through the full integration of environmental
sustainabilit y elements in each of the g uideline’s
recommendations, according to national contexts
and using these FBDGs to g uide agriculture
and food policies, is one way help to drive the
greening of food systems. 23
As introduced under pathway 4 above, territorial
approaches to food systems transformation
also apply to urban and peri-urban settings.
With over half of the world’s population now
liv ing in urban settings, 259 municipal authorities
responsible for cities and urban places can
play an important role in transforming food
systems to improve food securit y and nutrition
and to help raise the affordabilit y of healthy
diets. Cit y authorities can, for example, use
their reg ulator y and planning powers to
shape the food env ironment (e.g. zoning of
fast food outlets, calorie labelling, advertising
restrictions, or taxation of beverages with a
high sugar content). 194 One example is the
Milan Urban Food Policy Pact, an international
ag reement among cities to “develop sustainable
food systems that are inclusive, resilient, safe
and diverse, that prov ide healthy and affordable
food to all people in a human-rights based
framework, that minimize waste and conser ve
biodiversit y while adapting to and mitigating
impacts of climate change.” The pact has been
signed by 211 cities worldwide with the aim of
fostering cit y-to-cit y cooperation and exchange
of best practices. 260
The potential for boosting the provision
of ecosystem ser vices, while increasing
productivit y, food securit y and resilience, has
been illustrated by a number of integrated
watershed management inter ventions. In Kenya,
an innovative Water Fund supports farmers
in the Upper Tana River Basin in adopting
sustainable land and water management
practices. In addition to strengthening
smallholder resilience to the impacts of climate
variabilit y and extremes, the Water Fund has
helped raise productivit y and profitabilit y of
Coherent policy portfolios also have to
address increased exposure and v ulnerabilit y
of livelihoods, particularly of disadvantaged
population groups. Without proper planning,
climate variabilit y and extremes will affect
v ulnerabilit y to future extreme events. 3 Any
rise in climate extremes can exacerbate the
v ulnerabilit y of disadvantaged population
groups, with adverse long-term developmental
effects if no action is taken to increase
| 119 |
CHAPTER 4 WHAT NEEDS TO BE DONE TO TRANSFORM FOOD SYSTEMS
coffee and other value chains. The integrated
approach of the Water Fund has furthermore
improved the qualit y of drinking water for the
capital Nairobi, while raising the countr y’s
hydropower output. Hence, this investment
has contributed to water and energ y systems
directly and to food, health and social
protection systems indirectly. 262
Urgent policy recommendation to support
Iraq on a sustainable path to recover y
include: the scaling up of social protection
mechanisms; ensuring basic ser vices for the
poor; protecting jobs, SMEs, and v ulnerable
workers in the informal economy, 265 as well
as cross-cutting reforms for private sector-led
diversification and growth by creating
sustainable job opportunities. 266 Along these
lines, a multisectoral and multi-partner food
systems and value chain programme involving
the Ministries of Planning, Agriculture, Water
Resources, Trade, Education and Migration, aims
to support the return of millions of formerly
internally displaced people (IDP) and host
communities by providing employment to help
them rebuild their livelihoods. The cross-sectoral
programme (2020 –2024) is a component of a
UN-led humanitarian-development-peace (HDP)
nexus programme and supports: (i) an enabling
environment through policy engagement and
legislation changes, facilitating trade and
improving working conditions; (ii) building
capacit y of public and private ser vice providers;
(iii) supporting smallholders to adopt sustainable
practices; (iv) strengthening agri-food SMEs by
providing technical and financial support; and
(v) promoting agribusiness development and
network linkages. The comprehensive portfolio
of policies and investments will strengthen the
management of Iraq’s natural resources, support
fair and sustainable employment opportunities,
build human capital and strengthen private
sector growth towards long-term recover y and
development in Iraq.
In Mexico, a community-based forest
management project has been designed to address
and overcome problems linked to deforestation
and forest degradation in rural communities of
marginalized forest areas in Campeche, Chiapas
and Oaxaca. The project shows successful
results in regard to environmental benefits.
Project beneficiaries report being more resilient
to shocks (8 percent higher than comparison
group), particularly to climatic shocks, and also
less affected by drought (16 percent lower).
Moreover, incomes from off-farm activities have
increased significantly (by 22 percent). On a more
general level, total assets have also increased
(15 percent), particularly productive assets
(41 percent), reflecting investments in business
enterprises and improvements in the domain of
economic mobility. 263
Coordinated policy action under protracted
crisis conditions
As highlighted under the first pathway, in
conf lict-affected countries, it is imperative that
policies, investments and actions to reduce
immediate food insecurit y and malnutrition
are implemented simultaneously with those
aimed at a reduction in the levels of conf lict,
and are aligned with long-term socio-economic
development and peacebuilding efforts. In Iraq,
a three decade-old protracted crisis has had
devastating effects on agri-food systems,
causing large population displacements,
destruction of agricultural infrastructure, loss
of livelihood assets and the severe disruption
of food value chains. Low productivit y
compounded by the impact of climate
change has raised challenges in the food and
agriculture sectors, which are major sources of
employment in both rural and urban areas. 97
During 2020, largely due to repercussions of the
COV ID-19 pandemic, povert y levels rose from
20 percent (2017–2018) to as much as 35 percent
in central governorates. 264
In Palestine, more than 1.7 million people
were food insecure in 2018 – about one-third
of the population. 267 This estimate rose to
more than 2 million following the outbreak
of the COV ID-19 pandemic in 2020, 268 and
before the recent outbreak of violent conf lict
with Israel. Apart from causing a health crisis,
the pandemic aggravated the humanitarian
situation, while lockdowns impacted
negatively on socio-economic development
in Palestine. In response to the crisis,
emergency policy measures were put in place
to maintain agri-food systems, with additional
measures to mitigate the effect of the crisis
on v ulnerable groups while protecting and
promoting their livelihoods. 269
| 120 |
THE STATE OF FOOD SECURITY AND NUTRITION IN THE WORLD 2021
protection systems. 273,278 Their food systems are
founded on a holistic and systemic view that
encompasses spiritualit y, life and culture, with
biotic and abiotic components in the ecosystem,
as well as the interconnections between them.
These food systems involve the totalit y of
human capacit y for the sustainable production,
generation, utilization, access, availabilit y,
stabilit y and management of foods that are
nutritious and fulfilling. 279
After decades of humanitarian response, the
above measures reflect stepped-up efforts over
the past five years to strengthen a HDP nexus
approach. 270 In this context, in late 2020, the
Palestinian cabinet endorsed its first National
Food and Nutrition Security Policy (NFNSP,
2019–2030), 271 complemented by a National
Investment Plan for Food and Nutrition
Security and Sustainable Agriculture (NIP,
2020 –2022). 268,272 In spite of the protracted crisis,
the NFNSP and NIP – formulated by the Ministry
of Agriculture, in cooperation with, among others,
the Ministries of Health, Social Development,
Education and Higher Education, the Palestinian
Water and Environmental Authorities, and the
Central Bureau of Statistics – jointly aim at
consolidating policy frameworks and coordinating
and prioritizing interventions by different
actors. The renewed policy approach rests on
strengthening the link between agricultural
development, social protection and economic
empowerment to simultaneously address the most
urgent as well as structural development needs
of the Palestinian people. Regrettably, given the
most recent outbreak of violent conflict between
Israel and Palestine, current efforts are inevitably
focused on peacebuilding, which remains the
most important priority in the near future.
Indigenous Peoples’ food systems provide
best practices on sustainabilit y, incorporating
seasonalit y, a broad food base, resilience, food
generation, self-governance, management of
collective rights and ecosystems management.
These practices could be applied elsewhere to
create healthier, more sustainable food systems.
In the United States of America, where Indigenous
Peoples are twice as likely to be food insecure
than non-indigenous, 280 the Oneida Nation
in Wisconsin is confronting food insecurit y
and malnutrition among its people, including
high levels of diabetes and obesit y resulting
from excessive consumption of processed
foods. An integrated communit y food systems
approach has been set up to revitalize their
beliefs, cosmogony and governance, and a local
food systems’ governance coalition has been
established to restore their lands and waters
to sustainably produce nutritious foods for
their people. Their farm-to-school programme
has been nationally recognized as a successful
way of including nutritious foods in children’s
school menus that are both local and culturally
appropriate. Furthermore, their intercultural and
integrated approach to food within governance,
policy, investment and communit y leadership
has strengthened the food environment for the
Oneida Nation, improved public health and
reinforced intergenerational commitment to
sustain their food systems. 97
Indigenous Peoples’ food systems
A good example of holistic and interconnected
systems, providing nutritious and varied
foods within healthy environments while
preser ving biodiversit y, are the food systems
of Indigenous Peoples. 273,274 In recent decades,
these sustainable and resilient food systems
– which have managed to generate food
and medicines for hundreds of years – have
been negatively affected by climate change,
extractive industries, expansion of commercial
agriculture and persistent marginalization,
resulting in displacement, violence, structural
povert y and inequalit y. 112,275,276,277 The ongoing
COV ID-19 pandemic has exacerbated their
food insecurit y, particularly in urban and
peri-urban areas and in communities that rely
more on market access to food.
Living in more than 90 countries across seven
socio-cultural regions, Indigenous Peoples
represent 6.2 percent of the world population
(476 million). While one in five of the world’s
extreme poor belong to Indigenous Peoples, their
economic povert y is in sharp contrast with the
cultural and ecological richness of their societies:
they speak 4 000 out of the 6 700 lang uages
remaining worldwide, and while their land and »
In spite of these challenges, Indigenous
Peoples have demonstrated that integrated
approaches that go beyond food are fundamental
to improving food environments and social
| 121 |
CHAPTER 4 WHAT NEEDS TO BE DONE TO TRANSFORM FOOD SYSTEMS
BOX 14 INDIGENOUS PEOPLES’ SYSTEMIC APPROACHES PROVIDE EXTENSIVE KNOWLEDGE FOR THE
SUSTAINABLE AND INCLUSIVE TRANSFORMATION OF FOOD SYSTEMS
through extensive consultation with First Nations,
Métis Nations and Inuit. 288 In Bolivia, intercultural
health assistance programmes have been developed,
combining traditional Indigenous medicine with
western medicine at the community level.
Intercultural institutions for inclusive governance
can support access to safe and nutritious foods for
all by combining Indigenous Peoples’ institutions,
customary self-regulation and governance systems
with formal institutions. In New Zealand, the
Government has started a programme to incorporate
indigenous customary law, mediation, and conflict
resolution to reduce the imprisonment of Maori
People. In India, the rights of Adivasi or Indigenous
Peoples to forest, land and territorial management
are enshrined within the 2006 Forest Rights Act.
In Indonesia, the Constitutional Ruling recognizes
the rights of Hutan Adat or Indigenous Peoples over
forest lands. 289
Developing co-responsible, circular food systems
through reciprocity, solidarity and safety nets that
influence corporate responsibility beyond the life
of a given product. Circularity and co-responsibility
within food systems can ensure that externalities
are absorbed in the prices and ensure that the
current waste generated by the food systems
is moved away from inorganic waste residues
towards organic ones and thus reincorporated
into the system as an input. In New Zealand, the
Government’s Waste Minimisation Fund supports
food rescue initiatives, such as Para Kore and
Kai Ika to repurpose and redirect food waste to
families and community groups in the local region,
promoting food security and diverting organic waste
from landfills.
Highlighting the importance of dedicated policies to
address collective rights and mobile livelihoods for
food security. Indigenous Peoples´ food systems
combine individual and collective rights to lands
and resources. Similarly, mobile, semi-mobile and
nomadic livelihoods are essential for maintaining
both food generation and food production activities
within these food systems. In Mali, the importance
of nomadism and mobile livelihoods is recognized in
national legislation. Moreover, scientists and policy
practitioners are starting to realize the relevance of
mobile livelihoods in biodiversity conservation and
territorial management.112
Indigenous Peoples´ systemic approach to food,
nutrition, health, environment and biodiversity,
demonstrates how environmental, agri-food, health
and social protection systems can build cross-sectoral,
coherent and sustainable approaches to food
systems. Their experiences can inform policies to
transform other food systems towards sustainability.
Key messages include:
Systemic, inclusive approaches to food systems
strengthen the links between the environment,
health and food production. This includes a
biocentric approach that uses new metrics to
measure system performance to complement current
indicators. Internationally, the One Health approach
recognizes the interdependence between food,
health and the environment, including biodiversity. 228
Diversification of the food base. Indigenous Peoples’
food systems can serve as an example of how
to expand current food bases in acknowledging
biodiversity, enabling diverse agri-food systems,
building resilience and ensuring positive human health
benefits from diversified diets.283 The Tikuna, Cocama
and Yagua Peoples in Colombia as well as Khasi, Botia
and Anwal Peoples in India sustain food systems
counting well beyond 100 edibles consisting of wild,
semi-domesticated and domesticated species.112 And
the Tzeltal women in Mexico conserve the biological
richness of maize, validating sustainable practices
and doubling the productivity of their seeds.
Blending technology and innovation with Indigenous
Peoples’ traditional knowledge systems for
new adapted solutions. In Panama, Indigenous
communities help to monitor illegal logging using
drone, cell phone and computer technologies,
supported by Indigenous elders, who are able to
share their knowledge, such as mental mappings of
their territory to decide about the most appropriate
actions to take. 284 In India, an agro-ecological
programme based on the traditional knowledge of
Indigenous Peoples has promoted the use of finger
millet to address the impact of climate change on
food production. Through this programme, millet
yields almost tripled in comparison to other forms of
millet cultivation. 285,286,287
Interculturality in policy discussions, decision-making
and implementation. Examples here include
Canada´s new Food Policy, which was formulated
| 122 |
THE STATE OF FOOD SECURITY AND NUTRITION IN THE WORLD 2021
» territories encompass around 25 percent of the
Indigenous Peoples can make towards the
transformation of food systems, their voices
are still marginalized in policy discussions and
decision-making processes. 281 To help rectif y
this, the Global-Hub on Indigenous Peoples’
Food Systems brings together Indigenous
and non-Indigenous experts, scientists and
researchers to co-create knowledge and evidence
that can inf luence policy. 282 Drawing upon
experiences of Indigenous Peoples worldwide,
Box 14 provides g uidance on best practices towards
systemic approaches for the sustainable and
inclusive transformation of food systems. n
Earth’s surface, these contain 80 percent of the
remaining terrestrial biodiversit y and see lower
rates of deforestation.
Given their global presence and their wealth
of knowledge, Indigenous Peoples are key
partners to contribute to global debates around
sustainable and resilient food systems. Their food
systems are diverse and nutritious, help to
preser ve biodiversit y and have demonstrated to
be resilient and adaptive to shocks. Despite the
growing contributions on sustainabilit y that
| 123 |
GUATEMALA
A woman applying good
practices of handling
healthy food preparation.
©FAO/Luis Gustavo
Sánchez Días
CHAPTER 5
CONCLUSION
H
aving monitored for five years the
progress made towards ending
hunger and all forms of malnutrition
in the framework of SDG 2, and examined the
major drivers behind that progress, this year,
The State of Food Security and Nutrition in the World
completes a pentalog y of editions that closes on
both a negative and positive note.
– an increase of almost 320 million people in
just one year. Related to this, the high cost of
healthy diets coupled with persistent high levels
of income inequalit y put healthy diets out of
reach for around 3 billion people in 2019 across
all regions. This number will likely increase
in 2020, affecting most regions, due to the
COV ID-19 pandemic.
The negative note is obvious. Chapter 2 of this
report makes it clear that, with less than a
decade to 2030, we are not on track to ending
world hunger and malnutrition – in fact, we are
moving in the wrong direction. The picture is
bleak. After remaining virtually unchanged for
five years, the prevalence of undernourishment
increased from 8.4 percent in 2019 to around
9.9 percent in 2020, meaning that between
720 and 811 million people in the world faced
hunger in 2020 – as many as 161 million more
people than in 2019. Beyond hunger, the outlook
is also discouraging. For the global prevalence
of moderate or severe food insecurit y, the
estimated increase in 2020 was equal to that of
the previous five years combined. Thus, nearly
one in three people in the world (2.37 billion)
did not have access to adequate food in 2020
Moreover, the goal of ending all forms of
malnutrition remains a challenge. Although data
limitations have prevented this report from fully
accounting for the impact of the pandemic, it is
estimated that 22.0 percent of children in 2020
were affected by stunting, 6.7 percent were
suffering from wasting and 5.7 percent were
overweight. An estimated 29.9 percent of women
aged 15 to 49 years in 2019 around the world
were affected by anaemia, and adult obesit y is
increasing sharply in all regions. The current
rate of global progress towards targets for these
nutrition indicators is insufficient or is even
stalled or worsening.
As indicated in Chapter 3, driving these
unwelcome trends are the increasing frequency
and intensit y of conf lict, climate variabilit y
| 125 |
CHAPTER 5 CONCLUSION
and extremes, economic slowdowns and
downturns, and high levels of inequalit y.
Economic downturns in 2020, which were
mainly a consequence of COV ID-19 containment
measures all over the world, have contributed to
one of the largest increases in world hunger in
decades, which has affected almost all low- and
middle-income countries, and can reverse gains
made in nutrition. But the downturns resulting
from the COV ID-19 pandemic were just a small
part of a much bigger problem: more alarmingly,
the pandemic has exposed the v ulnerabilities
forming in our food systems over recent years
as a result of major drivers such as conf lict,
climate variabilit y and extremes, and economic
slowdowns and downturns. These major drivers
are increasingly occurring simultaneously
in countries, with interactions that seriously
undermine food securit y and nutrition. It has
been shown that the majorit y of children who are
hungr y and stunted live in countries affected by a
combination of these drivers. Moreover, increases
in hunger in 2020 were even larger in countries
where economic downturns were combined with
climate-related disasters or conf lict, or both.
systems. This creates interconnected circular
associations, contributing to increased food
insecurit y and malnutrition and leading to
current and future v ulnerabilit y. These major
drivers each have their own trajector y or
cyclicalit y that ensures they will continue to
occur and could even worsen in the coming
years; therefore, bolder and scaled-up actions are
needed to build resilience to their negative effects
on food securit y and nutrition.
On a more positive note, there is a solution going
forward, and Chapter 4 of this report has pointed
us to it. Given that the major drivers negatively
affect food security and nutrition through their
impacts on food systems, the solution lies in
the transformation of these systems, and in fact
there is already momentum to do so. The world
has noted that food systems are central to the
goal of eradicating hunger and malnutrition in
all its forms and ensuring that everyone can
afford a healthy diet. The UN Food Systems
Summit 2021 will bring forward a series of
concrete actions that people from all over the
world can take to support a transformation of the
world’s food systems. To that end, this report has
identified six pathways that, alone or frequently
in combination, specifically address the negative
impacts of the major drivers behind the recent
rise in hunger and slowing progress to reduce
malnutrition in all its forms. These include:
(i) integrating humanitarian, development
and peacebuilding policies in conflict-affected
areas; (ii) scaling up climate resilience across
food systems; (iii) strengthening resilience of
the most vulnerable to economic adversity;
(iv) intervening along the food supply chains to
lower the cost of nutritious foods; (v) tackling
poverty and structural inequalities, ensuring
interventions are pro-poor and inclusive; and
(vi) strengthening food environments and
changing consumer behaviour to promote dietary
patterns with positive impacts on human health
and the environment.
It is also important to consider that millions
of people are food insecure and malnourished
in all its forms because they cannot afford a
healthy diet. The aforementioned drivers and
high levels of inequalit y, as well as other factors
driving up the cost of nutritious foods – in the
realms of food production, food supply chains
and food environments, as well as consumer
demand and the political economy of food
– are behind this significant deficiency in
our food systems. Evidence already suggests
that countries where the unaffordabilit y of a
healthy diet increased between 2017 and 2019
also show higher levels of severe as well as
moderate or severe food insecurit y, especially
lower-middle-income countries.
While the COV ID-19 pandemic and its impacts
have been an immense challenge for the world,
they may also be a warning call of unwelcome
events to come if we do not commit to more
resolute actions to change course. As the report
has shown, the major drivers threatening food
securit y and nutrition are also interconnected
with, and have circular impacts on, other
systems, including environmental and health
The complex challenges to food securit y and
nutrition call for greater synerg y and coherence
in policy formulation and implementation across
sectors, supported by more strategic investments
from both the public and private sectors, which
is key to avoid undesirable trade-offs. This also
means that silo solutions are no longer an option.
| 126 |
THE STATE OF FOOD SECURITY AND NUTRITION IN THE WORLD 2021
this report (Chapter 2), having food securit y
estimates based on the Food Experience Scale
at disaggregated geographical level has allowed
policymakers and programme planners to
visualize which provinces or regions are most in
need of inter ventions to g uarantee the right to
adequate food. Moreover, more and better data
allow for carr ying out situation analyses covering
context-specific and comprehensive assessments
of which key drivers are impacting negatively on
food systems and resulting in poor food securit y
and nutrition outcomes (as noted in Chapter 4).
What are required are integrated portfolios of
policies, investments and legislation, built along
the particular transformation pathways needed
in each context, that can specifically address food
securit y and nutrition challenges head on.
The persistence of socio-economic inequalities
and povert y is a major issue – one that any
process of food systems transformation
cannot afford to ignore. This amplifies the
need to provide v ulnerable and historically
marginalized populations with greater access to
productive resources, technolog y and innovation
to empower them to become agents of change
towards more equitable and sustainable food
systems. The successful transformation of
food systems towards greater affordabilit y of
healthy diets for all, sustainably produced and
with improved resilience to the major drivers
identified, calls for win-win solutions to be
fully exploited, and for trade-offs to be carefully
managed. Hence, it is not enough to address the
factors driving up the cost of nutritious foods;
the inequalities and low incomes faced by many
v ulnerable people also need to become a thing
of the past.
Policy coherence – understood as a situation
where the implementation of policies in one area
do not undermine others and even reinforce
each other where feasible – across systems, as
well as cross-cutting accelerators, play a key
role in maximizing the benefits and minimizing
the negative consequences of transformation.
These conditions will be critical to building
transformative multisectoral portfolios of
policies, investments and legislation that
become win-win solutions and help manage
trade-offs. Systems approaches are also needed,
such as territorial approaches, ecosystems
approaches, Indigenous Peoples’ food systems
and inter ventions that systemically address
protracted crisis conditions.
As with all systemic changes, the actions
taken along the six transformation pathways
proposed in this report will result in winners
and losers. The introduction of new technologies
and innovations will ser ve as important
accelerators in the comprehensive portfolios
of policies, investments and legislation aimed
at transforming food systems to increase the
affordabilit y of healthy diets. However, adequate
governance will need to be in place to ensure
no one is left behind in the access to these
accelerations and potential inequalities and
divides are prevented. Timely availabilit y of data
and information at both national and subnational
levels will also be critical to monitor progress
towards targets and to target inter ventions
where they are needed most. As presented in
This report recognizes the urgency for the
broader food systems transformation that is
needed and is currently at the centre of global
attention. At the same time, it makes the case
that, for getting back on track towards meeting
SDG Target 2.1, ensuring access to safe,
nutritious and sufficient food for all people all
year round, and SDG Target 2.2, eradicating
all forms of malnutrition, we must focus on the
transformation pathways and policy coherence
that help most in addressing the major drivers
behind the recent rise in hunger and slowing
progress towards reducing all forms
of malnutrition. n
| 127 |
KYRGYZSTAN
A scene of cooking
chak-chak – a dessert.
©FAO/Mirbek Kadraliev
ANNEXES
ANNEX 1A
Statistical tables to Chapter 2
ANNEX 4
130
Country group definitions and lists of
countries affected by drivers in Chapter 3
ANNEX 1B
Methodological notes for the food security
and nutrition indicators
ANNEX 5
156
Country group definitions for the analysis
of food insecurity and drivers in 2020
ANNEX 2
Methodologies Chapter 2
186
ANNEX 6
170
Glossary
ANNEX 3
Country exposure to the drivers and PoU
change point analysis in Chapter 3
181
179
| 129 |
188
ANNEX 1A
STATISTICAL TABLES TO CHAPTER 2
PREVALENCE OF
EXCLUSIVE
BREASTFEEDING
AMONG INFANTS
0–5 MONTHS OF AGE
20206
2012
20206
2012
2016
2012
2019
20127
20198
2012
PREVALENCE OF
LOW BIRTHWEIGHT
PREVALENCE OF
ANAEMIA AMONG
WOMEN OF
REPRODUCTIVE AGE
(15–49)
2012
PREVALENCE OF
OVERWEIGHT IN
CHILDREN (UNDER
5 YEARS OF AGE)
20205
PREVALENCE OF
STUNTING IN
CHILDREN (UNDER
5 YEARS OF AGE)
PREVALENCE OF
OBESITY IN THE
ADULT POPULATION
(18 YEARS AND
OLDER)
2004–06 2018–204 2014–16 2018–20 2014–16 2018–20
PREVALENCE OF
WASTING IN
CHILDREN (UNDER
5 YEARS OF AGE)
PREVALENCE OF
MODERATE OR
SEVERE FOOD
INSECURITY
IN THE TOTAL
POPULATION1, 2, 3
| 130 |
PREVALENCE OF
SEVERE FOOD
INSECURITY
IN THE TOTAL
POPULATION1, 2, 3
REGIONS/
SUBREGIONS/
COUNTRIES
PREVALENCE OF
UNDERNOURISHMENT
IN THE TOTAL
POPULATION1
TABLE A1.1 PROGRESS TOWARDS THE SUSTAINABLE DEVELOPMENT GOALS (SDGs) AND GLOBAL NUTRITION TARGETS: PREVALENCE OF UNDERNOURISHMENT,
MODERATE OR SEVERE FOOD INSECURITY, SELECTED FORMS OF MALNUTRITION, EXCLUSIVE BREASTFEEDING AND LOW BIRTHWEIGHT
2015
(%)
(%)
(%)
(%)
(%)
(%)
(%)
(%)
(%)
(%)
(%)
(%)
(%)
(%)
(%)
(%)
(%)
(%)
(%)
WORLD
12.3
8.9
8.2
10.5
23.0
27.6
6.7
26.2
22.0
5.6
5.7
11.8
13.1
28.5
29.9
37.0
44.0
15.0
14.6
Least developed
countries
28.5
22.0
20.5
22.3
49.9
53.8
7.3
38.9
33.7
3.2
3.4
4.9
6.0
39.1
39.4
45.7
55.2
16.2
15.6
Landlocked
developing
countries
26.8
17.5
16.4
19.7
44.5
51.3
5.6
36.2
30.2
4.3
3.9
8.3
9.4
32.0
32.9
45.4
54.5
14.3
13.9
Small island
developing states
18.2
15.2
n.a.
n.a.
n.a.
n.a.
5.6
21.1
20.6
6.3
6.6
18.8
20.9
28.2
29.2
36.8
38.6
11.2
11.1
Low-income
economies
32.5
28.9
23.3
26.2
54.6
59.6
6.9
39.6
34.6
3.9
3.7
6.3
7.3
38.5
38.8
42.5
54.4
14.5
14.1
Lower-middleincome economies
18.5
13.0
12.7
16.5
31.5
39.0
9.9
36.3
29.1
4.0
4.0
6.5
7.6
43.8
43.7
39.8
50.1
21.3
20.5
Upper-middleincome economies
8.0
3.4
3.4
4.7
14.1
17.3
2.1
12.8
10.8
8.1
8.8
11.5
13.1
18.6
19.6
31.1
29.6
7.8
7.7
High-income
economies
<2.5
<2.5
1.7
1.6
8.6
7.6
0.4a
7.3a
7.8a
22.3
24.3
13.2
14.4
n.a.
n.a.
7.6
7.6
Low-income fooddeficit countries
23.3
18.0
16.8
20.4
35.8
43.8
3.2
3.1
4.3
5.2
n.a.
n.a.
43.7
55.7
20.9
20.1
10.6
3.7a
38.6
3.4a
30.7
2012
2012
20206
2012
2016
2019
20127
20198
PREVALENCE OF
LOW BIRTHWEIGHT
2012
PREVALENCE OF
EXCLUSIVE
BREASTFEEDING
AMONG INFANTS
0–5 MONTHS OF AGE
PREVALENCE OF
OVERWEIGHT IN
CHILDREN (UNDER
5 YEARS OF AGE)
20206
PREVALENCE OF
ANAEMIA AMONG
WOMEN OF
REPRODUCTIVE AGE
(15–49)
20205
PREVALENCE OF
OBESITY IN THE
ADULT POPULATION
(18 YEARS AND
OLDER)
2004–06 2018–204 2014–16 2018–20 2014–16 2018–20
PREVALENCE OF
STUNTING IN
CHILDREN (UNDER
5 YEARS OF AGE)
PREVALENCE OF
WASTING IN
CHILDREN (UNDER
5 YEARS OF AGE)
PREVALENCE OF
MODERATE OR
SEVERE FOOD
INSECURITY
IN THE TOTAL
POPULATION1, 2, 3
PREVALENCE OF
SEVERE FOOD
INSECURITY
IN THE TOTAL
POPULATION1, 2, 3
REGIONS/
SUBREGIONS/
COUNTRIES
PREVALENCE OF
UNDERNOURISHMENT
IN THE TOTAL
POPULATION1
TABLE A1.1 (CONTINUED)
2012
2015
(%)
(%)
(%)
(%)
(%)
(%)
(%)
(%)
(%)
(%)
(%)
(%)
(%)
(%)
(%)
(%)
(%)
(%)
(%)
21.6
19.0
18.6
22.8
48.8
55.5
6.0
34.5
30.7
5.0
5.3
11.5
12.8
39.2
38.9
35.5
43.6
14.1
13.7
Northern Africa
8.3
6.6
9.9
9.2
28.7
30.0
6.6
22.7
21.4
12.0
13.0
23.0
25.2
31.9
31.1
40.7
42.1
12.4
12.2
Algeria
6.7
<2.5
13.0
6.9
22.9
17.6
2.7
12.6
9.3
13.5
12.9
24.7
27.4
32.9
33.3
25.4
n.a.
7.3
7.3
Egypt
6.4
5.4
6.7
27.8b
27.8
9.5
22.5
22.3
15.8
17.8
29.3
32.0
31.0
28.3
52.8
39.5
n.a.
n.a.
Libya
n.a.
n.a.
18.6
29.1
37.4
Morocco
5.5
4.2
Sudan
18.9
12.3
13.4
Tunisia
4.3
3.0
9.1
10.7
18.2
25.1
Northern Africa
(excluding Sudan)
6.1
5.4
9.1
7.5
26.0
Sub-Saharan Africa
25.0
21.8
20.6
25.9
Eastern Africa
24.6
26.6
AFRICA
8.4b
11.2
c,d
| 131 |
16.8
c,d
10.2
29.3
43.5
25.6
25.4
30.0
32.5
28.6
29.9
n.a.
n.a.
n.a.
n.a.
28.0
c,d
2.6
16.4
12.9
11.8
11.3
23.4
26.1
29.8
29.9
27.8
35.0
17.5
17.3
49.4
c,d
16.3
36.0
33.7
2.5
2.7
<0.1
<0.1
36.8
36.5
41.0
54.6
n.a.
n.a.
2.1
9.1
8.6
10.9
16.5
24.6
26.9
30.4
32.1
8.5
13.5
7.5
7.5
25.9
n.a.
n.a.
n.a.
n.a.
n.a.
26.8
29.5
n.a.
n.a.
40.6
37.1
11.5
11.4
53.4
61.3
5.9
36.6
32.3
3.8
4.0
8.0
9.2
41.2
40.7
34.5
44.0
14.4
14.0
59.3
63.5
41.4
c,d
34.2
26.6
Burundi
n.a.
n.a.
Comoros
n.a.
n.a.
n.a.
n.a.
n.a.
31.3
16.2
n.a.
n.a.
n.a.
Djibouti
Eritrea
5.2
38.9
32.6
4.0
4.0
5.3
6.4
31.4
31.9
48.6
60.7
13.8
13.4
4.8
56.8
57.6
2.3
3.1
4.4
5.4
31.1
38.5
69.3
71.9
15.5
15.1
n.a.
n.a.
32.3
22.6
10.9
9.6
6.7
7.8
32.8
33.8
11.4
n.a.
24.2
23.7
n.a.
n.a.
31.7
34.0
7.2
7.2
12.3
13.5
31.0
32.3
12.4
n.a.
n.a.
n.a.
n.a.
n.a.
n.a.
n.a.
n.a.
n.a.
n.a.
50.1
49.1
1.7
2.1
4.1
5.0
36.2
37.0
68.7
n.a.
n.a.
n.a.
Ethiopia
37.1
16.2
14.5
16.4
56.2
56.3
7.2
42.8
35.3
2.5
2.6
3.6
4.5
22.4
23.9
52.0
58.8
n.a.
n.a.
Kenya
28.5
24.8
17.3
4.2
27.8
19.4
4.6
4.5
5.9
7.1
28.4
28.7
31.9
61.4
11.7
11.5
Madagascar
33.4
43.2
n.a.
n.a.
n.a.
n.a.
6.4
47.9
40.2
1.8
1.5
4.3
5.3
37.5
37.8
41.9
50.6
17.5
17.1
Malawi
22.5
17.3
51.8
51.4
81.9
81.8
0.6
43.8
37.0
5.7
4.7
4.8
5.8
30.6
31.4
70.8
59.4
14.9
14.5
5.1
6.2
5.2
8.3
13.0
24.2
n.a.
9.0f
8.7f
7.4f
7.6f
9.6
10.8
19.2
23.5
n.a.
n.a.
17.0
17.1
Mozambique
33.3
31.2
40.7
40.5
68.4
71.1
4.4
42.9
37.8
5.7
6.0
6.1
7.2
48.8
47.9
40.0
n.a.
14.1
13.8
Rwanda
35.3
35.2
1.1
40.5
32.6
5.7
5.2
4.7
5.8
18.3
17.2
83.8
86.9
8.2
7.9
n.a.
n.a.
n.a.
8.0
7.4
9.6
9.8
12.4
14.0
23.5
25.1
n.a.
n.a.
11.0
11.7
Mauritius
Seychelles
3.2
c,d
c,d
c
25.7
3.3
c.d
c,d
c
53.0
14.3
c,d
c,d
c
68.5
14.7
c,d
c,d
c
Somalia
South Sudan
(%)
(%)
58.2
59.5
(%)
(%)
(%)
n.a.
43.0h
n.a.
2016
2012
PREVALENCE OF
LOW BIRTHWEIGHT
2012
PREVALENCE OF
EXCLUSIVE
BREASTFEEDING
AMONG INFANTS
0–5 MONTHS OF AGE
PREVALENCE OF
ANAEMIA AMONG
WOMEN OF
REPRODUCTIVE AGE
(15–49)
20206
PREVALENCE OF
OVERWEIGHT IN
CHILDREN (UNDER
5 YEARS OF AGE)
2012
2019
20127
20198
2012
2015
(%)
(%)
(%)
(%)
(%)
(%)
(%)
(%)
(%)
(%)
(%)
(%)
(%)
n.a.
31.1
27.4
3.1
2.9
7.0
8.3
44.0
43.1
5.3
n.a.
n.a.
n.a.
n.a.
65.4
n.a.
32.1
30.6
6.4
5.7
<0.1
<0.1
34.7
35.6
44.5
n.a.
n.a.
n.a.
n.a.
17.5c,d
21.7c,d
58.0c,d
69.2c,d
3.5
34.1
27.9
3.9
4.0
4.3
5.3
31.3
32.8
62.3
65.5
n.a.
n.a.
31.6
25.1
23.8c,d
24.7c,d
55.0c,d
56.4c,d
3.5
38.3
32.0
4.7
5.5
6.9
8.4
40.3
38.9
48.7
57.8
10.7
10.5
Zambia
n.a.
n.a.
21.8c,d
23.2c,d
48.8c,d
51.4c,d
4.2
41.3
32.3
6.2
5.7
6.8
8.1
30.5
31.5
59.9
69.9
11.9
11.6
Zimbabwe
n.a.
n.a.
35.5
32.1
64.7
69.8
2.9
31.4
23.0
4.7
3.6
14.3
15.5
30.0
28.9
31.3
41.9
12.8
12.6
United Republic of
Tanzania
| 132 |
Middle Africa
36.7
30.5
n.a.
Angola
52.2
17.3
21.0
Cameroon
15.9
5.3
n.a.
26.7
Central African
Republic
39.6
48.2
n.a.
Chad
37.8
31.7
Congo
34.0
37.7
Democratic
Republic of the
Congo
38.4
Equatorial Guinea
Gabon
35.6
c
n.a.
84.8
20206
–
c
85.1
2012
n.a.
Uganda
c
62.0
(%)
79.1h
20205
PREVALENCE OF
OBESITY IN THE
ADULT POPULATION
(18 YEARS AND
OLDER)
2004–06 2018–204 2014–16 2018–20 2014–16 2018–20
PREVALENCE OF
STUNTING IN
CHILDREN (UNDER
5 YEARS OF AGE)
PREVALENCE OF
WASTING IN
CHILDREN (UNDER
5 YEARS OF AGE)
PREVALENCE OF
MODERATE OR
SEVERE FOOD
INSECURITY
IN THE TOTAL
POPULATION1, 2, 3
PREVALENCE OF
SEVERE FOOD
INSECURITY
IN THE TOTAL
POPULATION1, 2, 3
REGIONS/
SUBREGIONS/
COUNTRIES
PREVALENCE OF
UNDERNOURISHMENT
IN THE TOTAL
POPULATION1
TABLE A1.1 (CONTINUED)
c
69.5
6.2
38.0
36.8
4.4
4.8
6.7
7.9
46.1
43.2
28.5
n.a.
12.8
12.5
73.5c
4.9
32.4
37.7
2.9
3.5
6.8
8.2
45.9
44.5
n.a.
37.4
12.0
15.3
n.a.
55.8
4.3
32.5
27.2
6.9
9.6
9.8
11.4
41.2
40.6
19.9
39.4
9.6
12.0
61.8
n.a.
81.3
5.2
41.4
40.1
3.5
2.6
6.4
7.5
47.9
46.8
33.0
28.8
11.5
14.5
13.9
38.7
35.0
2.4
3.4
5.1
6.1
49.2
45.4
3.2
0.1
n.a.
n.a.
42.6
51.7
82.0
88.3
8.2
23.4
18.9
5.1
5.1
8.3
9.6
53.1
48.8
20.2
32.9
9.4
11.6
41.7
n.a.
38.5
n.a.
69.2
6.4
42.8
40.8
4.6
4.2
5.6
6.7
46.4
42.4
36.4
n.a.
8.7
10.8
n.a.
n.a.
n.a.
n.a.
n.a.
n.a.
n.a.
25.5
19.7
8.8
9.3
6.8
8.0
47.4
44.5
7.4
n.a.
n.a.
n.a.
26.9c
66.5
14.3
15.7
n.a.
n.a.
n.a.
n.a.
n.a.
17.2
14.4
6.5
7.4
13.5
15.0
55.3
52.4
5.1
n.a.
11.4
14.2
Sao Tome and
Principe
9.0
11.9
n.a.
n.a.
n.a.
n.a.
4.1
18.3
11.8
2.7
4.0
10.7
12.4
45.7
44.2
50.3
71.7
5.1
6.6
Southern Africa
5.1
8.4
18.9
20.3
43.9
46.1
3.2
24.3
23.3
12.1
12.1
25.0
27.1
28.5
30.3
n.a.
33.5
14.3
14.2
25.2
29.3
19.6
n.a.
24.4
22.8
10.6
11.0
17.5
18.9
31.3
32.5
20.3
30.0
15.9
15.6
Eswatini
9.2
11.6
29.4
30.8
2.0
29.2
22.6
10.6
9.7
14.9
16.5
30.0
30.7
43.8
63.8
10.5
10.3
Lesotho
13.7
23.5
n.a.
27.0
2.1
37.7
32.1
7.0
7.2
14.9
16.6
28.3
27.9
52.9
59.0
14.8
14.6
Namibia
18.2
19.8
28.9c,d
n.a.
24.1
18.4
4.3
5.0
15.1
17.2
24.7
25.2
22.1
n.a.
15.7
15.5
Botswana
c,d
22.2
c,d
c
32.1c,d
45.9
c,d
50.8
62.6
64.1
n.a.
49.7
53.2c,d
c,d
c
57.6c,d
2012
2012
20206
2012
2016
2019
20127
(%)
20198
PREVALENCE OF
LOW BIRTHWEIGHT
2012
PREVALENCE OF
EXCLUSIVE
BREASTFEEDING
AMONG INFANTS
0–5 MONTHS OF AGE
PREVALENCE OF
OVERWEIGHT IN
CHILDREN (UNDER
5 YEARS OF AGE)
20206
PREVALENCE OF
ANAEMIA AMONG
WOMEN OF
REPRODUCTIVE AGE
(15–49)
20205
PREVALENCE OF
OBESITY IN THE
ADULT POPULATION
(18 YEARS AND
OLDER)
2004–06 2018–204 2014–16 2018–20 2014–16 2018–20
PREVALENCE OF
STUNTING IN
CHILDREN (UNDER
5 YEARS OF AGE)
PREVALENCE OF
WASTING IN
CHILDREN (UNDER
5 YEARS OF AGE)
PREVALENCE OF
MODERATE OR
SEVERE FOOD
INSECURITY
IN THE TOTAL
POPULATION1, 2, 3
PREVALENCE OF
SEVERE FOOD
INSECURITY
IN THE TOTAL
POPULATION1, 2, 3
REGIONS/
SUBREGIONS/
COUNTRIES
PREVALENCE OF
UNDERNOURISHMENT
IN THE TOTAL
POPULATION1
TABLE A1.1 (CONTINUED)
2012
2015
(%)
(%)
(%)
(%)
(%)
(%)
(%)
(%)
(%)
(%)
(%)
(%)
(%)
(%)
(%)
(%)
(%)
(%)
3.4
6.5
18.0
19.3
42.9
44.9
3.4
23.6
23.2
12.8
12.9
26.1
28.3
28.6
30.5
n.a.
31.6
14.3
14.2
Western Africa
14.1
14.8
10.8
21.8
42.5
57.8
6.9
34.9
30.9
2.3
2.7
7.4
8.9
52.9
51.8
22.1
32.3
15.6
15.2
Benin
12.0
7.6
n.a.
n.a.
n.a.
n.a.
5.0
33.8
31.3
1.6
2.2
8.2
9.6
55.5
55.2
32.5
41.4
17.2
16.9
Burkina Faso
17.5
14.4
10.0c,d
15.4c,d
41.8c,d
47.9c,d
8.1
33.9
25.5
1.7
2.6
4.5
5.6
53.3
52.5
38.2
55.8
13.5
13.1
Cabo Verde
11.0
15.4
n.a.
7.6
n.a.
35.1
n.a.
12.2
n.a.
n.a.
10.3
11.8
26.9
24.3
59.6
n.a.
n.a.
n.a.
Côte d'Ivoire
20.2
14.9
6.1
29.3
2.5
2.8
8.7
10.3
52.2
50.9
11.8
23.1
15.8
15.5
South Africa
| 133 |
Gambia
21.7
13.6
Ghana
11.2
6.1
23.6
Guinea
n.a.
n.a.
44.3
Guinea-Bissau
n.a.
n.a.
Liberia
35.8
38.9
Mali
13.3
10.4
Mauritania
9.4
9.1
Niger
n.a.
n.a.
c
25.7
c
f
9.7
f
17.8
52.7
56.0
5.1
22.4
16.1
1.9
2.3
8.7
10.3
56.4
49.5
33.1
53.3
17.2
16.8
49.3c,d
50.2c,d
6.8
22.2
14.2
2.2
2.9
9.4
10.9
44.2
35.4
45.7
42.9
14.5
14.2
49.7
72.5
74.1
9.2
33.8
29.4
4.1
5.7
6.4
7.7
50.9
48.0
20.4
33.4
n.a.
n.a.
n.a.
n.a.
n.a.
n.a.
7.8
29.7
28.0
2.7
3.4
7.9
9.5
49.9
48.1
38.3
52.5
21.8
21.1
n.a.
37.3
n.a.
80.6
3.4
35.6
28.0
3.2
4.7
8.6
9.9
43.6
42.6
27.8
n.a.
n.a.
n.a.
9.3
30.9
25.7
1.6
2.1
7.2
8.6
58.2
59.0
20.2
40.2
n.a.
n.a.
11.5
27.0
24.2
1.9
2.7
11.0
12.7
45.1
43.3
26.7
40.3
n.a.
n.a.
9.8
48.3
46.7
0.9
1.9
4.5
5.5
49.1
49.5
23.3
n.a.
n.a.
n.a.
7.6c,d
4.6
c,d
c,d
8.6c,d
6.5
c,d
21.4
c,d
26.3
c,d
39.8
c,d
36.5
c,d
57.7
c,d
Nigeria
7.1
14.6
6.6
6.5
38.0
35.3
2.5
2.7
7.4
8.9
54.9
55.1
14.7
25.2
n.a.
n.a.
Senegal
17.2
7.5
14.5
13.6c
39.3
40.9c
8.1
19.8
17.2
1.5
2.1
7.6
8.8
55.9
52.7
37.5
42.1
18.9
18.5
Sierra Leone
46.7
26.2
30.4c,d
31.8c,d
78.4c,d
83.9c,d
5.4
35.4
26.8
3.4
4.7
7.4
8.7
47.9
48.4
31.2
54.1
14.9
14.4
Togo
27.7
20.4
5.7
27.4
23.8
1.7
2.4
7.1
8.4
47.4
45.7
62.1
64.3
16.3
16.1
Sub-Saharan Africa
(including Sudan)
24.8
21.4
20.3
25.6
53.0
60.8
n.a.
n.a.
n.a.
n.a.
n.a.
7.7
8.9
n.a.
n.a.
34.8
44.3
14.4
14.0
ASIA*
13.7
8.2
7.3
9.3
19.0
23.6
8.9
28.1
21.8
4.9
5.2
6.1
7.3
31.1
32.7
39.0
45.3
17.8
17.3
Central Asia
10.8
3.2
1.7
3.1
9.2
15.0
2.3
15.4
10.0
8.5
5.6
15.6
17.7
28.8
28.1
29.2
44.8
5.6
5.4
Kazakhstan
7.3
<2.5
n.a.
<0.5c,d
n.a.
2.3c,d
3.1
11.1
6.7
11.5
8.8
19.0
21.0
27.3
28.7
31.8
37.8
6.1
5.4
Kyrgyzstan
9.0
7.2
n.a.
1.1
n.a.
7.0
2.0
16.0
11.4
7.6
5.8
14.4
16.6
34.1
35.8
56.0
45.6
5.6
5.5
c,d
c,d
Tajikistan
Turkmenistan
(%)
(%)
n.a.
n.a.
(%)
(%)
(%)
(%)
20206
2012
20206
2012
2016
2019
20127
PREVALENCE OF
LOW BIRTHWEIGHT
2012
PREVALENCE OF
EXCLUSIVE
BREASTFEEDING
AMONG INFANTS
0–5 MONTHS OF AGE
PREVALENCE OF
OVERWEIGHT IN
CHILDREN (UNDER
5 YEARS OF AGE)
PREVALENCE OF
STUNTING IN
CHILDREN (UNDER
5 YEARS OF AGE)
2012
PREVALENCE OF
ANAEMIA AMONG
WOMEN OF
REPRODUCTIVE AGE
(15–49)
20205
PREVALENCE OF
OBESITY IN THE
ADULT POPULATION
(18 YEARS AND
OLDER)
2004–06 2018–204 2014–16 2018–20 2014–16 2018–20
PREVALENCE OF
WASTING IN
CHILDREN (UNDER
5 YEARS OF AGE)
PREVALENCE OF
MODERATE OR
SEVERE FOOD
INSECURITY
IN THE TOTAL
POPULATION1, 2, 3
PREVALENCE OF
SEVERE FOOD
INSECURITY
IN THE TOTAL
POPULATION1, 2, 3
REGIONS/
SUBREGIONS/
COUNTRIES
PREVALENCE OF
UNDERNOURISHMENT
IN THE TOTAL
POPULATION1
TABLE A1.1 (CONTINUED)
20198
2012
2015
(%)
(%)
(%)
(%)
(%)
(%)
(%)
(%)
(%)
(%)
(%)
(%)
(%)
5.6
26.5
15.3
5.6
3.5
12.2
14.2
31.0
35.2
32.6
35.8
5.7
5.6
4.2
4.1
n.a.
n.a.
n.a.
n.a.
4.1
13.0
7.6
5.0
3.8
16.3
18.6
25.3
26.6
10.9
58.3
5.0
4.9
14.7
<2.5
1.9
4.0
11.2
19.7
1.8
14.2
9.9
8.6
5.0
14.4
16.6
28.7
24.8
23.8
49.5
5.3
5.3
Eastern Asia*
6.9
<2.5
1.0
1.7
6.1
8.3
1.7
7.5
4.9
6.8
7.9
4.9
6.0
15.5
16.1
28.5
22.0
5.1
5.1
China
7.0
<2.5
1.9
7.4
4.7
7.2
8.3
5.0
6.2
14.8
15.5
27.6
20.8
5.0
5.0
China, mainland
7.1
<2.5
n.a.
n.a.
n.a.
n.a.
n.a.
n.a.
n.a.
n.a.
n.a.
n.a.
n.a.
n.a.
n.a.
Taiwan Province
of China
4.3
3.3
n.a.
n.a.
n.a.
n.a.
n.a.
n.a.
n.a.
27.0
28.4
n.a.
n.a.
n.a.
n.a.
China, Hong Kong
SAR
<2.5
<2.5
n.a.
n.a.
n.a.
n.a.
n.a.
n.a.
n.a.
n.a.
n.a.
n.a.
n.a.
n.a.
n.a.
China, Macao SAR
16.0
4.3
n.a.
n.a.
n.a.
n.a.
n.a.
n.a.
n.a.
n.a.
n.a.
n.a.
n.a.
n.a.
n.a.
n.a.
n.a.
n.a.
n.a.
Democratic
People's Republic
of Korea
33.8
42.4
n.a.
n.a.
n.a.
n.a.
2.5
26.1
18.2
1.3
1.9
5.9
6.8
31.7
33.9
68.9
71.4
n.a.
n.a.
Japan
<2.5
<2.5
<0.5
0.7
2.6
3.4
n.a.
6.6
5.5
2.0
2.4
3.6
4.3
19.7
19.0
n.a.
n.a.
9.6
9.5
21.0
Uzbekistan
| 134 |
Mongolia
29.6
4.3
3.4
4.9
26.2
0.9
12.6
7.1
10.2
10.1
17.9
20.6
14.3
14.5
65.7
50.2
5.5
5.4
Republic of Korea
<2.5
<2.5
<0.5c
0.6
4.8c
5.1
n.a.
2.2
2.2
7.7
8.8
4.1
4.7
13.7
13.5
n.a.
n.a.
5.4
5.8
Eastern Asia
(excluding China,
mainland)
5.6
6.2
0.5
0.8
3.9
4.6
n.a.
n.a.
n.a.
n.a.
n.a.
n.a.
n.a.
n.a.
n.a.
n.a.
n.a.
8.5
8.4
South-eastern Asia
17.1
7.1
2.4
2.8
15.9
17.6
8.2
30.5
27.4
5.8
7.5
5.4
6.7
25.0
27.2
33.5
47.9
12.4
12.3
Brunei Darussalam
<2.5
<2.5
n.a.
n.a.
n.a.
n.a.
n.a.
17.5
12.7
8.4
9.3
12.1
14.1
14.8
16.7
n.a.
n.a.
12.1
10.8
16.9
13.4
48.9
44.8
Cambodia
17.0
6.2
Indonesia
19.2
6.5
0.7c,d
0.7c,d
6.0c,d
Lao People's
Democratic Republic
22.4
5.3
n.a.
8.9
n.a.
3.2
3.2
7.8
7.5
17.4
Malaysia
9.7
34.4
29.9
2.1
2.1
3.1
3.9
46.1
47.1
72.8
65.2
12.6
12.1
10.2
34.5
31.8
8.2
11.1
5.5
6.9
27.0
31.2
40.9
50.7
10.2
10.0
29.4
9.0
40.7
30.2
2.3
3.0
4.1
5.3
36.3
39.5
39.7
44.4
17.7
17.3
18.7
9.7
18.3
20.9
6.0
6.1
13.1
15.6
30.1
32.0
n.a.
40.3
11.3
11.3
6.2c,d
20206
2012
2016
2012
2019
20127
20198
PREVALENCE OF
LOW BIRTHWEIGHT
2012
PREVALENCE OF
EXCLUSIVE
BREASTFEEDING
AMONG INFANTS
0–5 MONTHS OF AGE
20206
PREVALENCE OF
OVERWEIGHT IN
CHILDREN (UNDER
5 YEARS OF AGE)
PREVALENCE OF
ANAEMIA AMONG
WOMEN OF
REPRODUCTIVE AGE
(15–49)
2012
2012
2015
(%)
(%)
(%)
(%)
(%)
(%)
(%)
(%)
(%)
(%)
(%)
(%)
(%)
(%)
(%)
(%)
(%)
(%)
Myanmar
27.8
7.6
n.a.
1.9
n.a.
22.2
6.7
31.9
25.2
2.2
1.5
4.6
5.8
39.4
42.1
23.6
51.2
12.5
12.3
Philippines
14.9
9.4
3.2c,d
4c,d
41.2c,d
42.7c,d
5.6
32.2
28.7
3.4
4.2
5.4
6.4
16.9
12.3
33.0
n.a.
20.4
20.1
n.a.
n.a.
1.0
0.9
2.8
4.5
n.a.
3.2
2.8
4.0
4.8
5.6
6.1
11.5
13.0
n.a.
n.a.
9.7
9.6
Thailand
11.9
8.2
4.2
8.5
15.1
29.8
7.7
13.9
12.3
8.7
9.2
7.9
10.0
22.1
24.0
12.3
23.0
10.8
10.5
Timor-Leste
32.2
22.6
n.a.
n.a.
n.a.
n.a.
n.a.
52.8
48.8
3.0
2.6
2.9
3.8
26.8
29.9
50.8
50.2
n.a.
n.a.
Viet Nam
15.5
6.7
<0.5
0.5
6.3
6.5
5.8
25.9
22.3
4.2
6.0
1.6
2.1
17.0
20.6
17.0
n.a.
8.4
8.2
Southern Asia
19.9
14.1
14.6
18.4
30.9
38.7
14.1
40.2
30.7
2.9
2.5
4.5
5.4
48.3
48.2
47.4
57.2
27.2
26.4
Afghanistan
36.1
25.6
14.8
19.8
45.1
63.1
5.1
44.7
35.1
5.3
3.9
4.4
5.5
37.5
42.6
n.a.
57.5
n.a.
n.a.
Bangladesh
14.2
9.7
13.3
10.5
32.2
31.9
9.8
38.1
30.2
1.7
2.1
2.8
3.6
35.7
36.7
64.1
65.0
29.0
27.8
n.a.
n.a.
n.a.
n.a.
n.a.
n.a.
n.a.
30.2
22.4
6.1
5.2
5.2
6.4
39.8
38.6
48.7
53.2
11.9
11.7
21.6
15.3
17.3
41.7
30.9
2.4
1.9
3.1
3.9
53.2
53.0
46.4
58.0
n.a.
n.a.
5.2
5.5
n.a.
6.1
6.3
8.4f
9.4f
23.3
25.8
22.8
24.1
53.1
n.a.
n.a.
n.a.
Singapore
| 135 |
Bhutan
India
Iran (Islamic
Republic of)
Maldives
9.5
(%)
20205
PREVALENCE OF
OBESITY IN THE
ADULT POPULATION
(18 YEARS AND
OLDER)
2004–06 2018–204 2014–16 2018–20 2014–16 2018–20
PREVALENCE OF
STUNTING IN
CHILDREN (UNDER
5 YEARS OF AGE)
PREVALENCE OF
WASTING IN
CHILDREN (UNDER
5 YEARS OF AGE)
PREVALENCE OF
MODERATE OR
SEVERE FOOD
INSECURITY
IN THE TOTAL
POPULATION1, 2, 3
PREVALENCE OF
SEVERE FOOD
INSECURITY
IN THE TOTAL
POPULATION1, 2, 3
REGIONS/
SUBREGIONS/
COUNTRIES
PREVALENCE OF
UNDERNOURISHMENT
IN THE TOTAL
POPULATION1
TABLE A1.1 (CONTINUED)
c,d
c,d
8.7
48.0
c,d
c,d
42.5
n.a.
n.a.
n.a.
n.a.
n.a.
n.a.
9.1
17.2
14.2
5.8
4.6
6.7
8.6
45.6
52.2
45.3
63.0
12.0
11.7
Nepal
16.8
4.8
10.4
12.0
29.5
36.4
12.0
40.3
30.4
1.4
1.8
3.3
4.1
35.9
35.7
69.6
65.2
22.6
21.8
Pakistan
17.6
12.9
7.1
43.4
36.7
4.6
3.4
7.1
8.6
42.7
41.3
37.0
47.5
n.a.
n.a.
Sri Lanka
14.7
6.8
15.1
16.8
16.0
1.2
1.3
4.1
5.2
33.5
34.6
75.8
82.0
16.6
15.9
Southern Asia
(excluding India)
15.4
11.0
12.4
13.4
n.a.
n.a.
n.a.
n.a.
n.a.
8.2
9.5
n.a.
n.a.
49.9
55.3
n.a.
n.a.
8.9
14.6
8.5
9.0
3.5
17.8
13.9
9.0
8.3
27.2
29.8
31.7
32.5
32.3
33.1
10.0
9.9
12.3
3.4
1.2
1.1
4.4
14.0
9.1
14.8
10.8
18.3
20.2
17.6
17.3
34.1
44.5
8.0
9.0
Azerbaijan
4.8
<2.5
<0.5
<0.5
n.a.
17.2
Bahrain
n.a.
n.a.
n.a.
6.3
Cyprus
7.6
<2.5
n.a.
n.a.
Western Asia
Armenia
c,d
38.6
39.8
27.1
27.9
17.1
12.7
5.9
8.9
c,d
16.3
f
5.1
11.1
f
n.a.
5.6
9.4
f
n.a.
17.7
19.9
34.7
35.1
10.8
n.a.
7.0
7.3
f
27.6
29.8
36.3
35.4
n.a.
n.a.
10.2
11.9
n.a.
20.4
21.8
12.0
13.6
n.a.
n.a.
n.a.
n.a.
6.4
20206
(%)
2012
20206
2012
2016
2019
20127
PREVALENCE OF
LOW BIRTHWEIGHT
2012
PREVALENCE OF
EXCLUSIVE
BREASTFEEDING
AMONG INFANTS
0–5 MONTHS OF AGE
PREVALENCE OF
ANAEMIA AMONG
WOMEN OF
REPRODUCTIVE AGE
(15–49)
PREVALENCE OF
OVERWEIGHT IN
CHILDREN (UNDER
5 YEARS OF AGE)
PREVALENCE OF
STUNTING IN
CHILDREN (UNDER
5 YEARS OF AGE)
2012
20198
2012
2015
(%)
(%)
(%)
(%)
(%)
(%)
(%)
(%)
(%)
(%)
(%)
(%)
(%)
(%)
(%)
(%)
(%)
4.1
8.7
7.0
9.5
31.8
39.7
0.6
9.2
5.7
13.7
7.6
19.3
21.7
26.9
27.5
54.8
20.4
Iraq
23.8
37.5
3.0
19.2
11.6
9.2
9.0
28.0
30.4
29.8
28.6
19.4
25.8
n.a.
n.a.
Israel
<2.5
<2.5
1.3c,d
1.9c,d
11.0c,d
13.7c,d
n.a.
n.a.
n.a.
n.a.
n.a.
24.8
26.1
11.5
12.9
n.a.
n.a.
8.0
7.8
Jordan
5.5
9.5
n.a.
7.9
7.3
5.7
7.1
33.1
35.5
30.5
37.7
22.7
25.4
13.9
13.8
Kuwait
<2.5
<2.5
n.a.
9.9
9.9
Lebanon
Georgia
(%)
20205
PREVALENCE OF
OBESITY IN THE
ADULT POPULATION
(18 YEARS AND
OLDER)
2004–06 2018–204 2014–16 2018–20 2014–16 2018–20
PREVALENCE OF
WASTING IN
CHILDREN (UNDER
5 YEARS OF AGE)
PREVALENCE OF
MODERATE OR
SEVERE FOOD
INSECURITY
IN THE TOTAL
POPULATION1, 2, 3
PREVALENCE OF
SEVERE FOOD
INSECURITY
IN THE TOTAL
POPULATION1, 2, 3
REGIONS/
SUBREGIONS/
COUNTRIES
PREVALENCE OF
UNDERNOURISHMENT
IN THE TOTAL
POPULATION1
TABLE A1.1 (CONTINUED)
4.9
4.9
12.6
12.2
2.5
4.8
6.0
7.9
7.1
35.6
37.9
21.1
23.7
n.a.
4.8
6.1
| 136 |
10.9
9.3
n.a.
12.9
10.4
19.8
19.7
29.7
32.0
25.4
28.3
n.a.
n.a.
9.3
9.2
Oman
9.6
8.2
n.a.
n.a.
n.a.
n.a.
9.3
11.3
12.2
3.0
4.8
24.3
27.0
29.0
29.1
n.a.
23.2
10.6
10.5
Palestine
n.a.
n.a.
n.a.
4.4c
n.a.
26.3c
1.3
10.3
n.a.
n.a.
30.5
31.0
28.7
38.1
8.5
n.a.
Qatar
n.a.
n.a.
n.a.
n.a.
n.a.
n.a.
n.a.
6.0
32.4
35.1
27.1
28.1
29.3
n.a.
7.5
7.3
Saudi Arabia
4.8
3.9
n.a.
5.5
3.9
6.2
7.6
32.8
35.4
25.8
27.5
n.a.
n.a.
n.a.
n.a.
Syrian Arab
Republic
n.a.
n.a.
n.a.
27.6
29.6
19.2
18.2
25.1
27.8
31.7
32.8
42.6
n.a.
n.a.
n.a.
<2.5
<2.5
1.7
n.a.g
n.a.g
n.a.g
n.a.g
29.5
32.1
n.a.
n.a.
41.6
40.7
11.6
11.4
8.8
3.7
n.a.
n.a.
n.a.
n.a.
n.a.
29.0
31.7
24.0
24.3
n.a.
n.a.
12.7
12.7
Yemen
27.8
45.4
n.a.
n.a.
n.a.
n.a.
n.a.
47.4
37.2
2.9
2.7
14.6
17.1
61.5
61.5
n.a.
n.a.
n.a.
n.a.
Central Asia and
Southern Asia
19.6
13.7
14.1
17.8
30.1
37.8
13.6
39.2
29.8
3.1
2.7
4.9
5.9
47.5
47.5
46.6
56.6
26.4
25.5
Eastern Asia and
South-eastern Asia*
9.6
2.8
1.4
2.0
8.8
10.9
4.1
16.0
13.4
6.5
7.7
5.0
6.2
18.2
19.5
30.4
29.8
8.1
8.0
Western Asia and
Northern Africa
8.6
10.9
9.1
9.1
27.8
28.9
5.1
20.3
17.8
10.5
10.8
25.3
27.7
31.8
31.8
37.4
38.7
11.2
11.1
LATIN AMERICA
AND THE
CARIBBEAN
9.3
7.7
8.1
11.3
27.9
34.8
1.3
12.8
11.3
7.3
7.5
22.2
24.2
18.2
17.2
33.4
n.a.
8.7
8.7
19.2
16.0
n.a.
37.6
n.a.
67.5
2.8
13.2
11.8
6.4
6.6
22.0
24.7
28.7
29.2
29.7
25.9
10.1
9.9
Turkey
United Arab
Emirates
Caribbean
n.a.
n.a.
n.a.
n.a.
7.8
f
4.6
8.1
f
13.1
8.5
f
13.9
f
(%)
(%)
n.a.
n.a.
n.a.
Bahamas
n.a.
n.a.
Barbados
Cuba
Dominica
Dominican Republic
| 137 |
Grenada
(%)
PREVALENCE OF
EXCLUSIVE
BREASTFEEDING
AMONG INFANTS
0–5 MONTHS OF AGE
20206
2012
20206
2012
2016
2012
2019
20127
20198
2012
2015
(%)
(%)
(%)
(%)
(%)
(%)
(%)
(%)
(%)
(%)
(%)
(%)
PREVALENCE OF
LOW BIRTHWEIGHT
2012
PREVALENCE OF
OVERWEIGHT IN
CHILDREN (UNDER
5 YEARS OF AGE)
20205
PREVALENCE OF
STUNTING IN
CHILDREN (UNDER
5 YEARS OF AGE)
PREVALENCE OF
ANAEMIA AMONG
WOMEN OF
REPRODUCTIVE AGE
(15–49)
(%)
Antigua and
Barbuda
PREVALENCE OF
OBESITY IN THE
ADULT POPULATION
(18 YEARS AND
OLDER)
2004–06 2018–204 2014–16 2018–20 2014–16 2018–20
PREVALENCE OF
WASTING IN
CHILDREN (UNDER
5 YEARS OF AGE)
PREVALENCE OF
MODERATE OR
SEVERE FOOD
INSECURITY
IN THE TOTAL
POPULATION1, 2, 3
PREVALENCE OF
SEVERE FOOD
INSECURITY
IN THE TOTAL
POPULATION1, 2, 3
REGIONS/
SUBREGIONS/
COUNTRIES
PREVALENCE OF
UNDERNOURISHMENT
IN THE TOTAL
POPULATION1
TABLE A1.1 (CONTINUED)
(%)
(%)
(%)
n.a.
n.a.
n.a.
n.a.
n.a.
n.a.
n.a.
n.a.
17.1
18.9
16.7
17.2
n.a.
n.a.
9.1
9.1
n.a.
n.a.
n.a.
n.a.
n.a.
n.a.
n.a.
n.a.
n.a.
29.5
31.6
13.3
14.5
n.a.
n.a.
13.2
13.1
6.1
4.1
n.a.
n.a.
n.a.
n.a.
n.a.
7.6
6.6
10.8
11.4
20.9
23.1
16.9
17.0
19.7
n.a.
n.a.
n.a.
<2.5
<2.5
n.a.
n.a.
n.a.
n.a.
2.0
7.1
7.0
9.2
10.0
22.6
24.6
20.2
19.3
48.6
32.8
5.2
5.3
5.4
5.6
n.a.
n.a.
n.a.
n.a.
n.a.
n.a.
n.a.
n.a.
n.a.
25.6
27.9
20.1
20.8
n.a.
n.a.
n.a.
n.a.
19.2
8.3
n.a.
8.0
5.9
7.8
7.6
24.5
27.6
28.0
26.4
8.0
4.6
11.4
11.3
n.a.
n.a.
n.a.
n.a.
n.a.
n.a.
n.a.
19.1
21.3
18.9
19.2
n.a.
n.a.
n.a.
n.a.
55.0
46.8
3.7
23.9
20.4
3.6
3.7
19.4
22.7
47.6
47.7
39.3
39.9
n.a.
n.a.
Jamaica
7.4
7.7
3.3
6.8
8.5
7.2
6.8
22.3
24.7
19.5
19.9
23.8
n.a.
14.7
14.6
Puerto Rico
n.a.
n.a.
n.a.
n.a.
n.a.
n.a.
n.a.
n.a.
n.a.
n.a.
n.a.
n.a.
n.a.
18.4
18.8
n.a.
n.a.
n.a.
n.a.
Saint Kitts and
Nevis
n.a.
n.a.
n.a.
n.a.
n.a.
n.a.
n.a.
n.a.
n.a.
n.a.
n.a.
20.4
22.9
16.0
15.4
n.a.
n.a.
n.a.
n.a.
Saint Lucia
n.a.
n.a.
4.5c
n.a.
22.2c
n.a.
n.a.
2.7
2.8
6.5
6.9
17.4
19.7
14.1
14.3
3.5
n.a.
n.a.
n.a.
Saint Vincent and
the Grenadines
7.9
5.6
n.a.
n.a.
n.a.
n.a.
n.a.
21.2
23.7
17.3
17.0
n.a.
n.a.
n.a.
n.a.
11.1
6.7
n.a.
n.a.
n.a.
n.a.
n.a.
8.5
8.7
9.5
11.0
16.3
18.6
17.8
17.7
21.5
n.a.
12.5
12.4
Haiti
Trinidad and Tobago
Central America
7.9
8.9
6.4
8.5
29.3
31.0
0.9
17.9
16.6
6.6
6.3
25.1
27.3
15.2
14.6
21.6
33.2
8.8
8.7
Belize
5.7
5.9
n.a.
n.a.
n.a.
n.a.
1.8
17.5
13.3
9.0
8.0
22.0
24.1
21.2
20.5
14.7
33.2
8.7
8.6
Costa Rica
4.4
3.1
1.8c,d
2.6c,d
12.2c,d
15.3c,d
1.8
7.0
8.6
8.3
8.1
22.9
25.7
12.3
13.7
32.5
n.a.
7.3
7.5
El Salvador
9.1
8.5
42.2
47.1
2.1
16.0
11.2
6.0
6.6
22.2
24.6
9.9
10.6
31.4
46.7
10.4
10.3
13.8
13.8
Guatemala
18.9
16.8
16.1
19.2
42.7
49.7
0.8
47.5
42.8
5.4
5.1
18.9
21.2
11.0
7.4
49.6
53.2
11.2
11.0
Honduras
22.3
13.5
14.2c,d
14.6c,d
41.6c,d
45.6c,d
n.a.
22.7
19.9
5.0
5.7
19.0
21.4
16.6
18.0
30.7
n.a.
11.0
10.9
4.4
7.2
3.6c
5.8c,d
25.6c
26.1c,d
1.4
12.7
12.1
6.7
6.3
26.8
28.9
15.9
15.3
14.4
28.6
8.0
7.9
23.3
19.3
n.a.
17.4
14.1
7.2
7.5
21.5
23.7
13.3
15.7
31.7
n.a.
10.8
10.7
Mexico
Nicaragua
(%)
(%)
21.6
7.5
South America
8.8
6.3
6.0
9.8
23.6
Argentina
3.7
3.9
5.8
12.6
19.2
26.8
12.6
Brazil
6.5
<2.5
Chile
3.1
3.4
Colombia
11.2
8.8
Ecuador
22.4
12.4
6.0
n.a.
Panama
Bolivia (Plurinational
State of)
(%)
(%)
(%)
(%)
2012
20206
20206
2012
2016
2019
20127
20198
(%)
(%)
PREVALENCE OF
LOW BIRTHWEIGHT
2012
PREVALENCE OF
EXCLUSIVE
BREASTFEEDING
AMONG INFANTS
0–5 MONTHS OF AGE
PREVALENCE OF
OVERWEIGHT IN
CHILDREN (UNDER
5 YEARS OF AGE)
2012
PREVALENCE OF
ANAEMIA AMONG
WOMEN OF
REPRODUCTIVE AGE
(15–49)
20205
PREVALENCE OF
OBESITY IN THE
ADULT POPULATION
(18 YEARS AND
OLDER)
2004–06 2018–204 2014–16 2018–20 2014–16 2018–20
PREVALENCE OF
STUNTING IN
CHILDREN (UNDER
5 YEARS OF AGE)
PREVALENCE OF
WASTING IN
CHILDREN (UNDER
5 YEARS OF AGE)
PREVALENCE OF
MODERATE OR
SEVERE FOOD
INSECURITY
IN THE TOTAL
POPULATION1, 2, 3
PREVALENCE OF
SEVERE FOOD
INSECURITY
IN THE TOTAL
POPULATION1, 2, 3
REGIONS/
SUBREGIONS/
COUNTRIES
PREVALENCE OF
UNDERNOURISHMENT
IN THE TOTAL
POPULATION1
TABLE A1.1 (CONTINUED)
2012
2015
(%)
(%)
(%)
(%)
(%)
(%)
(%)
(%)
(%)
(%)
(%)
n.a.
20.0
14.7
10.1
10.8
20.6
22.7
22.1
21.2
n.a.
n.a.
10.2
10.1
33.1
1.4a
10.2
8.6a
7.7
8.2a
21.1
23.0
18.4
17.3
41.9
n.a.
8.6
8.6
35.8
1.6
7.8
7.8
12.4
12.9
26.3
28.3
12.7
11.9
32.0
n.a.
7.1
7.3
2.0
20.3
12.7
9.0
8.8
18.3
20.2
28.6
24.4
64.3
55.7
7.3
7.2
| 138 |
1.9
3.5
18.3
23.5
n.a.
6.3
6.1
6.9
7.3
20.1
22.1
18.3
16.1
38.6
n.a.
8.4
8.4
2.9c,d
4.3c,d
10.8c,d
17.9c,d
0.3
1.9
1.6
10.4
9.8
26.1
28.0
7.9
8.7
n.a.
n.a.
6.0
6.2
1.6
12.9
11.5
5.2
5.8
20.4
22.3
22.1
21.2
n.a.
36.7
10.0
10.0
20.7
32.7
3.7
24.1
23.1
7.3
9.8
18.1
19.9
17.3
17.2
n.a.
n.a.
11.3
11.2
6.4
14.4
9.0
5.9
6.6
17.9
20.2
34.4
31.7
31.3
21.1
15.8
15.6
1.0
9.6
4.6
10.1
12.0
18.2
20.3
22.2
23.0
24.4
29.6
8.2
8.1
c,d
11.6
c,d
n.a.
c,d
Guyana
7.1
5.2
Paraguay
9.5
9.2
18.8
8.7
13.5
19.2
37.2
47.8
0.4
18.8
10.8
8.7
8.0
18.1
19.7
20.6
20.6
67.4
66.4
9.5
9.4
Suriname
9.7
8.7
n.a.
n.a.
n.a.
n.a.
5.5
8.7
8.0
3.8
4.0
24.4
26.4
20.3
21.0
2.8
n.a.
14.9
14.7
Uruguay
3.9
<2.5
6.8
6.7
21.6
23.5
1.4
8.9
6.5
9.8
10.3
26.0
27.9
13.2
15.0
n.a.
n.a.
7.9
7.6
Venezuela (Bolivarian
Republic of)
8.4
27.4
n.a.
12.5
10.6
6.4
6.7
24.0
25.6
20.9
24.2
n.a.
n.a.
8.6
9.1
OCEANIA
6.7
6.2
2.8
3.4
11.1
12.9
n.a.
n.a.
n.a.
n.a.
n.a.
25.8
28.1
14.4
16.0
n.a.
n.a.
7.8
7.9
Australia and New
Zealand
<2.5
<2.5
2.8
3.4
10.6
12.6
n.a.
2.4
2.3a
12.9
16.9
27.0
29.3
7.6
8.8
n.a.
n.a.
6.2
6.4
Australia
<2.5
<2.5
2.8
3.3
10.8
12.3
n.a.
2.1
2.1
14.2
18.5
26.7
29.0
7.4
8.5
n.a.
n.a.
6.3
6.5
New Zealand
<2.5
<2.5
2.8
3.9
10.0
14.0
n.a.
n.a.
n.a.
n.a.
n.a.
28.4
30.8
8.8
10.4
n.a.
n.a.
5.9
5.7
Oceania excluding
Australia and New
Zealand
20.9
20.0
n.a.
n.a.
n.a.
n.a.
9.0
40.3
41.4
7.3
8.0
21.3
23.6
32.9
33.9
56.9
61.3
10.0
9.9
Melanesia
23.2
21.7
n.a.
n.a.
n.a.
n.a.
n.a.
42.7
43.6
7.4
8.2
20.1
22.3
33.3
34.2
56.9
61.1
10.1
9.9
Peru
n.a.
c,d
n.a.
(%)
2012
20206
2012
20206
(%)
2012
2016
PREVALENCE OF
LOW BIRTHWEIGHT
2012
PREVALENCE OF
EXCLUSIVE
BREASTFEEDING
AMONG INFANTS
0–5 MONTHS OF AGE
PREVALENCE OF
ANAEMIA AMONG
WOMEN OF
REPRODUCTIVE AGE
(15–49)
PREVALENCE OF
OVERWEIGHT IN
CHILDREN (UNDER
5 YEARS OF AGE)
20205
PREVALENCE OF
OBESITY IN THE
ADULT POPULATION
(18 YEARS AND
OLDER)
2004–06 2018–204 2014–16 2018–20 2014–16 2018–20
PREVALENCE OF
STUNTING IN
CHILDREN (UNDER
5 YEARS OF AGE)
PREVALENCE OF
WASTING IN
CHILDREN (UNDER
5 YEARS OF AGE)
PREVALENCE OF
MODERATE OR
SEVERE FOOD
INSECURITY
IN THE TOTAL
POPULATION1, 2, 3
PREVALENCE OF
SEVERE FOOD
INSECURITY
IN THE TOTAL
POPULATION1, 2, 3
REGIONS/
SUBREGIONS/
COUNTRIES
PREVALENCE OF
UNDERNOURISHMENT
IN THE TOTAL
POPULATION1
TABLE A1.1 (CONTINUED)
2019
20127
20198
2012
2015
(%)
(%)
(%)
(%)
| 139 |
(%)
(%)
(%)
(%)
(%)
(%)
(%)
(%)
(%)
(%)
(%)
(%)
(%)
Fiji
3.7
5.6
n.a.
2.0c
n.a.
14.3c
n.a.
8.5
7.5
4.8
5.2
27.7
30.2
31.5
32.0
n.a.
n.a.
n.a.
n.a.
New Caledonia
9.6
6.9
n.a.
n.a.
n.a.
n.a.
n.a.
n.a.
n.a.
n.a.
n.a.
n.a.
n.a.
n.a.
n.a.
n.a.
n.a.
n.a.
n.a.
Papua New Guinea
27.4
24.6
n.a.
n.a.
n.a.
n.a.
n.a.
47.2
48.4
8.1
8.9
19.0
21.3
33.4
34.4
56.1
59.7
n.a.
n.a.
Solomon Islands
12.5
16.5
n.a.
n.a.
n.a.
n.a.
8.5
31.9
29.3
3.5
4.0
19.9
22.5
38.4
37.7
73.7
76.2
n.a.
n.a.
Vanuatu
6.3
9.3
n.a.
2.4
c
n.a.
23.3
c
n.a.
27.3
28.7
4.8
4.9
22.6
25.2
24.1
28.5
39.5
n.a.
11.0
10.9
Micronesia
n.a.
n.a.
n.a.
n.a.
n.a.
n.a.
n.a.
16.5
15.2
4.5
4.8
43.2
45.9
27.9
29.1
66.4
n.a.
9.4
9.3
Kiribati
5.3
4.1
n.a.
7.9
c
n.a.
40.9
c
3.5
15.8
14.9
2.4
2.4
43.5
46.0
31.8
32.6
66.4
n.a.
n.a.
n.a.
Marshall Islands
n.a.
n.a.
n.a.
n.a.
n.a.
n.a.
3.5
36.2
32.2
4.1
4.2
50.7
52.9
29.7
30.6
27.3
43.1
n.a.
n.a.
Micronesia
(Federated States of)
n.a.
n.a.
n.a.
n.a.
n.a.
n.a.
n.a.
n.a.
n.a.
n.a.
n.a.
42.9
45.8
22.7
25.0
n.a.
n.a.
n.a.
n.a.
Nauru
n.a.
n.a.
n.a.
n.a.
n.a.
n.a.
n.a.
20.3
15.0
3.1
3.7
59.6
61.0
29.5
29.6
67.2
n.a.
n.a.
n.a.
Palau
n.a.
n.a.
n.a.
n.a.
n.a.
n.a.
n.a.
n.a.
n.a.
n.a.
n.a.
53.1
55.3
27.3
28.5
n.a.
n.a.
n.a.
n.a.
Polynesia
3.6
4.1
n.a.
n.a.
n.a.
n.a.
n.a.
7.5
6.7
8.3
8.4
44.9
47.6
25.6
27.4
51.6
70.3
8.1
8.1
American Samoa
n.a.
n.a.
n.a.
n.a.
n.a.
n.a.
n.a.
n.a.
n.a.
n.a.
n.a.
n.a.
n.a.
n.a.
n.a.
n.a.
n.a.
n.a.
n.a.
Cook Islands
n.a.
n.a.
n.a.
n.a.
n.a.
n.a.
n.a.
n.a.
n.a.
n.a.
n.a.
53.8
55.9
25.8
27.1
n.a.
n.a.
3.5
3.5
French Polynesia
3.8
3.8
n.a.
n.a.
n.a.
n.a.
n.a.
n.a.
n.a.
n.a.
n.a.
n.a.
n.a.
n.a.
n.a.
n.a.
n.a.
n.a.
n.a.
Niue
n.a.
n.a.
n.a.
n.a.
n.a.
n.a.
n.a.
n.a.
n.a.
n.a.
n.a.
46.8
50.0
25.9
27.3
n.a.
n.a.
n.a.
n.a.
Samoa
3.4
4.6
n.a.
3.4
c
n.a.
23.6
3.1
5.7
6.8
6.7
7.1
44.7
47.3
24.5
26.8
51.3
70.3
n.a.
n.a.
Tokelau (Associate
Member)
n.a.
n.a.
n.a.
n.a.
n.a.
n.a.
n.a.
n.a.
n.a.
n.a.
n.a.
n.a.
n.a.
n.a.
n.a.
n.a.
n.a.
n.a.
n.a.
Tonga
n.a.
n.a.
n.a.
6.0c
n.a.
23.2c
1.1
6.7
2.6
13.2
12.6
45.4
48.2
27.2
28.5
52.2
n.a.
n.a.
n.a.
Tuvalu
n.a.
n.a.
n.a.
n.a.
n.a.
n.a.
n.a.
10.0
9.7
6.2
6.4
48.6
51.6
26.0
27.5
34.7
n.a.
n.a.
n.a.
NORTHERN
AMERICA AND
EUROPE
<2.5
<2.5
1.3
1.1
9.1
8.0
n.a.
4.4a
4.0a
9.3a
8.6a
25.0
26.9
13.1
14.6
n.a.
n.a.
7.0
7.0
Northern America**
<2.5
<2.5
1.0
0.8
9.9
7.8
0.2
2.8
3.2
8.8
9.1
32.9
35.5
9.9
11.7
25.5
34.7
7.9
7.9
c
(%)
(%)
n.a.
n.a.
n.a.
<2.5
<2.5
n.a.
United States of
America
PREVALENCE OF
EXCLUSIVE
BREASTFEEDING
AMONG INFANTS
0–5 MONTHS OF AGE
2012
20206
2012
2016
2012
2019
20127
20198
2012
2015
(%)
(%)
(%)
(%)
(%)
(%)
(%)
(%)
(%)
(%)
(%)
(%)
PREVALENCE OF
LOW BIRTHWEIGHT
20206
PREVALENCE OF
OVERWEIGHT IN
CHILDREN (UNDER
5 YEARS OF AGE)
2012
PREVALENCE OF
STUNTING IN
CHILDREN (UNDER
5 YEARS OF AGE)
20205
(%)
(%)
(%)
n.a.
n.a.
n.a.
n.a.
n.a.
n.a.
n.a.
n.a.
n.a.
n.a.
n.a.
n.a.
n.a.
n.a.
n.a.
n.a.
0.6c
0.9c
5.0c
5.8c
n.a.
n.a.
n.a.
11.2
11.8
27.1
29.4
8.8
10.4
n.a.
n.a.
6.2
6.4
n.a.
n.a.
n.a.
n.a.
n.a.
n.a.
n.a.
n.a.
n.a.
n.a.
n.a.
n.a.
n.a.
n.a.
n.a.
n.a.
n.a.
n.a.
<2.5
<2.5
1.1c
0.8c
10.5c
8.0c
0.1
2.7
3.2
8.6
8.8
33.6
36.2
10.0
11.8
25.5
34.7
8.1
8.0
Europe
<2.5
<2.5
1.5
1.3
8.7
8.1
n.a.
5.3a
4.5a
9.6a
8.3a
21.4
22.9
14.5
16.0
n.a.
n.a.
6.6
6.5
Eastern Europe
<2.5
<2.5
1.5
1.5
11.2
11.4
n.a.
7.9a
6.6a
13.5a
9.9a
22.0
23.4
19.2
20.5
n.a.
n.a.
6.2
6.1
Belarus
<2.5
<2.5
n.a.
4.0
3.9
9.2
6.8
23.0
24.5
19.1
20.6
19.0
n.a.
4.9
5.1
Bermuda
Canada
Greenland
(%)
PREVALENCE OF
ANAEMIA AMONG
WOMEN OF
REPRODUCTIVE AGE
(15–49)
(%)
PREVALENCE OF
OBESITY IN THE
ADULT POPULATION
(18 YEARS AND
OLDER)
2004–06 2018–204 2014–16 2018–20 2014–16 2018–20
PREVALENCE OF
WASTING IN
CHILDREN (UNDER
5 YEARS OF AGE)
PREVALENCE OF
MODERATE OR
SEVERE FOOD
INSECURITY
IN THE TOTAL
POPULATION1, 2, 3
PREVALENCE OF
SEVERE FOOD
INSECURITY
IN THE TOTAL
POPULATION1, 2, 3
REGIONS/
SUBREGIONS/
COUNTRIES
PREVALENCE OF
UNDERNOURISHMENT
IN THE TOTAL
POPULATION1
TABLE A1.1 (CONTINUED)
| 140 |
Bulgaria
4.9
3.0
1.9
2.4
14.9
13.2
6.3
7.5
6.4
8.2
5.7
23.2
25.0
22.5
23.6
n.a.
n.a.
9.4
9.6
Czechia
<2.5
<2.5
0.7
0.8
5.8
4.2
n.a.
2.4
2.5
5.9
6.6
24.5
26.0
20.0
21.1
n.a.
n.a.
7.9
7.8
Hungary
<2.5
<2.5
1.4
1.4
11.3
8.6
n.a.
n.a.
n.a.
n.a.
n.a.
24.5
26.4
19.6
19.7
n.a.
n.a.
8.6
8.8
Poland
<2.5
<2.5
1.8
<0.5
8.9
5.8
n.a.
2.3
2.3
5.9
6.7
21.5
23.1
n.a.
n.a.
n.a.
n.a.
5.7
5.9
n.a.
n.a.
1.6
4.5
19.3
27.2
n.a.
7.1
4.9
6.2
4.3
17.5
18.9
26.0
26.1
36.4
n.a.
5.0
5.0
Romania
<2.5
<2.5
5.6
3.4
19.3
13.9
n.a.
10.6
9.7
9.5
6.7
20.7
22.5
22.1
22.7
n.a.
n.a.
8.3
8.2
Russian Federation
<2.5
<2.5
0.7
<0.5c
8.2
6.0c
n.a.
n.a.
n.a.
n.a.
n.a.
21.9
23.1
20.0
21.1
n.a.
n.a.
6.0
5.8
Slovakia
5.5
4.0
1.1
1.1
6.2
6.0
n.a.
n.a.
n.a.
n.a.
n.a.
19.1
20.5
22.3
23.5
n.a.
n.a.
8.0
7.6
Ukraine
<2.5
<2.5
2.0
2.5
n.a.
19.1
15.9
25.7
17.0
22.7
24.1
14.4
17.7
19.7
n.a.
5.4
5.6
Republic of
Moldova
Northern Europe
<2.5
<2.5
1.8
1.1
6.7
4.9
n.a.
3.4
2.9
7.5
8.3
23.7
25.8
10.6
12.0
n.a.
n.a.
6.1
6.0
Denmark
<2.5
<2.5
1.0
1.1
5.9
5.0
n.a.
n.a.
n.a.
n.a.
n.a.
18.1
19.7
11.5
12.2
n.a.
n.a.
5.3
5.3
Estonia
<2.5
<2.5
0.9
0.8
9.5
7.9
1.5
1.3
1.2
5.1
5.7
20.1
21.2
20.7
21.7
n.a.
n.a.
4.4
4.3
Finland
<2.5
<2.5
2.4
1.9
9.3
8.0
n.a.
n.a.
n.a.
n.a.
n.a.
20.7
22.2
9.7
10.9
n.a.
n.a.
4.2
4.1
Iceland
<2.5
<2.5
1.7
1.5
6.4
6.6
n.a.
n.a.
n.a.
n.a.
n.a.
20.3
21.9
9.4
10.3
n.a.
n.a.
3.9
4.2
Ireland
<2.5
<2.5
3.4
4.3
8.9
8.3
n.a.
n.a.
n.a.
n.a.
n.a.
22.8
25.3
10.9
12.1
n.a.
n.a.
5.3
5.9
Latvia
<2.5
<2.5
0.6
0.7
9.9
10.2
n.a.
n.a.
n.a.
n.a.
n.a.
22.4
23.6
20.9
21.6
n.a.
n.a.
4.5
4.5
a
a
a
a
(%)
2012
20206
2012
20206
(%)
(%)
(%)
2012
2016
PREVALENCE OF
LOW BIRTHWEIGHT
2012
PREVALENCE OF
EXCLUSIVE
BREASTFEEDING
AMONG INFANTS
0–5 MONTHS OF AGE
PREVALENCE OF
ANAEMIA AMONG
WOMEN OF
REPRODUCTIVE AGE
(15–49)
PREVALENCE OF
OVERWEIGHT IN
CHILDREN (UNDER
5 YEARS OF AGE)
20205
PREVALENCE OF
OBESITY IN THE
ADULT POPULATION
(18 YEARS AND
OLDER)
2004–06 2018–204 2014–16 2018–20 2014–16 2018–20
PREVALENCE OF
STUNTING IN
CHILDREN (UNDER
5 YEARS OF AGE)
PREVALENCE OF
WASTING IN
CHILDREN (UNDER
5 YEARS OF AGE)
PREVALENCE OF
MODERATE OR
SEVERE FOOD
INSECURITY
IN THE TOTAL
POPULATION1, 2, 3
PREVALENCE OF
SEVERE FOOD
INSECURITY
IN THE TOTAL
POPULATION1, 2, 3
REGIONS/
SUBREGIONS/
COUNTRIES
PREVALENCE OF
UNDERNOURISHMENT
IN THE TOTAL
POPULATION1
TABLE A1.1 (CONTINUED)
2019
20127
20198
2012
2015
(%)
(%)
(%)
(%)
| 141 |
(%)
(%)
(%)
(%)
(%)
(%)
(%)
(%)
(%)
(%)
(%)
Lithuania
<2.5
<2.5
2.5
1.7
15.3
11.3
n.a.
n.a.
n.a.
n.a.
n.a.
25.0
26.3
18.8
19.9
n.a.
n.a.
4.5
4.5
Norway
<2.5
<2.5
1.1
1.0
4.8
4.1
n.a.
n.a.
n.a.
n.a.
n.a.
21.3
23.1
10.7
12.0
n.a.
n.a.
4.7
4.5
Sweden
<2.5
<2.5
0.8
1.2
4.5
5.3
n.a.
n.a.
n.a.
n.a.
n.a.
19.0
20.6
11.7
13.6
n.a.
n.a.
3.8
2.4
United Kingdom of
Great Britain and
Northern Ireland
<2.5
<2.5
1.9
0.7
6.3
3.9
n.a.
n.a.
n.a.
n.a.
n.a.
25.4
27.8
9.4
11.1
n.a.
n.a.
6.9
7.0
Southern Europe
<2.5
<2.5
1.7
1.9
9.9
9.0
n.a.
4.5a
4.0a
8.1a
8.0a
20.4
21.8
13.5
15.1
n.a.
n.a.
7.2
7.3
Albania
8.9
3.9
10.0
8.8
38.8
33.8
1.6
17.6
9.6
21.7
14.6
19.3
21.7
21.6
24.8
37.1
36.5
4.6
4.6
Andorra
n.a.
n.a.
n.a.
n.a.
n.a.
n.a.
n.a.
n.a.
n.a.
n.a.
n.a.
24.8
25.6
10.6
12.1
n.a.
n.a.
7.5
7.4
Bosnia and
Herzegovina
<2.5
<2.5
1.5
2.0
9.6
10.0
n.a.
9.3
9.1
18.9
12.8
16.3
17.9
23.8
24.4
18.2
n.a.
3.4
3.4
Croatia
<2.5
<2.5
0.6
1.3
6.5
11.0
n.a.
n.a.
n.a.
n.a.
n.a.
22.5
24.4
20.4
21.0
n.a.
n.a.
4.8
5.1
Greece
<2.5
<2.5
2.6
1.7
15.8
8.6
n.a.
2.1
2.2
14.2
13.9
23.2
24.9
12.8
15.1
n.a.
n.a.
8.7
8.7
Italy
<2.5
<2.5
1.2
1.2
8.6
6.7
n.a.
n.a.
n.a.
n.a.
n.a.
18.7
19.9
11.8
13.6
n.a.
n.a.
7.0
7.0
Malta
c,e
c,e
<2.5
<2.5
1.5
0.9
5.9
4.3
n.a.
n.a.
n.a.
n.a.
n.a.
27.5
28.9
12.3
13.7
n.a.
n.a.
7.0
6.3
Montenegro
5.5
<2.5
2.1
2.8
12.6
13.5
2.2
8.2
8.1
15.3
10.2
21.6
23.3
16.1
17.2
19.3
n.a.
5.2
5.5
North Macedonia
5.0
2.7
3.6
5.0
15.1
17.7
3.4
5.8
4.1
13.4
10.0
20.8
22.4
17.2
19.3
23.0
n.a.
8.8
9.1
Portugal
<2.5
<2.5
4.1
3.2
14.7
11.5
0.6
3.8
3.3
7.6
8.5
19.0
20.8
12.0
13.2
n.a.
n.a.
8.5
8.9
Serbia
<2.5
3.9
1.7
2.6
11.4
12.0
2.6
6.2
5.3
15.5
10.8
20.0
21.5
21.8
22.8
13.4
12.8
4.6
4.5
Slovenia
<2.5
<2.5
0.9
<0.5
12.3
8.2
n.a.
n.a.
n.a.
n.a.
n.a.
18.8
20.2
20.2
21.8
n.a.
n.a.
6.2
6.1
Spain
<2.5
<2.5
1.1
1.8
7.1
8.8
n.a.
n.a.
n.a.
n.a.
n.a.
22.4
23.8
12.0
13.4
n.a.
n.a.
8.2
8.3
Western Europe
<2.5
<2.5
1.3
0.8
5.2
4.2
n.a.
2.6
2.3
5.4
a
6.0
20.1
21.7
9.6
11.6
n.a.
n.a.
7.0
6.9
Austria
<2.5
<2.5
1.1
0.9
5.5
3.0
n.a.
n.a.
n.a.
n.a.
n.a.
18.4
20.1
11.5
13.0
n.a.
n.a.
6.9
6.5
Belgium
<2.5
<2.5
n.a.
1.1
n.a.
3.7
0.4
2.7
2.3
4.5
5.1
20.7
22.1
11.3
13.6
n.a.
n.a.
6.9
7.3
France
<2.5
<2.5
1.6
0.7
6.8
5.8
n.a.
n.a.
n.a.
n.a.
n.a.
20.1
21.6
8.8
10.6
n.a.
n.a.
7.4
7.4
a
a
a
(%)
(%)
Germany
<2.5
<2.5
1.0
Luxembourg
<2.5
<2.5
1.8
Netherlands
<2.5
<2.5
Switzerland
<2.5
<2.5
| 142 |
NOTES:
1
Regional estimates were included when more than
50 percent of population was covered. To reduce
the margin of error, estimates are presented as
three-year averages.
2
FAO estimates of the percentage of people in the
total population living in households where at least
one adult has been found to be food insecure.
3
Country-level results are presented only for those
countries for which estimates are based on official
national data (see note c) or as provisional estimates,
based on FAO data collected through the Gallup ©
World Poll, for countries whose national relevant
authorities expressed no objection to their
publication. Note that consent to publication does
not necessarily imply validation of the estimate by
the national authorities involved and that the
estimate is subject to revision as soon as suitable
data from official national sources are available.
Global, regional and subregional aggregates are
based on data collected in approximately
150 countries.
(%)
PREVALENCE OF
EXCLUSIVE
BREASTFEEDING
AMONG INFANTS
0–5 MONTHS OF AGE
20206
2012
20206
2012
2016
2012
2019
20127
20198
2012
2015
(%)
(%)
(%)
(%)
(%)
(%)
(%)
(%)
(%)
(%)
(%)
PREVALENCE OF
LOW BIRTHWEIGHT
2012
PREVALENCE OF
OVERWEIGHT IN
CHILDREN (UNDER
5 YEARS OF AGE)
20205
PREVALENCE OF
STUNTING IN
CHILDREN (UNDER
5 YEARS OF AGE)
PREVALENCE OF
ANAEMIA AMONG
WOMEN OF
REPRODUCTIVE AGE
(15–49)
(%)
PREVALENCE OF
OBESITY IN THE
ADULT POPULATION
(18 YEARS AND
OLDER)
2004–06 2018–204 2014–16 2018–20 2014–16 2018–20
PREVALENCE OF
WASTING IN
CHILDREN (UNDER
5 YEARS OF AGE)
PREVALENCE OF
MODERATE OR
SEVERE FOOD
INSECURITY
IN THE TOTAL
POPULATION1, 2, 3
PREVALENCE OF
SEVERE FOOD
INSECURITY
IN THE TOTAL
POPULATION1, 2, 3
REGIONS/
SUBREGIONS/
COUNTRIES
PREVALENCE OF
UNDERNOURISHMENT
IN THE TOTAL
POPULATION1
TABLE A1.1 (CONTINUED)
(%)
(%)
(%)
(%)
0.7
4.1
3.4
0.3
1.5
1.6
3.7
4.1
20.7
22.3
9.6
11.7
n.a.
n.a.
6.8
6.6
0.8
4.7
3.1
n.a.
n.a.
n.a.
n.a.
n.a.
20.9
22.6
9.0
10.2
n.a.
n.a.
6.8
6.5
1.5
1.4
5.7
4.7
n.a.
1.5
1.6
4.1
5.0
18.6
20.4
10.9
12.8
n.a.
n.a.
6.2
6.2
1.5
<0.5
4.8
2.0
n.a.
n.a.
n.a.
n.a.
n.a.
18.0
19.5
9.6
11.3
n.a.
n.a.
6.5
6.5
4
The estimates for the year 2020 are the middle of
the projected range.
5
For regional estimates, values correspond to the
model predicted estimates for the year 2020. For
countries, the latest data available from 2014 to
2020 are used.
6
The collection of household survey data on child
height and weight were limited in 2020 due to the
physical distancing measures required to prevent the
spread of COVID-19. Only four national surveys
included in the database were carried out (at least
partially) in 2020. The estimates on child stunting,
wasting and overweight are therefore based almost
entirely on data collected before 2020 and do not
take into account the impact of the COVID-19
pandemic.
7
Regional estimates are included when more than
50 percent of population is covered. For countries,
the latest data available from 2005 to 2012 are used.
8
Regional estimates are included when more than
50 percent of population is covered. For countries,
the latest data available from 2014 to 2019 are used
with the exception of China where the latest data are
from the year 2013.
* Wasting under 5 years of age and low birthweight
regional aggregates exclude Japan.
** The Northern America wasting estimates are
derived applying mixed-effect models with
subregions as fixed effects; data were available only
for the United States of America, preventing the
estimation of standard errors (and confidence
intervals). Further details on the methodology are
described in De Onis, M., Blössner, M., Borghi, E.,
Frongillo, E.A. & Morris, R. 2004. Estimates of global
prevalence of childhood underweight in 1990 and
2015. Journal of the American Medical Association,
291(21): 2600–2606. Model selection is based on
best fit.
a
Consecutive low population coverage; interpret
with caution.
b
The Central Agency for Public Mobilization &
Statistics (CAPMAS) reports an estimate of severe
food insecurity of 1.3 percent for 2015, based on
HIECS data, using the WFP consolidated approach
for reporting indicators of food security. Note that
the two estimates are not directly comparable due to
different definitions of "severe food insecurity".
c
Based on official national data.
d
For years when official national data are not
available, the estimates are projected using FAO
data. See Annex 1B for further details.
e
Based on official national data collected in 2019
and 2020 through EU-SILC.
f
Most recent input data are from before 2000,
interpret with caution.
g
Pending review.
h
2020 estimate only.
<2.5 = prevalence of undernourishment less than
2.5 percent; <0.5 = prevalence of severe food
insecurity less than 0.5 percent.
n.a. = data not available.
2004–06 2018–204 2014–16 2018–20 2014–16 2018–20
20206
2012
20206
(millions)
(millions)
(millions)
(millions)
(millions)
2012
2016
2012
2019
20127
NUMBER OF BABIES
WITH LOW
BIRTHWEIGHT
2012
2015
| 143 |
(millions)
WORLD
804.0
683.9
607.7
813.0
1 696.1
2 132.3
45.4
173.7
149.2
37.0
38.9
574.3
675.7
519.5
570.8
49.9
59.8
20.9
20.5
Least developed
countries
212.1
227.0
192.7
230.2
469.5
556.2
10.9
51.8
50.2
4.2
5.0
22.5
30.8
83.6
101.4
12.7
16.9
4.9
4.9
Landlocked
developing
countries
100.3
91.4
77.5
102.7
210.9
267.2
4.2
24.4
22.7
2.9
2.9
19.3
24.5
34.3
42.4
6.4
8.3
2.2
2.2
10.7
10.4
n.a.
n.a.
n.a.
n.a.
0.3
1.3
1.3
0.4
0.4
8.1
9.5
4.6
4.9
0.4
0.5
0.1
0.1
Low-income
economies
150.6
193.6
151.9
188.1
354.0
427.0
7.3
36.7
36.5
3.6
3.9
17.6
22.9
50.3
6.2
8.3
11.8
2.8
3.3
Lower-middleincome economies
434.5
379.4
334.1
465.1
842.4
1 108.6
30.1
108.2
88.5
11.9
12.1
105.4
133.5
294.1
32.6
24.0
30.9
12.9
13.0
Upper-middleincome economies
206.5
99.8
101.6
140.3
398.7
504.7
4.3
25.7
21.6
16.3
17.5
232.4
277.2
138.8
14.4
12.9
11.8
3.2
3.2
n.r.
n.r.
19.8
19.0
99.9
90.7
0.2a
Low-income fooddeficit countries
481.9
472.2
412.2
533.7
881.3
1 146.5
<0.1
108.8
AFRICA
198.4
248.0
219.8
298.7
576.7
726.4
12.1
15.5
16.0
22.1
22.2
64.3
72.6
1.9
Algeria
2.2
n.r.
5.2
3.0
9.1
7.6
Egypt
4.9
5.4
7.8
6.8
25.7
0.7
1.3
1.9
Northern Africa
b
Libya
n.a.
n.a.
Morocco
1.7
1.5
Sudan
5.8
5.3
5.2c,d
7.2c,d
Tunisia
0.4
0.3
1.0
1.2
b
2.2a
(millions)
20198
(millions)
2.5a
(millions) (millions) (millions) (millions)
NUMBER OF
INFANTS 0–5
MONTHS OF AGE
EXCLUSIVELY
BREASTFED
NUMBER OF
WOMEN OF
REPRODUCTIVE AGE
(15–49) AFFECTED
BY ANAEMIA
NUMBER OF ADULTS
(18 YEARS AND
OLDER) WHO ARE
OBESE
NUMBER OF
CHILDREN (UNDER
5 YEARS OF AGE)
WHO ARE
OVERWEIGHT
NUMBER OF
CHILDREN (UNDER
5 YEARS OF AGE)
WHO ARE STUNTED
2012
(millions)
High-income
economies
(millions)
20205
(millions)
Small island
developing states
(millions)
NUMBER OF
CHILDREN (UNDER
5 YEARS OF AGE)
AFFECTED BY
WASTING
NUMBER OF
MODERATELY OR
SEVERELY FOOD
INSECURE
PEOPLE 1, 2, 3
NUMBER OF
SEVERELY FOOD
INSECURE
PEOPLE 1, 2, 3
REGIONS/
SUBREGIONS/
COUNTRIES
NUMBER OF
UNDERNOURISHED
PEOPLE 1
TABLE A1.2 PROGRESS TOWARDS THE SUSTAINABLE DEVELOPMENT GOALS (SDGs) AND GLOBAL NUTRITION TARGETS: NUMBER OF PEOPLE WHO ARE AFFECTED BY
UNDERNOURISHMENT, MODERATE OR SEVERE FOOD INSECURITY AND SELECTED FORMS OF MALNUTRITION; NUMBER OF INFANTS EXCLUSIVELY BREASTFED AND
NUMBER OF BABIES BORN WITH LOW BIRTHWEIGHT
(millions) (millions) (millions)
5.0a
5.1a
206.6
231.4
36.3
3.9
n.a.
n.a.
1.0
1.0
89.0
8.9
8.9
59.9
79.6
n.a.
n.a.
24.8
33.0
14.9
14.5
60.2
61.4
8.7
10.6
65.5
81.5
103.1
122.7
13.1
17.7
5.6
5.7
5.8
6.2
3.1
3.8
30.2
35.7
17.6
18.9
2.3
2.4
0.7
0.7
0.1
0.5
0.5
0.6
0.6
6.2
7.4
3.4
3.6
0.2
n.a.
<0.1
<0.1
27.9
1.1
2.4
2.8
1.7
2.3
15.6
18.4
6.9
7.0
1.3
1.0
n.a.
n.a.
2.5
0.1
0.2
0.3
0.2
0.2
1.2
1.4
0.5
0.6
n.a.
n.a.
n.a.
n.a.
10.2c,d
0.1
0.5
0.4
0.4
0.4
5.2
6.2
2.7
2.9
0.2
0.2
0.1
0.1
16.1c,d
21.2c,d
1.0
2.0
2.1
0.1
0.2
<0.1
<0.1
3.1
3.8
0.5
0.7
n.a.
n.a.
2.0
2.9
<0.1
0.1
0.1
0.1
0.2
1.9
2.2
0.9
1.0
<0.1
<0.1
<0.1
<0.1
2004–06 2018–204 2014–16 2018–20 2014–16 2018–20
Northern Africa
(excluding Sudan)
(millions)
(millions)
(millions)
(millions)
(millions)
9.6
10.7
16.9
15.0
48.2
(millions)
20205
2012
20206
2012
20206
(millions)
(millions)
(millions)
(millions)
(millions)
51.5
n.a.
n.a.
n.a.
n.a.
2012
2016
2012
2019
(millions) (millions) (millions) (millions)
n.a.
30.2
35.7
20127
(millions)
20198
NUMBER OF BABIES
WITH LOW
BIRTHWEIGHT
NUMBER OF
INFANTS 0–5
MONTHS OF AGE
EXCLUSIVELY
BREASTFED
NUMBER OF
WOMEN OF
REPRODUCTIVE AGE
(15–49) AFFECTED
BY ANAEMIA
NUMBER OF ADULTS
(18 YEARS AND
OLDER) WHO ARE
OBESE
NUMBER OF
CHILDREN (UNDER
5 YEARS OF AGE)
WHO ARE
OVERWEIGHT
NUMBER OF
CHILDREN (UNDER
5 YEARS OF AGE)
WHO ARE STUNTED
NUMBER OF
CHILDREN (UNDER
5 YEARS OF AGE)
AFFECTED BY
WASTING
NUMBER OF
MODERATELY OR
SEVERELY FOOD
INSECURE
PEOPLE 1, 2, 3
NUMBER OF
SEVERELY FOOD
INSECURE
PEOPLE 1, 2, 3
REGIONS/
SUBREGIONS/
COUNTRIES
NUMBER OF
UNDERNOURISHED
PEOPLE 1
TABLE A1.2 (CONTINUED)
2012
2015
(millions) (millions) (millions)
n.a.
n.a.
1.8
1.6
0.5
0.5
| 144 |
Sub-Saharan Africa
182.8
232.0
197.7
276.6
512.4
653.8
10.1
54.3
55.2
5.6
6.8
35.3
45.9
85.4
103.8
10.9
15.3
4.9
5.0
Eastern Africa
101.0
115.3
95.7
115.5
231.3
275.5
3.5
23.4
22.1
2.4
2.7
9.3
12.7
26.5
33.8
6.1
8.4
1.9
1.9
Burundi
n.a.
n.a.
0.1
1.0
1.2
<0.1
0.1
0.2
0.3
0.7
1.0
0.3
0.3
<0.1
<0.1
Comoros
n.a.
n.a.
n.a.
n.a.
n.a.
n.a.
n.a.
<0.1
<0.1
<0.1
<0.1
<0.1
<0.1
0.1
0.1
<0.1
n.a.
<0.1
<0.1
Djibouti
0.2
0.2
n.a.
n.a.
n.a.
n.a.
n.a.
<0.1
<0.1
<0.1
<0.1
0.1
0.1
0.1
0.1
<0.1
n.a.
n.a.
n.a.
Eritrea
n.a.
n.a.
n.a.
n.a.
n.a.
n.a.
n.a.
0.3
0.2
<0.1
<0.1
0.1
0.1
0.3
0.3
0.1
n.a.
n.a.
n.a.
Ethiopia
28.3
18.2
14.7
18.4
56.7
63.2
1.2
6.3
5.9
0.4
0.4
1.6
2.4
4.8
6.6
1.6
2.0
n.a.
n.a.
Kenya
10.4
13.0
8.3
13.5
25.4
36.0
0.3
2.0
1.4
0.3
0.3
1.3
1.8
3.1
3.9
0.5
0.9
0.2
0.2
Madagascar
6.1
11.7
n.a.
n.a.
n.a.
n.a.
0.3
1.7
1.7
0.1
0.1
0.5
0.7
2.0
2.5
0.3
0.4
0.1
0.1
Malawi
2.8
3.2
8.7c,d
9.6c,d
13.7c,d
15.2c,d
<0.1
1.2
1.1
0.2
0.1
0.3
0.5
1.1
1.4
0.4
0.4
<0.1
<0.1
<0.1
<0.1
<0.1
0.1
0.2
0.3
n.a.
<0.1f
<0.1f
<0.1f
<0.1f
0.1
0.1
0.1
0.1
n.a.
n.a.
<0.1
<0.1
Mozambique
6.8
9.5
11.0
12.3
18.5
21.6
0.2
1.9
1.9
0.2
0.3
0.7
1.0
2.9
3.5
0.4
n.a.
0.1
0.2
Rwanda
3.1
4.4
Seychelles
n.a.
n.a.
<0.1c
<0.1c
<0.1c
<0.1c
Somalia
6.1
9.2
n.a.
6.8h
n.a.
12.6h
--
n.a.
7.0
c
6.9
9.1
9.4
n.a.
n.a.
6.7
c,d
9.6
12.1
14.5
12.3c,d
14.3c,d
Zambia
n.a.
n.a.
3.5c,d
Zimbabwe
n.a.
n.a.
4.9
Mauritius
South Sudan
Uganda
United Republic of
Tanzania
c,d
c,d
c,d
c,d
<0.1
0.7
0.6
0.1
0.1
0.3
0.4
0.5
0.5
0.3
0.3
<0.1
<0.1
n.a.
<0.1
<0.1
<0.1
<0.1
<0.1
<0.1
<0.1
0.0
n.a.
n.a.
<0.1
<0.1
n.a.
0.7
0.8
0.1
0.1
0.4
0.5
1.2
1.5
<0.1
n.a.
n.a.
n.a.
c
n.a.
0.5
0.5
0.1
0.1
<0.1
<0.1
0.8
0.9
0.2
n.a.
n.a.
n.a.
c,d
0.2
2.2
2.2
0.3
0.3
0.7
1.0
2.5
3.4
0.9
1.0
n.a.
n.a.
28.3c,d
32.7c,d
0.3
3.2
3.1
0.4
0.5
1.6
2.2
4.4
5.3
0.8
1.2
0.2
0.2
4.1c,d
7.7c,d
9.2c,d
0.1
1.1
1.0
0.2
0.2
0.5
0.6
1.0
1.4
0.3
0.4
<0.1
<0.1
4.7
8.9
0.1
0.7
0.5
0.1
0.1
1.0
1.1
1.0
1.1
0.1
0.2
<0.1
<0.1
c
c,d
22.2
c
c,d
30.6
10.2
2004–06 2018–204 2014–16 2018–20 2014–16 2018–20
(millions)
(millions)
| 145 |
(millions)
(millions)
Middle Africa
41.2
Angola
10.1
53.2
n.a.
62.1
5.5
5.9
8.6c
Cameroon
2.8
1.4
n.a.
6.9
Central African
Republic
1.6
2.3
n.a.
Chad
3.8
5.1
Congo
1.2
2.0
21.1
Equatorial Guinea
Gabon
Democratic
Republic of the
Congo
Sao Tome and
Principe
(millions)
n.a.
(millions)
2012
20206
2012
20206
(millions)
(millions)
(millions)
(millions)
2012
2016
2012
2019
(millions) (millions) (millions) (millions)
20127
(millions)
20198
NUMBER OF BABIES
WITH LOW
BIRTHWEIGHT
NUMBER OF
INFANTS 0–5
MONTHS OF AGE
EXCLUSIVELY
BREASTFED
NUMBER OF
WOMEN OF
REPRODUCTIVE AGE
(15–49) AFFECTED
BY ANAEMIA
NUMBER OF ADULTS
(18 YEARS AND
OLDER) WHO ARE
OBESE
NUMBER OF
CHILDREN (UNDER
5 YEARS OF AGE)
WHO ARE
OVERWEIGHT
20205
(millions)
2012
2015
(millions) (millions) (millions)
1.9
9.8
11.3
1.1
1.5
4.5
6.0
14.6
17.2
1.6
n.a.
0.8
0.8
23.4c
0.3
1.6
2.2
0.1
0.2
0.8
1.1
2.6
3.3
n.a.
0.4
0.2
0.2
n.a.
14.4
0.2
1.2
1.1
0.3
0.4
1.0
1.4
2.1
2.5
0.2
0.3
<0.1
0.1
2.9
n.a.
3.9
<0.1
0.3
0.3
<0.1
<0.1
0.1
0.2
0.5
0.5
0.1
<0.1
<0.1
<0.1
0.4
1.0
1.0
0.1
0.1
0.3
0.4
1.4
1.6
<0.1
<0.1
n.a.
n.a.
2.1
2.8
4.0
4.7
0.1
0.2
0.1
<0.1
<0.1
0.2
0.2
0.6
0.6
<0.1
0.1
<0.1
<0.1
36.2
n.a.
33.4
n.a.
60.1
1.0
5.5
6.5
0.6
0.7
1.8
2.5
7.1
8.2
1.0
n.a.
0.3
0.4
n.a.
n.a.
n.a.
n.a.
n.a.
n.a.
n.a.
<0.1
<0.1
<0.1
<0.1
<0.1
0.1
0.1
0.1
<0.1
n.a.
n.a.
n.a.
0.2
0.3
n.a.
n.a.
n.a.
n.a.
n.a.
<0.1
<0.1
<0.1
<0.1
0.1
0.2
0.2
0.3
<0.1
n.a.
<0.1
<0.1
<0.1
<0.1
n.a.
n.a.
n.a.
n.a.
<0.1
<0.1
<0.1
<0.1
<0.1
<0.1
<0.1
<0.1
0.0
<0.1
<0.1
<0.1
<0.1
11.9
13.5
27.7
30.7
0.2
1.6
1.6
0.8
0.8
9.6
11.2
4.7
5.5
n.a.
0.4
0.2
0.2
n.a.
0.1
0.1
<0.1
<0.1
0.2
0.2
0.2
0.2
<0.1
<0.1
<0.1
<0.1
<0.1
<0.1
<0.1
<0.1
<0.1
0.1
0.1
0.1
0.1
<0.1
<0.1
<0.1
<0.1
<0.1
0.1
0.1
<0.1
<0.1
0.2
0.2
0.1
0.2
<0.1
<0.1
<0.1
<0.1
18.5
121.2
NUMBER OF
CHILDREN (UNDER
5 YEARS OF AGE)
WHO ARE STUNTED
NUMBER OF
CHILDREN (UNDER
5 YEARS OF AGE)
AFFECTED BY
WASTING
NUMBER OF
MODERATELY OR
SEVERELY FOOD
INSECURE
PEOPLE 1, 2, 3
NUMBER OF
SEVERELY FOOD
INSECURE
PEOPLE 1, 2, 3
REGIONS/
SUBREGIONS/
COUNTRIES
NUMBER OF
UNDERNOURISHED
PEOPLE 1
TABLE A1.2 (CONTINUED)
Southern Africa
2.8
5.6
Botswana
0.5
0.7
0.4c,d
0.5c,d
1.0c,d
1.2c,d
Eswatini
<0.1
0.1
0.3
0.4
Lesotho
0.3
0.5
n.a.
0.6
Namibia
0.4
0.5
0.7
0.8
n.a.
0.1
0.1
<0.1
<0.1
0.2
0.2
0.1
0.2
<0.1
n.a.
<0.1
<0.1
South Africa
1.6
3.8
10.0
11.3
23.7
26.3
0.2
1.4
1.3
0.7
0.7
9.0
10.4
4.2
4.8
n.a.
0.4
0.2
0.2
37.9
57.8
38.1
85.5
149.7
226.4
4.5
19.5
20.2
1.3
1.8
11.9
15.9
39.6
47.3
2.6
4.3
2.0
2.1
Benin
1.0
0.9
n.a.
n.a.
n.a.
n.a.
0.1
0.6
0.6
<0.1
<0.1
0.4
0.5
1.3
1.5
0.1
0.2
<0.1
<0.1
Burkina Faso
3.1
7.6
9.7
0.3
1.0
0.9
0.1
0.1
0.4
0.5
2.0
2.5
0.2
0.4
<0.1
<0.1
n.a.
<0.1f
<0.1f
n.a.
n.a.
<0.1
<0.1
<0.1
0.0
<0.1
n.a.
n.a.
n.a.
0.2
1.0
0.7
0.1
0.1
0.9
1.2
2.6
3.2
0.1
0.2
0.1
0.1
Western Africa
c,d
2.4
2.9
1.8
Cabo Verde
<0.1
<0.1
n.a.
Côte d'Ivoire
3.7
3.8
c,d
0.7
0.7
c
n.a.
1.1
c,d
1.2
1.4
c,d
<0.1c
c,d
c,d
n.a.
c
c,d
c,d
0.2c
2004–06 2018–204 2014–16 2018–20 2014–16 2018–20
| 146 |
<0.1
<0.1
0.1
0.1
0.3
0.3
<0.1
<0.1
<0.1
<0.1
0.6
0.1
0.1
1.3
1.7
2.9
2.7
0.4
0.4
0.1
0.1
0.6
0.6
0.1
0.1
0.3
0.4
1.3
1.5
0.1
0.1
n.a.
n.a.
<0.1
0.1
0.1
<0.1
<0.1
0.1
0.1
0.2
0.2
<0.1
<0.1
<0.1
<0.1
<0.1
0.2
0.2
<0.1
<0.1
0.2
0.2
0.4
0.5
<0.1
n.a.
n.a.
n.a.
0.3
1.0
0.9
<0.1
0.1
0.5
0.7
2.0
2.6
0.1
0.3
n.a.
n.a.
0.1
0.2
0.2
<0.1
<0.1
0.2
0.3
0.4
0.5
<0.1
0.1
n.a.
n.a.
0.5
1.8
2.2
<0.1
0.1
0.3
0.5
1.8
2.4
0.2
n.a.
n.a.
n.a.
0.5
0.6
1.1
1.3
<0.1
0.1
1.8
2.1c,d
2.6c,d
13.7c,d
15.3c,d
0.3
0.8
Guinea
n.a.
n.a.
5.1
6.3
8.3
9.5
0.2
Guinea-Bissau
n.a.
n.a.
n.a.
n.a.
n.a.
n.a.
Liberia
1.2
1.9
n.a.
1.8
n.a.
4.0
Mali
1.7
2.0
Mauritania
0.3
0.4
Niger
n.a.
n.a.
20127
(millions)
20198
2012
2015
(millions) (millions) (millions)
Nigeria
9.9
29.4
11.9
2.2
11.1
12.0
0.7
0.9
6.1
8.2
20.9
25.5
0.9
1.8
n.a.
n.a.
1.9
1.2
2.1
2.2c
5.7
6.7c
0.2
0.5
0.5
<0.1
0.1
0.5
0.7
1.8
2.1
0.2
0.2
<0.1
0.1
Sierra Leone
2.6
2.0
2.2c,d
2.5c,d
5.6c,d
6.6c,d
0.1
0.4
0.3
<0.1
0.1
0.3
0.3
0.8
0.9
0.1
0.1
<0.1
<0.1
Togo
1.6
1.7
0.1
0.3
0.3
<0.1
<0.1
0.2
0.3
0.8
0.9
0.1
0.2
<0.1
<0.1
Sub-Saharan Africa
(including Sudan)
188.7
237.3
203.0
283.7
528.5
674.9
n.a.
n.a.
n.a.
n.a.
n.a.
35.3
45.9
n.a.
n.a.
11.3
16.1
5.1
5.2
ASIA*
543.6
378.0
321.7
426.8
840.5
1.085.3
31.9
103.6
79.0
18.2
18.7
181.7
231.3
351.9
380.7
28.9
32.7
13.3
12.8
Central Asia
6.3
2.3
1.1
2.3
6.3
10.9
0.2
1.1
0.8
0.6
0.5
6.6
8.1
5.2
5.3
0.5
0.7
<0.1
<0.1
Kazakhstan
1.1
n.r.
n.a.
<0.1c,d
n.a.
0.4c,d
0.1
0.2
0.1
0.2
0.2
2.2
2.6
1.3
1.3
0.1
0.1
<0.1
<0.1
Kyrgyzstan
0.5
0.5
n.a.
<0.1c,d
n.a.
0.4c,d
<0.1
0.1
0.1
0.1
<0.1
0.5
0.6
0.5
0.6
0.1
0.1
<0.1
<0.1
Tajikistan
n.a.
n.a.
0.1
0.3
0.2
0.1
<0.1
0.6
0.7
0.6
0.8
0.1
0.1
<0.1
<0.1
Turkmenistan
0.2
0.2
n.a.
<0.1
0.1
0.1
<0.1
<0.1
0.6
0.7
0.4
0.4
<0.1
0.1
<0.1
<0.1
Uzbekistan
n.a.
c,d
n.a.
c,d
n.a.
116.0
2019
(millions) (millions) (millions) (millions)
Senegal
c,d
66.1
2012
NUMBER OF BABIES
WITH LOW
BIRTHWEIGHT
0.1
0.3
2.5
2016
NUMBER OF
INFANTS 0–5
MONTHS OF AGE
EXCLUSIVELY
BREASTFED
20206
(millions)
0.3
2012
NUMBER OF
WOMEN OF
REPRODUCTIVE AGE
(15–49) AFFECTED
BY ANAEMIA
2012
(millions)
Ghana
43.0
NUMBER OF ADULTS
(18 YEARS AND
OLDER) WHO ARE
OBESE
20206
(millions)
Gambia
1.8c,d
NUMBER OF
CHILDREN (UNDER
5 YEARS OF AGE)
WHO ARE
OVERWEIGHT
2012
(millions)
(millions)
1.1c,d
(millions)
20205
(millions)
0.3c,d
(millions)
(millions)
(millions)
0.2c,d
(millions)
NUMBER OF
CHILDREN (UNDER
5 YEARS OF AGE)
WHO ARE STUNTED
NUMBER OF
CHILDREN (UNDER
5 YEARS OF AGE)
AFFECTED BY
WASTING
NUMBER OF
MODERATELY OR
SEVERELY FOOD
INSECURE
PEOPLE 1, 2, 3
NUMBER OF
SEVERELY FOOD
INSECURE
PEOPLE 1, 2, 3
REGIONS/
SUBREGIONS/
COUNTRIES
NUMBER OF
UNDERNOURISHED
PEOPLE 1
TABLE A1.2 (CONTINUED)
c,d
3.9
n.r.
0.6
1.3
3.5
6.5
0.1
0.5
0.3
0.3
0.2
2.8
3.5
2.4
2.2
0.2
0.3
<0.1
<0.1
107.4
n.r.
16.8
28.9
99.7
138.3
1.5
7.4
4.6
6.7
7.4
61.1
77.5
67.1
64.4
5.6
4.0
0.9
0.9
China
95.4
n.r.
1.6
6.4
3.9
6.2
6.9
53.8
68.7
56.1
54.0
4.9
3.4
0.9
0.8
China, mainland
94.3
n.r.
n.a.
n.a.
n.a.
n.a.
n.a.
n.a.
n.a.
n.a.
n.a.
n.a.
n.a.
n.a.
n.a.
Eastern Asia*
2004–06 2018–204 2014–16 2018–20 2014–16 2018–20
(millions)
(millions)
(millions)
(millions)
20205
2012
20206
2012
20206
(millions)
(millions)
(millions)
(millions)
(millions)
2012
2016
2012
2019
(millions) (millions) (millions) (millions)
20127
(millions)
20198
NUMBER OF BABIES
WITH LOW
BIRTHWEIGHT
NUMBER OF
INFANTS 0–5
MONTHS OF AGE
EXCLUSIVELY
BREASTFED
NUMBER OF
WOMEN OF
REPRODUCTIVE AGE
(15–49) AFFECTED
BY ANAEMIA
NUMBER OF ADULTS
(18 YEARS AND
OLDER) WHO ARE
OBESE
NUMBER OF
CHILDREN (UNDER
5 YEARS OF AGE)
WHO ARE
OVERWEIGHT
NUMBER OF
CHILDREN (UNDER
5 YEARS OF AGE)
WHO ARE STUNTED
NUMBER OF
CHILDREN (UNDER
5 YEARS OF AGE)
AFFECTED BY
WASTING
NUMBER OF
MODERATELY OR
SEVERELY FOOD
INSECURE
PEOPLE 1, 2, 3
NUMBER OF
SEVERELY FOOD
INSECURE
PEOPLE 1, 2, 3
REGIONS/
SUBREGIONS/
COUNTRIES
NUMBER OF
UNDERNOURISHED
PEOPLE 1
TABLE A1.2 (CONTINUED)
2012
2015
| 147 |
(millions)
(millions)
(millions) (millions) (millions)
Taiwan Province of
China
1.0
0.8
n.a.
n.a.
n.a.
n.a.
n.a.
n.a.
n.a.
1.7
1.7
n.a.
n.a.
n.a.
n.a.
China, Hong Kong
SAR
n.r.
n.r.
n.a.
n.a.
n.a.
n.a.
n.a.
n.a.
n.a.
n.a.
n.a.
n.a.
n.a.
n.a.
n.a.
China, Macao SAR
<0.1
<0.1
n.a.
n.a.
n.a.
n.a.
n.a.
n.a.
n.a.
n.a.
n.a.
n.a.
n.a.
n.a.
n.a.
n.a.
n.a.
n.a.
n.a.
Democratic
People's Republic
of Korea
8.1
10.9
n.a.
n.a.
n.a.
n.a.
<0.1
0.4
0.3
<0.1
<0.1
1.1
1.3
2.1
2.2
0.2
0.3
n.a.
n.a.
Japan
n.r.
n.r.
0.5
0.8
3.3
4.3
n.a.
0.4
0.3
0.1
0.1
3.9
4.6
5.3
4.8
n.a.
n.a.
0.1
0.1
Mongolia
0.7
0.1
0.1
0.2
0.6
0.8
<0.1
<0.1
<0.1
<0.1
<0.1
0.3
0.4
0.1
0.1
<0.1
<0.1
<0.1
<0.1
0.3
2.4
2.6
n.a.
0.1
<0.1
0.2
0.2
1.7
2.0
1.8
1.6
n.a.
n.a.
<0.1
<0.1
Republic of Korea
n.r.
n.r.
0.2
Eastern Asia
(excluding China,
mainland)
11.9
13.3
1.2
1.9
9.3
11.0
n.a.
n.a.
n.a.
n.a.
n.a.
n.a.
n.a.
n.a.
n.a.
n.a.
n.a.
0.2
0.2
South-eastern Asia
95.8
46.7
15.0
18.7
100.7
116.7
4.6
17.2
15.3
3.3
4.2
22.2
29.5
41.7
47.4
3.8
5.2
1.5
1.4
Brunei Darussalam
n.r.
n.r.
n.a.
n.a.
n.a.
n.a.
n.a.
<0.1
<0.1
<0.1
<0.1
<0.1
<0.1
<0.1
0.0
n.a.
n.a.
<0.1
<0.1
Cambodia
2.3
1.0
2.6
2.2
7.6
7.4
0.2
0.6
0.5
<0.1
<0.1
0.3
0.4
1.9
2.1
0.3
0.2
<0.1
<0.1
Indonesia
1.9
15.5
16.8
2.5
8.1
7.5
1.9
2.6
9.1
12.2
18.3
22.3
2.0
2.3
0.5
0.5
c
c
43.5
17.6
1.8
Lao People's
Democratic Republic
1.3
0.4
n.a.
0.6
n.a.
2.1
0.1
0.3
0.2
<0.1
<0.1
0.2
0.2
0.6
0.8
0.1
0.1
<0.1
<0.1
Malaysia
0.8
1.0
2.4
2.4
5.3
6.0
0.3
0.4
0.5
0.1
0.2
2.6
3.3
2.4
2.8
n.a.
0.2
<0.1
<0.1
Myanmar
13.6
4.1
n.a.
1.0
n.a.
12.0
0.3
1.5
1.1
0.1
0.1
1.5
2.1
5.7
6.3
0.2
0.5
0.1
0.1
Philippines
4.3
42.1
46.1
c,d
c,d
c,d
c,d
12.9
10.1
3.3
0.6
3.6
3.0
0.4
0.4
3.2
4.1
4.2
3.5
0.8
n.a.
0.5
0.5
Singapore
n.a.
n.a.
<0.1
<0.1
0.2
0.3
n.a.
<0.1
<0.1
<0.1
<0.1
0.2
0.3
0.2
0.2
n.a.
n.a.
<0.1
<0.1
Thailand
7.8
5.7
2.9
5.9
10.4
20.8
0.3
0.6
0.4
0.3
0.3
4.1
5.4
4.1
4.2
0.1
0.2
<0.1
<0.1
Timor-Leste
0.3
0.3
n.a.
n.a.
n.a.
n.a.
n.a.
0.1
0.1
<0.1
<0.1
<0.1
<0.1
0.1
0.1
<0.1
<0.1
n.a.
n.a.
13.0
6.5
0.4
0.5
5.8
6.2
0.4
1.9
1.8
0.3
0.5
1.0
1.4
4.3
5.3
0.3
n.a.
0.1
0.1
Viet Nam
c,d
c,d
c,d
c,d
c,d
c,d
2004–06 2018–204 2014–16 2018–20 2014–16 2018–20
564.0
742.6
25.0
73.0
54.3
5.3
4.5
49.7
65.4
218.4
241.0
17.0
20.7
10.3
9.8
15.5
24
c,d
0.3
2.4
2.0
0.3
0.2
0.6
0.9
2.5
3.8
n.a.
0.7
n.a.
n.a.
17.1
50.4
52.0
1.4
5.7
4.3
0.3
0.3
2.7
3.7
14.9
16.8
1.9
1.9
0.9
0.9
n.a.
n.a.
n.a.
n.a.
<0.1
<0.1
<0.1
<0.1
<0.1
<0.1
0.1
0.1
<0.1
<0.1
<0.1
<0.1
20.1
52.3
36.1
3.0
2.2
25.2
34.3
171.5
187.3
11.2
13.9
n.a.
n.a.
35.2
n.a.
0.4
0.5
0.5f
0.7f
12.6
14.8
5.1
5.5
0.7
n.a.
n.a.
n.a.
n.a.
n.a.
<0.1
<0.1
<0.1
<0.1
<0.1
<0.1
<0.1
<0.1
0.1
<0.1
<0.1
<0.1
<0.1
8.0
10.4
269.5
267.0
352.2
Afghanistan
9.2
9.7
5.1
7.5
Bangladesh
19.7
15.9
20.7
n.a.
n.a.
n.a.
247.8
208.6
Iran (Islamic
Republic of)
3.6
4.6
7.5
7.2
37.7
Maldives
n.a.
n.a.
n.a.
n.a.
2.8
3.4
c,d
2012
2019
(millions) (millions) (millions) (millions)
20127
(millions)
20198
NUMBER OF BABIES
WITH LOW
BIRTHWEIGHT
(millions)
315.9
2016
NUMBER OF
INFANTS 0–5
MONTHS OF AGE
EXCLUSIVELY
BREASTFED
20206
(millions)
(millions)
2012
NUMBER OF
WOMEN OF
REPRODUCTIVE AGE
(15–49) AFFECTED
BY ANAEMIA
2012
(millions)
(millions)
Nepal
NUMBER OF ADULTS
(18 YEARS AND
OLDER) WHO ARE
OBESE
20206
(millions)
(millions)
India
NUMBER OF
CHILDREN (UNDER
5 YEARS OF AGE)
WHO ARE
OVERWEIGHT
2012
(millions)
(millions)
Bhutan
| 148 |
20205
(millions)
(millions)
Southern Asia
NUMBER OF
CHILDREN (UNDER
5 YEARS OF AGE)
WHO ARE STUNTED
NUMBER OF
CHILDREN (UNDER
5 YEARS OF AGE)
AFFECTED BY
WASTING
NUMBER OF
MODERATELY OR
SEVERELY FOOD
INSECURE
PEOPLE 1, 2, 3
NUMBER OF
SEVERELY FOOD
INSECURE
PEOPLE 1, 2, 3
REGIONS/
SUBREGIONS/
COUNTRIES
NUMBER OF
UNDERNOURISHED
PEOPLE 1
TABLE A1.2 (CONTINUED)
2012
2015
(millions) (millions) (millions)
4.3
1.4
0.3
1.2
0.8
<0.1
<0.1
0.5
0.7
2.6
3.2
0.4
0.4
0.1
0.1
Pakistan
28.2
27.9
1.9
10.7
10.3
1.2
1.0
7.5
10.2
19.8
22.4
1.9
2.7
n.a.
n.a.
Sri Lanka
2.9
1.4
0.3
0.3
0.3
<0.1
<0.1
0.6
0.8
1.8
1.8
0.3
0.3
<0.1
<0.1
Southern Asia
(excluding India)
68.1
60.9
n.a.
n.a.
n.a.
n.a.
n.a.
24.5
31.1
n.a.
n.a.
5.7
6.8
n.a.
n.a.
Western Asia
64.2
73.9
199.6
219.5
76.8
18.3
40.3
21.8
24.7
69.7
Armenia
0.4
0.1
<0.1
<0.1c,d
0.5
0.4c,d
Azerbaijan
0.4
n.r.
<0.1
<0.1
0.6
0.9
Bahrain
n.a.
n.a.
Cyprus
<0.1
n.r.
Georgia
0.2
0.3
Iraq
6.4
14.7
Israel
n.r.
n.r.
Jordan
0.3
1.0
Kuwait
n.r.
n.r.
Lebanon
0.5
0.6
0.3
0.1
0.2
c,d
0.4
1.3
0.2
0.9
c,d
0.2
0.5
1.6
c,d
1.2
c,d
0.5
1.0
4.7
3.7
2.4
2.2
42.4
51.4
19.6
22.5
1.8
1.8
0.6
0.6
<0.1
<0.1
<0.1
<0.1
<0.1
0.4
0.5
0.1
0.1
<0.1
<0.1
<0.1
<0.1
n.a.
0.1
n.a.
<0.1
0.1
f
<0.1
0.1
f
<0.1
0.1
f
<0.1
1.2
1.4
0.9
0.9
<0.1
n.a.
<0.1
<0.1
f
0.3
0.3
0.1
0.1
n.a.
n.a.
<0.1
<0.1
n.a.
n.a.
n.a.
n.a.
n.a.
0.2
0.2
<0.1
0.0
n.a.
n.a.
n.a.
n.a.
<0.1
<0.1
<0.1
<0.1
<0.1
0.6
0.7
0.3
0.2
<0.1
<0.1
<0.1
<0.1
0.2
0.9
0.6
0.4
0.5
4.7
6.1
2.3
2.8
0.2
0.3
n.a.
n.a.
n.a.
n.a.
n.a.
n.a.
n.a.
1.3
1.4
0.2
0.3
n.a.
n.a.
<0.1
<0.1
n.a.
0.1
0.1
0.1
0.1
1.5
2.0
0.6
1.0
0.1
0.1
<0.1
<0.1
<0.1
<0.1
<0.1
<0.1
<0.1
0.9
1.1
0.2
0.2
n.a.
n.a.
<0.1
<0.1
n.a.
0.1
0.1
0.1
0.1
1.1
1.5
0.4
0.5
n.a.
n.a.
<0.1
<0.1
2004–06 2018–204 2014–16 2018–20 2014–16 2018–20
(millions)
(millions)
(millions)
(millions)
(millions)
(millions)
20205
2012
20206
2012
20206
(millions)
(millions)
(millions)
(millions)
(millions)
2012
2016
2012
2019
(millions) (millions) (millions) (millions)
20127
(millions)
20198
NUMBER OF BABIES
WITH LOW
BIRTHWEIGHT
NUMBER OF
INFANTS 0–5
MONTHS OF AGE
EXCLUSIVELY
BREASTFED
NUMBER OF
WOMEN OF
REPRODUCTIVE AGE
(15–49) AFFECTED
BY ANAEMIA
NUMBER OF ADULTS
(18 YEARS AND
OLDER) WHO ARE
OBESE
NUMBER OF
CHILDREN (UNDER
5 YEARS OF AGE)
WHO ARE
OVERWEIGHT
NUMBER OF
CHILDREN (UNDER
5 YEARS OF AGE)
WHO ARE STUNTED
NUMBER OF
CHILDREN (UNDER
5 YEARS OF AGE)
AFFECTED BY
WASTING
NUMBER OF
MODERATELY OR
SEVERELY FOOD
INSECURE
PEOPLE 1, 2, 3
NUMBER OF
SEVERELY FOOD
INSECURE
PEOPLE 1, 2, 3
REGIONS/
SUBREGIONS/
COUNTRIES
NUMBER OF
UNDERNOURISHED
PEOPLE 1
TABLE A1.2 (CONTINUED)
2012
2015
(millions) (millions) (millions)
| 149 |
Oman
0.2
0.4
n.a.
n.a.
n.a.
n.a.
<0.1
<0.1
0.1
<0.1
<0.1
0.6
0.9
0.2
0.3
n.a.
<0.1
<0.1
<0.1
Palestine
n.a.
n.a.
n.a.
0.2c
n.a.
1.3c
<0.1
0.1
0.1
0.1
0.1
n.a.
n.a.
0.3
0.4
<0.1
0.1
<0.1
<0.1
Qatar
n.a.
n.a.
n.a.
n.a.
n.a.
n.a.
n.a.
<0.1f
<0.1f
<0.1f
<0.1f
0.6
0.8
0.1
0.1
<0.1
n.a.
<0.1
<0.1
Saudi Arabia
1.1
1.3
n.a.
0.2
0.1
0.2
0.2
6.4
8.1
1.9
2.3
n.a.
n.a.
n.a.
n.a.
Syrian Arab
Republic
n.a.
n.a.
n.a.
0.7
0.6
0.5
0.3
3.0
3.0
1.7
1.5
0.2
n.a.
n.a.
n.a.
Turkey
n.r.
n.r.
0.1
n.a.g
n.a.g
n.a.g
n.a.g
15.1
17.8
n.a.
n.a.
0.6
0.5
0.2
0.1
United Arab
Emirates
0.4
0.4
n.a.
n.a.
n.a.
n.a.
n.a.
2.2
2.5
0.4
0.5
n.a.
n.a.
<0.1
<0.1
Yemen
5.6
13.2
n.a.
n.a.
n.a.
n.a.
n.a.
1.8
1.5
0.1
0.1
1.8
2.5
3.7
4.6
n.a.
n.a.
n.a.
n.a.
Central Asia and
Southern Asia
322.2
271.8
268.2
354.4
570.3
753.5
25.2
74.1
55.1
5.9
4.9
56.4
73.5
223.5
246.3
17.4
21.4
10.4
9.9
Eastern Asia and
South-eastern Asia*
203.2
65.8
31.7
47.6
200.4
255.0
6.0
24.6
20.1
9.9
11.6
83.3
107.0
108.8
111.9
9.5
8.7
2.5
2.5
Western Asia and
Northern Africa
33.8
56.3
43.9
46.9
134.0
149.4
2.9
10.5
10.0
5.5
6.0
72.6
87.0
37.2
41.4
4.1
4.2
1.3
1.3
LATIN AMERICA
AND THE
CARIBBEAN
51.8
49.8
50.3
73.3
174.2
225.8
0.7
6.7
5.8
3.9
3.9
90.8
106.0
29.6
29.6
3.5
n.a.
0.9
0.9
Caribbean
7.6
6.9
n.a.
16.3
n.a.
29.2
0.1
0.5
0.4
0.2
0.2
6.3
7.3
3.0
3.1
0.2
0.2
<0.1
<0.1
Antigua and
Barbuda
n.a.
n.a.
n.a.
n.a.
n.a.
n.a.
n.a.
n.a.
n.a.
n.a.
n.a.
<0.1
<0.1
<0.1
0.0
n.a.
n.a.
<0.1
<0.1
Bahamas
n.a.
n.a.
n.a.
n.a.
n.a.
n.a.
n.a.
n.a.
n.a.
n.a.
n.a.
0.1
0.1
<0.1
0.0
n.a.
n.a.
<0.1
<0.1
Barbados
<0.1
<0.1
n.a.
n.a.
n.a.
n.a.
n.a.
<0.1
<0.1
<0.1
<0.1
<0.1
0.1
<0.1
0.0
<0.1
n.a.
n.a.
n.a.
n.r.
n.r.
n.a.
n.a.
n.a.
n.a.
<0.1
<0.1
<0.1
0.1
0.1
2.0
2.2
0.6
0.5
0.1
<0.1
<0.1
<0.1
<0.1
<0.1
n.a.
n.a.
n.a.
n.a.
n.a.
n.a.
n.a.
n.a.
n.a.
n.a.
n.a.
<0.1
0.0
n.a.
n.a.
n.a.
n.a.
1.7
0.9
n.a.
0.1
0.1
0.1
0.1
1.6
1.9
0.7
0.7
<0.1
<0.1
<0.1
<0.1
Cuba
Dominica
Dominican Republic
n.a.
n.a.
n.a.
n.a.
2004–06 2018–204 2014–16 2018–20 2014–16 2018–20
(millions)
(millions)
(millions)
(millions)
(millions)
(millions)
20205
2012
20206
2012
20206
(millions)
(millions)
(millions)
(millions)
(millions)
2012
2016
2012
2019
(millions) (millions) (millions) (millions)
20127
(millions)
20198
NUMBER OF BABIES
WITH LOW
BIRTHWEIGHT
NUMBER OF
INFANTS 0–5
MONTHS OF AGE
EXCLUSIVELY
BREASTFED
NUMBER OF
WOMEN OF
REPRODUCTIVE AGE
(15–49) AFFECTED
BY ANAEMIA
NUMBER OF ADULTS
(18 YEARS AND
OLDER) WHO ARE
OBESE
NUMBER OF
CHILDREN (UNDER
5 YEARS OF AGE)
WHO ARE
OVERWEIGHT
NUMBER OF
CHILDREN (UNDER
5 YEARS OF AGE)
WHO ARE STUNTED
NUMBER OF
CHILDREN (UNDER
5 YEARS OF AGE)
AFFECTED BY
WASTING
NUMBER OF
MODERATELY OR
SEVERELY FOOD
INSECURE
PEOPLE 1, 2, 3
NUMBER OF
SEVERELY FOOD
INSECURE
PEOPLE 1, 2, 3
REGIONS/
SUBREGIONS/
COUNTRIES
NUMBER OF
UNDERNOURISHED
PEOPLE 1
TABLE A1.2 (CONTINUED)
2012
2015
(millions) (millions) (millions)
| 150 |
Grenada
n.a.
n.a.
n.a.
n.a.
n.a.
n.a.
n.a.
<0.1
<0.1
<0.1
0.0
n.a.
n.a.
n.a.
n.a.
Haiti
5.1
5.3
<0.1
0.3
0.3
<0.1
<0.1
1.2
1.5
1.3
1.4
0.1
0.1
n.a.
n.a.
Jamaica
0.2
0.2
<0.1
<0.1
<0.1
<0.1
<0.1
0.4
0.5
0.1
0.2
<0.1
n.a.
<0.1
<0.1
Puerto Rico
n.a.
n.a.
n.a.
n.a.
n.a.
n.a.
n.a.
n.a.
n.a.
n.a.
n.a.
n.a.
n.a.
0.2
0.1
n.a.
n.a.
n.a.
n.a.
Saint Kitts and
Nevis
n.a.
n.a.
n.a.
n.a.
n.a.
n.a.
n.a.
n.a.
n.a.
n.a.
n.a.
n.a.
n.a.
<0.1
0.0
n.a.
n.a.
n.a.
n.a.
Saint Lucia
n.a.
n.a.
<0.1c
n.a.
<0.1c
n.a.
n.a.
<0.1
<0.1
<0.1
<0.1
<0.1
<0.1
<0.1
0.0
<0.1
n.a.
n.a.
n.a.
<0.1
<0.1
n.a.
n.a.
n.a.
n.a.
n.a.
<0.1
<0.1
<0.1
0.0
n.a.
n.a.
n.a.
n.a.
0.1
<0.1
n.a.
n.a.
n.a.
n.a.
n.a.
<0.1
<0.1
<0.1
<0.1
0.2
0.2
0.1
0.1
<0.1
n.a.
<0.1
<0.1
Central America
11.6
15.8
10.9
15.1
49.5
55.1
0.1
2.9
2.7
1.1
1.0
26.1
30.8
6.7
7.0
0.7
1.1
0.3
0.3
Belize
Saint Vincent and
the Grenadines
Trinidad and Tobago
<0.1
<0.1
n.a.
n.a.
n.a.
n.a.
<0.1
<0.1
<0.1
<0.1
<0.1
<0.1
0.1
<0.1
0.0
<0.1
<0.1
<0.1
<0.1
Costa Rica
0.2
0.2
<0.1c,d
0.1c,d
0.6c,d
0.8c,d
<0.1
<0.1
<0.1
<0.1
<0.1
0.8
0.9
0.2
0.2
<0.1
n.a.
<0.1
<0.1
El Salvador
0.6
0.5
0.9
0.9
2.7
3.0
<0.1
0.1
0.1
<0.1
<0.1
0.9
1.0
0.2
0.2
<0.1
0.1
<0.1
<0.1
Guatemala
2.5
2.9
2.6
3.4
6.9
8.7
<0.1
0.9
0.9
0.1
0.1
1.6
2.0
0.4
0.3
0.2
0.2
<0.1
<0.1
1.4
3.8
Honduras
1.7
1.3
1.3
Mexico
4.7
9.2
4.4c
n.a.
0.2
0.2
0.1
0.1
0.9
1.2
0.4
0.5
0.1
n.a.
<0.1
<0.1
0.2
1.4
1.3
0.8
0.7
20.6
24.0
5.1
5.3
0.3
0.6
0.2
0.2
Nicaragua
1.3
1.3
n.a.
0.1
0.1
<0.1
<0.1
0.8
0.9
0.2
0.3
<0.1
n.a.
<0.1
<0.1
Panama
0.7
0.3
n.a.
0.1
0.1
<0.1
<0.1
0.5
0.6
0.2
0.2
n.a.
n.a.
<0.1
<0.1
32.6
27.0
24.9
41.9
97.4
141.4
0.4
3.4
2.8
2.6
2.6
58.4
67.9
19.9
19.5
2.8
n.a.
0.6
0.6
Argentina
1.4
1.7
2.5
5.7
8.3
16.0
0.1
0.3
0.3
0.5
0.5
7.6
8.6
1.3
1.3
0.2
n.a.
<0.1
<0.1
Bolivia (Plurinational
State of)
2.5
1.5
<0.1
0.2
0.2
0.1
0.1
1.1
1.4
0.7
0.7
0.2
0.1
<0.1
<0.1
Brazil
12.1
n.r.
3.9
7.5
n.a.
0.9
0.9
1.0
1.1
28.4
33.3
10.1
9.2
1.1
n.a.
0.3
0.2
Chile
0.5
0.6
0.5c,d
0.8c,d
<0.1
<0.1
<0.1
0.1
0.1
3.4
3.8
0.4
0.4
n.a.
n.a.
<0.1
<0.1
South America
c,d
c,d
7.4c,d
c,d
31.2c
37.5
1.9c,d
4.4
c,d
33.2c,d
49.6
3.4c,d
a
a
a
2004–06 2018–204 2014–16 2018–20 2014–16 2018–20
(millions)
(millions)
Colombia
4.8
4.4
Ecuador
3.1
Guyana
Paraguay
Peru
(millions)
20206
2012
20206
(millions)
(millions)
(millions)
0.4
0.2
0.2
6.4
7.6
2.8
2.9
n.a.
0.3
<0.1
<0.1
0.4
0.1
0.2
1.8
2.2
0.7
0.8
n.a.
n.a.
<0.1
<0.1
<0.1
<0.1
<0.1
<0.1
0.1
0.1
0.1
0.1
<0.1
<0.1
<0.1
<0.1
0.1
<0.1
0.1
0.1
0.7
0.9
0.4
0.4
<0.1
<0.1
<0.1
<0.1
(millions)
0.1
0.5
2.2
1.0c,d
2.0c,d
3.4c,d
5.7c,d
0.1
0.4
<0.1
<0.1
n.a.
n.a.
n.a.
n.a.
<0.1
0.6
0.7
<0.1
2012
2019
(millions) (millions) (millions) (millions)
20127
(millions)
20198
NUMBER OF BABIES
WITH LOW
BIRTHWEIGHT
2012
(millions)
(millions)
2016
NUMBER OF
INFANTS 0–5
MONTHS OF AGE
EXCLUSIVELY
BREASTFED
20205
(millions)
(millions)
2012
NUMBER OF
WOMEN OF
REPRODUCTIVE AGE
(15–49) AFFECTED
BY ANAEMIA
NUMBER OF ADULTS
(18 YEARS AND
OLDER) WHO ARE
OBESE
NUMBER OF
CHILDREN (UNDER
5 YEARS OF AGE)
WHO ARE
OVERWEIGHT
NUMBER OF
CHILDREN (UNDER
5 YEARS OF AGE)
WHO ARE STUNTED
NUMBER OF
CHILDREN (UNDER
5 YEARS OF AGE)
AFFECTED BY
WASTING
NUMBER OF
MODERATELY OR
SEVERELY FOOD
INSECURE
PEOPLE 1, 2, 3
NUMBER OF
SEVERELY FOOD
INSECURE
PEOPLE 1, 2, 3
REGIONS/
SUBREGIONS/
COUNTRIES
NUMBER OF
UNDERNOURISHED
PEOPLE 1
TABLE A1.2 (CONTINUED)
2012
2015
(millions) (millions) (millions)
| 151 |
5.2
2.8
4.1
6.2
11.3
15.5
<0.1
0.6
0.3
0.3
0.2
3.5
4.1
1.6
1.8
0.4
0.4
<0.1
<0.1
Suriname
<0.1
<0.1
n.a.
n.a.
n.a.
n.a.
<0.1
<0.1
<0.1
<0.1
<0.1
0.1
0.1
<0.1
0.0
<0.1
n.a.
<0.1
<0.1
Uruguay
0.1
n.r.
0.2
0.2
0.7
0.8
<0.1
<0.1
<0.1
<0.1
<0.1
0.6
0.7
0.1
0.1
n.a.
n.a.
<0.1
<0.1
Venezuela (Bolivarian
Republic of)
2.2
7.8
n.a.
0.4
0.2
0.2
0.2
4.6
5.1
1.6
1.8
n.a.
n.a.
<0.1
<0.1
OCEANIA
2.3
2.6
1.1
1.4
4.4
5.4
n.a.
n.a.
n.a.
n.a.
n.a.
7.0
8.1
1.3
1.6
n.a.
n.a.
<0.1
<0.1
Australia and New
Zealand
n.r.
n.r.
0.8
1.0
3.0
3.8
n.a.
<0.1
<0.1a
0.2
0.3
5.7
6.5
0.5
0.6
n.a.
n.a.
<0.1
<0.1
Australia
n.r.
n.r.
0.7
0.8
2.6
3.1
n.a.
<0.1
<0.1
0.2
0.3
4.7
5.4
0.4
0.5
n.a.
n.a.
<0.1
<0.1
New Zealand
n.r.
n.r.
0.1
0.2
0.5
0.7
n.a.
n.a.
n.a.
n.a.
n.a.
1.0
1.1
0.1
0.1
n.a.
n.a.
<0.1
<0.1
Oceania excluding
Australia and New
Zealand
2.0
2.4
n.a.
n.a.
n.a.
n.a.
0.1
0.6
0.6
0.1
0.1
1.3
1.6
0.8
1.0
0.2
0.2
<0.1
<0.1
Melanesia
1.9
2.4
n.a.
n.a.
n.a.
n.a.
0.1
0.2
<0.1
<0.1
Fiji
<0.1
<0.1
n.a.
<0.1
c
New Caledonia
<0.1
<0.1
n.a.
n.a.
1.8
2.2
n.a.
Solomon Islands
<0.1
0.1
Vanuatu
<0.1
n.a.
<0.1
Papua New Guinea
Micronesia
Kiribati
n.a.
0.5
0.6
0.1
0.1
1.1
1.3
0.8
0.9
n.a.
0.1
c
n.a.
<0.1
<0.1
<0.1
<0.1
0.2
0.2
0.1
0.1
n.a.
n.a.
n.a.
n.a.
n.a.
n.a.
n.a.
n.a.
n.a.
n.a.
n.a.
n.a.
n.a.
n.a.
n.a.
n.a.
n.a.
n.a.
n.a.
n.a.
n.a.
n.a.
n.a.
0.5
0.5
0.1
0.1
0.8
1.0
0.6
0.8
0.1
0.1
n.a.
n.a.
n.a.
n.a.
n.a.
n.a.
<0.1
<0.1
<0.1
<0.1
<0.1
0.1
0.1
0.1
0.1
<0.1
<0.1
n.a.
n.a.
<0.1
n.a.
<0.1
c
n.a.
<0.1
c
n.a.
<0.1
<0.1
<0.1
<0.1
<0.1
<0.1
<0.1
0.0
<0.1
n.a.
<0.1
<0.1
n.a.
n.a.
n.a.
n.a.
n.a.
n.a.
<0.1
<0.1
<0.1
<0.1
0.1
0.1
<0.1
0.0
<0.1
n.a.
<0.1
<0.1
<0.1
n.a.
<0.1
n.a.
<0.1
<0.1
<0.1
<0.1
<0.1
<0.1
<0.1
<0.1
<0.1
0.0
<0.1
n.a.
n.a.
n.a.
c
c
2004–06 2018–204 2014–16 2018–20 2014–16 2018–20
(millions)
(millions)
(millions)
(millions)
(millions)
(millions)
20205
2012
20206
2012
20206
(millions)
(millions)
(millions)
(millions)
(millions)
2012
2016
2012
2019
(millions) (millions) (millions) (millions)
20127
(millions)
20198
NUMBER OF BABIES
WITH LOW
BIRTHWEIGHT
NUMBER OF
INFANTS 0–5
MONTHS OF AGE
EXCLUSIVELY
BREASTFED
NUMBER OF
WOMEN OF
REPRODUCTIVE AGE
(15–49) AFFECTED
BY ANAEMIA
NUMBER OF ADULTS
(18 YEARS AND
OLDER) WHO ARE
OBESE
NUMBER OF
CHILDREN (UNDER
5 YEARS OF AGE)
WHO ARE
OVERWEIGHT
NUMBER OF
CHILDREN (UNDER
5 YEARS OF AGE)
WHO ARE STUNTED
NUMBER OF
CHILDREN (UNDER
5 YEARS OF AGE)
AFFECTED BY
WASTING
NUMBER OF
MODERATELY OR
SEVERELY FOOD
INSECURE
PEOPLE 1, 2, 3
NUMBER OF
SEVERELY FOOD
INSECURE
PEOPLE 1, 2, 3
REGIONS/
SUBREGIONS/
COUNTRIES
NUMBER OF
UNDERNOURISHED
PEOPLE 1
TABLE A1.2 (CONTINUED)
2012
2015
(millions) (millions) (millions)
Marshall Islands
n.a.
n.a.
n.a.
n.a.
n.a.
n.a.
<0.1
<0.1
<0.1
<0.1
<0.1
n.a.
n.a.
<0.1
0.0
<0.1
<0.1
n.a.
n.a.
Micronesia
(Federated States of)
n.a.
n.a.
n.a.
n.a.
n.a.
n.a.
n.a.
n.a.
n.a.
n.a.
n.a.
<0.1
<0.1
<0.1
0.0
n.a.
n.a.
n.a.
n.a.
Nauru
n.a.
n.a.
n.a.
n.a.
n.a.
n.a.
n.a.
<0.1
<0.1
<0.1
<0.1
n.a.
n.a.
<0.1
0.0
<0.1
n.a.
n.a.
n.a.
Palau
n.a.
n.a.
n.a.
n.a.
n.a.
n.a.
n.a.
n.a.
n.a.
n.a.
n.a.
n.a.
n.a.
<0.1
0.0
n.a.
n.a.
n.a.
n.a.
Polynesia
n.a.
n.a.
n.a.
n.a.
n.a.
n.a.
n.a.
<0.1
<0.1
<0.1
<0.1
0.2
0.2
<0.1
0.0
<0.1
<0.1
<0.1
<0.1
| 152 |
American Samoa
n.a.
n.a.
n.a.
n.a.
n.a.
n.a.
n.a.
n.a.
n.a.
n.a.
n.a.
n.a.
n.a.
n.a.
n.a.
n.a.
n.a.
n.a.
n.a.
Cook Islands
n.a.
n.a.
n.a.
n.a.
n.a.
n.a.
n.a.
n.a.
n.a.
n.a.
n.a.
n.a.
n.a.
<0.1
0.0
n.a.
n.a.
<0.1
<0.1
<0.1
<0.1
n.a.
n.a.
n.a.
n.a.
n.a.
n.a.
n.a.
n.a.
n.a.
n.a.
n.a.
n.a.
n.a.
n.a.
n.a.
n.a.
n.a.
n.a.
n.a.
n.a.
n.a.
n.a.
n.a.
n.a.
n.a.
n.a.
n.a.
n.a.
n.a.
n.a.
<0.1
0.0
n.a.
n.a.
n.a.
n.a.
c
n.a.
<0.1
<0.1
<0.1
<0.1
<0.1
<0.1
<0.1
0.1
n.a.
n.a.
<0.1
<0.1
n.a.
n.a.
French Polynesia
Niue
Samoa
<0.1
<0.1
n.a.
<0.1
Tokelau (Associate
Member)
n.a.
n.a.
n.a.
n.a.
n.a.
n.a.
n.a.
n.a.
n.a.
n.a.
n.a.
n.a.
n.a.
n.a.
n.a.
n.a.
n.a.
n.a.
n.a.
Tonga
n.a.
n.a.
n.a.
<0.1c
n.a.
<0.1c
<0.1
<0.1
<0.1
<0.1
<0.1
<0.1
<0.1
<0.1
0.0
<0.1
n.a.
n.a.
n.a.
Tuvalu
n.a.
n.a.
n.a.
n.a.
n.a.
n.a.
n.a.
<0.1
<0.1
<0.1
<0.1
n.a.
n.a.
<0.1
0.0
<0.1
n.a.
n.a.
n.a.
NORTHERN
AMERICA AND
EUROPE
n.r.
n.r.
14.8
12.7
100.3
89.3
n.a.
2.8a
2.4a
5.9a
5.2a
216.2
237.2
33.7
36.2
n.a.
n.a.
0.9
0.9
c
Northern America**
n.r.
n.r.
3.6
3.0
35.4
28.6
<0.1
0.6
0.7
2.0
2.0
87.8
98.7
8.1
9.8
1.1
1.5
0.3
0.3
Bermuda
n.a.
n.a.
n.a.
n.a.
n.a.
n.a.
n.a.
n.a.
n.a.
n.a.
n.a.
n.a.
n.a.
n.a.
n.a.
n.a.
n.a.
n.a.
n.a.
Canada
n.r.
n.r.
0.2
0.3
1.8
2.2
c
n.a.
n.a.
n.a.
0.2
0.2
7.6
8.6
0.7
0.9
n.a.
n.a.
<0.1
<0.1
Greenland
n.a.
n.a.
n.a.
n.a.
n.a.
n.a.
n.a.
n.a.
n.a.
n.a.
n.a.
n.a.
n.a.
n.a.
n.a.
n.a.
n.a.
n.a.
n.a.
United States of
America
n.r.
n.r.
3.4c
2.7c
33.6c
26.5c
<0.1
0.6
0.6
1.8
1.7
80.2
90.1
7.4
8.9
1.0
1.4
0.3
0.3
c
c
c
2004–06 2018–204 2014–16 2018–20 2014–16 2018–20
(millions)
(millions)
(millions)
20205
2012
20206
2012
20206
(millions)
(millions)
(millions)
(millions)
(millions)
2012
2016
2012
2019
20127
NUMBER OF BABIES
WITH LOW
BIRTHWEIGHT
2012
2015
(millions)
(millions)
Europe
n.r.
n.r.
11.1
9.7
64.9
60.7
n.a.
2.1a
1.8a
3.9a
3.2a
128.4
138.4
25.5
26.5
n.a.
n.a.
0.5
0.5
Eastern Europe
n.r.
n.r.
4.3
4.3
32.9
33.5
n.a.
1.3
1.1
2.3
1.6
53.0
55.8
14.1
14.0
n.a.
n.a.
0.2
0.2
a
a
a
(millions)
20198
(millions)
a
(millions) (millions) (millions) (millions)
NUMBER OF
INFANTS 0–5
MONTHS OF AGE
EXCLUSIVELY
BREASTFED
NUMBER OF
WOMEN OF
REPRODUCTIVE AGE
(15–49) AFFECTED
BY ANAEMIA
NUMBER OF ADULTS
(18 YEARS AND
OLDER) WHO ARE
OBESE
NUMBER OF
CHILDREN (UNDER
5 YEARS OF AGE)
WHO ARE
OVERWEIGHT
NUMBER OF
CHILDREN (UNDER
5 YEARS OF AGE)
WHO ARE STUNTED
NUMBER OF
CHILDREN (UNDER
5 YEARS OF AGE)
AFFECTED BY
WASTING
NUMBER OF
MODERATELY OR
SEVERELY FOOD
INSECURE
PEOPLE 1, 2, 3
NUMBER OF
SEVERELY FOOD
INSECURE
PEOPLE 1, 2, 3
REGIONS/
SUBREGIONS/
COUNTRIES
NUMBER OF
UNDERNOURISHED
PEOPLE 1
TABLE A1.2 (CONTINUED)
(millions) (millions) (millions)
| 153 |
Belarus
n.r.
n.r.
n.a.
<0.1
<0.1
0.1
<0.1
1.8
1.9
0.5
0.4
<0.1
n.a.
<0.1
<0.1
Bulgaria
0.4
0.2
0.1
0.2
1.1
0.9
<0.1
<0.1
<0.1
<0.1
<0.1
1.4
1.5
0.4
0.4
n.a.
n.a.
<0.1
<0.1
Czechia
n.r.
n.r.
<0.1
<0.1
0.6
0.4
n.a.
<0.1
<0.1
<0.1
<0.1
2.1
2.3
0.5
0.5
n.a.
n.a.
<0.1
<0.1
Hungary
n.r.
n.r.
0.1
0.1
1.1
0.8
n.a.
n.a.
n.a.
n.a.
n.a.
2.0
2.1
0.5
0.4
n.a.
n.a.
<0.1
<0.1
Poland
n.r.
n.r.
0.7
0.2
3.4
2.2
n.a.
<0.1
<0.1
0.1
0.1
6.7
7.2
n.a.
n.a.
n.a.
n.a.
<0.1
<0.1
Republic of
Moldova
n.a.
n.a.
<0.1
0.2
0.8
1.1
n.a.
<0.1
<0.1
<0.1
<0.1
0.6
0.6
0.3
0.3
<0.1
n.a.
<0.1
<0.1
Romania
n.r.
n.r.
1.1
0.6
3.8
2.7
n.a.
0.1
0.1
0.1
0.1
3.4
3.6
1.1
1.0
n.a.
n.a.
<0.1
<0.1
Russian Federation
n.r.
n.r.
1.0
0.4
11.9
8.8
n.a.
n.a.
n.a.
n.a.
n.a.
25.7
26.9
7.3
7.2
n.a.
n.a.
0.1
0.1
Slovakia
0.3
0.2
<0.1
<0.1
0.3
0.3
Ukraine
n.r.
n.r.
0.9
1.1
Northern Europe
n.r.
n.r.
1.8
1.1
6.9
Denmark
n.r.
n.r.
<0.1
<0.1
0.3
c
c
n.a.
n.a.
n.a.
n.a.
n.a.
0.8
0.9
0.3
0.3
n.a.
n.a.
<0.1
<0.1
n.a.
0.5
0.3
0.7
0.4
8.5
8.8
1.6
1.8
0.1
n.a.
<0.1
<0.1
5.2
n.a.
0.2
0.2a
0.5
a
0.5
19.0
21.2
2.5
2.8
n.a.
n.a.
<0.1
<0.1
0.3
n.a.
n.a.
n.a.
n.a.
n.a.
0.8
0.9
0.1
0.2
n.a.
n.a.
<0.1
<0.1
a
a
Estonia
n.r.
n.r.
<0.1
<0.1
0.1
0.1
<0.1
<0.1
<0.1
<0.1
<0.1
0.2
0.2
0.1
0.1
n.a.
n.a.
<0.1
<0.1
Finland
n.r.
n.r.
0.1
0.1
0.5
0.4
n.a.
n.a.
n.a.
n.a.
n.a.
0.9
1.0
0.1
0.1
n.a.
n.a.
<0.1
<0.1
Iceland
n.r.
n.r.
<0.1
<0.1
<0.1
<0.1
n.a.
n.a.
n.a.
n.a.
n.a.
<0.1
0.1
<0.1
0.0
n.a.
n.a.
<0.1
<0.1
Ireland
n.r.
n.r.
0.2
0.2
0.4
0.4
n.a.
n.a.
n.a.
n.a.
n.a.
0.8
0.9
0.1
0.1
n.a.
n.a.
<0.1
<0.1
Latvia
n.r.
n.r.
<0.1
<0.1
0.2
0.2
n.a.
n.a.
n.a.
n.a.
n.a.
0.4
0.4
0.1
0.1
n.a.
n.a.
<0.1
<0.1
Lithuania
n.r.
n.r.
<0.1
<0.1
0.4
0.3
n.a.
n.a.
n.a.
n.a.
n.a.
0.6
0.6
0.1
0.1
n.a.
n.a.
<0.1
<0.1
Norway
n.r.
n.r.
<0.1
<0.1
0.2
0.2
n.a.
n.a.
n.a.
n.a.
n.a.
0.8
1.0
0.1
0.1
n.a.
n.a.
<0.1
<0.1
Sweden
n.r.
n.r.
<0.1
0.1
0.4
0.5
n.a.
n.a.
n.a.
n.a.
n.a.
1.4
1.6
0.3
0.3
n.a.
n.a.
<0.1
<0.1
United Kingdom of
Great Britain and
Northern Ireland
n.r.
n.r.
1.2
0.5
4.1
2.6
n.a.
n.a.
n.a.
n.a.
n.a.
12.9
14.6
1.4
1.7
n.a.
n.a.
<0.1
<0.1
2004–06 2018–204 2014–16 2018–20 2014–16 2018–20
(millions)
(millions)
2012
20206
2012
20206
(millions)
(millions)
(millions)
(millions)
2012
2016
2012
2019
(millions) (millions) (millions) (millions)
20127
(millions)
20198
NUMBER OF BABIES
WITH LOW
BIRTHWEIGHT
NUMBER OF
INFANTS 0–5
MONTHS OF AGE
EXCLUSIVELY
BREASTFED
NUMBER OF
WOMEN OF
REPRODUCTIVE AGE
(15–49) AFFECTED
BY ANAEMIA
NUMBER OF ADULTS
(18 YEARS AND
OLDER) WHO ARE
OBESE
NUMBER OF
CHILDREN (UNDER
5 YEARS OF AGE)
WHO ARE
OVERWEIGHT
NUMBER OF
CHILDREN (UNDER
5 YEARS OF AGE)
WHO ARE STUNTED
20205
(millions)
2012
2015
| 154 |
(millions)
(millions)
(millions)
Southern Europe
n.r.
n.r.
2.6
2.8
15.1
13.7
n.a.
0.3a
0.3a
0.6a
0.5a
25.6
27.5
4.8
5.0
n.a.
n.a.
0.1
<0.1
Albania
0.3
0.1
0.3
0.3
1.1
1.0
<0.1
<0.1
<0.1
<0.1
<0.1
0.4
0.5
0.2
0.2
<0.1
<0.1
<0.1
<0.1
Andorra
n.a.
n.a.
n.a.
n.a.
n.a.
n.a.
n.a.
n.a.
n.a.
n.a.
n.a.
n.a.
n.a.
<0.1
0.0
n.a.
n.a.
n.a.
n.a.
Bosnia and
Herzegovina
n.r.
n.r.
<0.1
<0.1
0.3
0.3
n.a.
<0.1
<0.1
<0.1
<0.1
0.5
0.5
0.2
0.2
<0.1
n.a.
<0.1
<0.1
Croatia
n.r.
n.r.
<0.1
<0.1
0.3
0.5
n.a.
n.a.
n.a.
n.a.
n.a.
0.8
0.8
0.2
0.2
n.a.
n.a.
<0.1
<0.1
Greece
n.r.
n.r.
0.3
0.2c,e
1.7
0.9c,e
n.a.
<0.1
<0.1
0.1
0.1
2.1
2.2
0.3
0.3
n.a.
n.a.
<0.1
<0.1
Italy
n.r.
n.r.
0.7
0.7
5.2
4.0
n.a.
n.a.
n.a.
n.a.
n.a.
9.3
10.1
1.6
1.7
n.a.
n.a.
<0.1
<0.1
Malta
n.r.
n.r.
<0.1
<0.1
<0.1
<0.1
n.a.
n.a.
n.a.
n.a.
n.a.
0.1
0.1
<0.1
0.0
n.a.
n.a.
<0.1
<0.1
Montenegro
(millions)
NUMBER OF
CHILDREN (UNDER
5 YEARS OF AGE)
AFFECTED BY
WASTING
NUMBER OF
MODERATELY OR
SEVERELY FOOD
INSECURE
PEOPLE 1, 2, 3
NUMBER OF
SEVERELY FOOD
INSECURE
PEOPLE 1, 2, 3
REGIONS/
SUBREGIONS/
COUNTRIES
NUMBER OF
UNDERNOURISHED
PEOPLE 1
TABLE A1.2 (CONTINUED)
(millions) (millions) (millions)
<0.1
n.r.
<0.1
<0.1
<0.1
<0.1
<0.1
<0.1
<0.1
<0.1
<0.1
0.1
0.1
<0.1
0.0
<0.1
n.a.
<0.1
<0.1
North Macedonia
0.1
<0.1
<0.1
0.1
0.3
0.4
<0.1
<0.1
<0.1
<0.1
<0.1
0.3
0.4
0.1
0.1
<0.1
n.a.
<0.1
<0.1
Portugal
n.r.
n.r.
0.4
0.3
1.5
1.2
<0.1
<0.1
<0.1
<0.1
<0.1
1.6
1.8
0.3
0.3
n.a.
n.a.
<0.1
<0.1
Serbia
n.r.
0.3
0.2
0.2
1.0
1.1
<0.1
<0.1
<0.1
0.1
<0.1
1.4
1.5
0.5
0.5
<0.1
<0.1
<0.1
<0.1
Slovenia
n.r.
n.r.
<0.1
<0.1
0.3
0.2
n.a.
n.a.
n.a.
n.a.
n.a.
0.3
0.3
0.1
0.1
n.a.
n.a.
<0.1
<0.1
Spain
n.r.
n.r.
0.5
0.9
3.3
4.1
n.a.
n.a.
n.a.
n.a.
n.a.
8.7
9.1
1.4
1.4
n.a.
n.a.
<0.1
<0.1
Western Europe
n.r.
n.r.
2.4
1.5
10.0
8.3
n.a.
0.3a
0.2a
0.5a
0.6a
30.8
33.9
4.1
4.8
n.a.
n.a.
0.1
0.1
Austria
n.r.
n.r.
<0.1
<0.1
0.5
0.3
n.a.
n.a.
n.a.
n.a.
n.a.
1.3
1.5
0.2
0.3
n.a.
n.a.
<0.1
<0.1
Belgium
n.r.
n.r.
n.a.
0.1
n.a.
0.4
<0.1
<0.1
<0.1
<0.1
<0.1
1.8
2.0
0.3
0.3
n.a.
n.a.
<0.1
<0.1
France
n.r.
n.r.
1.0
0.4
4.4
3.7
n.a.
n.a.
n.a.
n.a.
n.a.
10.0
10.9
1.2
1.5
n.a.
n.a.
<0.1
<0.1
Germany
n.r.
n.r.
0.8
0.6
3.3
2.9
<0.1
<0.1
0.1
0.1
0.2
14.0
15.3
1.7
2.0
n.a.
n.a.
<0.1
<0.1
Luxembourg
n.r.
n.r.
<0.1
<0.1
<0.1
<0.1
n.a.
n.a.
n.a.
n.a.
n.a.
0.1
0.1
<0.1
0.0
n.a.
n.a.
<0.1
<0.1
Netherlands
n.r.
n.r.
0.3
0.2
1.0
0.8
n.a.
<0.1
<0.1
<0.1
<0.1
2.5
2.8
0.4
0.5
n.a.
n.a.
<0.1
<0.1
Switzerland
n.r.
n.r.
0.1
<0.1
0.4
0.2
n.a.
n.a.
n.a.
n.a.
n.a.
1.2
1.3
0.2
0.2
n.a.
n.a.
<0.1
<0.1
TABLE A1.2 (CONTINUED)
NOTES:
1
Regional estimates were included when more than
50 percent of population was covered. To reduce
the margin of error, estimates are presented as
three-year averages.
2
FAO estimates of the number of people living in
households where at least one adult has been found
to be food insecure.
3
Country-level results are presented only for those
countries for which estimates are based on official
national data (see note c) or as provisional estimates,
based on FAO data collected through the Gallup ©
World Poll, for countries whose national relevant
authorities expressed no objection to their
publication. Note that consent to publication does
not necessarily imply validation of the estimate by
the national authorities involved and that the
estimate is subject to revision as soon as suitable
data from official national sources are available.
Global, regional and subregional aggregates are
based on data collected in approximately
150 countries.
4
The estimates for the year 2020 are the middle of
the projected range.
5
For regional estimates, values correspond to the
model predicted estimates for the year 2020. For
countries, the latest data available from 2014 to
2020 are used.
6
The collection of household survey data on child
height and weight were limited in 2020 due to the
physical distancing measures required to prevent the
spread of COVID-19. Only four national surveys
included in the database were carried out (at least
partially) in 2020. The estimates on child stunting,
wasting and overweight are therefore based almost
entirely on data collected before 2020 and do not
take into account the impact of the COVID-19
pandemic.
7
Regional estimates are included when more than
50 percent of population is covered. For countries,
the latest data available from 2005 to 2012 are used.
8
Regional estimates are included when more than
50 percent of population is covered. For countries,
the latest data available from 2014 to 2019 are used
with the exception of China where the latest data are
from the year 2013.
* Wasting under 5 years of age and low birthweight
regional aggregates exclude Japan.
** The Northern America wasting estimates are
derived applying mixed-effect models with
subregions as fixed effects; data were available only
for the United States of America, preventing the
estimation of standard errors (and confidence
intervals). Further details on the methodology are
described in De Onis, M., Blössner, M., Borghi, E.,
Frongillo, E.A. & Morris, R. 2004. Estimates of global
prevalence of childhood underweight in 1990 and
2015. Journal of the American Medical Association,
291(21): 2600–2606. Model selection is based on
best fit.
a
Consecutive low population coverage; interpret
with caution.
b
The Central Agency for Public Mobilization &
Statistics (CAPMAS) reports an estimate of severe
food insecurity of 1.3 percent for 2015, based on
HIECS data, using the WFP consolidated approach
for reporting indicators of food security. Note that
the two estimates are not directly comparable due to
different definitions of "severe food insecurity".
c
Based on official national data.
d
For years when official national data are not
available, the estimates are projected using FAO
data. See Annex 1B for further details.
e
Based on official national data collected in 2019
and 2020 through EU-SILC.
f
Most recent input data are from before 2000,
interpret with caution.
g
Pending review.
h
2020 estimate only.
<0.1 = less than 100 000 people.
n.a. = data not available.
n.r. = data not reported as the prevalence is less
than 2.5 percent.
| 155 |
ANNEX 1B
METHODOLOGICAL
NOTES FOR THE
FOOD SECURITY
AND NUTRITION
INDICATORS
UNDERNOURISHMENT
where θ is a vector of parameters that
characterizes the pdf. The distribution is
assumed to be lognormal, and thus fully
characterized by only two parameters: the mean
dietar y energ y consumption (DEC), and its
coefficient of variation (C V ).
Definition: Undernourishment is defined as the
condition of an individual whose habitual food
consumption is insufficient to provide, on
average, the amount of dietar y energ y required to
maintain a normal, active and healthy life.
Data source: Different data sources are used to
estimate the different parameters of the model.
How it is reported: The indicator is reported as a
prevalence and is denominated as “prevalence
of undernourishment” (PoU), which is an
estimate of the percentage of individuals in
the total population that are in a condition
of undernourishment. National estimates are
reported as three-year moving averages, to
control for the low reliabilit y of some of the
underlying parameters, such as the year-to-year
variation in food commodit y stocks, one of the
components of the annual FAO Food Balance
Sheets for which complete, reliable information
is ver y scarce. Regional and global aggregates,
on the other hand, are reported as annual
estimates, on account of the fact that possible
estimation errors are expected not to be
correlated across countries.
Minimum dietary energy requirement (MDER): Human
energ y requirements for an individual in a given
sex/age class are determined on the basis of
normative requirements for basic metabolic rate
(BMR) per kilogram of body mass, multiplied by
the ideal weights that a healthy person of that
sex/age class may have, given his or her height,
and then multiplied by a coefficient of physical
activit y level (PAL) to take into account physical
activit y. ar Given that both healthy BMIs and PALs
var y among active and healthy individuals of the
same sex and age, a range of energ y requirements
applies to each sex and age group of the
population. The MDER for the average individual
in the population, which is the parameter used
in the PoU formula, is obtained as the weighted
average of the lower bounds of the energ y
requirement ranges for each sex and age group,
using the shares of the population in each sex
and age group as weights.
Methodology: To compute an estimate of the
prevalence of undernourishment in a population,
the probabilit y distribution of habitual dietar y
energ y intake levels (expressed in kcal per
person per day) for the average individual is
modelled as a parametric probabilit y densit y
function (pdf ), f(x). 290,291 The indicator is
obtained as the cumulative probabilit y that the
habitual dietar y energ y intake (x) is below the
minimum dietar y energ y requirements (MDER)
(i.e. the lowest limit of the range of energ y
requirements for the population’s representative
average individual) as in the formula below:
Information on the population structure by
sex and age is available for most countries
in the world and for each year from the UN
Department of Economic and Social Affairs
(DESA) Population Prospects, revised ever y two
years. This edition of The State of Food Security
ar A person is considered healthy if his or her body mass index (BMI)
indicates neither underweight nor overweight. Human energy
requirement norms per kilogram of body mass are given in FAO and
WHO (2004). 86
PoU = ∫x< MDER f(x| θ )dx,
| 156 |
THE STATE OF FOOD SECURITY AND NUTRITION IN THE WORLD 2021
outlook exercises conducted by FAO to inform the
World Food Situation, 6 are used to nowcast the
2020 value of DEC for each countr y, starting from
the last available year in the FBS series.
and Nutrition in the World uses the 2019 revision
of the World Population Prospects. 168
Information on the median height in each sex and
age group for a given country is derived from a
recent demographic and health survey (DHS) or
from other surveys that collect anthropometry
data on children and adults. Even if such surveys
do not refer to the same year for which the PoU is
estimated, the impact of possible small intervening
changes in median heights over the years on PoU
estimates is expected to be negligible.
Coefficient of variation (CV): When reliable data
on food consumption are available from
aforementioned nationally representative
household sur veys, the C V due to income (C V|y)
that describes the distribution of average daily
dietar y energ y requirement in the population
can be estimated directly. Since the last edition
of this report, 21 new sur veys from the following
17 countries have been processed to update the
C V|y: Afghanistan, Armenia, Bolivia, Botswana,
Brazil, Burkina Faso, Ethiopia, Kiribati, Malawi,
Mongolia, Namibia, Nigeria, Pakistan, Rwanda,
Samoa, Solomon Islands and Uganda. That makes
for a total of 101 sur veys from 54 countries for
which C V|y is based on national sur veys.
Dietary energy consumption (DEC): Ideally, data on
food consumption should come from nationally
representative household sur veys (such as
Living Standard Measurement Sur veys or
Household Incomes and Expenditure Sur veys).
However, only ver y few countries conduct such
sur veys on an annual basis. Thus, in FAO’s PoU
estimates for global monitoring, DEC values
are estimated from the dietar y energ y supply
(DES) reported in the Food Balance Sheets (FBS),
compiled by FAO for most countries in the world
(see FAO, 2021). 5
When no suitable survey data are available,
FIES data collected by FAO since 2014 are used
to project the changes in the CV|y from 2015
(or from the year of the last food consumption
survey) up to 2019, based on a smoothed
(three-year moving average) trend in severe food
insecurity. For the nowcast of CV|y for 2020, see
Annex 2. Since 2014, FIES data provide evidence
on recent changes in the extent of severe food
insecurity that might closely reflect changes in
the PoU. To the extent that such changes in PoU
are not explained by changes in average food
supplies, they can thus be used to infer the likely
changes in the CV|y that might have occurred in
the most recent year. Analysis of the combined
set of historic PoU estimates reveals that, on
average, and once differences in DEC and MDER
have been controlled for, the CV|y explains about
one-third of the differences in PoU across time
and space. For each country for which FIES data
are available, the CV|y is estimated by the amount
that would generate one-third of a percentage
point change in the PoU for each observed
percentage point change in the prevalence of
severe food insecurity. For all other countries, the
CV|y is kept constant at the estimated 2017 value.
Since the last edition of this report, the new FBS
domain on FAOSTAT has been updated up to
2018. At the time of this report, the FBS series
were updated for the following 56 countries with
the largest number of undernourished people
or total population, bringing them up to date
through 2019: Afghanistan, Algeria, Angola,
Bangladesh, Bolivia (Plurinational State of ),
Burkina Faso, Cambodia, Cameroon, Central
African Republic, Chad, China (mainland),
Colombia, Congo, Côte d’Ivoire, Democratic
People’s Republic of Korea, Democratic Republic
of the Congo, Ecuador, Eswatini, Ethiopia,
Guatemala, Haiti, Honduras, India, Indonesia,
Iran (Islamic Republic of ), Iraq, Kenya,
Lao People’s Democratic Republic, Liberia,
Madagascar, Malawi, Mali, Mexico, Mongolia,
Mozambique, Myanmar, Nepal, Nigeria,
Pakistan, Papua New Guinea, Peru, Philippines,
Rwanda, Senegal, Sierra Leone, Somalia, South
Africa, Sri Lanka, Sudan, Thailand, Togo, United
Republic of Tanzania, Uzbekistan, Venezuela
(Bolivarian Republic of ), Viet Nam and Yemen.
In the FAO PoU parametric approach, the CV
due to body weight and lifestyle, a.k.a. CV due to
requirement (CV|r), represents the variability of
the distribution of dietary energ y requirements of
Estimates for the per capita average DES in 2020,
compiled on the basis of the short-run market
| 157 |
ANNEX 1B
the precision of the PoU estimates is generally
low. While it is not possible to formally compute
margins of error around PoU estimates, these are
expected to likely exceed 5 percent in most cases.
For this reason, FAO does not consider PoU
estimates that result to be lower than 2.5 percent
as sufficiently reliable to be reported.
a hypothetical average individual representative
of a healthy population, which is also equal to
the CV of the distribution of dietary energ y
intakes of a hypothetical average individual if the
population is perfectly nourished. The distribution
of dietary energ y requirements of a hypothetical
average individual can be assumed to be normal,
thus its variability can be estimated if at least
two percentiles and their values are known. As a
result, given that we are interested in deriving
the theoretical distribution of dietary energ y
requirements for healthy hypothetical average
individuals to estimate the CV|r, the MDER and
the average dietary energ y requirement (ADER)
can be used to approximate the 1st percentile
and the 50th percentile of the distribution of
energ y requirements of the hypothetical average
individual as they are built on the same principles
of a weighted average from sex-age-physiological
status groups. 7,8 Therefore, the value of CV|r
is derived as the inverse cumulative standard
normal distribution of the difference between
the MDER and the ADER. Similar to the MDER,
the ADER is estimated using the average of the
minimum and the maximum values of the PAL
category “Active or moderately active lifestyle”.
References:
FAO. 1996. Methodolog y for assessing food
inadequacy in developing countries. In FAO.
The Sixth World Food Survey, pp. 114–143. Rome.
FAO. 2003. Proceedings: Measurement and
Assessment of Food Deprivation and Undernutrition:
International Scientific Symposium. Rome.
FAO. 2014. Advances in hunger measurement:
traditional FAO methods and recent innovations.
FAO Statistics Division Working Paper
No. 14– 04. Rome.
Naiken, L. 2002. Keynote paper: FAO methodology
for estimating the prevalence of undernourishment.
Paper presented at the Measurement and
Assessment of Food Deprivation and
Undernutrition International Scientific
Symposium, Rome, 26 –28 June 2002. Rome, FAO.
Wanner, N., Cafiero, C., Troubat, N. & Conforti,
P. 2014. Refinements to the FAO methodology for
estimating the prevalence of undernourishment
indicator. Rome, FAO.
The total C V is then obtained as the geometric
mean of the C V|y and the C V|r:
FOOD INSECURITY AS MEASURED
BY THE FOOD INSECURITY EXPERIENCE
SCALE (FIES)
𝐶𝐶𝐶𝐶𝐶𝐶𝐶𝐶 = �(𝐶𝐶𝐶𝐶𝐶𝐶𝐶𝐶|𝑦𝑦𝑦𝑦)2 + (𝐶𝐶𝐶𝐶𝐶𝐶𝐶𝐶|𝑟𝑟𝑟𝑟)2
Challenges and limitations: While formally the state
of being undernourished or not is a condition
that applies to individuals, given
the−data
𝑃𝑃𝑃𝑃𝑗𝑗𝑗𝑗 � usually
exp�𝑎𝑎𝑎𝑎
𝑖𝑖𝑖𝑖
available
on a𝑖𝑖𝑖𝑖,𝑗𝑗𝑗𝑗large
scale,
𝑃𝑃𝑃𝑃𝑟𝑟𝑟𝑟𝑃𝑃𝑃𝑃𝑃𝑃𝑃𝑃�𝑋𝑋𝑋𝑋
= Yes�
= it is impossible to
𝑃𝑃𝑃𝑃𝑗𝑗𝑗𝑗 �
1 + exp�𝑎𝑎𝑎𝑎
reliably identif y which individuals
in 𝑖𝑖𝑖𝑖a−certain
group are actually undernourished. Through the
statistical model described above, the indicator
can only be computed with reference to a
population or a group of individuals for
which a representative sample is available.
𝐹𝐹𝐹𝐹𝐼𝐼𝐼𝐼𝐿𝐿𝐿𝐿 = ∑𝑝𝑝𝑝𝑝𝑖𝑖𝑖𝑖,𝐿𝐿𝐿𝐿 𝑤𝑤𝑤𝑤𝑖𝑖𝑖𝑖
The prevalence of undernourishment
is thus an
estimate of the percentage of individuals in that
group that are in such condition and cannot be
further disaggregated.
Definition: Food insecurit y as measured by this
indicator refers to limited access to food, at the
level of individuals or households, due to lack of
money or other resources. The severit y of food
insecurit y is measured using data collected with
the Food Insecurit y Experience Scale sur vey
module (FIES-SM), a set of eight questions
asking to self-report conditions and experiences
t y pically associated with limited access to
food. For purposes of annual SDG monitoring,
the questions are asked with reference to the
12 months preceding the sur vey.
Using sophisticated statistical techniques based
on the Rasch measurement model, the information
obtained in a survey is validated for internal
consistency and converted into a quantitative
measure along a scale of severity, ranging from
Due to the probabilistic
∑𝑐𝑐𝑐𝑐nature
FI𝐿𝐿𝐿𝐿,𝑐𝑐𝑐𝑐 ×of𝑁𝑁𝑁𝑁𝑐𝑐𝑐𝑐the inference
FI𝐿𝐿𝐿𝐿,𝑟𝑟𝑟𝑟of =uncertaint y associated with
and the margins
∑𝑐𝑐𝑐𝑐 𝑁𝑁𝑁𝑁𝑐𝑐𝑐𝑐
estimates of each of the parameters
in the model,
| 158 |
𝑀𝑀𝑀𝑀𝑀𝑀𝑀𝑀𝑀𝑀𝑀𝑀𝑀𝑀𝑀𝑀
THE STATE OF FOOD SECURITY AND NUTRITION IN THE WORLD 2021
larger samples of 9 350 individuals in India
(where a combination of CAPI and CATI was
implemented) and 5 500 in mainland China.
In 2020, additional oversampling was applied in
5 countries: Bangladesh (3 000), Eg y pt (2 000),
Russian Federation (4 000), Turkey (2 000) and
Viet Nam (2 000).
low to high. Based on their responses to the
FIES-SM items, the individuals or households
interviewed in a nationally representative survey
of the population are assigned a probability of
being in one of three classes: food secure or only
marginally insecure, moderately food insecure
and severely food insecure as defined by two
globally set thresholds. Based on FIES data
collected over three years from 2014 to 2016, FAO
has established the FIES reference scale, which is
used as the global standard for experience-based
food-insecurity measures, and to set the two
reference thresholds of severity.
Additionally to the GWP, in 2020 FAO collected
data in 20 countries through Geopoll ® with the
specific objective of assessing food insecurit y
during the COV ID-19 pandemic. The countries
covered were: Afghanistan, Burkina Faso,
Cameroon, Central African Republic, Chad,
Democratic Republic of the Congo, El Salvador,
Ethiopia, Guatemala, Haiti, Iraq, Liberia,
Mozambique, Myanmar, Niger, Nigeria, Sierra
Leone, Somalia, South Africa and Zimbabwe.
For all these countries, the 2020 assessment was
based on Geopoll data.
SDG Indicator 2.1.2 is obtained as the cumulated
probabilit y to be in the two classes of moderate
and severe food insecurit y. A separate indicator
(FI sev ) is computed by considering only the severe
food-insecurit y class.
How it is reported: In this report, FAO provides
estimates of food insecurit y at two different
levels of severit y: moderate or severe food
insecurit y (FI mod+sev ) and severe food insecurit y
(FI sev ). For each of these two levels, two estimates
are reported:
For Afghanistan, Angola, Armenia, Botswana,
Burkina Faso, Cabo Verde, Canada, Chile, Costa
Rica, Ecuador, Fiji, Ghana, Greece, Grenada,
Honduras, Indonesia, Israel, Kazakhstan,
Kenya, Kiribati, Kyrg yzstan, Lesotho, Malawi,
Mauritania, Mexico, Morocco, Namibia, Niger,
Nigeria, Palestine, Philippines, Republic of Korea,
Russian Federation, Saint Lucia, Samoa, Senegal,
Seychelles, Sierra Leone, South Sudan, Sudan,
Tonga, Uganda, United Republic of Tanzania,
United States of America, Vanuatu, Viet Nam
and Zambia, national government survey data
were used to calculate the prevalence estimates
of food insecurity by applying FAO’s statistical
methods to adjust national results to the same
global reference standard, covering approximately
a quarter of the world population. Countries are
considered for the year/years when national
data are available, informing the regional and
subregional aggregates assuming a constant
trend in the period 2014–2020, or integrating the
remaining years with GWP or Geopoll data in
case they were compatible. Exceptions to this rule
are: Armenia, Botswana, Burkina Faso, Chile,
Costa Rica, Ecuador, Ghana, Honduras, Indonesia,
Israel, Malawi, Namibia, Niger, Nigeria, Sierra
Leone, Uganda and Zambia. In these cases, the
following procedure was followed:
the prevalence (%) of individuals in the
population living in households where at least
one adult was found to be food insecure;
the estimated number of individuals in the
population living in households where at least
one adult was found to be food insecure.
Data source: Since 2014, the eight-question FIES
sur vey module has been applied in nationally
representative samples of the adult population
(defined as aged 15 or older) in more than
140 countries included in the Gallup © World
Poll (GWP), covering 90 percent of the world
population. In 2020, inter views were conducted
by telephone given the high risk of communit y
transmission from conducting face-to-face data
collection during the COV ID-19 pandemic.
By evaluating Dual Frame coverage (i.e.
the proportion of the adult population that is
covered by a combination of landline and mobile
phones), countries with a minimum of 70 percent
coverage were included as part of the 2020
World Poll though Computer Assisted Telephone
Inter viewing (CATI). In most countries,
samples include about 1 000 individuals, with
Use national data collected in one year to
inform the corresponding year.
| 159 |
ANNEX 1B
For the remaining years, apply the smoothed
trend coming from the data collected by
FAO through the Gallup © World Poll to the
national data to describe evolution over
time. Smoothed trend is computed by taking
the mean of the rates of change between
consecutive three-year averages.
As only individuals aged 15 or more are
sampled in the GWP, the prevalence estimates
directly produced from these data refer to the
population 15 years and older. To arrive at the
prevalence and number of individuals (of all ages)
in the population, an estimate is required of
the number of people living in the households
where at least one adult is estimated to be food
insecure. This involves a multistep procedure
detailed in Annex II of the Voices of the Hungry
Technical Report (see link in the “References”
section, below).
The motivation behind this procedure was
the strong evidence found in support of the
trend suggested by data collected by FAO (for
instance, evolution of povert y, extreme povert y,
employment, food inf lation, among others),
allowing to provide a more updated description
of the trend in the period 2014–2020.
Regional and global aggregates of food insecurit y
at moderate or severe, and severe levels, FI Lr, are
computed as:
In Indonesia, Kazakhstan, Kyrg yzstan, Mauritania,
Nicaragua, Paraguay, Rwanda, Seychelles, Sudan
and United Republic of Tanzania, due to lack of
data in 2020, the corresponding subregional trend
between 2019 and 2020 was used to inform 2020.
FI L,r =
∑ c Nc
where r indicates the region, FI L,𝑐 is the value
of FI at level L estimated for countr y c in the
region and N c is the corresponding population
size. When no estimate of FI L is available for
a countr y, it is assumed to be equal to the
population-weighted average of the estimated
values of the remaining countries in the same
region. A regional aggregate is produced only if
the countries for which an estimate is available
cover at least 50 rather than 80 percent of the
region’s population.
Methodology: The data were validated and used
to construct a scale of food-insecurit y severit y
using the Rasch model, which postulates that the
probabilit y of obser ving an affirmative answer by
respondent i to question j is a logistic function of
the distance, on an underlying scale of severit y,
between the position of the respondent, 𝑎 𝑖 , and
that of the item, 𝑏𝑗.
Prob(X i,j = Yes) =
∑ c FI L,c × N c
exp(a i – b j)
Universal thresholds are defined on the FIES
global standard scale (a set of item parameter
values based on results from all countries covered
by the GWP in 2014–2016) and converted into
corresponding values on local scales. The process
of calibrating each country’s scale against the FIES
global standard can be referred to as equating,
and permits the production of internationally
comparable measures of food-insecurity severity
for individual respondents, as well as comparable
national prevalence rates.
1 + exp(a i – b j)
By applying the Rasch model to the FIES data, it
is possible to estimate the probabilit y of being
food insecure (𝑝 i,L) at each level of severit y of
food insecurit y L (moderate or severe, or severe),
for each respondent i, with 0 < 𝑝 i,L < 1.
The prevalence of food insecurity at each level of
severit y (FI L) in the population is computed as
the weighted sum of the probabilit y of being food
insecure for all respondents (i) in a sample:
The problem stems from the fact that, when
defined as a latent trait, the severity of food
insecurity has no absolute reference against
which it could be evaluated. The Rasch model
enables identification of the relative position
that the various items occupy on a scale that is
denominated in logit units, but whose “zero”
is arbitrarily set, usually to correspond to the
FI L = ∑p i,L w i
where 𝑤 𝑖 are post-stratification weights
that indicate the proportion of indiv iduals
or households in the national population
represented by each record in the sample.
| 160 |
THE STATE OF FOOD SECURITY AND NUTRITION IN THE WORLD 2021
STUNTING, WASTING AND OVERWEIGHT
IN CHILDREN UNDER 5 YEARS OF AGE
mean estimated severity. This implies that the
zero of the scale changes in each application.
To produce comparable measures over time and
across different populations requires establishing
a common scale to use as a reference, and finding
the formula needed to convert measures across
different scales. As it is the case for converting
measures of temperature across difference
measuring scales (such as Celsius and Fahrenheit),
this requires the identification of a number of
“anchoring” points. In the FIES methodolog y,
these anchoring points are the severity levels
associated with the items whose relative position
on the scale of severity can be considered equal
to that of the corresponding items on the global
reference scale. The “mapping” of the measures
from one scale to the other is then obtained by
finding the formula that equates the mean and the
standard deviations (SD) of the common items’
severity levels.
Definition of stunting (children under 5 years of age):
Height/length (cm) for age (months) < -2 SD
of the W HO Child Growth Standards median.
Low height-for-age is an indicator that ref lects
the cumulative effects of undernutrition and
infections since and even before birth. It may be
the result of long-term nutritional deprivation,
recurrent infections and lack of water and
sanitation infrastructures.
How it is reported: The percentage of children
aged 0 –59 months who are below -2 SD from
the median height-for-age of the W HO Child
Growth Standards.
Definition of wasting: Weight (kg) for height/
length (cm) < -2 SD of the W HO Child Growth
Standards median. Low weight-for-height is an
indicator of acute weight loss or a failure to gain
weight and can be consequence of insufficient
food intake and/or an incidence of infectious
diseases, especially diarrhoea.
Challenges and limitations: When food-insecurit y
prevalence estimates are based on FIES data
collected in the GWP, with national sample sizes
of about 1 000 in most countries, confidence
inter vals rarely exceed 20 percent of the
measured prevalence (that is, prevalence rates of
50 percent would have margins of error of up to
plus or minus 5 percent). Confidence inter vals
are likely to be much smaller, however, when
national prevalence rates are estimated using
larger samples and for estimates referring to
aggregates of several countries. To reduce the
impact of year-to-year sampling variabilit y,
countr y-level estimates are presented as
three-year averages, computed as averages of all
available years in the considered triennia.
How it is reported: The percentage of children aged
0 –59 months who are below -2 SD from the
median weight-for-height of the W HO Child
Growth Standards.
Definition of overweight: Weight (kg) for height/
length (cm) > +2 SD of the W HO Child Growth
Standards median. This indicator ref lects
excessive weight gain for height generally
due to energ y intakes exceeding children’s
energ y requirements.
References:
Gallup. 2020. Gallup Keeps Listening to the
World Amid the Pandemic. In: Gallup [online].
[Cited 25 May 2021]. https://news.gallup.com/
opinion/gallup/316016/gallup-keeps-listening-wo
rld-amid-pandemic.aspx
FAO. 2016. Methods for estimating comparable rates
of food insecurity experienced by adults throughout
the world. Rome. (also available at w w w.fao.
org/3/a-i4830e.pdf ).
FAO. 2018. Voices of the Hungr y. In: FAO
[online]. Rome. [Cited 28 April 2020]. w w w.fao.
org/in-action/voices-of-the-hungr y
How it is reported: The percentage of children aged
0 –59 months who are above +2 SD from the
median weight-for-height of the W HO Child
Growth Standards.
Data source: UNICEF, W HO & World Bank.
2021. UNICEF-W HO-World Bank: Joint child
malnutrition estimates - Levels and trends
(2021 edition) [online]. https://data.unicef.org/
resources/jme-report-2021, w w w.who.int/data/
gho/data/themes/topics/joint-child-malnutrit
ion-estimates-unicef-who-wb, https://datatopics.
worldbank.org/child-malnutrition
| 161 |
ANNEX 1B
Methodology:
For stunting and overweight, the JME country
dataset is used to generate country-modelled
estimates which serve as the official JME estimates
(i.e. the stunting prevalence from a household
survey for a given country in a given year is not
reported as the prevalence for that country in that
year; rather, it feeds into the modelled estimates
described in the next section below).
Country-level estimates
The UNICEF/WHO-World Bank Group Joint Child
Malnutrition Estimates (JME) country dataset
The UNICEF/W HO-World Bank Group JME
dataset of countr y estimates requires the
collection of national data sources that contain
information on child malnutrition – specifically,
data on the height, weight and age of children
under 5, which can be used to generate national
level prevalence estimates for stunting, wasting
and overweight. These national-level data sources
are mainly comprised of household sur veys (e.g.
Multiple Indicator Cluster Sur veys, Demographic
and Health Sur veys). Some administrative data
sources (e.g. from sur veillance systems) are also
included where population coverage is high.
As of the latest review closure on 31 Januar y
2021, the primar y source dataset contained
997 data sources from 157 countries and
territories, with nearly 80 percent of children
living in countries with at least one data point
within the past five years on stunting, wasting
and overweight. This suggests that the global
estimates are highly representative of the
majorit y of children across the globe for the most
recent period. The dataset contains the point
estimate (and where available, the standard
error), the 95 percent confidence bounds and the
unweighted sample size. Where microdata are
available, the JME uses estimates that have been
recalculated to adhere to the global standard
definition. Where microdata are not available,
reported estimates are used, except in cases
where adjustments are required to standardize
for: (i) use of an alternate growth reference
from the 2006 W HO Growth Standards; (ii) age
ranges that do not include the full 0 –59-month
age group; and (iii) data sources that were only
nationally representative for populations residing
in rural areas. Further details related to data
source compilation, re-analysis of microdata, and
data source review are described elsewhere. 9
Country-level model for stunting and
overweight estimates
The technical details of the statistical models are
provided elsewhere. 9 Briefly, for both stunting
and overweight, prevalence was modelled at logit
(log-odds) scale using a penalized longitudinal
mixed-model with a heterogeneous error term.
The quality of the models was quantified with
model-fit criteria that balance the complexity
of the model with the closeness of the fit to
the observed data. The proposed method has
important characteristics, including non-linear
time trends, regional trends, country-specific
trends, covariate data and a heterogeneous
error term. All countries with data contribute to
estimates of the overall time trend and the impact
of covariate data on prevalence. For overweight,
the covariate data consisted of linear and quadratic
socio-demographic index (SDI), as and data source
type. The same covariates were used for stunting,
plus an additional covariate of the average health
system access over the previous five years.
Annual countr y-level modelled estimates from
2000 to 2020 at on stunting and overweight
were disseminated by the JME in 2021 for
155 countries with at least one data point
(e.g. from a household sur vey) included in
the JME countr y dataset described above.
Modelled countr y estimates were also produced
for an additional 49 countries, used solely for
as SDI is a summary measure that identifies where countries or other
geographic areas sit on the spectrum of development. Expressed on a
scale of 0 to 1, SDI is a composite average of the rankings of the income
per capita, average educational attainment, and fertility rates of all
areas in the Global Burden of Disease study.
The JME country dataset serves different purposes
for different indicators. For wasting, the JME
country dataset serves as the country estimates
themselves (i.e. the wasting prevalence in the
JME country dataset from a household survey
for a country in a given year is the wasting
prevalence reported for that country in that year).
at The collection of household survey data on child height and weight
were limited in 2020 due to the physical distancing measures required
to prevent the spread of COVID-19. Only four national surveys included
in the JME database were carried out (at least partially) in 2020. The
JME estimates on child stunting, wasting and overweight are therefore
based almost entirely on data collected before 2020 and do not take
into account the impact of the COVID-19 pandemic. However, one of the
covariates used in the country stunting and overweight models takes the
impact of COVID-19 partially into account.
| 162 |
THE STATE OF FOOD SECURITY AND NUTRITION IN THE WORLD 2021
generation of regional and global aggregates.
Modelled estimates for these 49 countries are not
shown because they did not have any household
sur veys in the JME countr y dataset or because
the modelled estimates remained pending final
review at the time of publication. The results
for the 204 countries can be used to calculate
estimates and uncertaint y inter vals for any
group of countries aggregated. The uncertaint y
inter vals are important in monitoring trends,
especially for countries with sparse data and
where primar y data sources present large
primar y data source sampling errors. When only
sparse data are available in the most recent
period, the inclusion of a sur vey can affect a
substantial change in the predicted trajector y.
For this reason, uncertaint y inter vals are needed
to enhance trend interpretabilit y in terms of
the caution level employed. The uncertaint y
inter vals for the new JME method have been
tested and validated with various data t ypes.
related diseases that can affect nutrition status).
Given that countr y sur veys can be collected
during any season, the prevalence estimate from
any sur vey may be at a high or low; or it may fall
somewhere in between if data collection spanned
across several seasons. Thus, the prevalence
of wasting captures the situation of wasting at
a specific point in time and not over an entire
year. Variations in seasons across sur veys make
it difficult to draw inferences on trends. The lack
of methods to account for seasonalit y and
incident cases of wasting are the main reasons
why the JME does not present annual trends for
this form of malnutrition.
Generation of regional and global estimates
Different methods were applied to generate
regional and global estimates for stunting
and overweight compared to wasting, as
described below. In short, results from the new
countr y-level model were used to generate
the regional and global estimates for stunting
and overweight, while the JME subregional
multi-level model was used to generate the
global and regional estimates for wasting.
Regional and global estimates
Regional and global wasting estimates are
only presented for the most recent year, 2020,
unlike stunting and overweight estimates for
which an annual time series is available from
2000 to 2020. au This is because the JME are
based on national-level countr y prevalence
data, which come from cross-sectional sur veys
(i.e. a snapshot at one point in time) that are
collected infrequently (ever y three to five years)
in most countries. Since stunting and overweight
are relatively stable over the course of a calendar
year, it is reasonable to track changes in these
two conditions over time with these data,
whereas wasting is an acute condition that can
change frequently and rapidly. An individual
child can be affected by wasting more than
once in a calendar year (i.e. can recover but
then become wasted again in the same year),
and the risk of wasting in many contexts can be
driven by seasonal variations, which can result
in seasonal spikes in prevalence. For example,
wasting prevalence, in some contexts, may
double between the post-har vest season (often
associated with higher food availabilit y and
weather patterns that are less likely to cause
disease) and the pre-har vest season (often
associated with food shortages, heav y rains and
au
Stunting and overweight
Global and regional estimates for all years from
2000 to 2020 av were derived as the respective
countr y averages weighted by the countries’
under-five population from The United Nations
World Population Prospects, 2019 Revision,
using model-based estimates for 204 countries.
This includes 155 countries with national data
sources (e.g. household sur veys) included in the
JME countr y dataset described above. It also
includes 49 countries with modelled estimates
generated for development of regional and global
aggregates, but for which countr y modelled
estimates are not shown because they did not
have any household sur veys in the JME countr y
dataset or because the modelled estimates
remained pending final review at the time of
publication. Confidence inter vals were generated
based on bootstrapping methodolog y.
Wasting
The wasting prevalence data from national data
sources described in the above section about the
JME countr y dataset were used to generate the
See footnote at.
av
| 163 |
See footnote at.
ANNEX 1B
regional and global estimates for the year 2020 aw
using the JME subregional multi-level model,
applying population weights for children under
5 years of age from the United Nations World
Population Prospects, 2019 Revision.
UNICEF, W HO & World Bank. 2021.
UNICEF-W HO-World Bank: Joint child malnutrition
estimates - Levels and trends (2021 edition)
[online]. https://data.unicef.org/resources/
jme-report-2021, w w w.who.int/data/gho/data/
themes/topics/joint-child-malnutrition-estima
tes-unicef-who-wb, https://datatopics.worldbank.
org/child-malnutrition
UNICEF, W HO & World Bank. 2021. Technical
notes from the background document for
country consultations on the 2021 edition of the
UNICEF-W HO-World Bank Joint Malnutrition
Estimates. SDG Indicators 2.2.1 on stunting, 2.2.2a
on wasting and 2.2.2b on overweight. New York,
USA, UNICEF. (also available at data.unicef.org/
resources/jme-2021-countr y-consultations).
W HO. 2014. Comprehensive Implementation Plan
on maternal, infant and young child nutrition.
Geneva, Switzerland. w w w.who.int/nutrition/
publications/CIP_document/en
W HO. 2019. Nutrition Landscape Information
System (NLIS) country profile indicators:
interpretation guide. Geneva, Switzerland.
(also available at w w w.who.int/publications/i/
item/9789241516952).
Challenges and limitations: The recommended
periodicit y for countries to report on stunting,
overweight and wasting is ever y three to five
years; however, for some countries, data are
available less frequently. While ever y effort has
been made to maximize the comparabilit y of
statistics across countries and over time, countr y
data may differ in terms of data collection
methods, population coverage and estimation
methods used. Sur vey estimates come with
levels of uncertaint y due to both sampling errors
and non-sampling errors (technical measurement
errors, recording errors, etc.). Neither of the
two sources of error has been fully taken into
account for deriving estimates at countr y or
regional and global levels.
For the prevalence of wasting, as sur veys are
generally carried out during a specific period
of the year, the estimates can be affected by
seasonalit y. Seasonal factors related to wasting
include food availabilit y (e.g. pre-har vest periods)
and disease (rainy season and diarrhoea, malaria,
etc.), while natural disasters and conf licts can
also show real shifts in trends that would need to
be treated differently than a seasonal variation.
Hence, countr y year estimates for wasting
may not necessarily be comparable over time.
Consequently, only estimates from the most
recent year (2020 ax) are provided.
EXCLUSIVE BREASTFEEDING
Definition: Exclusive breastfeeding for infants
<6 months of age is defined as receiving only
breastmilk and no additional food or drink,
not even water. Exclusive breastfeeding is a
cornerstone of child sur vival and is the best food
for newborns, as breastmilk shapes the baby’s
microbiome, strengthens the immune system and
reduces the risk of developing chronic diseases.
References:
de Onis, M., Blössner, M., Borghi, E., Morris,
R. & Frongillo, E.A. 2004. Methodolog y for
estimating regional and global trends of child
malnutrition. International Journal of Epidemiology,
33(6): 1260–1270. https://doi.org/10.1093/ije/dyh202
GBD 2019 Risk Factors Collaborators.
2020. Global burden of 87 risk factors in 204
countries and territories, 1990 –2019: a systematic
analysis for the Global Burden of Disease Study
2019. The Lancet, 396(10258): 1223 –1249.
https://doi.org/10.1016/s0140-6736(20)30752-2
aw
See footnote at.
ax
See footnote at.
Breastfeeding also benefits mothers by preventing
postpartum haemorrhage and promoting uterine
involution, decreasing risk of iron-deficiency
anaemia, reducing the risk of various types of
cancer and providing psychological benefits.
How it is reported: Percentage of infants aged
0 –5 months who are fed exclusively on breastmilk
with no additional food or drink, not even water,
in the 24 hours preceding the sur vey. 10
Data source: UNICEF. 2020. Infant and young child
feeding. In: UNICEF [online]. New York, USA.
[Cited 19 April 2021] . data.unicef.org/topic/
nutrition/infant-and-young-child-feeding
| 164 |
THE STATE OF FOOD SECURITY AND NUTRITION IN THE WORLD 2021
References:
UNICEF. 2020. Infant and young child
feeding: exclusive breastfeeding. In: UNICEF
Data: Monitoring the Situation of Children and
Women [online]. New York, USA. [Cited 19
April 2021]. data.unicef.org/topic/nutrition/
infant-and-young-child-feeding
W HO. 2014. Comprehensive Implementation Plan
on maternal, infant and young child nutrition.
Geneva, Switzerland. w w w.who.int/nutrition/
publications/CIP_document/en
W HO. 2019. Nutrition Landscape Information
System (NLIS) country profile indicators:
interpretation guide. Geneva, Switzerland.
(also available at w w w.who.int/publications/i/
item/9789241516952).
W HO and UNICEF. 2021. Indicators for assessing
infant and young child feeding practices: definitions
and measurement methods.
Methodology:
Infants 0 –5 months of age who received only
breastmilk during the previous day
Infants 0 –5 months of age
This indicator includes breastfeeding by a wet
nurse and feeding expressed breastmilk.
The indicator is based on a recall of the previous
day’s feeding to a cross-section of infants 0 –5
months of age.
In 2012, the regional and global exclusive
breastfeeding estimates were generated using
the most recent estimate available for each
countr y between 2005 and 2012. Similarly, 2019
estimates were developed using the most recent
estimate available for each countr y between 2014
and 2019. Global and regional estimates were
calculated as weighted averages of the prevalence
of exclusive breastfeeding in each countr y,
using the total number of births from the World
Population Prospects, 2019 revision (2012 for the
baseline and 2019 for the current) as weights.
Estimates are presented only where the available
data are representative of at least 50 percent of
corresponding regions’ total number of births,
unless otherwise noted.
LOW BIRTHWEIGHT
Definition: Low birthweight is defined as a weight
at birth of less than 2 500 g (less than 5.51 lbs),
regardless of gestational age. A newborn’s weight
at birth is an important marker of maternal and
foetal health and nutrition. 11
How it is reported: The percentage of newborns
weighing less than 2 500 g (less than 5.51 lbs)
at birth.
Challenges and limitations: While a high proportion of
countries collect data for exclusive breastfeeding,
data are lacking in high-income countries in
particular. The recommended periodicit y of
reporting on exclusive breastfeeding is ever y
three to five years. However, for some countries,
data are reported less frequently, meaning
changes in feeding patterns are often not
detected for several years after the change occurs.
Data source: UNICEF & W HO.
2019. UNICEF-W HO joint low birthweight
estimates. In: United Nations Children’s
Fund [online]. New York, USA and Geneva,
Switzerland. [Cited 28 April 2020]. w w w.unicef.
org/reports/UNICEF-W HO-low-birthweight-esti
mates-2019, w w w.who.int/nutrition/publications/
UNICEF-W HO-lowbirthweight-estimates-2019
Methodology: Nationally representative estimates of
low birthweight prevalence can be derived from
a range of sources, broadly defined as national
administrative data or representative household
surveys. National administrative data are those
coming from national systems including Civil
Registration and Vital Statistics (CRVS) systems,
national Health Management Information Systems
(HMIS) and birth registries. National household
surveys which contain information about
birthweight as well as key related indicators
Regional and global averages may be affected
depending on which countries had data available
for the periods considered in this report.
Using the previous day’s feeding as a basis may
cause the proportion of exclusively breastfed
infants to be overestimated, as some infants
who may have been given other liquids or foods
irreg ularly may not have received these on the
day before the sur vey.
| 165 |
ANNEX 1B
≥1 low birthweight data point from any source
meeting inclusion criteria are fitted into a
model using covariates to generate annual low
birthweight estimates, as well as uncertaint y
ranges, using a bootstrap approach. The model
includes natural log of neonatal mortalit y
rate; the proportion of children underweight
(weight-for-age z score below -2 SD from
median weight for age of reference population);
data t y pe (higher qualit y administrative, lower
qualit y administrative, household sur vey); UN
region (e.g. Southern Asia, Caribbean); and
a countr y-specific random effect. These low
birthweight estimates may var y substantially
from estimates reported by countries in
administrative and sur vey reports, especially
given that the household sur vey estimates
are adjusted for missing birthweights and
heaping, while sur vey reports often present a
low birthweight estimate just for the children
with a birthweight and with no adjustment for
data heaping.
No estimate: countries for which low birthweight
input data were not available and/or did not
meet inclusion criteria are indicated in the
database as “no estimate”. A total of 54 countries
in the current country database were reported
as having “no estimate”. Despite not presenting
an estimate for these individual 54 countries,
annual low birthweight estimates were derived
for them using the hierarchical regression
methods detailed above but used only to input
into regional and global estimates.
including maternal perception of size at birth
(MICS, DHS) are also an important source of low
birthweight data especially in contexts where
many births are unweighted and/or data heaping
is a problem. Prior to entry into the country
dataset, country data are reviewed for coverage
and quality and adjusted where the source is
a household survey. Administrative data are
categorized as (i) high coverage, if representing
≥90 percent of live births; (ii) medium coverage,
if representing between 80 and 90 percent of live
births; or (iii) not included, if covering <80 percent
of live births. To be included in the dataset, survey
data need to have:
i.
a birthweight in the dataset for at minimum
30 percent of the sample;
ii. a minimum of 200 birthweights in the dataset;
iii. no indication of severe data heaping – this
means that: a) ≤55 percent of all birthweights
can fall on the three most frequent
birthweights (i.e. if 3 000 g, 3 500 g and 2 500
g were the three most frequent birthweights,
when added together, they have to make
up ≤55 percent of all birthweights in the
dataset); b) ≤10 percent of all birthweights are
≥4 500 g; c) ≤5 percent of birthweights fall on
tail ends of 500 g and 5 000 g; and
iv. undergone an adjustment for missing
birthweights and heaping. 12
Modelling methods were applied to the accepted
(and for household sur vey data, accepted and
adjusted) countr y data to generate annual
countr y estimates from 2000 to 2015, with
methods var ying by availabilit y and t ype of input
data as follows:
Modelled annual countr y estimates are used
to generate regional and global estimates from
2000 –2015. Global estimates are derived by
summing the estimated number of live births
weighing less than 2 500 g for 195 ay countries
with an estimate in the United Nations regional
grouping for each year, and then dividing by all
live births in each year in those 195 countries.
Regional estimates are similarly derived,
based on countries in each regional grouping.
To obtain the global and regional level estimates
of uncertaint y, 1 000 low birthweight point
b-spline: data for countries with ≥8 data points
from higher coverage administrative sources
≥1 point prior to 2005 and ≥1 point more
recent than 2010 are smoothed with b-spline
regression to generate annual low birthweight
estimates. A b-spline regression model
was used to predict the standard error and
calculate 95 percent confidence inter vals for
the countr y-level low birthweight estimates.
These low birthweight estimates follow ver y
closely those included in the countries’ own
administrative reports.
Hierarchical regression: data for countries not
meeting requirements for b-spline but with
ay While the world comprises 202 countries (as per the full set of
countries in the regional grouping with the largest set of countries – i.e.
the UNICEF regional grouping), seven countries did not have low
birthweight input data or covariate data. It was therefore not possible to
generate any estimates for these seven countries and they are not
included in the regional and global estimates.
| 166 |
THE STATE OF FOOD SECURITY AND NUTRITION IN THE WORLD 2021
S. 2019. National, regional, and worldwide
estimates of low birthweight in 2015, with trends
from 2000: a systematic analysis. The Lancet
Global Health, 7(7): e849–e860.
estimates were made for each countr y for each
year using either b-spline (by randomly sampling
from a normal distribution plotted using the
calculated standard error) or hierarchical
regression approach (using a bootstrap approach).
The countr y low birthweight estimates for each
of the 1 000 samples were summed at worldwide
or regional level and the 2.5th and 97.5th centiles
of the resulting distributions were used as the
confidence inter vals.
ADULT OBESITY
Definition: BMI ≥ 30.0 kg/m 2 . The body mass index
(BMI) is the ratio of weight-to-height commonly
used to classif y the nutritional status of adults.
It is calculated as the body weight in kilograms
divided by the square of the body height in
metres (kg/m 2). Obesit y includes individuals with
BMI equal to or higher than 30 kg/m 2 .
Challenges and limitations: A major limitation
of monitoring low birthweight globally is
the lack of birthweight data for many of the
world’s children. There is a notable bias among
the unweighted, with those born to poorer,
less-educated, rural mothers being less likely
to have a recorded birthweight when compared
to their richer, urban counterparts with more
highly educated mothers. 13 As the characteristics
of the unweighted are risk factors for having
a low birthweight, estimates that do not well
represent these children may be lower than the
true value. Furthermore, poor qualit y of available
data with regard to excessive heaping on
multiples of 500 g or 100 g exists in the majorit y
of available data from LMICs 13 and can further
bias low birthweight estimates. The methods
applied to adjust for missing birthweights and
heaping for sur vey estimates in the current
database 295 are meant to address the problem;
however, there were a total of 54 countries for
which it was not possible to generate a reliable
birthweight estimate. In addition, the confidence
limits of the regional and global estimates may
be artificially small given that about half of
the modelled countries had a countr y-specific
effect generated at random for each bootstrap
prediction, some of which were positive and
others negative, making the relative uncertaint y
at the regional and global level tend to be less
than that at the individual countr y level.
How it is reported: Percentage of population over 18
years of age with BMI ≥ 30.0 kg/m 2 standardized
by age and weighted by sex. 14
Data source: W HO. 2020. Global Health
Obser vator y (GHO) data repositor y.
In: World Health Organization [online].
Geneva, Switzerland. [Cited 28 April 2020]. apps.
who.int/gho/data/node.main.A900A?lang=en
(1 698 population-based studies with more than
19.2 million participants aged 18 years or older,
measured in 186 countries). 15
Methodology: A Bayesian hierarchical model was
applied to selected population-based studies
that had measured height and weight in adults
aged 18 years and older to estimate trends from
1975 to 2014 in mean BMI and in the prevalence
of BMI categories (underweight, overweight
and obesit y). The model incorporated nonlinear
time trends and age patterns; national versus
subnational and communit y representativeness;
and whether data covered both rural and urban
areas versus only one of them. The model
also included covariates that help predict
BMI, including national income, proportion of
population living in urban areas, mean number
of years of education and summar y measures
of availabilit y of different food t y pes for
human consumption.
References:
Blanc, A. & Wardlaw, T. 2005. Monitoring low
birth weight: An evaluation of international
estimates and an updated estimation procedure.
Bulletin World Health Organization, 83(3): 178 –185.
Blencowe, H., Krasevec, J., de Onis, M.,
Black, R.E., An, X., Stevens, G.A., Borghi, E.,
Hayashi, C., Estevez, D., Cegolon, L., Shiekh,
S., Ponce Hardy, V., Lawn, J.E. & Cousens,
Challenges and limitations: Some countries had few
data sources and only 42 percent of included
sources reported data for people older than
70 years.
| 167 |
ANNEX 1B
References:
NCD Risk Factor Collaboration (NCD-RisC).
2016. Trends in adult body-mass index in 200
countries from 1975 to 2014: a pooled analysis of
1698 population-based measurement studies with
19.2 million participants. The Lancet, 387(10026):
1377–1396.
W HO. 2019. Nutrition Landscape Information
System (NLIS) country profile indicators:
interpretation guide. Geneva, Switzerland.
(also available at w w w.who.int/publications/i/
item/9789241516952).
W HO regional and countr y offices, United
Nations organizations, ministries of health,
research and academic institutions, and
non-governmental organizations. In addition,
anonymized individual-level data are obtained
from multi-countr y sur veys, including
demographic and health sur veys, multiple
indicator cluster sur veys, reproductive health
sur veys and malaria indicator sur veys.
The 2021 edition of anaemia estimates in
women of reproductive age, by pregnancy
status, included 489 data sources spanning
1995 –2020. Adjustments of data on blood
haemoglobin concentrations for altitude and
smoking were carried out whenever possible.
Biologically implausible haemoglobin values
(<25 g/L or >200 g/L) were excluded. A Bayesian
hierarchical mixture model was used to estimate
haemoglobin distributions and systematically
address missing data, non-linear time trends,
and representativeness of data sources.
Brief ly, the model calculates estimates for
each countr y and year, informed by data from
that countr y and year themselves, if available,
and by data from other years in the same
countr y and in other countries with data for
similar time periods, especially countries in
the same region. The model borrows data, to a
greater extent, when data are non-existent or
weakly informative, and to a lesser extent for
data-rich countries and regions. The resulting
estimates are also informed by covariates that
help predict blood haemoglobin concentrations
(e.g. socio-demographic index, meat supply
[kcal/capita], mean BMI for women and log
of under-five mortalit y for children). 299 The
uncertaint y ranges (credibilit y inter vals) ref lect
the major sources of uncertaint y, including
sampling error, non-sampling error due to issues
in sample design/measurement, and uncertaint y
from making estimates for countries and years
without data.
ANAEMIA IN WOMEN OF
REPRODUCTIVE AGE
Definition: Percentage of women aged 15−49 years
with a haemoglobin concentration less than
120 g/L for non-pregnant women and lactating
women, and less than 110 g/L for pregnant
women, adjusted for altitude and smoking.
How it is reported: Percentage of women of
reproductive age (15 to 49 years old) with
haemoglobin concentration below 110 g/L
for pregnant women and below 120 g/L for
non-pregnant women.
Data source:
W HO. 2021. Vitamin and Mineral Nutrition
Information System ( V MNIS). In: W HO [online].
Geneva, Switzerland. [Cited 25 May 2021]. w w w.
who.int/teams/nutrition-food-safet y/databases/
vitamin-and-mineral-nutrition-informat
ion-system
W HO. 2021. Global anaemia estimates, Edition
2021. In: Global Health Observatory (GHO)
data repository [online]. Geneva, Switzerland.
[Cited 25 May 2021]. w w w.who.int/data/
gho/data/indicators/indicator-details/
GHO/prevalence-of-anaemia-in-wo
men-of-reproductive-age-(-)
Methodology: The preferable source of data is
population-based sur veys. Data were taken
from the Micronutrients Database of the
W HO Vitamin and Mineral Information
System ( V MNIS). This database compiles and
summarizes data on the micronutrient status
of populations from various other sources,
including data collected from the scientific
literature and through collaborators, including
Challenges and limitations: Despite a high proportion
of countries having nationally representative
sur vey data available for anaemia, there is still a
lack of reporting on this indicator, especially in
high-income countries. As a result, the estimates
may not capture the full variation across
countries and regions, thus tending to “shrink”
towards global means when data are sparse.
| 168 |
THE STATE OF FOOD SECURITY AND NUTRITION IN THE WORLD 2021
References:
Stevens, G.A., Finucane, M.M., De-Regil,
L.M., Paciorek, C.J., Flaxman, S.R., Branca,
F., Peña-Rosas, J.P., Bhutta, Z.A. & Ezzati, M.
2013. Global, regional, and national trends in
haemoglobin concentration and prevalence of
total and severe anaemia in children and pregnant
and non-pregnant women for 1995–2011:
a systematic analysis of population-representative
data. The Lancet Global Health, 1(1): e16 –e25.
W HO. 2014. Comprehensive Implementation Plan
on maternal, infant and young child nutrition.
Geneva, Switzerland.
W HO. 2021. Nutrition Landscape Information
System (NLiS) Countr y Profile. In: W HO [online].
Geneva, Switzerland. [Cited 10 May 2021]. w w w.
who.int/data/nutrition/nlis/countr y-profile
W HO. 2021. Vitamin and Mineral Nutrition
Information System ( V MNIS). In: W HO [online].
Geneva, Switzerland. [Cited 10 May 2021].
w w w.who.int/teams/nutrition-food-safet y/
databases/vitamin-and-mineral-nutrition-inform
ation-system
W HO. 2021. W HO Global Anaemia estimates,
2021 Edition. In: The Global Health Observatory |
W HO [online]. Geneva, Switzerland.
[Cited 10 May 2021]. w w w.who.int/data/gho/
data/themes/topics/anaemia_in_women_and_
children n
| 169 |
ANNEX 2
METHODOLOGIES
CHAPTER 2
A. Methodology for 2020 PoU nowcasts
Adjustments in the proportion of change in FIsev
that is attributed to CV|y
As in previous editions of this report, due to
lack of detailed information on the most recent
values of each of the elements that contribute
to computing the PoU and NoU (see Annex 1B),
estimates referring to the most recent year are
nowcasted; in other words, they are predictions
of the ver y recent past.
Another parameter that needed attention to
nowcast the 2020 value of PoU is the percentage
of change in FI sev that is attributed to C V|y.
Normally, this has been assumed to be
equal to one-third, based on an econometric
analysis of past values of PoU, DEC and C V|y.
The exceptional nature of 2020 calls into
question this reg ularit y. As virtually no national
HCES were collected in 2020, there will never
be an empirical basis to determine how to
properly modif y it. The solution was to conduct
a sensitivit y analysis changing the percentage
of change in FI sev that is attributed to C V|y from
a minimum of one-third to a maximum of one.
The result is a range of possible values of C V|y,
and hence of PoU, in 2020. For completeness,
Table A2.1 presents the lower and upper bounds
of the PoU in 2020 at global, regional and
subregional levels.
However, 2020 was unique in many respects
due to the COV ID-19 pandemic, which imposed
unprecedented restrictions on people’s abilit y
to work and move. This demanded special
considerations when nowcasting the values of the
PoU, especially with respect to estimating the
likely change in the C V and to modelling the way
in which inequalit y in access to food contributes
to rates of undernourishment. Both aspects
required special treatment.
Estimating changes in FIsev from 2019 to 2020
While it was possible to nowcast the values
of DEC in 2020 using the traditional approach
based on information provided by the Markets
and Trade Division of FAO, used to inform
FAO Agricultural Outlooks, it was necessar y
to modif y this traditional approach used
to nowcast the C V. Normally, changes in
C V|y (the component of the C V associated
with differences in households’ economic
conditions) are derived from differences in
three-year averages of the prevalence of severe
food insecurit y based on the FIES (FI sev ) that
are not explained by changes in food supplies.
Use of the three-year average addressed the
need to control for possible excess sampling
variabilit y in countr y-level estimates of
the FI sev (which, for most countries, is
based on relatively small samples of FIES
data) and is consistent with an assumption
that C V|y follows a relatively stable trend.
The exceptional nature of 2020 makes it
difficult to maintain this last assumption.
Because of that, in nowcasting the 2020 value
of C V|y, the change between the 2017–19
average and the 2020 annual value of FI sev
was used.
B. Methodology for the analysis of the
impact on food security of income loss
induced by the COVID-19 pandemic
The objective of this analysis, presented in
Section 2.1, was to estimate the impact on
food insecurit y, measured with the FIES,
of income loss induced by the COV ID-19
pandemic. This was possible because the
following questions related to the impacts of the
COV ID-19 pandemic on employment and income
were included in the same 2020 Gallup © World
Poll as the FIES module:
Have you experienced each of the following as
a result of the COV ID-19 situation?
1. Temporarily stopped working at your job or
business: Yes/No
2. Lost your job or business: Yes/No
3. Worked less hours at your job or business:
Yes/No
4. Received less money than usual from your
employer or business: Yes/No
| 170 |
THE STATE OF FOOD SECURITY AND NUTRITION IN THE WORLD 2021
TABLE A2.1 RANGES OF PoU AND NoU NOWCASTED IN 2020
PoU 2020 (percentage)
Lower bound
NoU 2020 (millions)
Upper bound
Lower bound
Upper bound
WORLD
9.2
10.4
720.4
811.0
AFRICA
19.8
21.8
265.3
292.4
6.9
7.3
17.0
17.9
Sub-Saharan Africa
22.7
25.1
248.3
274.6
Eastern Africa
27.1
29.1
120.5
129.6
Middle Africa
Northern Africa
31.5
32.1
56.6
57.7
Southern Africa
9.2
11.1
6.2
7.5
Western Africa
16.2
19.9
65.0
79.8
8.5
9.5
393.1
443.2
ASIA
Central Asia
3.2
3.7
2.4
2.8
Eastern Asia
< 2.5
< 2.5
n.r.
n.r.
7.1
7.5
47.6
50.1
14.6
16.9
282.9
328.7
South-eastern Asia
Southern Asia
Western Asia
15.0
15.3
41.9
42.7
Western Asia and Northern Africa
11.2
11.5
58.8
60.5
8.2
10.1
53.8
66.1
15.6
16.5
6.8
7.2
LATIN AMERICA AND THE CARIBBEAN
Caribbean
Latin America
7.7
9.7
47.0
58.9
Central America
9.5
11.7
17.1
21.0
South America
6.9
8.8
29.8
38.0
6.2
6.2
2.7
2.7
< 2.5
< 2.5
n.r.
n.r.
OCEANIA
NORTHERN AMERICA AND EUROPE
NOTES: n.r. = not reported, as the prevalence is less than 2.5 percent. For NoU, regional totals may differ from the sum of subregions, due to
rounding and non-reported values. For country compositions of each regional/subregional aggregate, see Notes on geographic regions in statistical
tables inside the back cover.
SOURCE: FAO.
Food insecurit y status at moderate or severe
level: dichotomous variable being 1 if the
globally adjusted probabilit y of being food
insecure at moderate or severe level was
greater than 0.5, otherwise 0;
Food insecurit y status at severe level:
dichotomous variable being 1 if the globally
adjusted probabilit y of being food insecure at
severe level was greater than 0.5, otherwise 0.
Respondents were adult men and women
15 years or older. Respondents who replied “I
don’t know/Refused/Not applicable or no job” to
each of the questions above were excluded from
the analysis. Thus, one may assume the results
refer only to the population that was employed
(working or own business) at the time the
COV ID-19 pandemic began.
A set of random effect logistic regression models
was applied. As outcome (dependent) variables,
the respondents’ food insecurit y status at
moderate or severe level, and severe level only,
were used as follows:
The two food insecurit y variables were included
in separate regression models to study the
differential impact of the COV ID-19 crisis on
different levels of food insecurit y.
| 171 |
ANNEX 2
C. Methodology for the cost and
affordability of healthy diets
As explanator y (independent) variables,
responses to each of the questions 1 to 4
(temporarily stopped working; lost job; worked
less hours; received less money) were included in
a separate regression model. Moreover, education,
employment status, gender, urban/rural area
and world region were considered as controls.
Interaction terms between variables 1 to 4 and
income and employment were also included, as
well as countr y random effects.
In Table 5, the cost and affordabilit y of a healthy
diet and the change of these indicators from
2017 to 2019 are reported by region, subregion
and countr y income groups, following the latest
World Bank classification of income for 2019.
In FAO, IFAD, UNICEF, W FP and W HO (2020), 7
results were presented using the income
classification for 2017. Therefore, as some
countries changed their income status between
these two years, the composition of countries
by income groups may also have changed.
The econometric model implemented in the
analysis is described in the following equation:
(1) (1) 𝑃𝑃𝑃𝑃𝑃𝑃𝑃𝑃𝑃𝑃𝑃𝑃𝑃𝑃𝑃𝑃(𝑌𝑌𝑌𝑌𝑖𝑖𝑖𝑖𝑖𝑖𝑖𝑖 = 1|𝜷𝜷𝜷𝜷𝒍𝒍𝒍𝒍 , 𝒃𝒃𝒃𝒃𝒊𝒊𝒊𝒊𝒊𝒊𝒊𝒊𝒍𝒍𝒍𝒍 , 𝑿𝑿𝑿𝑿𝒊𝒊𝒊𝒊 ) =
exp [𝒑𝒑𝒑𝒑𝒊𝒊𝒊𝒊𝒍𝒍𝒍𝒍 ]
(1)
exp [𝒑𝒑𝒑𝒑𝒊𝒊𝒊𝒊𝒍𝒍𝒍𝒍 ]
1+exp [𝒑𝒑𝒑𝒑𝒊𝒊𝒊𝒊𝒍𝒍𝒍𝒍 ]
𝑃𝑃𝑃𝑃𝑃𝑃𝑃𝑃𝑃𝑃𝑃𝑃𝑃𝑃𝑃𝑃(𝑌𝑌𝑌𝑌𝑖𝑖𝑖𝑖𝑖𝑖𝑖𝑖
exp [𝒑𝒑𝒑𝒑 ]
𝒊𝒊𝒊𝒊𝒍𝒍𝒍𝒍
= 1|𝜷𝜷𝜷𝜷𝒍𝒍𝒍𝒍 , 𝒃𝒃𝒃𝒃
𝑿𝑿𝑿𝑿𝒊𝒊𝒊𝒊 ) =
The
of a healthy diet
𝒊𝒊𝒊𝒊𝒊𝒊𝒊𝒊𝒍𝒍𝒍𝒍 ,cost
1+exp [𝒑𝒑𝒑𝒑𝒊𝒊𝒊𝒊𝒍𝒍𝒍𝒍 ]
(1) where:
𝑃𝑃𝑃𝑃𝑃𝑃𝑃𝑃𝑃𝑃𝑃𝑃𝑃𝑃𝑃𝑃(𝑌𝑌𝑌𝑌𝑖𝑖𝑖𝑖𝑖𝑖𝑖𝑖 = 1|𝜷𝜷𝜷𝜷𝒍𝒍𝒍𝒍 , 𝒃𝒃𝒃𝒃𝒊𝒊𝒊𝒊𝒊𝒊𝒊𝒊𝒍𝒍𝒍𝒍 , 𝑿𝑿𝑿𝑿𝒊𝒊𝒊𝒊 ) =
A healthy diet provides not only adequate
1+exp [𝒑𝒑𝒑𝒑𝒊𝒊𝒊𝒊𝒍𝒍𝒍𝒍 ]
+ 𝒃𝒃𝒃𝒃𝒊𝒊𝒊𝒊𝒊𝒊𝒊𝒊𝒍𝒍𝒍𝒍𝒊𝒊𝒊𝒊 ) + 𝛽𝛽𝛽𝛽1𝑖𝑖𝑖𝑖𝑙𝑙𝑙𝑙 𝑃𝑃𝑃𝑃𝑖𝑖𝑖𝑖 + 𝛽𝛽𝛽𝛽2𝑖𝑖𝑖𝑖𝑙𝑙𝑙𝑙 𝑐𝑐𝑐𝑐𝑖𝑖𝑖𝑖 + 𝜷𝜷𝜷𝜷𝟑𝟑𝟑𝟑𝒍𝒍𝒍𝒍𝒊𝒊𝒊𝒊 𝑿𝑿𝑿𝑿𝑖𝑖𝑖𝑖 +𝛽𝛽𝛽𝛽4𝑖𝑖𝑖𝑖𝑙𝑙𝑙𝑙 𝒁𝒁𝒁𝒁𝑖𝑖𝑖𝑖 ∗ 𝑐𝑐𝑐𝑐𝑖𝑖𝑖𝑖
calories but also adequate levels of all essential
𝑐𝑐𝑐𝑐𝑖𝑖𝑖𝑖
𝒑𝒑𝒑𝒑𝒊𝒊𝒊𝒊𝒍𝒍𝒍𝒍𝒊𝒊𝒊𝒊 = (𝛽𝛽𝛽𝛽0𝑖𝑖𝑖𝑖𝑙𝑙𝑙𝑙 + 𝒃𝒃𝒃𝒃𝒊𝒊𝒊𝒊𝒊𝒊𝒊𝒊𝒍𝒍𝒍𝒍𝒊𝒊𝒊𝒊 ) + 𝛽𝛽𝛽𝛽1𝑖𝑖𝑖𝑖𝑙𝑙𝑙𝑙 𝑃𝑃𝑃𝑃𝑖𝑖𝑖𝑖 + 𝛽𝛽𝛽𝛽2𝑖𝑖𝑖𝑖𝑙𝑙𝑙𝑙 𝑐𝑐𝑐𝑐𝑖𝑖𝑖𝑖 + 𝜷𝜷𝜷𝜷𝟑𝟑𝟑𝟑𝒍𝒍𝒍𝒍𝒊𝒊𝒊𝒊 𝑿𝑿𝑿𝑿𝑖𝑖𝑖𝑖 +𝛽𝛽𝛽𝛽4𝑖𝑖𝑖𝑖𝑙𝑙𝑙𝑙 𝒁𝒁𝒁𝒁𝑖𝑖𝑖𝑖 ∗nutrients
and of each food group needed for
𝛽𝛽𝛽𝛽1𝑖𝑖𝑖𝑖𝑙𝑙𝑙𝑙 𝑃𝑃𝑃𝑃𝑖𝑖𝑖𝑖 + 𝛽𝛽𝛽𝛽2𝑖𝑖𝑖𝑖𝑙𝑙𝑙𝑙 𝑐𝑐𝑐𝑐𝑖𝑖𝑖𝑖 + 𝜷𝜷𝜷𝜷𝟑𝟑𝟑𝟑𝒍𝒍𝒍𝒍𝒊𝒊𝒊𝒊 𝑿𝑿𝑿𝑿𝑖𝑖𝑖𝑖 +𝜷𝜷𝜷𝜷𝟒𝟒𝟒𝟒𝒍𝒍𝒍𝒍𝒊𝒊𝒊𝒊 𝒁𝒁𝒁𝒁𝑖𝑖𝑖𝑖 ∗ 𝑐𝑐𝑐𝑐𝑖𝑖𝑖𝑖 is the linear predictor
a healthy and active life (see Section 2.1).
𝛽𝛽𝛽𝛽1𝑖𝑖𝑖𝑖𝑙𝑙𝑙𝑙 , 𝛽𝛽𝛽𝛽2𝑖𝑖𝑖𝑖𝑙𝑙𝑙𝑙 , 𝜷𝜷𝜷𝜷𝟑𝟑𝟑𝟑𝒍𝒍𝒍𝒍𝒍𝒍𝒍𝒍 ,
𝛽𝛽𝛽𝛽4𝑖𝑖𝑖𝑖i 𝑙𝑙𝑙𝑙indicates
)
The cost of a healthy diet is defined as the
the respondent, l the level of food
, 𝛽𝛽𝛽𝛽2𝑖𝑖𝑖𝑖𝑙𝑙𝑙𝑙 , 𝜷𝜷𝜷𝜷𝟑𝟑𝟑𝟑𝒍𝒍𝒍𝒍𝒍𝒍𝒍𝒍or
, 𝛽𝛽𝛽𝛽4𝑖𝑖𝑖𝑖
𝜷𝜷𝜷𝜷𝒍𝒍𝒍𝒍𝒊𝒊𝒊𝒊 = (𝛽𝛽𝛽𝛽0𝑖𝑖𝑖𝑖y𝑙𝑙𝑙𝑙(l, 𝛽𝛽𝛽𝛽=1𝑖𝑖𝑖𝑖𝑙𝑙𝑙𝑙moderate
minimum cost of foods, using the least
insecurit
severe,
or severe
𝑙𝑙𝑙𝑙 )
expensive available items in each countr y, that
only), c the COV ID-19 employment variables
𝒍𝒍𝒍𝒍𝒍𝒍𝒍𝒍 , 𝜷𝜷𝜷𝜷𝟒𝟒𝟒𝟒𝒍𝒍𝒍𝒍𝒊𝒊𝒊𝒊 )
meet a set of dietar y recommendations based
(c = temporarily stopped working, or lost job,
exp [𝒑𝒑𝒑𝒑𝒊𝒊𝒊𝒊𝒍𝒍𝒍𝒍 ]
𝒃𝒃𝒃𝒃𝒊𝒊𝒊𝒊𝒊𝒊𝒊𝒊worked
on𝒊𝒊𝒊𝒊𝒊𝒊𝒊𝒊𝒍𝒍𝒍𝒍ten
Food Based Dietar y Guidelines
or
less hours or received less
money),𝑖𝑖𝑖𝑖𝑖𝑖𝑖𝑖 = 1|𝜷𝜷𝜷𝜷𝒍𝒍𝒍𝒍 , 𝒃𝒃𝒃𝒃
𝒍𝒍𝒍𝒍𝒊𝒊𝒊𝒊
(1) 𝑃𝑃𝑃𝑃𝑃𝑃𝑃𝑃𝑃𝑃𝑃𝑃𝑃𝑃𝑃𝑃(𝑌𝑌𝑌𝑌
, 𝑿𝑿𝑿𝑿𝒊𝒊𝒊𝒊 )national
=
1+exp [𝒑𝒑𝒑𝒑𝒊𝒊𝒊𝒊𝒍𝒍𝒍𝒍 ]
(FBDGs). The FBDGs explicitly recommend
c i the value of the COV ID-19 employment
] × (1of− 𝑊𝑊𝑊𝑊𝑊𝑊𝑊𝑊𝐷𝐷𝐷𝐷𝑊𝑊𝑊𝑊𝐷𝐷𝐷𝐷𝑡𝑡𝑡𝑡food
) quantities for each food group and provide
𝐷𝐷𝐷𝐷𝐷𝐷𝐷𝐷𝐶𝐶𝐶𝐶𝑡𝑡𝑡𝑡 = [𝐷𝐷𝐷𝐷𝐷𝐷𝐷𝐷𝐷𝐷𝐷𝐷_𝐾𝐾𝐾𝐾𝑐𝑐𝑐𝑐𝐾𝐾𝐾𝐾𝑙𝑙𝑙𝑙
+ 𝐷𝐷𝐷𝐷𝐷𝐷𝐷𝐷𝐷𝐷𝐷𝐷
variables𝑡𝑡𝑡𝑡 for
individual
i and r i the2018
region
2018 − 𝐷𝐷𝐷𝐷𝐷𝐷𝐷𝐷𝐷𝐷𝐷𝐷_𝐾𝐾𝐾𝐾𝑐𝑐𝑐𝑐𝐾𝐾𝐾𝐾𝑙𝑙𝑙𝑙
[ 𝑖𝑖𝑖𝑖M49
1 − 𝑊𝑊𝑊𝑊𝑊𝑊𝑊𝑊𝐷𝐷𝐷𝐷𝑊𝑊𝑊𝑊𝐷𝐷𝐷𝐷𝑡𝑡𝑡𝑡 ) A healthy diet
= (𝛽𝛽𝛽𝛽0𝑖𝑖𝑖𝑖(according
+ 𝛽𝛽𝛽𝛽2𝑖𝑖𝑖𝑖classification)
𝜷𝜷𝜷𝜷𝐷𝐷𝐷𝐷𝐷𝐷𝐷𝐷𝐷𝐷𝐷𝐷
𝒁𝒁𝒁𝒁𝑖𝑖𝑖𝑖a∗wide
𝑐𝑐𝑐𝑐𝑖𝑖𝑖𝑖 regional
𝒑𝒑𝒑𝒑𝒊𝒊𝒊𝒊𝒍𝒍𝒍𝒍𝒊𝒊𝒊𝒊 world
the
the
𝑡𝑡𝑡𝑡𝛽𝛽𝛽𝛽=
𝑡𝑡𝑡𝑡 +
2018 ] × (representation.
𝑙𝑙𝑙𝑙 + 𝒃𝒃𝒃𝒃𝒊𝒊𝒊𝒊𝒊𝒊𝒊𝒊𝒍𝒍𝒍𝒍𝐷𝐷𝐷𝐷𝐷𝐷𝐷𝐷𝐶𝐶𝐶𝐶
𝒊𝒊𝒊𝒊 ) +to
1𝑖𝑖𝑖𝑖
𝑙𝑙𝑙𝑙 𝑃𝑃𝑃𝑃𝐷𝐷𝐷𝐷𝐷𝐷𝐷𝐷𝐷𝐷𝐷𝐷_𝐾𝐾𝐾𝐾𝑐𝑐𝑐𝑐𝐾𝐾𝐾𝐾𝑙𝑙𝑙𝑙
𝑙𝑙𝑙𝑙 𝑐𝑐𝑐𝑐𝑖𝑖𝑖𝑖 +
𝟑𝟑𝟑𝟑𝒍𝒍𝒍𝒍𝒊𝒊𝒊𝒊 𝑿𝑿𝑿𝑿2018
𝑖𝑖𝑖𝑖 +𝜷𝜷𝜷𝜷−
𝟒𝟒𝟒𝟒𝒍𝒍𝒍𝒍𝒊𝒊𝒊𝒊 𝐷𝐷𝐷𝐷𝐷𝐷𝐷𝐷𝐷𝐷𝐷𝐷_𝐾𝐾𝐾𝐾𝑐𝑐𝑐𝑐𝐾𝐾𝐾𝐾𝑙𝑙𝑙𝑙
]
(
)
×
1
−
𝑊𝑊𝑊𝑊𝑊𝑊𝑊𝑊𝐷𝐷𝐷𝐷𝑊𝑊𝑊𝑊𝐷𝐷𝐷𝐷
= [𝐷𝐷𝐷𝐷𝐷𝐷𝐷𝐷𝐷𝐷𝐷𝐷_𝐾𝐾𝐾𝐾𝑐𝑐𝑐𝑐𝐾𝐾𝐾𝐾𝑙𝑙𝑙𝑙
+
𝐷𝐷𝐷𝐷𝐷𝐷𝐷𝐷𝐷𝐷𝐷𝐷
−
𝐷𝐷𝐷𝐷𝐷𝐷𝐷𝐷𝐷𝐷𝐷𝐷_𝐾𝐾𝐾𝐾𝑐𝑐𝑐𝑐𝐾𝐾𝐾𝐾𝑙𝑙𝑙𝑙
𝑡𝑡𝑡𝑡 Y il is the
2018dichotomous food
2018 insecurit y status
𝑡𝑡𝑡𝑡 as
also includes a more diverse intake of foods
from several different food groups. Although it
described
above
2
2
𝑦𝑦𝑦𝑦 + 𝐶𝐶𝐶𝐶𝐶𝐶𝐶𝐶𝑟𝑟𝑟𝑟 �
is not selected based on nutrient content but
𝜷𝜷𝜷𝜷𝒍𝒍𝒍𝒍𝒊𝒊𝒊𝒊 = (𝛽𝛽𝛽𝛽0𝑖𝑖𝑖𝑖𝑙𝑙𝑙𝑙 , 𝛽𝛽𝛽𝛽21𝑖𝑖𝑖𝑖𝑙𝑙𝑙𝑙 , 𝛽𝛽𝛽𝛽2𝑖𝑖𝑖𝑖𝑙𝑙𝑙𝑙 ,2𝜷𝜷𝜷𝜷𝟑𝟑𝟑𝟑𝒍𝒍𝒍𝒍𝒍𝒍𝒍𝒍 , 𝜷𝜷𝜷𝜷𝟒𝟒𝟒𝟒𝒍𝒍𝒍𝒍𝒊𝒊𝒊𝒊 ) denotes
𝐶𝐶𝐶𝐶𝐶𝐶𝐶𝐶 = ��𝐶𝐶𝐶𝐶𝐶𝐶𝐶𝐶 + 𝐶𝐶𝐶𝐶𝐶𝐶𝐶𝐶𝑟𝑟𝑟𝑟 �
is determined by FBDGs, this diet meets on
the vector of𝑦𝑦𝑦𝑦fixed effects
corresponding to
average 95 percent of nutrient needs, so it
intercept, region of the world, COV ID-19
𝛼𝛼𝛼𝛼 + 𝛽𝛽𝛽𝛽1 𝐺𝐺𝐺𝐺𝐷𝐷𝐷𝐷𝐷𝐷𝐷𝐷_𝑣𝑣𝑣𝑣𝑃𝑃𝑃𝑃𝑃𝑃𝑃𝑃_𝑝𝑝𝑝𝑝𝑐𝑐𝑐𝑐employment
𝑔𝑔𝑔𝑔𝑔𝑔𝑔𝑔𝑃𝑃𝑃𝑃_𝑅𝑅𝑅𝑅𝑒𝑒𝑒𝑒𝑒𝑒𝑒𝑒𝑒𝑒𝑒𝑒_𝐹𝐹𝐹𝐹𝑃𝑃𝑃𝑃𝑃𝑃𝑃𝑃𝑑𝑑𝑑𝑑
𝑐𝑐𝑐𝑐𝑃𝑃𝑃𝑃𝑃𝑃𝑃𝑃𝑡𝑡𝑡𝑡therefore
+ 𝛽𝛽𝛽𝛽6 𝑝𝑝𝑝𝑝𝑃𝑃𝑃𝑃𝑝𝑝𝑝𝑝𝑡𝑡𝑡𝑡 almost always be considered as
𝒃𝒃𝒃𝒃𝑡𝑡𝑡𝑡 𝒊𝒊𝒊𝒊+
variables
and
a set of 𝑡𝑡𝑡𝑡 + 𝛽𝛽𝛽𝛽4 𝑥𝑥𝑥𝑥190_𝑊𝑊𝑊𝑊𝐴𝐴𝐴𝐴𝐴𝐴𝐴𝐴𝑡𝑡𝑡𝑡 + 𝛽𝛽𝛽𝛽5can
𝑡𝑡𝑡𝑡 + 𝛽𝛽𝛽𝛽3 𝑃𝑃𝑃𝑃𝑃𝑃𝑃𝑃𝑔𝑔𝑔𝑔
𝒊𝒊𝒊𝒊𝒍𝒍𝒍𝒍𝒊𝒊𝒊𝒊𝛽𝛽𝛽𝛽2 𝑔𝑔𝑔𝑔𝑔𝑔𝑔𝑔𝑔𝑔𝑔𝑔𝑔𝑔𝑔𝑔_𝑔𝑔𝑔𝑔𝑔𝑔𝑔𝑔𝑔𝑔𝑔𝑔𝑔𝑔𝑔𝑔𝑖𝑖𝑖𝑖𝑒𝑒𝑒𝑒
� 𝑡𝑡𝑡𝑡 = 𝛼𝛼𝛼𝛼 +characteristics
𝐶𝐶𝐶𝐶𝐶𝐶𝐶𝐶𝐶𝐶𝐶𝐶
𝛽𝛽𝛽𝛽1 𝐺𝐺𝐺𝐺𝐷𝐷𝐷𝐷𝐷𝐷𝐷𝐷_𝑣𝑣𝑣𝑣𝑃𝑃𝑃𝑃𝑃𝑃𝑃𝑃_𝑝𝑝𝑝𝑝𝑐𝑐𝑐𝑐𝑡𝑡𝑡𝑡 +for
𝛽𝛽𝛽𝛽2 𝑔𝑔𝑔𝑔𝑔𝑔𝑔𝑔
𝑔𝑔𝑔𝑔𝑔𝑔𝑔𝑔_𝑔𝑔𝑔𝑔𝑔𝑔𝑔𝑔𝑔𝑔𝑔𝑔𝑔𝑔𝑔𝑔𝑖𝑖𝑖𝑖𝑒𝑒𝑒𝑒𝑡𝑡𝑡𝑡 + 𝛽𝛽𝛽𝛽3 𝑃𝑃𝑃𝑃𝑃𝑃𝑃𝑃𝑔𝑔𝑔𝑔𝑔𝑔𝑔𝑔𝑔𝑔𝑔𝑔𝑃𝑃𝑃𝑃_𝑅𝑅𝑅𝑅𝑒𝑒𝑒𝑒𝑒𝑒𝑒𝑒𝑒𝑒𝑒𝑒_𝐹𝐹𝐹𝐹𝑃𝑃𝑃𝑃𝑃𝑃𝑃𝑃𝑑𝑑𝑑𝑑
+ 𝛽𝛽𝛽𝛽5 𝑐𝑐𝑐𝑐𝑃𝑃𝑃𝑃𝑃𝑃𝑃𝑃
𝑡𝑡𝑡𝑡 + 𝛽𝛽𝛽𝛽4 𝑥𝑥𝑥𝑥190_𝑊𝑊𝑊𝑊𝐴𝐴𝐴𝐴𝐴𝐴𝐴𝐴
𝑡𝑡𝑡𝑡 + 𝛽𝛽𝛽𝛽6 𝑝𝑝𝑝𝑝𝑃𝑃𝑃𝑃𝑝𝑝𝑝𝑝
nutrient adequate.
This 𝑡𝑡𝑡𝑡diet,
however,
is𝑡𝑡𝑡𝑡 not
socio-economic
individual
𝑣𝑣𝑣𝑣𝑃𝑃𝑃𝑃𝑃𝑃𝑃𝑃_𝑝𝑝𝑝𝑝𝑐𝑐𝑐𝑐𝑡𝑡𝑡𝑡 + 𝛽𝛽𝛽𝛽2 𝑔𝑔𝑔𝑔𝑔𝑔𝑔𝑔𝑔𝑔𝑔𝑔𝑔𝑔𝑔𝑔_𝑔𝑔𝑔𝑔i𝑔𝑔𝑔𝑔𝑔𝑔𝑔𝑔𝑔𝑔𝑔𝑔𝑖𝑖𝑖𝑖𝑒𝑒𝑒𝑒
+
𝛽𝛽𝛽𝛽
𝑃𝑃𝑃𝑃𝑃𝑃𝑃𝑃𝑔𝑔𝑔𝑔
𝑔𝑔𝑔𝑔𝑔𝑔𝑔𝑔
𝑃𝑃𝑃𝑃_𝑅𝑅𝑅𝑅𝑒𝑒𝑒𝑒𝑒𝑒𝑒𝑒𝑒𝑒𝑒𝑒_𝐹𝐹𝐹𝐹𝑃𝑃𝑃𝑃𝑃𝑃𝑃𝑃𝑑𝑑𝑑𝑑
+
𝛽𝛽𝛽𝛽
𝑥𝑥𝑥𝑥190_𝑊𝑊𝑊𝑊𝐴𝐴𝐴𝐴𝐴𝐴𝐴𝐴
+
𝛽𝛽𝛽𝛽
𝑐𝑐𝑐𝑐𝑃𝑃𝑃𝑃𝑃𝑃𝑃𝑃
+
𝛽𝛽𝛽𝛽
𝑝𝑝𝑝𝑝𝑃𝑃𝑃𝑃𝑝𝑝𝑝𝑝
𝑡𝑡𝑡𝑡
3
𝑡𝑡𝑡𝑡
4
5
𝑡𝑡𝑡𝑡
6
𝑡𝑡𝑡𝑡
specifically
optimized to include environmental
(X i , i.e.
education,
employment
status,𝑡𝑡𝑡𝑡 urban/
�
�[𝐷𝐷𝐷𝐷𝐷𝐷𝐷𝐷𝐷𝐷𝐷𝐷_𝐾𝐾𝐾𝐾𝑐𝑐𝑐𝑐𝐾𝐾𝐾𝐾𝑙𝑙𝑙𝑙
(1 − 𝑊𝑊𝑊𝑊𝑊𝑊𝑊𝑊𝐷𝐷𝐷𝐷𝑊𝑊𝑊𝑊𝐷𝐷𝐷𝐷𝑡𝑡𝑡𝑡 )
=
𝐷𝐷𝐷𝐷𝐷𝐷𝐷𝐷𝐶𝐶𝐶𝐶−
= 𝐶𝐶𝐶𝐶𝐶𝐶𝐶𝐶𝐶𝐶𝐶𝐶
�𝐶𝐶𝐶𝐶𝐶𝐶𝐶𝐶𝐶𝐶𝐶𝐶
𝐶𝐶𝐶𝐶𝐶𝐶𝐶𝐶𝐶𝐶𝐶𝐶
𝑊𝑊𝑊𝑊,𝐷𝐷𝐷𝐷𝐷𝐷𝐷𝐷𝐷𝐷𝐷𝐷
… , 2030
𝐶𝐶𝐶𝐶𝐶𝐶𝐶𝐶𝐶𝐶𝐶𝐶𝑡𝑡𝑡𝑡rural
sustainabilit
area
and
gender),
interaction
𝑡𝑡𝑡𝑡 the
2018 − 𝐷𝐷𝐷𝐷𝐷𝐷𝐷𝐷𝐷𝐷𝐷𝐷_𝐾𝐾𝐾𝐾𝑐𝑐𝑐𝑐𝐾𝐾𝐾𝐾𝑙𝑙𝑙𝑙
2018 ]y×considerations.
𝑡𝑡𝑡𝑡 +
2019
2019 �, ∀𝑡𝑡𝑡𝑡 𝑡𝑡𝑡𝑡=+between
�
�
=
𝐶𝐶𝐶𝐶𝐶𝐶𝐶𝐶𝐶𝐶𝐶𝐶
+
�𝐶𝐶𝐶𝐶𝐶𝐶𝐶𝐶𝐶𝐶𝐶𝐶
−
𝐶𝐶𝐶𝐶𝐶𝐶𝐶𝐶𝐶𝐶𝐶𝐶
�,
∀𝑡𝑡𝑡𝑡
=
𝑊𝑊𝑊𝑊,
… , 2030
𝐶𝐶𝐶𝐶𝐶𝐶𝐶𝐶𝐶𝐶𝐶𝐶
c i and Z it (a subset of X i , i.e. 𝑡𝑡𝑡𝑡income and
𝑡𝑡𝑡𝑡
2019
2019
� 𝑡𝑡𝑡𝑡 +employment
�
𝐶𝐶𝐶𝐶𝐶𝐶𝐶𝐶𝐶𝐶𝐶𝐶𝑡𝑡𝑡𝑡 = 𝐶𝐶𝐶𝐶𝐶𝐶𝐶𝐶𝐶𝐶𝐶𝐶
�𝐶𝐶𝐶𝐶𝐶𝐶𝐶𝐶𝐶𝐶𝐶𝐶2019 − 𝐶𝐶𝐶𝐶𝐶𝐶𝐶𝐶𝐶𝐶𝐶𝐶
�,
∀𝑡𝑡𝑡𝑡
=
𝑊𝑊𝑊𝑊,
…
,
2030
2019
The availabilit y and prices of items in each
status)
food group needed for a healthy diet were
bi0lc is the vector
of countr
y-specific random
2
2
𝐶𝐶𝐶𝐶𝐶𝐶𝐶𝐶 = ��𝐶𝐶𝐶𝐶𝐶𝐶𝐶𝐶𝑦𝑦𝑦𝑦 + 𝐶𝐶𝐶𝐶𝐶𝐶𝐶𝐶𝑟𝑟𝑟𝑟 �
obtained from the World Bank’s International
effects corresponding
to intercept
Comparison Program (ICP) as national averages
for 2017. Item definitions are internationally
Results were presented by computing exp( β2lc ) as
� of
𝐶𝐶𝐶𝐶𝐶𝐶𝐶𝐶𝐶𝐶𝐶𝐶
𝛼𝛼𝛼𝛼 +odds-ratio
𝛽𝛽𝛽𝛽1 𝐺𝐺𝐺𝐺𝐷𝐷𝐷𝐷𝐷𝐷𝐷𝐷_𝑣𝑣𝑣𝑣𝑃𝑃𝑃𝑃𝑃𝑃𝑃𝑃_𝑝𝑝𝑝𝑝𝑐𝑐𝑐𝑐
+ 𝛽𝛽𝛽𝛽2 probabilit
𝑔𝑔𝑔𝑔𝑔𝑔𝑔𝑔𝑔𝑔𝑔𝑔𝑔𝑔𝑔𝑔_𝑔𝑔𝑔𝑔𝑔𝑔𝑔𝑔𝑔𝑔𝑔𝑔𝑔𝑔𝑔𝑔𝑖𝑖𝑖𝑖𝑒𝑒𝑒𝑒y𝑡𝑡𝑡𝑡 + 𝛽𝛽𝛽𝛽3 𝑃𝑃𝑃𝑃𝑃𝑃𝑃𝑃𝑔𝑔𝑔𝑔𝑔𝑔𝑔𝑔𝑔𝑔𝑔𝑔𝑃𝑃𝑃𝑃_𝑅𝑅𝑅𝑅𝑒𝑒𝑒𝑒𝑒𝑒𝑒𝑒𝑒𝑒𝑒𝑒_𝐹𝐹𝐹𝐹𝑃𝑃𝑃𝑃𝑃𝑃𝑃𝑃𝑑𝑑𝑑𝑑
𝑥𝑥𝑥𝑥190_𝑊𝑊𝑊𝑊𝐴𝐴𝐴𝐴𝐴𝐴𝐴𝐴𝑡𝑡𝑡𝑡classification
+ 𝛽𝛽𝛽𝛽5 𝑐𝑐𝑐𝑐𝑃𝑃𝑃𝑃𝑃𝑃𝑃𝑃𝑡𝑡𝑡𝑡 + 𝛽𝛽𝛽𝛽6 𝑝𝑝𝑝𝑝𝑃𝑃𝑃𝑃𝑝𝑝𝑝𝑝
standardized,
by 𝑡𝑡𝑡𝑡food
an estimate
of𝑡𝑡𝑡𝑡 the
𝑡𝑡𝑡𝑡 =the
𝑡𝑡𝑡𝑡 + 𝛽𝛽𝛽𝛽4allowing
group and calculation of the least-costs to
of being food insecure. The larger the odds ratio
reach FBDG requirements in each countr y,
compared to 1, the higher the probabilit y of being
� 𝑡𝑡𝑡𝑡 +y �𝐶𝐶𝐶𝐶𝐶𝐶𝐶𝐶𝐶𝐶𝐶𝐶
�
= 𝐶𝐶𝐶𝐶𝐶𝐶𝐶𝐶𝐶𝐶𝐶𝐶
𝑊𝑊𝑊𝑊, …average
, 2030 across markets and
representing
food insecure compared to𝐶𝐶𝐶𝐶𝐶𝐶𝐶𝐶𝐶𝐶𝐶𝐶
the𝑡𝑡𝑡𝑡probabilit
of not2019 − 𝐶𝐶𝐶𝐶𝐶𝐶𝐶𝐶𝐶𝐶𝐶𝐶
2019 �, ∀𝑡𝑡𝑡𝑡 = an
throughout the year. 300 For a detailed description
being food insecure due to the “yes” answer to
a given question about income loss because of
of the healthy diet and related methodolog y, see
COV ID-19 compared to “no”.
FAO, IFAD, UNICEF, W FP and W HO (2020). 7
| 172 |
THE STATE OF FOOD SECURITY AND NUTRITION IN THE WORLD 2021
Affordability of a healthy diet
non-alcoholic beverages are used to update the
cost of a healthy diet in 2019 for all countries
except Central African Republic and Guyana,
for which the general CPI is used. The costs of a
healthy diet in 2019 are estimated by using each
countr y’s 2017 actual cost multiplied by its ratio
between food CPIs:
In this report, to determine affordabilit y,
the cost of a healthy diet is compared with
countr y-specific income distributions that
are derived from the World Bank PovcalNet
database. 301 The resulting measures of
affordabilit y include the percentage and
number of people who cannot afford a healthy
diet in a given countr y, in 2019. A healthy
diet is considered unaffordable when its cost
exceeds 63 percent of the income in a countr y.
The 63 percent accounts for a portion of income
that can be credibly reser ved for food, based
on obser vations that the poorest segment of
the population in low-income countries spend,
on average, 63 percent of their income on food
( World Bank Global Consumption Database). 301az
Estimated 2019 Diet Cost = Actual 2017
Diet Cost × (f )CPI2019 / (f )CPI2017
Applying the (food) CPIs, the cost of the healthy
diet is first estimated in local currency units.
To compare the cost across countries and political
entities, the cost is converted into international
dollars using the W DI purchasing power parit y
(PPP) private consumption conversion factors
for 2019. For a detailed description of the
methodolog y, see Yan et al. (forthcoming). 302
Based on this threshold and comparing the cost
of the diet with countr y income distributions,
we obtain the percentage of the population
for whom the cost of the diet is unaffordable.
These proportions are then multiplied by the
2019 population in each countr y using the World
Development Indicators ( W DI) 292 of the World
Bank, to obtain the number of people who cannot
afford a specific diet in a given countr y. For a
detailed description of the affordabilit y indicators
and related methodolog y, see Annex 3 of FAO,
IFAD, UNICEF, W FP and W HO (2020). 7
The cost of the healthy diet was computed for
170 countries in 2017. This cost information
was updated for 2019 for all countries except for
Palestine, that has inconsistent PPP conversion
factors, and Taiwan Province of China that has
no information on CPIs nor on PPPs. Of the
remaining 168 countries, there are 18 countries
with missing 2019 PPP data, and 2 countries with
missing 2019 CPIs data. For the 18 countries, PPP
imputations were applied using an Autoregressive
Integrated Moving Average Model with
Explanator y Variable (A RIM A X) approach, which
allows for one external covariate to be chosen
between the per capita GDP and the per capita
household consumption expenditure. To apply
this methodolog y, the completeness of the series
of both covariates has been ensured by applying
the Holt-Winter smoothing methodolog y to
fill the gaps, when needed. Thus, the A RIM A X
model selects the covariate and the parameters
that minimize the Bayesian Information Criterion
(BIC). Finally, the model estimates the best
specification and computes the predicted values.
Updating the cost of a healthy diet
The ICP is currently the only source of retail
food price data for internationally standardized
items, as part of the World Bank’s larger effort to
compute purchasing power parit y exchange rates
across all countries of the world. However, these
data are only available once ever y three to five
years, which does not allow for yearly global
monitoring of diet costs to g uide programmes
and policies. In the absence of updated food price
data, in this report, the method of updating the
cost indicator between ICP publication years
relies on Consumer Price Indices (CPIs) published
by FAO. This dataset tracks change in monthly
general and food CPIs at the national level with
reference to a base year of 2015. The annual
CPIs are computed as simple averages of the 12
monthly CPIs within a year. In particular, Food
Consumer Price Indices (CPIs) data for food and
az
For two additional countries with missing
information on CPIs (Bermuda, and Turks and
Caicos Islands), cost imputations were applied
using the average diet cost in the subregion (s) of
the countr y (i) with missing information:
Imputed 2018 Diet Cost = (2017 Diet Cost i /
Avg 2017 Diet Cost s) × Avg 2018 Diet Cost s
For methodology see Herforth et al. [2020]. 8
| 173 |
ANNEX 2
D. Methodology for projections
of PoU to 2030
Imputed 2019 Diet Cost = Imputed 2018 Diet
Cost i / Avg 2018 Diet Cost s) × Avg 2019 Diet Cost s
To project PoU values to 2030, we project the
three fundamental variables that enter in the
PoU formula (DEC, C V and MDER) separately,
based on different inputs, depending on the
scenario considered.
Subregional cost averages in 2017 and 2018 were
computed excluding from the computations the
countr y with missing cost information.
A limitation of this method is that changes in
the cost of a healthy diet between 2017 and
2019 depend on (food) CPIs and do not ref lect
commodit y-specific changes in food prices,
nor any differential changes in the price of
different food groups, due to the lack of new
item-level food price data for more nutritious
food items. FAO is exploring how to expand
the coverage of the FAO Food Price Monitoring
and Analysis (FPM A) dataset to include a set of
countr y-appropriate sentinel foods in non-staple
food groups, such as fruits and vegetables, to
allow more frequent and robust monitoring of
the cost of a healthy diet.
The main source of information is the output
of the MIR AGRODEP recursive, dynamic CGE
model, which provides series of projected values,
at countr y level, for:
real per capita GDP (GDP_Vol_pc)
Income Gini coefficient (gini_income)
An index of real food price (Prices_Real_Food)
Extreme povert y headcount rate (that is, the
percentage of the population with real daily
income below USD 1.9) (x190_ ALL)
Daily per capita food consumption (DES_Kcal)
The MIR AGRODEP model was calibrated to
the pre-COV ID situation of the world economy
in 2018, and used to generate projections of
macroeconomic fundamentals into 2019–2030
under two scenarios: a reference scenario, aimed
at capturing the impact of COV ID as ref lected
in the latest available update of the IMF World
Economic Outlook ( W EO) published in April
2021, and a no-COV ID scenario, based on the
October 2019 edition of W EO, which is the
last one before the pandemic. A more detailed
description of the MIR AGRODEP model, as well
as the assumptions used to build the reference
scenario and the no-COV ID scenario, can be
found in Laborde and Torero (forthcoming). 303
Updating the affordability of a healthy diet
In this report, affordabilit y was updated for year
2019. Through continuous updates based on
incoming national sur veys and data imputations,
the income distributions for the 2017, 2018 and
2019 reference years have been updated in the
PovcalNet database and are now available for
almost all countries (except for India whose
most recent income distribution is for 2017).
The percent of people who cannot afford a
healthy diet in 2019 was computed using the
CPI-inf lated cost of the diet described above,
as well as the corresponding reference year
of the 2019 income distributions available in
PovcalNet. These proportions were multiplied
by each countr y’s population in 2019 using the
W DI of the World Bank, to obtain the number
of people who cannot afford the healthy diet in
this year.
In addition, we use the median variant
projections of total population (both sexes),
its composition by gender and age, and the
crude birth rate as provided by the 2019 World
Population Prospects.
This affordabilit y indicator is computed for
143 countries for 2017. This information was
updated for all countries for year 2019, except
for Palestine. For this countr y, the affordabilit y
indicator for 2019 was calculated using cost
information for 2017 and population fig ures
for 2019. ba
Projections of DEC
To project the series of DEC we use the
following formula:
DEC t = [DES_ Kcal t+ DES 2018 – DES_ Kcal 2018 ]
× (1 – WASTE t )
In other words, we take the model projected
series of DES_Kcal and adjust its level so that the
ba For a detailed description of the methodology see Yan et al.
(forthcoming). 302
| 174 |
THE STATE OF FOOD SECURITY AND NUTRITION IN THE WORLD 2021
TABLE A2.2 REGRESSION COEFFICIENTS FROM THREE MODELS ESTIMATED ON HISTORIC CVy VALUES
(2000–2019)
Regression model coefficients (standard error in parentheses)
Regressors
Variable used to project
Pooled OLS
Real GDP per capita
GDP_vol_pc *
-0.0366 (0.0790)
-0.0358 (0.0742)
-0.0689 (0.0662)
Income Gini coefficient
Gini_income *
0.1095 (0.0748)
0.1650 (0.0703)
0.1266 (0.0816)
Real Food CPI
Prices_Real_Food *
0.1359 (0.0710)
0.0686 (0.0667)
0.1598 (0.0698)
Poverty headcount
X190_ALL *
0.2622 (0.1288)
0.2794 (0.1210)
0.2654 (0.1475)
Crude birth rate
cbr **
0.3806 (0.1281)
0.3301 (0.1204)
0.4029 (0.1491)
Total population
pop **
-0.2002 (0.0735) (1)
Constant
0.0000 (0.0694)
N
* from MIRAGORDEP
r
** from WPP
2
112
Robust regression
r adjusted
-0.1110 (0.0652)
112
0.4893
0.4943
0.4601
0.4654
𝜷𝜷𝜷𝜷𝒍𝒍𝒍𝒍𝒊𝒊𝒊𝒊 = (𝛽𝛽𝛽𝛽0𝑖𝑖𝑖𝑖𝑙𝑙𝑙𝑙 , 𝛽𝛽𝛽𝛽1𝑖𝑖𝑖𝑖𝑙𝑙𝑙𝑙 , 𝛽𝛽𝛽𝛽2𝑖𝑖𝑖𝑖𝑙𝑙𝑙𝑙 , 𝜷𝜷𝜷𝜷𝟑𝟑𝟑𝟑𝒍𝒍𝒍𝒍𝒍𝒍𝒍𝒍 , 𝛽𝛽𝛽𝛽4𝑖𝑖𝑖𝑖𝑙𝑙𝑙𝑙 )
r between
2
SOURCE: FAO.
𝒃𝒃𝒃𝒃𝒊𝒊𝒊𝒊𝒊𝒊𝒊𝒊𝒍𝒍𝒍𝒍𝒊𝒊𝒊𝒊
(1) 𝑃𝑃𝑃𝑃𝑃𝑃𝑃𝑃𝑃𝑃𝑃𝑃𝑃𝑃𝑃𝑃(𝑌𝑌𝑌𝑌 = 1|𝜷𝜷𝜷𝜷 , 𝒃𝒃𝒃𝒃
, 𝑿𝑿𝑿𝑿 ) =
exp [𝒑𝒑𝒑𝒑 ]
𝒊𝒊𝒊𝒊𝒍𝒍𝒍𝒍
-0.1696 (0.0690)
-0.2070 (0.1161)
𝑃𝑃𝑃𝑃𝑃𝑃𝑃𝑃𝑃𝑃𝑃𝑃𝑃𝑃𝑃𝑃(𝑌𝑌𝑌𝑌
𝑖𝑖𝑖𝑖𝑖𝑖𝑖𝑖 = 1|𝜷𝜷𝜷𝜷𝒍𝒍𝒍𝒍 , 𝒃𝒃𝒃𝒃𝒊𝒊𝒊𝒊𝒊𝒊𝒊𝒊𝒍𝒍𝒍𝒍 , 𝑿𝑿𝑿𝑿𝒊𝒊𝒊𝒊 ) =
𝒑𝒑𝒑𝒑𝒊𝒊𝒊𝒊𝒍𝒍𝒍𝒍𝒊𝒊𝒊𝒊 = (𝛽𝛽𝛽𝛽0𝑖𝑖𝑖𝑖𝑙𝑙𝑙𝑙 + 𝒃𝒃𝒃𝒃𝒊𝒊𝒊𝒊𝒊𝒊𝒊𝒊𝒍𝒍𝒍𝒍𝒊𝒊𝒊𝒊 ) + 𝛽𝛽𝛽𝛽1𝑖𝑖𝑖𝑖𝑙𝑙𝑙𝑙 𝑃𝑃𝑃𝑃𝑖𝑖𝑖𝑖 + 𝛽𝛽𝛽𝛽2𝑖𝑖𝑖𝑖𝑙𝑙𝑙𝑙 𝑐𝑐𝑐𝑐𝑖𝑖𝑖𝑖 + 𝜷𝜷𝜷𝜷𝟑𝟑𝟑𝟑𝒍𝒍𝒍𝒍𝒊𝒊𝒊𝒊 𝑿𝑿𝑿𝑿𝑖𝑖𝑖𝑖 +𝛽𝛽𝛽𝛽4𝑖𝑖𝑖𝑖𝑙𝑙𝑙𝑙 𝒁𝒁𝒁𝒁𝑖𝑖𝑖𝑖 ∗ 𝑐𝑐𝑐𝑐𝑖𝑖𝑖𝑖
2
Random effect
1+exp [𝒑𝒑𝒑𝒑𝒊𝒊𝒊𝒊𝒍𝒍𝒍𝒍 ]
0.0533 (0.0976)
112
0.4883
0.562
exp [𝒑𝒑𝒑𝒑𝒊𝒊𝒊𝒊𝒍𝒍𝒍𝒍 ]
𝑖𝑖𝑖𝑖𝑖𝑖𝑖𝑖
𝒍𝒍𝒍𝒍 𝒊𝒊𝒊𝒊𝒊𝒊𝒊𝒊𝒍𝒍𝒍𝒍
1+exp To
[𝒑𝒑𝒑𝒑𝒊𝒊𝒊𝒊𝒍𝒍𝒍𝒍 ] estimate the coefficients used in the above
value for 2018 matches the actual value.
(This
is 𝒊𝒊𝒊𝒊
[𝐷𝐷𝐷𝐷𝐷𝐷𝐷𝐷𝐷𝐷𝐷𝐷_𝐾𝐾𝐾𝐾𝑐𝑐𝑐𝑐𝐾𝐾𝐾𝐾𝑙𝑙𝑙𝑙 + 𝐷𝐷𝐷𝐷𝐷𝐷𝐷𝐷𝐷𝐷𝐷𝐷2018 − 𝐷𝐷𝐷𝐷𝐷𝐷𝐷𝐷𝐷𝐷𝐷𝐷_𝐾𝐾𝐾𝐾𝑐𝑐𝑐𝑐𝐾𝐾𝐾𝐾𝑙𝑙𝑙𝑙2018 ] × (1 − 𝑊𝑊𝑊𝑊𝑊𝑊𝑊𝑊𝐷𝐷𝐷𝐷𝑊𝑊𝑊𝑊𝐷𝐷𝐷𝐷𝑡𝑡𝑡𝑡 )
𝐷𝐷𝐷𝐷𝐷𝐷𝐷𝐷𝐶𝐶𝐶𝐶𝑡𝑡𝑡𝑡 =
necessar y as the MIR AGRODEP model has been
formula, we 𝑡𝑡𝑡𝑡considered
alternative models,
𝒑𝒑𝒑𝒑
𝒃𝒃𝒃𝒃𝒊𝒊𝒊𝒊𝒊𝒊𝒊𝒊the
𝛽𝛽𝛽𝛽1𝑖𝑖𝑖𝑖𝑙𝑙𝑙𝑙 𝑃𝑃𝑃𝑃𝑖𝑖𝑖𝑖 values
+ 𝛽𝛽𝛽𝛽2𝑖𝑖𝑖𝑖𝑙𝑙𝑙𝑙 𝑐𝑐𝑐𝑐𝑖𝑖𝑖𝑖 of
+ 𝜷𝜷𝜷𝜷an
𝑐𝑐𝑐𝑐𝑖𝑖𝑖𝑖
calibrated
old
series.)
as summarized in Table A2.2, which yield ver y
𝒊𝒊𝒊𝒊𝒍𝒍𝒍𝒍𝒊𝒊𝒊𝒊 = (𝛽𝛽𝛽𝛽0𝑖𝑖𝑖𝑖𝑙𝑙𝑙𝑙 +to
𝒍𝒍𝒍𝒍𝒊𝒊𝒊𝒊 ) +2018
𝟑𝟑𝟑𝟑𝒍𝒍𝒍𝒍𝒊𝒊𝒊𝒊 𝑿𝑿𝑿𝑿
𝑖𝑖𝑖𝑖 +𝛽𝛽𝛽𝛽FBS
4𝑖𝑖𝑖𝑖𝑙𝑙𝑙𝑙 𝒁𝒁𝒁𝒁𝑖𝑖𝑖𝑖 ∗
similar predictions.
2
2
��𝐶𝐶𝐶𝐶𝐶𝐶𝐶𝐶
Projections
of
MDER
𝐶𝐶𝐶𝐶𝐶𝐶𝐶𝐶
=
+
𝐶𝐶𝐶𝐶𝐶𝐶𝐶𝐶
�
𝑦𝑦𝑦𝑦
𝑟𝑟𝑟𝑟
𝜷𝜷𝜷𝜷𝒍𝒍𝒍𝒍𝒊𝒊𝒊𝒊 = (𝛽𝛽𝛽𝛽0𝑖𝑖𝑖𝑖𝑙𝑙𝑙𝑙 , 𝛽𝛽𝛽𝛽1𝑖𝑖𝑖𝑖𝑙𝑙𝑙𝑙 , 𝛽𝛽𝛽𝛽2𝑖𝑖𝑖𝑖𝑙𝑙𝑙𝑙 , 𝜷𝜷𝜷𝜷𝟑𝟑𝟑𝟑𝒍𝒍𝒍𝒍𝒍𝒍𝒍𝒍 , 𝛽𝛽𝛽𝛽4𝑖𝑖𝑖𝑖𝑙𝑙𝑙𝑙 )
The series of CVy values predicted by the formula
To project the MDER, we simply compute it based
separately for each country for the years 2021–2030
on the data on the composition of the population
𝒃𝒃𝒃𝒃by
𝒊𝒊𝒊𝒊𝒊𝒊𝒊𝒊𝒍𝒍𝒍𝒍𝒊𝒊𝒊𝒊sex and age as projected by the 2019 WPP
is then
calibrated to the observed 2019 historic
� 𝑡𝑡𝑡𝑡 = 𝛼𝛼𝛼𝛼 + 𝛽𝛽𝛽𝛽1 𝐺𝐺𝐺𝐺𝐷𝐷𝐷𝐷𝐷𝐷𝐷𝐷_𝑣𝑣𝑣𝑣𝑃𝑃𝑃𝑃𝑃𝑃𝑃𝑃_𝑝𝑝𝑝𝑝𝑐𝑐𝑐𝑐
𝐶𝐶𝐶𝐶𝐶𝐶𝐶𝐶𝐶𝐶𝐶𝐶
𝑡𝑡𝑡𝑡 + 𝛽𝛽𝛽𝛽2 𝑔𝑔𝑔𝑔𝑔𝑔𝑔𝑔𝑔𝑔𝑔𝑔𝑔𝑔𝑔𝑔_𝑔𝑔𝑔𝑔𝑔𝑔𝑔𝑔𝑔𝑔𝑔𝑔𝑔𝑔𝑔𝑔𝑖𝑖𝑖𝑖𝑒𝑒𝑒𝑒𝑡𝑡𝑡𝑡 + 𝛽𝛽𝛽𝛽3 𝑃𝑃𝑃𝑃𝑃𝑃𝑃𝑃𝑔𝑔𝑔𝑔𝑔𝑔𝑔𝑔𝑔𝑔𝑔𝑔𝑃𝑃𝑃𝑃_𝑅𝑅𝑅𝑅𝑒𝑒𝑒𝑒𝑒𝑒𝑒𝑒𝑒𝑒𝑒𝑒_𝐹𝐹𝐹𝐹𝑃𝑃𝑃𝑃𝑃𝑃𝑃𝑃𝑑𝑑𝑑𝑑𝑡𝑡𝑡𝑡 + 𝛽𝛽𝛽𝛽4 𝑥𝑥𝑥𝑥190_𝑊𝑊𝑊𝑊𝐴𝐴𝐴𝐴𝐴𝐴𝐴𝐴𝑡𝑡𝑡𝑡 + 𝛽𝛽𝛽𝛽5 𝑐𝑐𝑐𝑐𝑃𝑃𝑃𝑃𝑃𝑃𝑃𝑃𝑡𝑡𝑡𝑡 + 𝛽𝛽𝛽𝛽6
exp [𝒑𝒑𝒑𝒑𝒊𝒊𝒊𝒊𝒍𝒍𝒍𝒍 ] to what is done for the DES:
data,
(medium variant).
(1) 𝑃𝑃𝑃𝑃𝑃𝑃𝑃𝑃𝑃𝑃𝑃𝑃𝑃𝑃𝑃𝑃(𝑌𝑌𝑌𝑌 = 1|𝜷𝜷𝜷𝜷 , 𝒃𝒃𝒃𝒃 , 𝑿𝑿𝑿𝑿
) =similarly
exp [𝒑𝒑𝒑𝒑 ]
𝑖𝑖𝑖𝑖𝑖𝑖𝑖𝑖
𝒍𝒍𝒍𝒍
𝒊𝒊𝒊𝒊𝒊𝒊𝒊𝒊𝒍𝒍𝒍𝒍
𝒊𝒊𝒊𝒊
1+exp [𝒑𝒑𝒑𝒑𝒊𝒊𝒊𝒊𝒍𝒍𝒍𝒍 ]
𝒊𝒊𝒊𝒊𝒍𝒍𝒍𝒍
= [𝐷𝐷𝐷𝐷𝐷𝐷𝐷𝐷𝐷𝐷𝐷𝐷_𝐾𝐾𝐾𝐾𝑐𝑐𝑐𝑐𝐾𝐾𝐾𝐾𝑙𝑙𝑙𝑙
+ 𝐷𝐷𝐷𝐷𝐷𝐷𝐷𝐷𝐷𝐷𝐷𝐷2018 − 𝐷𝐷𝐷𝐷𝐷𝐷𝐷𝐷𝐷𝐷𝐷𝐷_𝐾𝐾𝐾𝐾𝑐𝑐𝑐𝑐𝐾𝐾𝐾𝐾𝑙𝑙𝑙𝑙2018 ] × (1 − 𝑊𝑊𝑊𝑊𝑊𝑊𝑊𝑊𝐷𝐷𝐷𝐷𝑊𝑊𝑊𝑊𝐷𝐷𝐷𝐷𝑡𝑡𝑡𝑡 )
(1) 𝑃𝑃𝑃𝑃𝑃𝑃𝑃𝑃𝑃𝑃𝑃𝑃𝑃𝑃𝑃𝑃(𝑌𝑌𝑌𝑌𝑖𝑖𝑖𝑖𝑖𝑖𝑖𝑖 = 1|𝜷𝜷𝜷𝜷𝒍𝒍𝒍𝒍 , 𝒃𝒃𝒃𝒃𝒊𝒊𝒊𝒊𝒊𝒊𝒊𝒊𝒍𝒍𝒍𝒍 , 𝑿𝑿𝑿𝑿𝐷𝐷𝐷𝐷𝐷𝐷𝐷𝐷𝐶𝐶𝐶𝐶
𝒊𝒊𝒊𝒊 ) =𝑡𝑡𝑡𝑡 1+exp [𝒑𝒑𝒑𝒑 ] 𝑡𝑡𝑡𝑡
� 𝑡𝑡𝑡𝑡 + �𝐶𝐶𝐶𝐶𝐶𝐶𝐶𝐶𝐶𝐶𝐶𝐶2019 − 𝐶𝐶𝐶𝐶𝐶𝐶𝐶𝐶𝐶𝐶𝐶𝐶
� 2019 �, ∀𝑡𝑡𝑡𝑡 = 𝑊𝑊𝑊𝑊, … , 2030
𝒊𝒊𝒊𝒊𝒍𝒍𝒍𝒍
Projections of the CV
𝐶𝐶𝐶𝐶𝐶𝐶𝐶𝐶𝐶𝐶𝐶𝐶𝑡𝑡𝑡𝑡 = 𝐶𝐶𝐶𝐶𝐶𝐶𝐶𝐶𝐶𝐶𝐶𝐶
always, the total C V is computed as
𝒑𝒑𝒑𝒑𝒊𝒊𝒊𝒊𝒍𝒍𝒍𝒍As
𝒊𝒊𝒊𝒊 = (𝛽𝛽𝛽𝛽0𝑖𝑖𝑖𝑖𝑙𝑙𝑙𝑙 + 𝒃𝒃𝒃𝒃𝒊𝒊𝒊𝒊𝒊𝒊𝒊𝒊𝒍𝒍𝒍𝒍𝒊𝒊𝒊𝒊 ) + 𝛽𝛽𝛽𝛽1𝑖𝑖𝑖𝑖𝑙𝑙𝑙𝑙 𝑃𝑃𝑃𝑃𝑖𝑖𝑖𝑖 + 𝛽𝛽𝛽𝛽2𝑖𝑖𝑖𝑖𝑙𝑙𝑙𝑙 𝑐𝑐𝑐𝑐𝑖𝑖𝑖𝑖 + 𝜷𝜷𝜷𝜷𝟑𝟑𝟑𝟑𝒍𝒍𝒍𝒍𝒊𝒊𝒊𝒊 𝑿𝑿𝑿𝑿𝑖𝑖𝑖𝑖 +𝛽𝛽𝛽𝛽4𝑖𝑖𝑖𝑖𝑙𝑙𝑙𝑙 𝒁𝒁𝒁𝒁𝑖𝑖𝑖𝑖 ∗ 𝑐𝑐𝑐𝑐𝑖𝑖𝑖𝑖
with T = 2021 for the reference scenario, and
𝐶𝐶𝐶𝐶𝐶𝐶𝐶𝐶
= ��𝐶𝐶𝐶𝐶𝐶𝐶𝐶𝐶𝑦𝑦𝑦𝑦2 + 𝐶𝐶𝐶𝐶𝐶𝐶𝐶𝐶𝑟𝑟𝑟𝑟2 � where the two components
𝑖𝑖𝑖𝑖𝑙𝑙𝑙𝑙 𝑐𝑐𝑐𝑐𝑖𝑖𝑖𝑖 + 𝜷𝜷𝜷𝜷𝟑𝟑𝟑𝟑𝒍𝒍𝒍𝒍𝒊𝒊𝒊𝒊 𝑿𝑿𝑿𝑿𝑖𝑖𝑖𝑖 +𝛽𝛽𝛽𝛽4𝑖𝑖𝑖𝑖𝑙𝑙𝑙𝑙 𝒁𝒁𝒁𝒁𝑖𝑖𝑖𝑖 ∗ 𝑐𝑐𝑐𝑐
𝑖𝑖𝑖𝑖
refer to variabilit y due to differences across
based on their income level, and
𝜷𝜷𝜷𝜷𝒍𝒍𝒍𝒍households,
𝒊𝒊𝒊𝒊 = (𝛽𝛽𝛽𝛽0𝑖𝑖𝑖𝑖𝑙𝑙𝑙𝑙 , 𝛽𝛽𝛽𝛽1𝑖𝑖𝑖𝑖𝑙𝑙𝑙𝑙 , 𝛽𝛽𝛽𝛽2𝑖𝑖𝑖𝑖𝑙𝑙𝑙𝑙 , 𝜷𝜷𝜷𝜷𝟑𝟑𝟑𝟑𝒍𝒍𝒍𝒍𝒍𝒍𝒍𝒍 , 𝛽𝛽𝛽𝛽4𝑖𝑖𝑖𝑖𝑙𝑙𝑙𝑙 )
T = 2020 for the no-COV ID one.
� 𝑡𝑡𝑡𝑡 = 𝛼𝛼𝛼𝛼 + 𝛽𝛽𝛽𝛽1 𝐺𝐺𝐺𝐺𝐷𝐷𝐷𝐷𝐷𝐷𝐷𝐷_𝑣𝑣𝑣𝑣𝑃𝑃𝑃𝑃𝑃𝑃𝑃𝑃_𝑝𝑝𝑝𝑝𝑐𝑐𝑐𝑐𝑡𝑡𝑡𝑡 + 𝛽𝛽𝛽𝛽2 𝑔𝑔𝑔𝑔𝑔𝑔𝑔𝑔𝑔𝑔𝑔𝑔𝑔𝑔𝑔𝑔_𝑔𝑔𝑔𝑔𝑔𝑔𝑔𝑔𝑔𝑔𝑔𝑔𝑔𝑔𝑔𝑔𝑖𝑖𝑖𝑖𝑒𝑒𝑒𝑒𝑡𝑡𝑡𝑡 + 𝛽𝛽𝛽𝛽3 𝑃𝑃𝑃𝑃𝑃𝑃𝑃𝑃𝑔𝑔𝑔𝑔𝑔𝑔𝑔𝑔𝑔𝑔𝑔𝑔𝑃𝑃𝑃𝑃_𝑅𝑅𝑅𝑅𝑒𝑒𝑒𝑒𝑒𝑒𝑒𝑒𝑒𝑒𝑒𝑒_𝐹𝐹𝐹𝐹𝑃𝑃𝑃𝑃𝑃𝑃𝑃𝑃𝑑𝑑𝑑𝑑𝑡𝑡𝑡𝑡 + 𝛽𝛽𝛽𝛽4 𝑥𝑥𝑥𝑥190_𝑊𝑊𝑊𝑊𝐴𝐴𝐴𝐴𝐴𝐴𝐴𝐴𝑡𝑡𝑡𝑡 + 𝛽𝛽𝛽𝛽5 𝑐𝑐𝑐𝑐𝑃𝑃𝑃𝑃𝑃𝑃𝑃𝑃𝑡𝑡𝑡𝑡 + 𝛽𝛽𝛽𝛽6 𝑝𝑝𝑝𝑝𝑃𝑃𝑃𝑃𝑝𝑝𝑝𝑝𝑡𝑡𝑡𝑡
𝐶𝐶𝐶𝐶𝐶𝐶𝐶𝐶𝐶𝐶𝐶𝐶
variabilit
y across individuals based on differences
E. Methodology for assessment of
in sex, age, body mass and physical activit y level.
𝒃𝒃𝒃𝒃𝒊𝒊𝒊𝒊𝒊𝒊𝒊𝒊𝒍𝒍𝒍𝒍𝒊𝒊𝒊𝒊
progress against nutrition targets at the
regional and global level
� 𝑡𝑡𝑡𝑡 + �𝐶𝐶𝐶𝐶𝐶𝐶𝐶𝐶𝐶𝐶𝐶𝐶2019 − 𝐶𝐶𝐶𝐶𝐶𝐶𝐶𝐶𝐶𝐶𝐶𝐶
� 2019 �, ∀𝑡𝑡𝑡𝑡 = 𝑊𝑊𝑊𝑊, … , 2030
𝐶𝐶𝐶𝐶𝐶𝐶𝐶𝐶𝐶𝐶𝐶𝐶𝑡𝑡𝑡𝑡 = 𝐶𝐶𝐶𝐶𝐶𝐶𝐶𝐶𝐶𝐶𝐶𝐶
C Vr is simply computed based on WPP
population projected data (similarly to what we
These methodological notes pertain to results
do for the MDER),
C
Vy
is
computed
using
presented
7, Figures
(1 Table
[
𝐷𝐷𝐷𝐷𝐷𝐷𝐷𝐷𝐶𝐶𝐶𝐶while
− 𝑊𝑊𝑊𝑊𝑊𝑊𝑊𝑊𝐷𝐷𝐷𝐷𝑊𝑊𝑊𝑊𝐷𝐷𝐷𝐷
=
𝐷𝐷𝐷𝐷𝐷𝐷𝐷𝐷𝐷𝐷𝐷𝐷_𝐾𝐾𝐾𝐾𝑐𝑐𝑐𝑐𝐾𝐾𝐾𝐾𝑙𝑙𝑙𝑙
+
𝐷𝐷𝐷𝐷𝐷𝐷𝐷𝐷𝐷𝐷𝐷𝐷
−
𝐷𝐷𝐷𝐷𝐷𝐷𝐷𝐷𝐷𝐷𝐷𝐷_𝐾𝐾𝐾𝐾𝑐𝑐𝑐𝑐𝐾𝐾𝐾𝐾𝑙𝑙𝑙𝑙
𝑡𝑡𝑡𝑡
𝑡𝑡𝑡𝑡
2018
2018 ] × in
𝑡𝑡𝑡𝑡 ) 10 and 11 in Section 2.3
a
linear
combination
of
relevant
macroeconomic
of
the
report.
]
(
)
𝐾𝐾𝐾𝐾𝑐𝑐𝑐𝑐𝐾𝐾𝐾𝐾𝑙𝑙𝑙𝑙𝑡𝑡𝑡𝑡 + 𝐷𝐷𝐷𝐷𝐷𝐷𝐷𝐷𝐷𝐷𝐷𝐷2018 − 𝐷𝐷𝐷𝐷𝐷𝐷𝐷𝐷𝐷𝐷𝐷𝐷_𝐾𝐾𝐾𝐾𝑐𝑐𝑐𝑐𝐾𝐾𝐾𝐾𝑙𝑙𝑙𝑙2018 × 1 − 𝑊𝑊𝑊𝑊𝑊𝑊𝑊𝑊𝐷𝐷𝐷𝐷𝑊𝑊𝑊𝑊𝐷𝐷𝐷𝐷𝑡𝑡𝑡𝑡
and demographic variables, based on the
estimated coefficients from a multiple regression
For Table 7, progress was assessed against the
2
��𝐶𝐶𝐶𝐶𝐶𝐶𝐶𝐶𝑦𝑦𝑦𝑦2C Vy,
𝐶𝐶𝐶𝐶𝐶𝐶𝐶𝐶
+ 𝐶𝐶𝐶𝐶𝐶𝐶𝐶𝐶
𝑟𝑟𝑟𝑟 �fed with the projections from
of =
historic
and
2030 nutrition targets established by UNICEF/
the MIR AGRODEP model and WPP.
W HO 26 and an adapted version of rules from the
W HO-UNICEF Technical Expert Advisor y Group
304
� 𝑡𝑡𝑡𝑡 = 𝛼𝛼𝛼𝛼 + 𝛽𝛽𝛽𝛽1 𝐺𝐺𝐺𝐺𝐷𝐷𝐷𝐷𝐷𝐷𝐷𝐷_𝑣𝑣𝑣𝑣𝑃𝑃𝑃𝑃𝑃𝑃𝑃𝑃_𝑝𝑝𝑝𝑝𝑐𝑐𝑐𝑐𝑡𝑡𝑡𝑡 + 𝛽𝛽𝛽𝛽2 𝑔𝑔𝑔𝑔𝑔𝑔𝑔𝑔𝑔𝑔𝑔𝑔𝑔𝑔𝑔𝑔_𝑔𝑔𝑔𝑔𝑔𝑔𝑔𝑔𝑔𝑔𝑔𝑔𝑔𝑔𝑔𝑔𝑖𝑖𝑖𝑖𝑒𝑒𝑒𝑒𝑡𝑡𝑡𝑡 + 𝛽𝛽𝛽𝛽3 𝑃𝑃𝑃𝑃𝑃𝑃𝑃𝑃𝑔𝑔𝑔𝑔𝑔𝑔𝑔𝑔𝑔𝑔𝑔𝑔𝑃𝑃𝑃𝑃_𝑅𝑅𝑅𝑅𝑒𝑒𝑒𝑒𝑒𝑒𝑒𝑒𝑒𝑒𝑒𝑒_𝐹𝐹𝐹𝐹𝑃𝑃𝑃𝑃𝑃𝑃𝑃𝑃𝑑𝑑𝑑𝑑
on Nutrition
Monitoring
indicators
𝐶𝐶𝐶𝐶𝐶𝐶𝐶𝐶𝐶𝐶𝐶𝐶
+ 𝛽𝛽𝛽𝛽6all
𝑝𝑝𝑝𝑝𝑃𝑃𝑃𝑃𝑝𝑝𝑝𝑝
𝑡𝑡𝑡𝑡 + 𝛽𝛽𝛽𝛽4 𝑥𝑥𝑥𝑥190_𝑊𝑊𝑊𝑊𝐴𝐴𝐴𝐴𝐴𝐴𝐴𝐴
𝑡𝑡𝑡𝑡 + 𝛽𝛽𝛽𝛽5 𝑐𝑐𝑐𝑐𝑃𝑃𝑃𝑃𝑃𝑃𝑃𝑃𝑡𝑡𝑡𝑡 for
𝑡𝑡𝑡𝑡
except
adult
obesit
y,
where
2030
targets
or
𝑔𝑔𝑔𝑔𝑔𝑔𝑔𝑔
𝑔𝑔𝑔𝑔
𝑔𝑔𝑔𝑔_𝑔𝑔𝑔𝑔
𝑔𝑔𝑔𝑔
𝑔𝑔𝑔𝑔𝑔𝑔𝑔𝑔𝑖𝑖𝑖𝑖𝑒𝑒𝑒𝑒
+
𝛽𝛽𝛽𝛽
𝑃𝑃𝑃𝑃𝑃𝑃𝑃𝑃𝑔𝑔𝑔𝑔
𝑔𝑔𝑔𝑔𝑔𝑔𝑔𝑔
𝑃𝑃𝑃𝑃_𝑅𝑅𝑅𝑅𝑒𝑒𝑒𝑒𝑒𝑒𝑒𝑒𝑒𝑒𝑒𝑒_𝐹𝐹𝐹𝐹𝑃𝑃𝑃𝑃𝑃𝑃𝑃𝑃𝑑𝑑𝑑𝑑
+
𝛽𝛽𝛽𝛽
𝑥𝑥𝑥𝑥190_𝑊𝑊𝑊𝑊𝐴𝐴𝐴𝐴𝐴𝐴𝐴𝐴
+
𝛽𝛽𝛽𝛽
𝑐𝑐𝑐𝑐𝑃𝑃𝑃𝑃𝑃𝑃𝑃𝑃
+
𝛽𝛽𝛽𝛽
𝑝𝑝𝑝𝑝𝑃𝑃𝑃𝑃𝑝𝑝𝑝𝑝
2
𝑡𝑡𝑡𝑡
3
𝑡𝑡𝑡𝑡
4
𝑡𝑡𝑡𝑡
5
𝑡𝑡𝑡𝑡
6
𝑡𝑡𝑡𝑡
progress assessment rules have not been
� 𝑡𝑡𝑡𝑡 + �𝐶𝐶𝐶𝐶𝐶𝐶𝐶𝐶𝐶𝐶𝐶𝐶2019 − 𝐶𝐶𝐶𝐶𝐶𝐶𝐶𝐶𝐶𝐶𝐶𝐶
� 2019 �, ∀𝑡𝑡𝑡𝑡 = 𝑊𝑊𝑊𝑊, … , 2030
𝐶𝐶𝐶𝐶𝐶𝐶𝐶𝐶𝐶𝐶𝐶𝐶𝑡𝑡𝑡𝑡 = 𝐶𝐶𝐶𝐶𝐶𝐶𝐶𝐶𝐶𝐶𝐶𝐶
�
�
𝐶𝐶𝐶𝐶𝐶𝐶𝐶𝐶𝐶𝐶𝐶𝐶𝑡𝑡𝑡𝑡 + �𝐶𝐶𝐶𝐶𝐶𝐶𝐶𝐶𝐶𝐶𝐶𝐶2019 − 𝐶𝐶𝐶𝐶𝐶𝐶𝐶𝐶𝐶𝐶𝐶𝐶2019 �, ∀𝑡𝑡𝑡𝑡 = 𝑊𝑊𝑊𝑊, … , 2030
| 175 |
ANNEX 2
established. For adult obesit y, the 2025 target of
“no increase between baseline (2012) and 2025”
was used.
variation in the progress to date to use the
two categories for these indicators. For adult
obesit y, since the target is “no increase”,
for which the required A A RR is ≥ 0, it is not
possible to have a categor y of “off track – some
progress” (yellow) or “off track – no progress”
(light red) and therefore only “off track –
worsening” (dark red) is used.
Assessment not possible: For the five indicators
based on countr y-modelled data (child
stunting, child overweight, low birthweight,
anaemia and adult obesit y), an assessment is
possible for all regions because a modelled
estimate exists for all countries, meaning there
are enough data to generate representative
estimates for all regions and for all years.
For indicators where countr y-modelled
estimates are not available, namely child
wasting and exclusive breastfeeding,
assessment is not possible for regions where
population coverage is < 50 percent (see notes
16 and 17 to Table A2.3).
To determine which progress assessment categor y
to use for each indicator and each region, first,
two distinct annual rates of reduction (A A R R) bb
were calculated: (i) the A A RR required for the
region to reach the 2030 target; and (ii) the actual
A A R R that the region has experienced to date.
The value of the actual A A RR experienced to
date was then used to determine which progress
assessment categor y the region is assigned, while
also considering the required A A RR. See Table A2.3
for A A RR ranges and prevalence thresholds
applied for each categor y and for each indicator,
brief ly:
On track: regions with an actual AARR
that is greater than the required AARR are
categorized as being “on track” (green) to
achieve the target. A static threshold for the
latest prevalence, as noted for each indicator
in Table A2.3, is also used to categorize regions
as being “on track”; for example, any region
for which the most recent (2020) overweight
prevalence is below 3 percent is considered “on
track”, even if its actual A A RR is less than its
required A A R R.
Off track: regions with an actual AARR
that is less than the required AARR and for
which the latest prevalence is above the “on
track” static threshold noted in Table A2.3 are
considered “off track”. The “off track” categor y
is broken down into different sub-categories
depending on the indicator. For the four
indicators of child stunting, child overweight,
child wasting, and anaemia among women,
there are three off track sub-categories: “off
track – some progress” (yellow), “off track
– no progress” (light red) and “off track –
worsening” (dark red). For low birthweight
and exclusive breastfeeding, the categories of
“off track – no progress” (light red) and “off
track – worsening” (dark red) are combined
into one categor y of “off track – no progress
or worsening” which is represented with an
orange colour because there is insufficient
The years of data used to calculate the actual
A A RR experienced to date at the regional level
var y by indicator, as specified in the footnotes
for Table A2.3. The actual A A RRs for each region
are calculated using a trendline comprised of
all estimates available between 2012 (baseline)
and the latest estimate for each indicator,
except for exclusive breastfeeding for which
modelled estimates are not available and which is
calculated using only two estimates: the baseline
(2012) and the latest year available (2019).
The required A A RR is calculated using the
baseline prevalence for the region in 2012 and the
target prevalence as noted in the 2030 Maternal
Infant and Young Child Nutrition targets 26 (e.g.
for child overweight, the required is A A RR is
3.41 percent per year at the global level, which
is the annual rate of change needed to go from
the 2012 baseline prevalence of 5.6 percent to the
targeted 3.0 percent in 2030).
For Figure 10, the actual A A RRs calculated for each
indicator and for each region for Table 7 were used
in the formula below to generate a projected
estimate for 2030 if the current trend from the
actual A A RR were to continue. A dotted line was
then drawn between the latest estimate (end of
the solid line in the graph) and the projected
2030 estimate.
bb See technical note on how to calculate AARR at: https://data.
unicef.org/resources/technical-note-calculate-average-annual-ratereduction-aarr-underweight-prevalence
| 176 |
TABLE A2.3 RULES FOR PROGRESS ASSESSMENT AGAINST THE GLOBAL NUTRITION TARGETS
Indicator
2030 target
Stunting
(< 5 years)
Overweight
(< 5 years)
Reduce the number of
children under 5 who are
stunted by 50%
Reduce and maintain
childhood overweight to
less than 3%
Wasting
(< 5 years)
Reduce and maintain
childhood wasting to less
than 3%
AARR > required5
or prevalence < 3%6
AARR > required5
or prevalence < 3%6
Off track –
some progress
Off track –
no progress
Off track –
worsening
Assessment
not possible
AARR < required,
but > 0.5
-0.5 ≤ AARR < 0.5
AARR < required,
but > 1.5
-1.5 ≤ AARR < 1.5
AARR < required,
but > 2.0
-2.0 ≤ AARR < 2.0
AARR < -0.5
AARR < -1.5
AARR < -2.0
For regions:
assessment is
possible for all
regions13
For countries:
assessment not
possible when data
are insufficient14
For regions:
assessment is
possible for all
regions13
For countries:
assessment not
possible when data
are insufficient14
For regions:
assessment not
possible when
regional population
coverage < 50%15
For countries:
assessment not
possible when data
are insufficient 16
NOTES:
1. For low birthweight and exclusive
breastfeeding the categories of “off track – no
progress” (light red) and “off track – worsening”
(dark red) are combined into one category of “off
track – no progress or worsening” which is
represented with an orange colour, because there
is insufficient variation in current progress to split
these categories for these indicators. For adult
obesity, since the target is “no increase” for
which the required AARR is ≥ 0, it is not possible
to have a category of “off track – some progress”
(yellow) or “off track – no progress” (light red)
and therefore only “off track – worsening” (dark
red) is used.
2. For exclusive breastfeeding, the actual target
is to increase the prevalence of exclusive
breastfeeding (< 6 months) to 70 percent by
2030; however, it has been revised here to reflect
the prevalence of non-exclusive breastfeeding so
that the concept of the AARR can be applied as it
is for the other six targets.
3. The required AARR is based on the change in
stunting prevalence corresponding to a 50
percent reduction in the number of children
affected by stunting between 2012 and 2030,
considering the population growth estimated by
the United Nations World Population Prospects.
Actual AARR is calculated using all years of data
between 2012 and 2020.
4. Regions where the stunting prevalence point
estimate or lower 95 percent confidence interval
for the year 2020 is < 3 percent are considered
on track.
5. The required AARR is based on the required
change in overweight or wasting prevalence to
reduce from the baseline (2012) prevalence to
3 percent by 2030. Actual AARR is calculated using
all years of data between 2012 and 2020. Note that
for wasting, unpublished trend estimates from the
JME are used to generate the actual AARR.
6. Regions where the overweight or wasting
prevalence point estimate for the year 2020 is
< 3 percent are considered on track.
7. The required AARR is based on the change
required to reduce the low birthweight prevalence
by 30 percent between 2012 (baseline year) and
2030. The same AARR of 1.96 is required for all
regions since the target requires a relative
change (reduction by 30 percent) in the baseline
value. Actual AARR is calculated using all years of
data between 2012 and 2015.
8. Regions where the low birthweight prevalence
point estimate for the year 2015, the anaemia
prevalence point estimate for the year 2019 or the
adult obesity prevalence point estimate for the
year 2016 is < 5 percent, are considered on track.
9. The required AARR is based on the required
change to decrease the non-exclusive
breastfeeding prevalence to 30 percent between
Reduce low
birthweight
prevalence by
30%
AARR >
required (i.e.
1.96)7 or
prevalence <
5%8
AARR < 1.96
but > 0.5
AARR < 0.5
For regions:
assessment is
possible for
all regions13
For countries:
not
applicable
2012 (baseline year) and 2030. Actual AARR is
calculated using only two estimates for the years
of 2012 and 2019, where the regional averages
are population weighted using the most recent
estimate for each country between 2005 and
2012 for the 2012 estimate, and between 2014 to
2019 for the 2019 estimate (except for China,
where a 2013 estimate is used for 2019
aggregates).
10. Regions where the non-exclusive breastfeeding
prevalence point estimate for the year 2019 is
< 30 percent (i.e. where exclusive breastfeeding
is ≥ 70 percent) are considered on track.
11. The required AARR is based on the change
required to reduce the prevalence of anaemia
among women of reproductive age by 50 percent
between 2012 (baseline year) and 2030. The
same AARR of 3.78 is required for all regions
since the target requires a relative change
(halving) of the baseline value. Actual AARR is
calculated using all years of data between 2012
and 2019.
12. The required AARR is based on experiencing
“no increase” between 2012 (baseline year) and
2030, which is an AARR of 0. Therefore, any
region with a trend that has shown any increase
between 2012 and 2016 is labelled as “off track –
worsening”. Actual AARR is calculated using all
years of data between 2012 and 2016.
13. The global databases for the five indicators of
Exclusive
breastfeeding1,2
(< 6 months)
Reduce non-exclusive
breastfeeding
prevalence (< 6
months) to 30%
AARR > required9
or prevalence <
30%10
AARR < required,
but > 0.8
AARR < 0.8
For regions:
assessment not
possible when
regional
population
coverage < 50%17
For countries: not
applicable
Anaemia
(women of
reproductive age)
Reduce anaemia
among women of
reproductive age by
50%
AARR >
required (i.e.
3.78)11 or
prevalence
<5%8
AARR < 3.78
but > 0.5
-0.5 ≤ AARR <
0.5
AARR < -0.5
For regions:
assessment is
possible for all
regions13
For countries:
not applicable
stunting, overweight, low birthweight, anaemia
among women of reproductive age, and adult
obesity are based on country-level models which
provide annual estimates for all countries for
generation of regional and global estimates
(i.e. annual estimates are even available for
countries without any household survey data,
even in cases where country-modelled estimates
are not released to the public and used only for
generation of global and regional estimates),
thus making progress assessment possible for
all regions.
14. Progress assessment against the child
stunting and child overweight targets is not
conducted for countries which did not have any
input data (e.g. household survey data) to use in
the country model which were more recent than
the year 2000, or for which modelled estimates
remain pending final review.
15. Progress assessment is not possible for
wasting for regions where population coverage is
< 50 percent. Population coverage is calculated
by dividing the sum of the population of children
under 5 for countries with at least one data point
from household surveys between 1990 and 2020
by the total population of children under 5 for all
countries in the region. Since wasting estimates
are generated with a subregional model, even one
year of data between 1990 and 2020 counts
towards the regional population coverage.
Obesity1
(adults)
2025 target: No increase
in adult obesity
prevalence between
2012 and 2025
AARR ≥ required
(i.e. ≥ 0)12 or
prevalence < 5%8
AARR < 0.0
For regions:
assessment is
possible for all
regions13
For countries: not
applicable
16. Progress assessment against the child
wasting target is not conducted for countries
which do not have at least two data points (e.g.
household surveys) between 2005 and 2020, with
at least one point being more recent than 2012.
17. Progress assessment is not possible for
exclusive breastfeeding where the population
coverage of country survey data for the region is
< 50 percent for the 2012 and/or the 2019
estimate. For 2012, population coverage is
calculated by dividing the sum of the population
of children under 5 for countries with at least one
data point from household surveys between 2005
and 2012 by the total population of children
under 5 for all countries in the region. For 2019,
population coverage is calculated by dividing the
sum of the population of children under 5 for
countries with at least one data point from
household surveys between 2014 and 2019
(except for China, where an estimate from a 2013
survey is used) by the total population of children
under 5 for all countries in the region.
SOURCE: This table was made using information
from: (i) WHO & UNICEF. 2017. Methodology for
monitoring progress towards the global nutrition
targets for 2025 – technical report; and (ii) WHO
& UNICEF. 2017. The extension of the 2025
Maternal, Infant and Young Child nutrition targets
to 2030. Geneva, Switzerland and New York,
USA, WHO and UNICEF.
THE STATE OF FOOD SECURITY AND NUTRITION IN THE WORLD 2021
AARR > required3
or prevalence < 3%4
| 177 |
On track
Low
birthweight1
ANNEX 2
which progress assessment is not possible.
At the countr y level, progress assessment
against the stunting and overweight targets
is not conducted for countries which did not
have any input data (e.g. household sur vey
data) to use in the countr y model post-2000, or
for which modelled estimates remain pending
final review. For wasting, since a countr y-level
model is not available, the calculation of the
A A RR is done using all available countr y data
(e.g. from household sur veys) between 2005
and 2020 in the 2021 JME countr y dataset
for countries with at least two data points, of
which at least one was more recent than 2012.
Therefore, assessment against the wasting
target is not possible for countries that do not
have at least two data points between 2005 and
2020, with at least one point being more recent
than 2012. n
Projected estimate in 2030 if current trends
continue = j * (1-a ^(2030 –2012))
where:
J = Baseline (2012) prevalence estimate
a = Actual A A RR
For Figure 11, progress assessment at the countr y
level is reported for child stunting, child
overweight and child wasting. The methods
applied for the countr y assessments for these
indicators largely follow those applied for the
regional assessments in Table 7, described in the
previous paragraphs and in Table A2.3. For the two
indicators for which countr y modelled estimates
are available, namely child stunting and child
overweight, the only variation between the
assessment methods at the regional and countr y
levels relate to designation of countries for
| 178 |
ANNEX 3
COUNTRY EXPOSURE
TO THE DRIVERS AND
PoU CHANGE POINT
ANALYSIS IN CHAPTER 3
A. Occurrence of the three drivers
is based on the Centre for Research on the
Epidemiolog y of Disasters (EM-DAT). 326
Occurrence of conflict
Refers to the total number of violent conf licts
– caused by internal or intrastate conf licts – in
each of the five subperiods (from 2000 to 2019),
while the frequency is denoted by the percentage
of time, i.e. the number of years in each five-year
subperiod when a countr y experienced a violent
conf lict ( Figure 15A).
Methodology: The four t y pologies of climate
extremes have been updated from The State of
Food Security and Nutrition in the World 2018 3
(see Annex 2 for additional details) to cover most
recent years. See Holleman et al. (2020). 4
Occurrence of economic downturns
Data sources: The Uppsala Conf lict Data Program
(UCDP) dataset 305 on the number of violent conflicts.
Refers to the percentage of countries reporting
a negative per capita GDP growth between two
successive years (annual % change) during the
period 2011–2021, with sub-Saharan Africa, Latin
America and Western Asian countries being
disproportionately affected ( Figure 15C).
Methodology: Information on conf licts has been
updated from The State of Food Security and
Nutrition in the World 20171 (see Annex 2 for
additional details) to cover most recent years.
See Holleman et al. (2017). 2
Data sources: IMF World Economic Outlook
( W EO) time series (April 2021) 327 on per capita
annual GDP.
Occurrence of climate extremes
Exposure to climate extremes refers to the
percentage of countries that experienced at least
one typolog y of climate extremes (drought, flood,
heat spell, storm) in each subperiod from 2000
to 2020 that includes three subperiods of five
years: 2000–2004; 2005–2009; 2010–2014; and one
subperiod of six years: 2015–2020. High exposure
refers to countries that reported three or four
different types of climate extremes during a given
subperiod ( Figure 15B). Frequency is denoted by the
percentage of time, i.e. the number of years in each
subperiod when a country experienced at least one
typolog y of climate extremes.
B. PoU change point analysis
of the three drivers
Increasing change points in the prevalence of
undernourishment are identified for low- and
middle-income countries when a subsequent
increasing tendency in the PoU time series
occurs. Specifically, the condition to identif y
an increasing change point at time t, is an
increasing PoU trend from t-2 up to t+2. A PoU
time series in years 2008 –2020 is used to identif y
increasing change points in PoU between 2010
and 2018. The PoU time series has been revised
in 2020. In particular, a discontinuit y in the
methodolog y used to estimate the dietar y energ y
consumption (DEC) has been introduced during
years 2009–2010 in the revised version of the PoU
series, instead of years 2013 –2014 used in the
previous version. This has implied a shift in the
identification of years when an increasing PoU
change point occurred in the current analysis,
compared to the analysis conducted in The State
of Food Security and Nutrition in the World 2018. 3
Data sources: Drought information is based on the
European Centre for Medium-Range Weather
Forecasts (ECMWF) 323 for years 2001–2005 (ER A5),
and on the Anomaly Hotspots of Agriculture
Production (ASAP) 324 for years 2006–2020.
Flood information is based on the Climate Hazards
Group Infrared Precipitation with Stations
(CHIRPS). 325 Heat spell information is based on
the European Centre for Medium-Range Weather
Forecasts (ECMWF) 323 (ER A5). Storm information
| 179 |
ANNEX 3
An increasing PoU change point associated
with conf lict is identified for any year between
2010 and 2018 when a countr y experiences
an increasing PoU change point along with a
conf lict in at least one of the two subperiods
(2010 –2014 or 2015 –2019) while suffering
from 500 or more battle deaths during that
subperiod ( Figure 17).
An increasing PoU change point associated
with climate extremes is identified in the
year when a countr y reports an increasing
change point along with the occurrence of at
least one of these extremes: i) a severe ASAP
drought warning of the most severe rank
(from 1 to 4); ii) a heat spell; iii) a f lood;
iv) a storm ( Figure 17).
An increasing PoU change point associated
with economic slowdowns and downturns is
identified when an economic slowdown or
downturn is reported in one of the two years
before the occurrence of the PoU change point,
for instance during 2015 –2016 or 2016 –2017 if
the PoU change point occurs in 2017 ( Figure 17).
Methodology: The PoU change point analysis
has been updated from The State of Food Security
and Nutrition in the World 2018 (see Annex 3 for
additional details) 3 to cover most recent years.
See Holleman et al. (2020). 4 n
| 180 |
ANNEX 4
COUNTRY GROUP
DEFINITIONS AND
LISTS OF COUNTRIES
AFFECTED BY DRIVERS
IN CHAPTER 3
B. Definition of countries affected by
drivers (years 2010–2019)
The analysis of Chapter 3 is focused on 133 low- and
middle-income countries and territories for which
relevant information on the key drivers of food
insecurity is available. Following the latest World
Bank classification of income, of the 133 countries,
29 are low-income, 50 are lower-middle-income and
54 are upper-middle-income. Of the 133 countries,
110 low- and middle-income countries have
information on the prevalence of undernourishment
for years 2010–2019.
Countries affected by conflict
Refers to low- and middle-income countries and
territories affected by conf lict for at least one
subperiod of five consecutive years and having
suffered 500 or more battle deaths during that
subperiod. The timeframe spans from 2000 to
2019, with four periods of five years: 2000 –2004;
2005 –2009; 2010 –2014; 2015 –2019. Of the
133 low- and middle-income countries, there are
40 low- and middle-income countries that meet
these criteria.
A. Definition of country groups
Protracted crisis
Data sources: The Uppsala Conf lict Data
Program (UCDP) dataset 305 on the number of
violent conf licts.
The 2020 edition of this report defines protracted
crisis situations as “characterized by recurrent
natural disasters and/ or conflict, longevity of food
crises, breakdown of livelihoods and insufficient
institutional capacity to react to the crises.” There
are three criteria used to define a country with
a protracted crisis situation: (i) longevity of the
crisis; (ii) humanitarian aid flow to the country;
and (iii) the country’s economic and food security
status. Specifically, the list of countries with a
protracted crisis situation includes those that meet
the following three criteria:
Methodology: Information on conf licts has been
updated from The State of Food Security and
Nutrition in the World 20171 (see Annex 2 for
additional details) to cover most recent years.
See Holleman et al. (2017). 2
Countries affected by climate extremes
Refers to low- and middle-income countries
that experience a combination of high exposure
to climate extremes (i.e. drought, flood, heat
spell, storm) and v ulnerability to climate factors.
High exposure is defined when a countr y
experiences three or four different typologies of
climate extremes during the two subperiods of
2010 –2014 or 2015 –2019 or, alternatively, when
extremes occur for at least 7 years in 2010 –2019.
Climate-related v ulnerability is identified when at
least one of the following conditions occurs: i) a
countr y shows a high and statistically significant
association between cereal production or imports
and at least one climate factor (temperature,
precipitation and vegetation growth) during years
2001–2020; ii) a countr y is highly dependent on
agriculture, measured by 60 percent or more
1. The countr y is a low-income food-deficit
countr y (LIFDC), as defined by FAO in 2018.
2. The countr y has faced a shock – either natural
or human-induced – for four consecutive years
between 2016 and 2019, or for eight of ten
years between 2010 and 2019, and is reported
in the list of countries requiring external
assistance for food. 306
3. The countr y received more than 10 percent of
total official development assistance (ODA) in
the form of humanitarian assistance between
2009 and 2017. 307
For 2020, there are 22 countries that meet the
above three criteria.
| 181 |
ANNEX 4
people employed in the agriculture sector in
2019; iii) a countr y shows an increasing PoU
change point in correspondence with a severe
ASAP drought warning. Of the 133 low- and
middle-income countries, there are 75 low- and
middle-income countries that meet these criteria.
distribution, given information available
during years 2010 –2018. Of the 133 low- and
middle-income countries, there are 54 low- and
middle-income countries that meet these criteria.
Data sources: World Development Indicators of the
World Bank. 292
Data sources: Drought information is based
on the Anomaly Hotspots of Agriculture
Production (ASAP). 324 Flood information is
based on the Climate Hazards Group Infrared
Precipitation with Stations (CHIRPS). 325 Heat
spell information is based on the European
Centre for Medium-Range Weather Forecasts
(ECM W F) 323 (ER A5). Storm information is based
on the Centre for Research on the Epidemiolog y
of Disasters (EM-DAT). 326
C. Definition of countries affected by
multiple drivers (years 2010–2019)
Countries affected by multiple drivers are those
experiencing a combination of two or more drivers
during years 2010 –2019. Of the 133 low- and
middle-income countries, 41 are affected by the
following combinations of multiple drivers: conflict
and climate extremes (23 countries), conflict
and economic downturns (4 countries), climate
extremes and economic downturns (9 countries),
and all three drivers (5 countries).
Methodology: Information on countries affected
by climate extremes has been updated from The
State of Food Security and Nutrition in the World
2018 3 (see Annex 2 for definition of exposure and
v ulnerabilit y to climate extremes) to cover most
recent years. See Holleman et al. (2020). 4
For the analysis in Chapter 3, however,
there are 110 countries (of the 133) with
available information on the prevalence of
undernourishment, of which 36 countries are
affected by multiple drivers. For the three regions
analysed in Figure 23 (Africa, Asia, and Latin America
and the Caribbean), around 36 percent (34 of 95)
of low- and middle-income countries affected by
drivers suffered from multiple drivers.
Countries affected by economic downturns
Refers to low- and middle-income countries
that experience an economic downturn in one
of the two years before the occurrence of an
increasing PoU change point, and during the
period 2010 –2018. Specifically, a PoU change
point characterized by an increasing tendency
between t-2 and t+2 is identified at time t, and it
should occur in correspondence with an economic
downturn reported at time t, or at time t-1. Of the
133 low- and middle-income countries, there are
24 low- and middle-income countries that meet
these criteria.
Furthermore, given the 110 countries, eight
mutually exclusive groups denoting countries
affected by different drivers are created. These are
ordered by severit y of PoU:
1. Conf lict, climate extremes and economic
downturns (5)
2. Climate extremes and economic downturns (9)
3. Conf lict (5)
4. Economic downturns (6)
5. Conf lict and climate extremes (18)
6. Conf lict and economic downturns (4)
7. None of the three drivers (29)
8. Climate extremes (34)
Data sources: IMF World Economic Outlook
( W EO) time series (April 2021) 327 on per capita
annual GDP.
Methodology: For the PoU change point analysis,
see The State of Food Security and Nutrition in the
World 2018 (see Annex 3 for additional details) 3
and Holleman et al. (2017). 2
Figure A4.1 shows countries grouped by the eight
categories denoting different combinations of
drivers and Table A4.1 provides the countr y list.
Since the association between multiple drivers
and undernourishment is the key objective of
Chapter 3, Figure A4.1 and Table A4.1 report information
for the 110 countries with available PoU. n
Countries with high income inequality
Refers to low- and middle-income countries
that report a Gini index that is higher than
the median value of the income inequalit y
| 182 |
THE STATE OF FOOD SECURITY AND NUTRITION IN THE WORLD 2021
FIGURE A4.1 COUNTRIES BY COMBINATION OF DRIVERS
COMBINATIONS OF DRIVERS
No data
Climate extremes
Conflict
Conflict – Climate extremes
Conflict – Economic downturns
Economic downturns
Climate extremes – Economic downturns
Conflict – Climate extremes – Economic downturns
None
NOTES: Of the 110 low- and middle-income countries, the figure shows eight mutually exclusive categories of low- and middle-income countries affected
by different combinations of drivers (conflict, climate extremes and economic downturns). The final boundary between the Republic of the Sudan and the
Republic of South Sudan has not been yet determined. The final status of the Abyei area, Jammu and Kashmir, and the Malvinas Islands have not yet been
determined. The boundaries shown on this map do not imply the expression of any opinion whatsoever on the part of FAO concerning the legal status of
any country, territory, city or area or of its authorities, or concerning the delimitation of its frontiers and boundaries. Dashed lines on maps represent
approximate border lines for which there may not yet be full agreement.
SOURCES: Violent conflict data based on Uppsala University. 2021. Uppsala Conflict Data Program (UCDP). In: UCDP [online]. Uppsala, Sweden. [Cited
10 June 2021]. ucdp.uu.se; for years 2000–2005 updated drought provided by EU-JRC using data from the European Commission. 2021. Anomaly
Hotspots of Agricultural Production (ASAP). In: ASAP [online]. Brussels. [Cited 10 June 2021]. mars.jrc.ec.europa.eu/asap; updated flood data provided
by UCT using Climate Hazards Center of the University of California – Santa Barbara. 2021. CHIRPS: Rainfall estimates from rain gauge and satellite
observations. In: CHIRPS [online]. Santa Barbara, USA. [Cited 10 June 2021]. www.chc.ucsb.edu/data/chirps; updated heat spell data provided by UCT
using data from the European Centre for Medium-Range Weather Forecasts (ECMWF). 2021. Datasets. In: ECMWF [online]. Reading, United Kingdom.
[Cited 10 June 2021]. www.ecmwf.int/en/forecasts/datasets; updated storm data based on Centre for Research on the Epidemiology of Disasters (CRED).
2021. EM-DAT: the international disasters database. In: EM-DAT [online]. Brussels. [Cited 10 June 2021]. public.emdat.be; annual per capita GDP based
on IMF. 2021. World Economic Outlook Database - April 2021. In: IMF [online]. Washington, DC. [Cited 10 June 2021]. www.imf.org/en/Publications/WEO/
weo-database/2021/April
| 183 |
ANNEX 4
TABLE A4.1 LIST OF COUNTRIES BY COMBINATION OF DRIVERS
A. Countries affected by no
driver (N=29)
B. Countries affected by
conflict (N=5)
C. Countries affected by
climate extremes (N=34)
D. Countries affected by
economic downturns (N=6)
Low-income
Low-income
Low-income
Lower-middle-income
Burkina Faso
Liberia
Democratic People’s Republic
of Korea
Congo*
Sierra Leone
Mali
Malawi*
Kiribati
Togo*
Lower-middle-income
Mozambique*
Vanuatu
Lower-middle-income
Algeria
Lower-middle-income
Upper-middle-income
Benin*
Cameroon*
Bangladesh
Dominica
Bolivia (Plurinational State of)*
Upper-middle-income
Cambodia
Ecuador*
Cabo Verde*
Iraq
El Salvador
Jordan
Comoros*
Ghana*
Djibouti*
Kenya*
Eswatini*
Kyrgyzstan
Honduras*
Lao People’s Democratic
Republic
Papua New Guinea
Mauritania
Sao Tome and Principe*
Mongolia
Solomon Islands
Morocco*
Timor-Leste
Nicaragua*
Tunisia
Senegal*
Upper-middle-income
United Republic of Tanzania*
Azerbaijan
Viet Nam
Belarus
Upper-middle-income
Bosnia and Herzegovina
Albania
Bulgaria*
Argentina
Fiji
Armenia
Gabon
Botswana*
Guyana
Brazil*
Kazakhstan
China
Malaysia*
Costa Rica*
Namibia*
Cuba
North Macedonia
Dominican Republic*
Samoa*
Guatemala*
St. Vincent and the Grenadines
Jamaica
Suriname
Mexico*
Montenegro*
Paraguay*
Peru*
Serbia
Turkmenistan
| 184 |
THE STATE OF FOOD SECURITY AND NUTRITION IN THE WORLD 2021
TABLE A4.1 (CONTINUED)
E. Countries affected by
conflict and climate extremes
(N=18)
F. Countries affected by
conflict and economic
downturns (N=4)
G. Countries affected by
climate extremes and
economic downturns (N=9)
H. Countries affected by
conflict, climate extremes and
economic downturns (N=5)
Low-income
Low-income
Low-income
Low-income
Chad*
Sudan
Gambia
Afghanistan
Ethiopia
Lower-middle-income
Haiti*
Central African Republic
Rwanda*
Angola*
Madagascar*
Democratic Republic
of the Congo*
Somalia
Côte d’Ivoire*
Lower-middle-income
Nepal
Lower-middle-income
Lesotho*
Egypt
Upper-middle-income
India
Belize
Myanmar
Iran (Islamic Republic of)*
Pakistan
Lebanon
Philippines*
South Africa*
Sri Lanka*
Venezuela (Bolivarian
Republic of)
Yemen
Lower-middle-income
Nigeria
Ukraine
Uzbekistan
Upper-middle-income
Colombia*
Georgia
Indonesia
Russian Federation
Thailand
Turkey*
NOTES: The table shows the list of 110 low- and middle-income countries with information on PoU that are affected by different combinations of
drivers (conflict, climate extremes and economic downturns). Countries highlighted in yellow denote low-income food-deficit countries (LIFDCs), while
the asterisk denotes countries with high income inequality.
SOURCES: World Bank. 2021. World Development Indicators. In: World Bank [online]. Washington, DC. [Cited 24 April 2020]. datatopics.worldbank.
org/world-development-indicators for poverty and Gini index data; see sources of Figure A4.1 for drivers (conflict, climate extremes, economic
downturns).
| 185 |
ANNEX 5
COUNTRY GROUP
DEFINITIONS FOR THE
ANALYSIS OF FOOD
INSECURITY AND
DRIVERS IN 2020
Given the exceptional situation related to
the COV ID-19 pandemic in 2020, Chapter 3
presents a separate analysis of the drivers of
food insecurit y in 2019–2020 along with more
specific definitions.
2. Countries in a food crisis situation where
conflict is the main driver of acute food
insecurity. There are 23 countries and
territories with conflict/insecurity as the main
driver in 2020: Afghanistan, Bangladesh,
Burkina Faso, Cameroon, Central African
Republic, Chad, Democratic Republic of the
Congo, Eg ypt (Syrian refugees), Iraq, Jordan
(Syrian refugees), Lebanon (Syrian refugees),
Libya, Mali, Niger, Nigeria, Pakistan, Palestine,
South Sudan, Syrian Arab Republic, Turkey
(Syrian refugees), Uganda, Ukraine, Yemen.
A. Countries with a high increase in food
insecurity from 2019 to 2020
Defined as low- and middle-income countries
that report an increase in the prevalence of
undernourishment from 2019 to 2020 that is higher
than the increase experienced in the two previous
years, from 2017 to 2019. Of the 107 countries
with information available on PoU in 2019–2020,
66 countries report a higher increase in PoU in
2019–2020 compared to 2017–2019 ( Figure 19).
In Figure 19, countries affected by conflict are
identified using one of the two criteria; in Figure 24,
they are identified using only the second criterion.
Data sources: The Uppsala Conf lict Data Program
(UCDP) dataset 305 on the number of violent
conf licts. Global Report on Food Crises (2021) 75 for
the countries where conf lict is the main driver of
food insecurit y.
B. Countries affected by economic
downturns
Defined as low- and middle-income countries
that report a negative GDP per capita growth in
year 2020.
D. Countries affected by climate extremes
or climate-related disasters
Data sources: IMF World Economic Outlook
( W EO) time series (April 2021) 327 on per capita
annual GDP.
Refers to low- and middle-income countries and
territories that meet one of two criteria:
C. Countries affected by conflict
1. Countries exposed to at least one t y polog y of
climate extremes (drought, f lood, heat spell) in
year 2020.
2. Countries that experience any of the following
climate-related disasters in 2020: extreme
temperatures, f loods and storms, based on the
EM-DAT datasets of medium- and large-scale
disasters. Exposure to climate-related disasters
is defined when in a given countr y/year one
of the three disasters has produced at least
one of the following effects: i) deaths of ten or
more people; ii) 100 or more people affected/
Refers to low- and middle-income countries and
territories that meet one of two criteria:
1. Countries affected by conf lict for at least one
subperiod of five consecutive years and having
suffered 500 or more battle deaths during that
subperiod. We consider the two most recent
periods of five year to define countries affected
by conf lict in 2020: 2010 –2014 and 2015 –2019.
| 186 |
THE STATE OF FOOD SECURITY AND NUTRITION IN THE WORLD 2021
injured/homeless; iii) declaration by the
countr y of a state of emergency or an appeal
for international assistance.
a breakdown of countries affected by different
combinations of drivers. Of the 66 countries,
8 countr y groups are affected by different
combinations of drivers, and one group is not
affected by drivers. These are:
Data source: For year 2020, drought information is
based on the Anomaly Hotspots of Agriculture
Production (ASAP); 324 f lood information is
based on the Climate Hazards Group Infrared
Precipitation with Stations (CHIRPS); 325 heat
spell information is based on the European
Centre for Medium-Range Weather Forecasts
(ECM W F) 323 (ER A5). Information on
climate-related disasters (extreme temperatures,
f loods and storms) is based on the Centre for
Research on the Epidemiolog y of Disasters
(EM-DAT). 326
1. Economic downturns (11)
2. Economic downturns and climate-related
disasters (19)
3. Economic downturns, conf lict (food crisis) and
climate-related disasters (5)
4. Economic downturns, conf lict and
climate-related disasters (5)
5. Economic downturns and conf lict
(food crisis) (2)
6. Economic downturns and climate extremes (15)
7. Economic downturns, conf lict (food crisis) and
climate extremes (2)
8. Economic downturns, conf lict and climate
extremes (1)
9. No economic downturns (6)
Methodology: Information on countries affected
by climate extremes has been updated from The
State of Food Security and Nutrition in the World
2018 3 (see Annex 2 for definition of exposure and
v ulnerabilit y to climate extremes) to cover most
recent years. See Holleman et al. (2020). 4
Countries affected by economic downturns
combined with more extreme forms of
climate extremes (climate-related disasters)
and/or conf lict (food crisis) show the highest
increases in PoU between 2019 and 2020.
Of the 107 countries, there were 49 countries
that meet this criteria in 2020. Figure 24 presents
increases in PoU between 2019 and 2020 for five
countr y groups:
E. Definition of countries affected by
multiple drivers in 2020
Due to the extraordinar y nature of the economic
recession related to the COV ID-19 pandemic,
there were economic downturns in most of
the countries in the world in 2020. Of the
107 countries with available information on
PoU and GDP per capita growth in 2019 and
2020, 66 countries experienced an increase in
PoU from 2019 to 2020 that was higher than
the PoU increase from 2017 to 2019. Of these,
60 are affected by one or more combination of
drivers, including more severe forms of climate
extremes (climate-related disasters) and conf lict
(food crisis countries where conf lict is the main
driver of acute food insecurit y). Figure 19 presents
1. Economic downturns (49)
2. Economic downturns and conf lict
(food crisis) (7)
3. Economic downturns and climate-related
disasters (35)
4. All three drivers - economic downturns,
climate-related disasters and conf lict
(food crisis) (7)
5. Countries without economic downturns (9). n
| 187 |
ANNEX 6
GLOSSARY
Acute food insecurity
Food insecurit y found in a specified area at
a specific point in time and of a severit y that
threatens lives or livelihoods, or both, regardless
of the causes, context or duration. Has relevance
in providing strategic g uidance to actions that
focus on short-term objectives to prevent,
mitigate or decrease severe food insecurit y. 308
obser ved values of the variable. For simplicit y,
both extreme weather events and extreme
climate events are referred to collectively as
“climate extremes”. 310
Climate resilience
An approach to building and/or strengthening
resilience (see resilience definition below) that
addresses current or expected climate variabilit y
and changing average climate conditions.
Affordability
Affordabilit y refers to the abilit y of people to buy
foods in their local environment. In this report,
cost refers to what people have to pay to secure
a healthy diet, while affordabilit y refers to the
cost relative to a person’s income, minus other
required expenses.
Climate shocks
Climate shocks include not only those
disturbances in the usual pattern of rainfall
and temperatures but also complex events like
droughts and f loods. Equivalent to the concept
of a natural hazard or stress, they are exogenous
events that can have a negative impact on
food and nutrition securit y, depending on the
v ulnerabilit y of an individual, a household, a
communit y, or systems to the shock. 311,312,313,314
Animal source foods
All t ypes of meat, poultr y, fish, eggs, milk,
cheese and yoghurt, and other dair y products.
Chronic food insecurity
Food insecurit y that persists over time
mainly due to structural causes. Can include
seasonal food insecurit y found in periods with
non-exceptional conditions. Has relevance in
providing strategic g uidance to actions that focus
on the medium- and long-term improvement of
the qualit y and quantit y of food consumption for
an active and healthy life. 308
Climate variability
Refers to variations in the mean state and other
statistics (standard deviations, the occurrence
of extremes, etc.) of the climate on all spatial
and temporal scales beyond that of individual
weather events. Variabilit y may be due to natural
internal processes within the climate system
(internal variabilit y), or to variations in natural
or anthropogenic external forcing (external
variabilit y). 309
Climate
Climate in a narrow sense is usually defined as
the average weather, or more rigorously, as the
statistical description in terms of the mean and
variabilit y of relevant quantities over a period
of time ranging from months to thousands or
millions of years. 309
Conflict
Conf lict as used in this report is defined as
struggles between interdependent groups that
have either actual or perceived incompatibilities
with respect to needs, values, goals, resources
or intentions. This definition includes (but is
broader than) armed conf lict – that is, organized
collective violent confrontations between at
least two groups, either state or non-state actors.
This report focuses on conf licts that threaten or
entail violence or destruction, including where
fragilit y raises the risk of damaging conf licts and
where protracted crises persist.
Climate change
Climate change refers to a change in the state of
the climate that can be identified (e.g. by using
statistical tests) by changes in the mean and/or the
variability of its properties, and that persists for
an extended period, typically decades or longer. 309
Climate extreme (extreme weather or climate event)
The occurrence of a value of a weather or climate
variable above (or below) a threshold value
near the upper (or lower) ends of the range of
Diet quality
Comprised of four key aspects: variet y and/
or diversit y (within and across food groups),
| 188 |
THE STATE OF FOOD SECURITY AND NUTRITION IN THE WORLD 2021
production, or conf lict that disrupts trade and
production, are examples of supply-side shocks.
adequacy (sufficiency of nutrients or food groups
compared to requirements), moderation (foods
and nutrients that should be consumed with
restraint) and overall balance (composition of
macronutrient intake). Exposure to food safet y
hazards is another important qualit y aspect.
Economic slowdown
Refers to economic activit y that is growing
at a slower pace compared with the previous
period. An economic slowdown occurs when
real GDP growth declines from one period of
time to another but it is still positive. In the
analyses and fig ures presented in this report, an
economic slowdown is identified using the year
as the period of reference, although it is usually
measured in quarters of a year.
Dietary energy requirements
The amount of dietar y energ y required by an
individual to maintain body functions, health
and normal activit y. Dietar y energ y requirements
are dependent upon age, sex, body size and level
of physical activit y. Additional energ y is required
to support optimal growth and development in
children and in women during pregnancy, and
for milk production during lactation, consistent
with the good health of mother and child.
Energy-dense foods
Food with a high content of calories (energ y)
with respect to its mass or volume.
Exposure
The presence of people; livelihoods; species or
ecosystems; environmental functions, ser vices
and resources; infrastructure; or economic, social
or cultural assets in places and settings that
could be adversely affected. 309
Drought
A period of abnormally dr y weather lasting
long enough to cause a serious hydrological
imbalance. 309
Early warning system (EWS)
The set of capacities needed to generate and
disseminate timely and meaningful warning
information so that individuals, communities and
organizations threatened by a hazard can prepare
prompt and appropriate action to reduce the
possibilit y of harm or loss. 309,310,315
Extreme poverty
Refers to the percentage of the population living
on less than USD 1.90 a day (2011 PPP prices) in
a countr y in a given year.
Extreme weather or climate event
The occurrence of a value of a weather or
climate variable above (or below) a threshold
value near the upper (or lower) ends of the
range of obser ved values of the variable.
Many weather and climate extremes are the
result of natural climate variability, and natural
decadal or multi-decadal variations in the
climate provide the backdrop for anthropogenic
climate changes. Even if there were no
anthropogenic changes in climate, a wide
variet y of natural weather and climate extremes
would still occur.
Economic downturn
Refers to a period of decline in economic activit y
or negative growth as measured by the growth
rate in real GDP. It is a synonym for economic
recession, a temporar y or short-term downturn
in economic growth, usually occurring over at
least two consecutive quarters of decline. In the
analyses and fig ures presented in this report, an
economic downturn is identified using the year
as a period of reference.
Economic shock
An unexpected or unpredictable event that
is external to the specific economy and can
either harm or boost it. A global financial crisis
causing bank lending or credit to fall, or an
economic downturn in a major trading partner
of a countr y ref lect demand-side shocks that
can have multiple effects on spending and
investment. A steep rise in oil and gas prices,
natural disasters that result in sharp falls in
Flood
The overf lowing of the normal confines
of a stream or other body of water, or the
accumulation of water over areas not normally
submerged. Floods include river (f luvial)
f loods, f lash f loods, urban f loods, pluvial
f loods, sewer f loods, coastal f loods and glacial
lake outburst f loods. 309
| 189 |
ANNEX 6
Food Insecurity Experience Scale (FIES)
An experience-based food securit y scale used to
produce a measure of access to food at different
levels of severit y that can be compared across
contexts. It relies on data obtained by asking
people, directly in sur veys, about the occurrence
of conditions and behaviours that are known to
ref lect constrained access to food.
stability is the condition in which the whole
system is stable, thus ensuring that households
are food secure at all times. Stability issues
can refer to short-term instability (which can
lead to acute food insecurity) or medium- to
long-term instability (which can lead to chronic
food insecurity). Climatic, economic, social and
political factors can all be a source of instability.
Food security
A situation that exists when all people, at all
times, have physical, social and economic access
to sufficient, safe and nutritious food that
meets their dietar y needs and food preferences
for an active and healthy life. Based on this
definition, four food securit y dimensions can
be identified: food availabilit y, economic and
physical access to food, food utilization and
stabilit y over time. The concept of food securit y
is evolving to recognize the centralit y of agency
and sustainabilit y. See below for the definition of
these two additional elements.
The report also refers to two additional
dimensions of food securit y that are proposed
by the High Level Panel of Experts (HLPE) of
the Committee on World Food Securit y (CFS);
however, they are not formally agreed upon by
FAO or others, and there is not a negotiated
agreed lang uage. However, due to their relevance
in the context of this report, they are included
here. These two additional dimensions of food
securit y are reinforced in conceptual and legal
understandings of the right to food, and are
currently referred to and defined as follows:
e. Agency refers to the capacit y of individuals
or groups to make their own decisions about
what foods they eat; what foods they produce;
how that food is produced, processed and
distributed within food systems; and their
abilit y to engage in processes that shape food
system policies and governance. 58
f. Sustainabilit y refers to the long-term abilit y
of food systems to provide food securit y and
nutrition in a way that does not compromise
the economic, social and environmental bases
that generate food securit y and nutrition for
future generations. 58
Food security dimensions
In this report, food securit y dimensions refer to
the four traditional dimensions of food securit y:
a. Availabilit y – This dimension addresses
whether or not food is actually or potentially
physically present, including aspects of
production, food reser ves, markets and
transportation, and wild foods.
b. Access – If food is actually or potentially
physically present, the next question is
whether or not households and individuals
have sufficient physical and economic access to
that food.
c. Utilization – If food is available and
households have adequate access to it, the
next question is whether or not households
are maximizing the consumption of adequate
nutrition and energ y. Sufficient energ y
and nutrient intake by individuals is the
result of good care and feeding practices,
food preparation, dietar y diversit y and
intra-household distribution of food,
clean water, sanitation and healthcare.
Combined with good biological utilization of
food consumed, this determines the nutritional
status of individuals.
d. Stability – If the dimensions of availability,
access and utilization are sufficiently met,
Food systems
Food systems encompass the entire range
of actors and their interlinked value-adding
activities involved in the production, aggregation,
processing, distribution, consumption and
disposal of food products. They comprise all food
products that originate from crop and livestock
production, forestry, fisheries and aquaculture, as
well as the broader economic, societal and natural
environments in which these diverse production
systems are embedded. Agri-food systems, a term
increasingly used in the context of transforming
food systems for sustainability and inclusivity, are
broader as they encompass both agricultural and
food systems and focus on both food and non-food
agricultural products, with clear overlaps.
| 190 |
THE STATE OF FOOD SECURITY AND NUTRITION IN THE WORLD 2021
Fragility
Fragilit y is defined as the combination of
exposure to risk and insufficient coping
capacities of the state, system and/or
communities to manage, absorb or mitigate those
risks. The new OECD fragilit y framework is
built on five dimensions of fragilit y – economic,
environmental, political, societal and securit y
– and measures each through the accumulation
and combination of risks and capacit y. See OECD
(2016). 89
elements are also important: 1) infants should be
breastfed exclusively during the first 6 months of
life; 2) infants should be breastfed continuously
until 2 years of age and beyond; 3) from 6 months
of age, breastmilk should be complemented with
a variet y of adequate, safe and nutrient-dense
foods. Salt and sugars should not be added to
complementar y foods.
Heat spell
A period of abnormally and uncomfortably hot
weather. 309
Hazard
A process, phenomenon or human activit y that
may cause loss of life, injur y or other health
impacts, propert y damage, social and economic
disruption or environmental degradation. 316
Natural hazard is synonymous with “climate
shock” in this report.
Hidden costs
In this report, “hidden costs” of diets relate
to costs to human health and/or to the
environment associated with food production
and consumption that are not accounted for in
food prices and the cost of a diet. In the case of
human health, these hidden costs are usually
“paid for” by the people who must live with
the consequences of eating foods that harm
human health, such as energ y-dense foods
high in fats, sugars and/or salt that could lead
to coronar y heart disease and/or diabetes.
These hidden costs also include costs to health
systems in treating non-communicable diseases
as a result of poor eating habits. In the case of
the environment, these hidden costs affect the
world as a whole and relate to the environmental
impacts associated with food production and
consumption. These environmental impacts relate
to land, energ y and water use of food production
and consumption, as well as impacts related
to climate change in terms of greenhouse gas
(GHG) emissions and loss of food biodiversit y.
See FAO, IFAD, UNICEF, W FP and W HO (2020). 7
Healthcare
The organized provision of medical care to
individuals or a communit y. This includes
ser vices provided to individuals or communities
by health ser vice providers for the purpose
of promoting, maintaining, monitoring or
restoring health.
Healthy diet
A balanced, diverse and appropriate selection of
foods eaten over a period of time. A healthy diet
protects against malnutrition in all its forms as
well as NCDs, and ensures that the needs for
macronutrients (proteins, fats and carbohydrates
including dietar y fibres) and essential
micronutrients (vitamins, minerals and trace
elements) are met specific to a person’s gender,
age, physical activit y level and physiological
state. For diets to be healthy: 1) daily needs
of energ y and micronutrients should be met,
but energ y intake should not exceed needs; 2)
consumption of fruits and vegetables should be at
least 400 g per day; 3) intake of fats should be no
more than 30 percent of total energ y intake, with
a shift in fat consumption away from saturated
fats to unsaturated fats and the elimination of
industrial trans fats; 4) intake of free sugars
should be less than 10 percent of total energ y
intake or, preferably, no more than 5 percent;
5) intake of salt should be less than 5 g per day.
A healthy diet for infants and young children
is similar to that for adults, but the following
Hunger
Hunger is an uncomfortable or painful physical
sensation caused by insufficient consumption of
dietar y energ y. In this report, the term hunger
is synonymous with chronic undernourishment
and is measured by the prevalence of
undernourishment (PoU).
Macronutrients
Macronutrients are needed in larger quantities (in
gram range) and are the major source of energ y
and bulk (volume) in our diets. They include
carbohydrates, protein and fats. They are a main
source of dietar y energ y, which is measured in
| 191 |
ANNEX 6
Nutritional status
The physiological state of an individual that
results from the relationship between nutrient
intake and requirements and the body’s abilit y to
digest, absorb and use these nutrients.
calories. Getting sufficient energ y is essential
for ever yone in order to maintain body growth,
development and good health. Carbohydrates,
protein and fats, in addition to providing energ y,
each have ver y specific functions in the body and
must be supplied in sufficient amounts to carr y
out those functions.
Nutritious foods
Refers to those foods that tend to be high in
essential nutrients such as micronutrients, as well
as proteins, unrefined fibre-rich carbohydrates
and/or unsaturated fats. They are low in sodium,
free sugars, saturated fats and trans fats.
Malnutrition
An abnormal physiological condition caused
by inadequate, unbalanced or excessive intake
of macronutrients and/or micronutrients.
Malnutrition includes undernutrition (child
stunting and wasting, and vitamin and mineral
deficiencies) as well as overweight and obesit y.
Overweight and obesity
Defined as body weight that is above normal for
height as a result of an excessive accumulation
of fat. It is usually a manifestation of expending
less energ y than is consumed. In adults,
overweight is defined as a BMI of 25 kg/m 2 or
more, and obesit y as a BMI of 30 kg/m 2 or more.
In children under five years of age, overweight
is defined as weight-for-height greater than
2 standard deviations above the W HO Child
Growth Standards median, and obesit y as
weight-for-height greater than 3 standard
deviations above the W HO Child Growth
Standards median.
Micronutrients
Micronutrients include vitamins and minerals
and are required in ver y small (micro) but
specific amounts. Vitamins and minerals in foods
are necessar y for the body to grow, develop and
function properly, and are essential for our health
and well-being. Our bodies require a number of
different vitamins and minerals, each of which
has a specific function in the body and must be
supplied in different, sufficient amounts.
Moderate food insecurity
Refers to the level of severit y of food insecurit y,
based on the Food Insecurit y Experience Scale,
at which people face uncertainties about their
abilit y to obtain food and have been forced to
reduce, at times during the year, the qualit y and/
or quantit y of food they consume due to lack of
money or other resources. It thus refers to a lack
of consistent access to food, which diminishes
dietar y qualit y, disrupts normal eating patterns,
and can have negative consequences for nutrition,
health and well-being.
Prevalence of undernourishment
An estimate of the proportion of the population
that lacks enough dietar y energ y for a healthy,
active life. It is FAO’s traditional indicator used to
monitor hunger at the global and regional level,
as well as SDG Indicator 2.1.1.
Resilience
Resilience is the abilit y of individuals,
households, communities, cities, institutions,
systems and societies to prevent, resist, absorb,
adapt, respond and recover positively, efficiently
and effectively when faced with a wide range of
risks, while maintaining an acceptable level of
functioning and without compromising long-term
prospects for sustainable development, peace and
securit y, human rights and well-being for all. 317
Nutrition transition
As incomes rise and populations become more
urban, diets high in complex carbohydrates and
fibre give way to more energ y-dense diets high
in fats, sugars and/or salt. These global dietar y
trends are accompanied by a demographic
transition with a shift towards increased life
expectancy and reduced fertilit y rates. At the
same time, disease patterns move away from
infectious and nutrient-deficiency diseases
towards higher rates of childhood obesit y,
coronar y heart disease and some t ypes of cancer.
Risk
The probabilit y or likelihood of occurrence
of hazardous events or trends multiplied by
the impacts if these events or trends occur.
Risk to food insecurit y is the probabilit y of food
insecurit y resulting from interactions between a
| 192 |
THE STATE OF FOOD SECURITY AND NUTRITION IN THE WORLD 2021
consumed as a result of repeated instances
of disease. It includes being under weight for
one’s age, too short for one’s age (stunted),
dangerously thin for one’s height (suffering from
wasting) and deficient in v itamins and minerals
(micronutrient deficiency).
natural or human-induced hazard/shock/stress
and v ulnerable conditions.
Severe food insecurity
The level of severit y of food insecurit y at which
people have likely run out of food, experienced
hunger and, at the most extreme, gone for
days without eating, putting their health and
well-being at grave risk, based on the Food
Insecurit y Experience Scale.
Vulnerability
Refers to the conditions determined by physical,
social, economic and environmental factors or
processes that increase the susceptibilit y of
an individual, communit y, assets or systems
to the impacts of hazards. 316 Vulnerabilit y to
food insecurit y is the range of conditions that
increases the susceptibilit y of a household to
the impact on food securit y in case of a shock
or hazard.
Staple food
A staple food is one that is eaten reg ularly, and in
such quantities as to constitute the dominant part
of the diet and supply a major proportion of total
dietar y energ y.
Stunting
Low height-for-age, ref lecting a past episode or
episodes of sustained undernutrition. In children
under five years of age, stunting is defined as
height-for-age less than -2 standard deviations
below the W HO Child Growth Standards median.
Wasting
Low weight-for-height, generally the result
of weight loss associated with a recent period
of inadequate dietar y energ y intake and/or
disease. In children under five years of age,
wasting is defined as weight-for-height less than
-2 standard deviations below the W HO Child
Growth Standards median.
Undernourishment
Undernourishment is defined as the condition in
which an individual’s habitual food consumption
is insufficient to provide the amount of dietar y
energ y required to maintain a normal, active,
healthy life. For the purposes of this report,
hunger is defined as being synonymous with
chronic undernourishment.
Weather
Weather describes conditions of the atmosphere
over a short period of time (minutes to days),
whereas climate is how the atmosphere
behaves over relatively longer periods of time
(the long-term average of weather over time).
The difference between weather and climate
is a measure of time (see above definitions for
climate, climate change, climate variabilit y and
climate extremes). 318 n
Undernutrition
The outcome of poor nutritional intake in
terms of quantit y and/or qualit y, and/or poor
absorption and/or poor biolog ical use of nutrients
| 193 |
NOTES
1 Food and Agriculture Organization of the United Nations
(FAO), International Fund for Agricultural Development (IFAD),
United Nations Children’s Fund (UNICEF), World Food
Programme (WFP) & World Health Organization (WHO). 2017.
The State of Food Security and Nutrition in the World 2017.
Building resilience for peace and food security. Rome, FAO.
(also available at www.fao.org/3/a-I7695e.pdf).
9 Springmann, M. 2020. Valuation of the health and
climate-change benefits of healthy diets. Background paper for
The State of Food Security and Nutrition in the World 2020.
FAO Agricultural Development Economics Working Paper 20-03.
Rome, FAO. (also available at https://doi.org/10.4060/cb1699en).
10 Lakner, C., Yonzan, N., Gerszon Mahler, D., Castaneda
Aguilar, R.A. & Wu, H. 2021. Updated estimates of the impact
of COVID-19 on global poverty: looking back at 2020 and the
outlook for 2021. In: World Bank Blogs [online]. Washington, DC.
[Cited 6 May 2021]. https://blogs.worldbank.org/opendata/
updated-estimates-impact-covid-19-global-poverty-lookingback-2020-and-outlook-2021
2 Holleman, C., Jackson, J., Sánchez, M. V & Vos, R. 2017.
Sowing the seeds of peace for food security – Disentangling the
nexus between conflict, food security and peace. Rome, FAO.
(also available at www.fao.org/3/a-i7821e.pdf).
3 FAO, IFAD, UNICEF, WFP & WHO. 2018. The State of Food
Security and Nutrition in the World 2018. Building climate
resilience for food security and nutrition. Rome, FAO.
(also available at www.fao.org/3/I9553EN/i9553en.pdf).
11 Purnamasari, R. & Ali, R. 2020. High-frequency monitorıng
of household: Summary of Results from Survey Round 1,
1–7 May 2020. Indonesia COVID-19 Observatory Brief No. 3.
Washington, DC, World Bank. (also available at
https://openknowledge.worldbank.org/handle/10986/34740).
4 Holleman, C., Rembold, F., Crespo, O. & Conti, V. 2020. The
impact of climate variability and extremes on agriculture and food
security - An analysis of the evidence and case studies.
Background paper for The State of Food Security and Nutrition
in the World 2018. Rome, FAO. (also available at
https://doi.org/10.4060/cb2415en).
12 Egger, D., Miguel, E., Warren, S.S., Shenoy, A., Collins, E.,
Karlan, D., Parkerson, D., Mobarak, A.M., Fink, G., Udry, C.,
Walker, M., Haushofer, J., Larreboure, M., Athey, S., LopezPena, P., Benhachmi, S., Humphreys, M., Lowe, L., Meriggi,
N.F., Wabwire, A., Davis, C.A., Pape, U.J., Graff, T., Voors, M.,
Nekesa, C. & Vernot, C. 2021. Falling living standards during the
COVID-19 crisis: Quantitative evidence from nine developing
countries. Science Advances, 7(6): eabe0997.
5 FAO, IFAD, UNICEF, WFP & WHO. 2019. The State of Food
Security and Nutrition in the World 2019. Safeguarding against
economic slowdowns and downturns. Rome, FAO. (also available
at www.fao.org/3/ca5162en/ca5162en.pdf).
13 Gentilini, U., Almenfi, M., Blomquist, J., Dale, P., De la Flor
Giuffra, L., Desai, V., Fontenez, M.B., Galicia, G., Lopez, V.,
Marin, G., Mujica, I.V., Natarajan, H., Newhouse, D., Palacios,
R., Quiroz, A.P., Rodriguez Alas, C., Sabharwal, G. & Weber,
M. 2021. Social Protection and Jobs Responses to COVID-19:
A Real-Time Review of Country Measures. “Living Paper” Version
15 (May 14, 2021). Washington, DC.
6 Holleman, C. & Conti, V. 2019. Role of income inequality in
shaping outcomes on individual food insecurity. Background
paper for The State of Food Security and Nutrition in the World
2019. Rome, FAO. (also available at https://doi.org/10.4060/
cb2036en).
7 FAO, IFAD, UNICEF, WFP & WHO. 2020. The State of Food
Security and Nutrition in the World 2020. Transforming food
systems for affordable healthy diets. Rome, FAO. (also available
at https://doi.org/10.4060/ca9692en).
14 Oxfam. 2020. Shelter from the storm: The global need for
universal social protection in times of COVID-19. Oxford,
UK, Oxfam.
8 Herforth, A., Bai, Y., Venkat, A., Mahrt, K., Ebel, A. &
Masters, W.A. 2020. Cost and affordability of healthy diets
across and within countries. Background paper for The State of
Food Security and Nutrition in the World 2020. FAO Agricultural
Development Economics Technical Study No. 9. Rome, FAO.
(also available at https://doi.org/10.4060/cb2431en).
15 FAO. 2021. World Food Situation. In: FAO [online]. Rome.
[Cited 25 May 2021]. www.fao.org/worldfoodsituation/en
16 FAO & WFP. 2020. FAO-WFP early warning analysis of acute
food insecurity hotspots. October 2020. Rome. (also available at
https://doi.org/10.4060/cb1907en).
| 194 |
17 Boero, V., Cafiero, C., Gheri, F., Kepple, A.W., Rosero
Moncayo, J., Viviani, S. 2021. Access to food in 2020. Results of
twenty national surveys using the food insecurity experience scale
(FIES). Rome. https://doi.org/10.4060/cb5623en.
New York, USA. (also available at https://unstats.un.org/unsd/
statcom/51st-session/documents/2020-2-SDG-IAEG-E.pdf).
28 WHO. 2013. Global action plan for the prevention and control
of noncommunicable diseases 2013-2020. Geneva, Switzerland.
18 FAO. 2018. Voices of the Hungry. In: Food and Agriculture
Organization of the United Nations [online]. Rome. [Cited 28 April
2020]. www.fao.org/in-action/voices-of-the-hungry
29 UNICEF & WHO. 2019. UNICEF-WHO Low birthweight
estimates: Levels and trends 2000–2015. New global, regional
and national estimates of low birthweight. Geneva, Switzerland,
WHO. (also available at www.unicef.org/reports/UNICEF-WHOlow-birthweight-estimates-2019).
19 FAO. 2020. Using the Food Insecurity Experience Scale
(FIES) to monitor the impact of COVID-19. Rome. (also available
at https://doi.org/10.4060/ca9205en).
30 Christian, P., Lee, S.E., Angel, M.D., Adair, L.S., Arifeen,
S.E., Ashorn, P., Barros, F.C., Fall, C.H.D., Fawzi, W.W., Hao,
W., Hu, G., Humphrey, J.H., Huybregts, L., Joglekar, C. V.,
Kariuki, S.K., Kolsteren, P., Krishnaveni, G. V., Liu, E.,
Martorell, R., Osrin, D., Persson, L.A., Ramakrishnan, U.,
Richter, L., Roberfroid, D., Sania, A., Kuile, F.O.T., Tielsch,
J., Victora, C.G., Yajnik, C.S., Yan, H., Zeng, L. & Black,
R.E. 2013. Risk of childhood undernutrition related to
small-for-gestational age and preterm birth in low- and
middle-income countries. International Journal of
Epidemiology, 42(5): 1340–1355.
20 FAO. 2020. Gendered impacts of COVID-19 and equitable
policy responses in agriculture, food security and nutrition. Rome,
FAO. (also available at https://doi.org/10.4060/ca9198en).
21 WHO. 2020. Global Health Observatory (GHO) data NCD mortality and morbidity. In: WHO [online]. [Cited 20 May
2020]. www.who.int/gho/ncd/mortality_morbidity
22 WHO. 2018. Healthy diet factsheet. Geneva, Switzerland.
(also available at www.who.int/who-documents-detail/healthydiet-factsheet394).
31 Jornayvaz, F.R., Vollenweider, P., Bochud, M., Mooser, V.,
Waeber, G. & Marques-Vidal, P. 2016. Low birth weight leads to
obesity, diabetes and increased leptin levels in adults: The
CoLaus study. Cardiovascular Diabetology, 15(73).
23 FAO & WHO. 2019. Sustainable healthy diets: guiding
principles. Rome, FAO.
24 Laborde, D., Herforth, A., Headey, D. & de Pee, S.
forthcoming. COVID-19 pandemic leads to greater depth of
unaffordability of healthy and nutrient adequate diets in low- and
middle-income countries.
32 UNICEF, WHO & World Bank. 2021. UNICEF-WHO-World
Bank: Joint child malnutrition estimates - Levels and trends (2021
edition) [online]. https://data.unicef.org/resources/jmereport-2021, www.who.int/data/gho/data/themes/topics/jointchild-malnutrition-estimates-unicef-who-wb, https://datatopics.
worldbank.org/child-malnutrition
25 Laborde, D., Martin, W. & Vos, R. 2021. Impacts of
COVID-19 on global poverty, food security, and diets: Insights
from global model scenario analysis. Agricultural Economics,
52: 375–390.
33 Fore, H.H., Dongyu, Q., Beasley, D.M. & Ghebreyesus,
T.A. 2020. Child malnutrition and COVID-19: the time to act is
now. The Lancet, 396(10250): 517–518.
26 WHO & UNICEF. 2017. The extension of the 2025 Maternal,
Infant and Young Child nutrition targets to 2030. Geneva,
Switzerland and New York, USA, WHO and UNICEF.
(also available at www.who.int/nutrition/global-target-2025/
discussion-paper-extension-targets-2030.pdf).
34 WHO. 2020. Healthy diet. In: WHO [online]. Geneva,
Switzerland. [Cited 6 May 2021]. www.who.int/news-room/factsheets/detail/healthy-diet
27 United Nations (UN). 2019. Report of the Inter-Agency and
Expert Group on Sustainable Development Goal Indicators.
Statistical Commission Fifty-first session 3–6 March 2020.
35 WHO. 2019. Commercial foods for infants and young children
in the WHO European Region. A study of the availability,
composition and marketing of baby foods in four European
countries. Copenhagen, WHO.
| 195 |
NOTES
NOTES
36 WHO. 2021. WHO Global Anaemia estimates, 2021 Edition.
In: The Global Health Observatory | Anaemia in women and
children [online]. Geneva, Switzerland. [Cited 26 May 2021].
www.who.int/data/gho/data/themes/topics/anaemia_in_women_
and_children
44 Olofin, I., McDonald, C.M., Ezzati, M., Flaxman, S., Black,
R.E., Fawzi, W.W., Caulfield, L.E., Danaei, G., Adair, L.,
Arifeen, S., Bhandari, N., Garenne, M., Kirkwood, B., Mølbak,
K., Katz, J., Sommer, A., West, K.P. & Penny, M.E. 2013.
Associations of suboptimal growth with all-cause and causespecific mortality in children under five years: a pooled analysis
of ten prospective studies. PLoS ONE, 8(5).
37 UN. 2020. Policy Brief: The Impact of COVID-19 on Food
Security and Nutrition. New York, USA. (also available at
www.un.org/sites/un2.un.org/files/sg_policy_brief_on_covid_
impact_on_food_security.pdf).
45 WHO. 2020. The impact of the COVID-19 pandemic on
noncommunicable disease resources and services: results of a
rapid assessment. Geneva, Switzerland.
38 WFP & World Bank. 2020. YEMEN mVAM Bulletin no.52
(Mar - Apr 2020). In: WFP [online]. Rome. [Cited 6 May 2021].
dataviz.vam.wfp.org/yemen-mvam-bulletin-52-apr-2020
46 WHO. 2021. Second round of the national pulse survey on
continuity of essential health services during the COVID-19
pandemic. Geneva, Switzerland.
39 International Food Policy Research Institute (IFPRI). 2021.
2021 Global food policy report: Transforming food systems after
COVID-19. Washington, DC. (also available at https://ebrary.ifpri.
org/digital/collection/p15738coll2/id/134343).
47 Osendarp, S., Akuoku, J., Black, R., Headey, D., Ruel, M.,
Scott, N., Shekar, M., Walker, N., Flory, A., Haddad, L.,
Laborde, D., Stegmuller, A., Thomas, M., Heidkamp, R. (on
behalf of the Standing Together for Nutrition Consortium).
2021. The COVID-19 crisis is expected to have dramatic indirect
effects on maternal and child undernutrition in low and middle
income countries. Nature Food (in press).
40 UNICEF. 2020. Impactos primários e secundários da
COVID-19 em crianças e adolescentes. Relatório de análise 1a Onda. Brasília.
41 León, K. & Arguello, J.P. 2021. Effects of the COVID-19
pandemic on adolescent and youth nutrition and physical
activity. In: UNICEF [online]. New York, USA. [Cited 26 May
2021]. www.unicef.org/lac/en/effects-of-covid-19-pandemicon-adolescent-and-youth-nutrition-and-physical-activity
48 WHO. 2020. Obesity significantly increases chances of
severe outcomes for COVID-19 patients. In: WHO [online].
Geneva, Switzerland. [Cited 26 May 2021]. www.euro.who.int/
en/health-topics/health-emergencies/coronavirus-covid-19/
news/news/2020/10/obesity-significantly-increases-chances-ofsevere-outcomes-for-covid-19-patients
42 UNICEF. 2021. Tracking the situation of children during
COVID-19. In: UNICEF [online]. New York, USA. [Cited 6 May
2021]. data.unicef.org/resources/rapid-situation-tracking-covid19-socioeconomic-impacts-data-viz
49 WHO. 2017. The double burden of malnutrition. Geneva,
Switzerland. (also available at http://apps.who.int/iris/bitstream/
handle/10665/255413/WHO-NMH-NHD-17.3-eng.pdf?ua=1).
43 WHO. 2020. At least 80 million children under one at risk of
diseases such as diphtheria, measles and polio as COVID-19
disrupts routine vaccination efforts, warn Gavi, WHO and
UNICEF. In: WHO [online]. Geneva, Switzerland. [Cited 26 May
2021]. www.who.int/news/item/22-05-2020-at-least-80-millionchildren-under-one-at-risk-of-diseases-such-as-diphtheriameasles-and-polio-as-covid-19-disrupts-routine-vaccinationefforts-warn-gavi-who-and-unicef
50 Hawkes, C., Ruel, M.T., Salm, L., Sinclair, B. & Branca, F.
2020. Double-duty actions: seizing programme and policy
opportunities to address malnutrition in all its forms. The Lancet,
395(10218): 142–155.
51 Wells, J.C., Sawaya, A.L., Wibaek, R., Mwangome, M.,
Poullas, M.S., Yajnik, C.S. & Demaio, A. 2020. The double
burden of malnutrition: aetiological pathways and consequences
for health. The Lancet, 395(10217): 75–88.
| 196 |
52 WHO. 2017. Double-duty actions for nutrition: policy brief.
Geneva, Switzerland.
61 Bodirsky, B.L., Dietrich, J.P., Martinelli, E., Stenstad, A.,
Pradhan, P., Gabrysch, S., Mishra, A., Weindl, I., Le Mouël, C.,
Rolinski, S., Baumstark, L., Wang, X., Waid, J.L., LotzeCampen, H. & Popp, A. 2020. The ongoing nutrition transition
thwarts long-term targets for food security, public health and
environmental protection. Scientific Reports, 10(1): 19778.
53 FAO & WHO. 2017. United Nations Decade of Action on
Nutrition 2016–2025: work programme. Rome and Geneva,
Switzerland. (also available at www.un.org/nutrition/sites/www.
un.org.nutrition/files/general/pdf/work_programme_nutrition_
decade.pdf).
62 Global Panel on Agriculture and Food Systems for
Nutrition. 2020. Future food systems: for people, our planet, and
prosperity. London.
54 FAO & WHO. 2020. United Nations Decade of Action on
Nutrition 2016–2025: Mid-term Review Foresight paper. Rome
and Geneva, Switzerland. (also available at www.un.org/
nutrition/sites/www.un.org.nutrition/files/general/pdf/nutrition_
decade_mtr_background_paper_en.pdf).
63 EAT-Lancet Commission. 2019. Food, planet, health:
healthy diets from sustainable food systems. Summary report of
the EAT-Lancet Commission. London, The Lancet.
55 IFPRI. 2011. The MIRAGRODEP Model. In: IFPRI [online].
Washington, DC. [Cited 26 May 2021]. www.ifpri.org/publication/
miragrodep-model
64 Baker, P., Santos, T., Neves, P.A., Machado, P., Smith,
J., Piwoz, E., Barros, A.J.D., Victora, C.G. & McCoy, D. 2021.
First-food systems transformations and the ultra-processing
of infant and young child diets: The determinants, dynamics
and consequences of the global rise in commercial milk
formula consumption. Maternal & Child Nutrition, 17(2).
56 Cuesta, J., Godwin, M., Shusterman, J. & Chavez, C. 2018.
The Long-term Effect of Humanitarian Emergencies on
Adolescents: Existing evidence, gaps and considerations for
research and practitioners. Innocenti Discussion Papers no.
2018-03, UNICEF Office of Research - Innocenti. Florence,
Italy, UNICEF.
65 Von Braun, J., Afsana, K., Fresco, L., Hassan, M. &
Torero, M. 2021. Food Systems – Definition, Concept and
Application for the UN Food Systems Summit. A paper from
the Scientific Group of the UN Food Systems Summit.
New York, USA, UN. (also available at www.un.org/sites/un2.
un.org/files/food_systems_concept_paper_scientific_
group_-_draft_oct_26.pdf).
57 Parsons, K. & Hawkes, C. 2018. Connecting food systems
for co-benefits: how can food systems combine diet-related
health with environmental and economic policy goals?
Copenhagen, WHO. (also available at www.euro.who.int/en/
about-us/partners).
66 IPES-Food. 2017. Unravelling the food–health nexus:
addressing practices, political economy, and power relations to
build healthier food systems. The Global Alliance for the Future
of Food and IPES-Food. (also available at www.ipes-food.org/_
img/upload/files/Health_FullReport(1).pdf).
58 High Level Panel of Experts on Food Security and Nutrition
(HLPE). 2020. Food security and nutrition: building a global
narrative towards 2030. Rome. (also available at www.fao.org/3/
ca9731en/ca9731en.pdf).
67 Kraak, V.I., Swinburn, B., Lawrence, M. & Harrison, P.
2014. An accountability framework to promote healthy food
environments. Public Health Nutrition, 17(11): 2467–2483.
59 Branca, F., Lartey, A., Oenema, S., Aguayo, V., Stordalen,
G.A., Richardson, R., Arvelo, M. & Afshin, A. 2019.
Transforming the food system to fight non-communicable
diseases. BMJ, 364: l296.
68 HLPE. 2017. Nutrition and Food Systems. A report by the
High Level Panel of Experts on Food Security and Nutrition of the
Committee on World Food Security. Rome. (also available at
www.fao.org/3/a-i7846e.pdf).
60 Rockström, J., Edenhofer, O., Gaertner, J. & DeClerck, F.
2020. Planet-proofing the global food system. Nature Food,
1(1): 3–5.
| 197 |
NOTES
NOTES
69 Herforth, A. 2016. Impact Assessment of Policies to support
Healthy Food Environments and Healthy Diets: Implementing the
Framework for Action of the Second International Conference on
Nutrition. UNSCN Discussion Paper. Rome, UNSCN. (also
available at www.unscn.org/en/resource-center/UNSCNPublications?idnews=1279).
79 FAO. 2021. COVID-19 and territorial markets: evidence from
the United Republic of Tanzania. Rome. (also available at
https://doi.org/10.4060/cb4141en).
80 FAO. 2020. Mitigating risks to food systems during COVID-19:
reducing food loss and waste. Rome. (also available at
https://doi.org/10.4060/ca9056en).
70 Ivanic, M. & Martin, W. 2018. Sectoral Productivity Growth
and Poverty Reduction: National and Global Impacts. World
Development, 109: 429–439.
81 FAO & WFP. 2021. Hunger Hotspots. FAO-WFP early
warnings on acute food insecurity: March to July 2021 outlook.
Rome.
71 Fuglie, K., Gautam, M., Goyal, A. & Maloney, W.F. 2020.
Harvesting Prosperity – Technology and Productivity Growth in
Agriculture. Washington, DC, World Bank.
82 Vos, R., Martin, W. & Laborde, D. 2020. How much will
global poverty increase because of COVID-19? In: IFPRI [online].
Washington, DC. [Cited 5 May 2021]. www.ifpri.org/blog/howmuch-will-global-poverty-increase-because-covid-19
72 FAO. 2015. Designing nutrition-sensitive agriculture investments:
Checklist and guidance for programme formulation. Rome.
83 GBD 2019 Risk Factors Collaborators. 2020. Global burden
of 87 risk factors in 204 countries and territories, 1990–2019: a
systematic analysis for the Global Burden of Disease Study 2019.
The Lancet, 396(10258): 1223–1249.
73 FAO. 2019. The State of Food and Agriculture 2019. Moving
forward on food loss and waste reduction. Rome. (also available
at www.fao.org/3/ca6030en/ca6030en.pdf).
74 Azcona, G., Bhatt, A. & Kapto, S. 2020. The COVID-19
boomerang effect: New forecasts predict sharp increases in
female poverty. In: UN Women [online]. New York, USA.
[Cited 5 May 2021]. https://data.unwomen.org/features/covid19-boomerang-effect-new-forecasts-predict-sharp-increasesfemale-poverty
84 FAO. 2020. Database. In: Monitoring and Analysing Food and
Agricultural Policies (MAFAP) [online]. Rome. [Cited 1 June
2021]. www.fao.org/in-action/mafap/data
85 Pernechele, V., Balié, J. & Ghins, L. 2018. Agricultural
policy incentives in sub-Saharan Africa in the last decade (2005–
2016) – Monitoring and Analysing Food and Agricultural Policies
(MAFAP) synthesis study. FAO Agricultural Development
Economics Technical Study No. 3. Rome, FAO. (also available at
www.fao.org/3/I8997EN/i8997en.pdf).
75 Global Network Against Food Crisis & Food Security
Information Network (FSIN). 2021. Global Report on Food Crises
2021. Rome. (also available at www.fsinplatform.org/sites/
default/files/resources/files/GRFC 2021 050521 med.pdf).
86 Independent Group of Scientists appointed by the
Secretary-General. 2019. Global Sustainable Development
Report 2019: the future is now – science for achieving sustainable
development. New York, USA, UN. (also available at
https://sustainabledevelopment.un.org/content/documents/
24797GSDR_report_2019.pdf).
76 FAO. 2020. Migrant workers and the COVID-19 pandemic.
Rome. (also available at https://doi.org/10.4060/ca8559en).
77 World Bank. 2021. Defying Predictions, Remittance Flows
Remain Strong During COVID-19 Crisis. In: World Bank [online].
Washington, DC. [Cited 1 June 2021]. www.worldbank.org/en/
news/press-release/2021/05/12/defying-predictionsremittance-flows-remain-strong-during-covid-19-crisis
87 United Nations High Commissioner for Refugees (UNHCR).
2020. Global trends - Forced displacement in 2020. Copenhagen.
(also available at www.unhcr.org/60b638e37/unhcr-globaltrends-2020).
78 FAO. 2020. Food Outlook – Biannual report on global food
markets – November 2020. Rome. (also available at
https://doi.org/10.4060/cb1993en).
88 UNHCR. 2021. Refugee Statistics. In: UNHCR [online].
[Cited 6 May 2021]. www.unhcr.org/refugee-statistics
| 198 |
89 OECD. 2016. States of Fragility 2016: understanding violence.
States of Fragility. Paris. (also available at www.oecd-ilibrary.org/
development/states-of-fragility-2016_9789264267213-en).
Security and Nutrition (FSN Forum) [online]. Rome. [Cited 27 May
2021]. www.fao.org/fsnforum/activities/discussions/SOFI_
transforming_food_systems
90 UN. 2018. World Economic Situation and Prospects 2018.
New York, USA.
99 Development Initiatives. 2020. 2020 Global Nutrition
Report: action on equity to end malnutrition. Bristol, UK.
(also available at https://globalnutritionreport.org/reports/2020global-nutrition-report).
91 United Nations Conference on Trade and Development
(UNCTAD) & FAO. 2017. Commodities and Development Report
2017: commodity markets, economic growth and development.
New York, USA, UNCTAD.
100 UNICEF. 2019. The State of the World’s Children 2019.
Children, food and nutrition: growing well in a changing world.
New York, USA. (also available at www.unicef.org/media/63016/
file/SOWC-2019.pdf).
92 International Federation of Red Cross and Red Crescent
Societies (IFRC). 2020. World Disasters Report 2020: come heat
or high water - tackling the humanitarian impacts of the climate
crisis together. Geneva, Switzerland. (also available at
https://media.ifrc.org/ifrc/wp-content/uploads/
2020/11/20201116_WorldDisasters_Full.pdf).
101 Johns Hopkins University & The Global Alliance for
Improved Nutrition. 2021. Food Systems Dashboard.
In: Food Systems Dashboard [online]. Baltimore, USA and
Geneva, Switzerland. [Cited 21 June 2021].
https://foodsystemsdashboard.org
93 Centre for Research on the Epidemiology of Disasters
(CRED) & UN Office for Disaster Risk Reduction (UNDRR).
2020. The human cost of disasters – an overview of the last 20
years (2000-2019). Brussels and Geneva. Switzerland,
CRED and UNDRR.
102 Integrated Food Security Phase Classification (IPC).
2021. Home. In: IPC [online]. Rome. [Cited 21 June 2021].
www.ipcinfo.org/ipc-country-analysis
103 WFP. 2021. Fill the Nutrient Gap. In: WFP [online]. Rome.
[Cited 21 June 2021]. www.wfp.org/fillthenutrientgap
94 Baker, P., Machado, P., Santos, T., Sievert, K., Backholer,
K., Hadjikakou, M., Russell, C., Huse, O., Bell, C., Scrinis, G.,
Worsley, A., Friel, S. & Lawrence, M. 2020. Ultra-processed
foods and the nutrition transition: global, regional and national
trends, food systems transformations and political economy
drivers. Obesity Reviews, 21(12).
104 WHO. 2021. World Health Statistics. In: WHO [online].
Geneva, Switzerland. [Cited 1 June 2021]. www.who.int/data/
gho/publications/world-health-statistics
95 See endnote 65.
105 IPC. 2021. IPC Acute Malnutrition Analysis, January 2020 –
March 2021, Yemen. Aden. (also available at www.ipcinfo.org/
ipcinfo-website/alerts-archive/issue-34).
96 HLPE. 2019. Agroecological and other innovative approaches
for sustainable agriculture and food systems that enhance food
security and nutrition. A report by the High Level Panel of Experts
on Food Security and Nutrition of the Committee on World Food
Security. Rome.
106 FAO. 2019. When growing vegetables is no longer safe.
In: FAO [online]. Rome. [Cited 21 June 2021].
www.fao.org/fao-stories/article/en/c/1202553
107 FAO & Famine Early Warning Systems Network
(FEWS Net). 2019. More than 1.5 million people in Somalia still
facing acute food security crisis or worse outcomes. Mogadishu
and Washington, DC, FAO and FEWS Net. (also available at
www.ipcinfo.org/fileadmin/user_upload/ipcinfo/docs/
FSNAU-FEWS NET_Somalia_Post-Deyr-TechnicalRelease_2019FebJune.pdf).
97 FAO. forthcoming. Country examples of best practices in
addressing drivers of food insecurity and malnutrition towards the
transformation of food systems. Rome.
98 FAO. 2021. Call for best practices in transforming food
systems for affordable healthy diets and addressing key drivers
of food insecurity and malnutrition. In: Global Forum on Food
| 199 |
NOTES
NOTES
108 FAO. 2020. Nutrition-sensitive cash+ in Somalia. Rome.
(also available at www.fao.org/3/ca9824en/ca9824en.pdf).
Mann, W., McCarthy, N., Meybeck, A., Neufeldt, H.,
Remington, T., Sen, P.T., Sessa, R., Shula, R., Tibu, A. &
Torquebiau, E.F. 2014. Climate-smart agriculture for food
security. Nature Climate Change, 4(12): 1068–1072.
109 WFP. 2021. The EU and WFP partner to improve nutrition
in the Central Sahel by strengthening local food systems.
In: WFP [online]. Rome. [Cited 21 June 2021]. www.wfp.org/
news/eu-and-wfp-partner-improve-nutrition-central-sahelstrengthening-local-food-systems
118 Ricciardi, V., Wane, A., Sidhu, B.S., Godde, C.,
Solomon, D., McCullough, E., Diekmann, F., Porciello, J.,
Jain, M., Randall, N., Mehrabi, Z., Goode, C., Solomon, D.,
McCullough, E., Diekmann, F., Porciello, J., Jain, M., Randall,
N. & Mehrabi, Z. 2020. A scoping review of research funding
for small-scale farmers in water scarce regions. Nature
Sustainability, 3(10): 836–844.
110 UN. 2020. Discussion starter Action Track 3: Boost
nature-positive food production at scale. New York, USA.
(also available at www.un.org/sites/un2.un.org/files/unfss-at3discussion_starter-dec2020.pdf).
119 FAO. 2018. One million cisterns for the Sahel. Dakar.
(also available at www.fao.org/3/ca0882en/ca0882en.pdf).
111 Hodson, E., Niggli, U., Kitajima, K., Lal, R. & Sadoff, C.
2021. Boost nature positive production - A paper on Action
Track 3. The Scientific Group of the UN Food Systems Summit.
New York, USA, UN. (also available at https://sc-fss2021.org/
wp-content/uploads/2020/12/3-Action_Track_3_Scientific_
Group_draft_Dec-12-2020.pdf).
120 IFAD. 2021. Kiribati Outer Islands: Food and Water project
supervision report. Rome.
121 Barbier, E.B. & Hochard, J.P. 2018. Land degradation
and poverty. Nature Sustainability, 1(11): 623–631.
112 FAO, Alliance of Bioversity International & International
Center for Tropical Agriculture (CIAT). forthcoming. Indigenous
Peoples’ food systems: insights on sustainability and resilience
from the front line of climate change. Rome, FAO.
122 Garg, K.K., Singh, R., Anantha, K.H., Singh, A.K.,
Akuraju, V.R., Barron, J., Dev, I., Tewari, R.K., Wani, S.P.,
Dhyani, S.K. & Dixit, S. 2020. Building climate resilience in
degraded agricultural landscapes through water management:
a case study of Bundelkhand region, Central India. Journal of
Hydrology, 591: 125592.
113 Charles, A., Kalikoski, D. & Macnaughton, A. 2019.
Addressing the climate change and poverty nexus: a coordinated
approach in the context of the 2030 agenda and the Paris
agreement. Rome, FAO.
123 Kuhnlein, H., Eme, P. & Fernández de Larrinoa, Y. 2019.
Indigenous food systems: contributions to sustainable food
systems and sustainable diets. In B. Burlingame & S. Dernini,
eds. Sustainable diets: linking nutrition and food systems,
pp. 64–78. Wallingford, UK, CABI. (also available at
www.cabi.org/cabebooks/ebook/20183377461).
114 FAO. 2021. Making climate-sensitive investments in
agriculture – Approaches, tools and selected experiences. Rome.
(also available at https://doi.org/10.4060/cb1067en).
115 Carter, M.R. 2021. Climate risk & food insecurity: what role
for insurance?. Transforming food systems for affordable healthy
diets and addressing key drivers of food insecurity and
malnutrition. Webinar, 12 April 2021. Rome, FAO.
124 Kuhnlein, H.V., Erasmus, B. & Spigelski, D. 2009.
Indigenous Peoples’ Food Systems: the many dimensions of
culture, diversity and environment for nutrition and health. Rome,
FAO. (also available at www.fao.org/documents/card/
es/c/250ee74b-9c3f-5dc1-8086-6e0b78b22795).
116 FAO. 2021. Protecting livelihoods – Linking agricultural
insurance and social protection. Rome. (also available at
https://doi.org/10.4060/cb2690en).
125 FAO. 2015. Voluntary guidelines for securing sustainable
small-scale fisheries. Rome. (also available at www.fao.org/3/
i8347en/I8347EN.pdf).
117 Lipper, L., Thornton, P., Campbell, B.M., Baedeker, T.,
Braimoh, A., Bwalya, M., Caron, P., Cattaneo, A., Garrity, D.,
Henry, K., Hottle, R., Jackson, L., Jarvis, A., Kossam, F.,
| 200 |
126 Autoridad Nacional de Acuicultura y Pesca (AUNAP).
2018. Por la cual se establece la reglamentación de la actividad
pesquera en los Lagos de Tarapoto, Departamento de Amazonas.
Resolución de la AUNAP. Bogotá. (also available at www.aunap.
gov.co/wp-content/uploads/2017/06/Resolución-Por-medio-dela-cual-se-reglamenta-la-actividad-pesquera-en-los-Lagos-deTarapoto-Departamento-de-Amazonas-1.pdf).
137 Gee, E., Borelli, T., Moura de Oliveira Beltrame, D., Neves
Soares Oliveira, C., Coradin, L., Wasike, V., Manjella, A.,
Samarasinghe, G., Güner, B., Tan, A., Özbek, K., Ay, S.T.,
Karabak, S., Güzelsoy, N.A. & Hunter, D. 2020. The ABC of
mainstreaming biodiversity for food and nutrition: concepts,
theory and practice. In E. Gee, T. Borelli & D. Hunter, eds.
Biodiversity, Food and Nutrition. A new agenda for sustainable
food systems, pp. 82–184. London, Routledge.
127 Powell, B., Thilsted, S.H., Ickowitz, A., Termote, C.,
Sunderland, T. & Herforth, A. 2015. Improving diets with wild
and cultivated biodiversity from across the landscape.
Food Security, 7(3): 535–554.
138 Swensson, L.F.J. 2020. Aligning public procurement rules
and practices to support the implementation of Home-Grown
School Feeding (HGSF) initiatives: the case of Ethiopia. Policy
Support on Public Food Procurement for Government - led
Home Grown School Food initiatives. Rome, FAO.
128 Trujillo, C. & Trujillo, F. 2019. Acuerdos de pesca
responsable para el buen uso de los Lagos de Tarapoto.
Fundación Omacha. (also available at http://omacha.org/
wp-content/uploads/2019/06/acuerdos_tarapoto.pdf).
139 WHO. forthcoming. Food systems delivering better health: a
new narrative to guide policy and practice for better human,
ecosystem and animal health and well-being. Geneva,
Switzerland.
129 Bélanger, J. & Pilling, D. 2019. The State of the World’s
Biodiversity for Food and Agriculture. Rome, FAO. (also available
at https://doi.org/10.4060/CA3129EN).
140 WHO. 2021. World Health Day 2021. Building a fairer,
healthier world for everyone. In: WHO [online]. Geneva,
Switzerland. [Cited 21 June 2021]. www.who.int/westernpacific/
news/events/detail/2021/04/07/western-pacific-events/worldhealth-day-2021
130 International Monetary Fund (IMF). 2021. World Economic
Outlook: managing divergent recoveries. Washington, DC.
131 Davila, F., Bourke, R.M., McWilliam, A., Crimp, S., Robins,
L., van Wensveen, M., Alders, R.G. & Butler, J.R.A. 2021. COVID19 and food systems in Pacific Island Countries, Papua New
Guinea, and Timor-Leste: opportunities for actions towards the
sustainable development goals. Agricultural Systems, 191: 103137.
141 Tirivayi, N., Knowles, M. & Davis, B. 2016. The interaction
between social protection and agriculture: a review of evidence.
Rome, FAO.
142 Janzen, S.A., Carter, M.R. & Ikegami, M. 2020. Can
insurance alter poverty dynamics and reduce the cost of social
protection in developing countries? Journal of Risk and
Insurance, 88(2): 293–324.
132 WFP. 2020. State of School Feeding Worldwide 2020. Rome.
133 WFP. 2020. A chance for every child-partnering to scale-up
school health and nutrition for human capital. WFP School
Feeding Strategy 2020 - 2030. Rome.
143 WHO. 2018. Guideline: fortification of rice with vitamins and
minerals as a public health startegy. Geneva, Switzerland.
134 FAO, UNICEF & WFP. 2020. Mitigating the effects of the
COVID-19 pandemic on food and nutrition of schoolchildren.
Rome, WFP.
144 WHO. 2016. Guideline: fortification of maize, flour and corn
meal with vitamins and minerals. Geneva, Switzerland.
135 WHO. 2021. Action framework for developing and
implementing public food procurement and service policies for a
healthy diet. Geneva, Switzerland.
145 WHO. 2014. Guideline: fortification of food-grade salt with
iodine for the prevention and control of iodine deficiency
disorders. Geneva, Switzerland.
136 FAO & WFP. 2018. Home-Grown school feeding resource
framework. Technical Document. Rome. (also available at
www.fao.org/3/ca0957en/CA0957EN.pdf).
146 WHO. 2009. Recommendations on wheat and maize flour
fortification meeting report: interim consensus statement.
Geneva, Switzerland.
| 201 |
NOTES
NOTES
147 Reardon, T. 2015. The hidden middle: the quiet revolution
in the midstream of agrifood value chains in developing
countries. Oxford Review of Economic Policy, 31(1): 45–63.
157 Poulsen, M.N., McNab, P.R., Clayton, M.L. & Neff,
R.A. 2015. A systematic review of urban agriculture and food
security impacts in low-income countries. Food Policy, 55:
131–146.
148 Ilie, E.T. & Kelly, S. 2021. The role of small and medium
agrifood enterprises in food systems transformation: the case of
rice processors in Senegal. FAO Agricultural Development
Economics Technical Study No. 10. Rome, FAO.
158 Rodríguez, A. & Santandreu, A. 2019. Informe de síntesis,
dinámica y planificación del sistema agroalimentario en la
ciudad–región Quito. Quito, RUAF Foundation, FAO, Daniel and
Nina Carasso Foundation and IWMI – CGIAR WLE.
149 FAO. 2020. COVID-19 and its impact on agri-food systems,
food security and nutrition: implications and priorities for the
Africa region. FAO Regional Conference for Africa, thirty-first
session, 26-28 October 2020. Rome. (also available at
www.fao.org/3/ne079en/ne079en.pdf).
159 Jácome, D., Santandreu, A., Paredes, D., Rodríguez, A.
& Pinto, N. 2020. Quito’s resilient agrifood system. ISOCARP
Review 15. Quito, ISOCARP.
150 FAO. 2021. Leveraging small and medium-sized enterprises
in Kenya. Rome. (also available at www.fao.org/3/cb3657en/
cb3657en.pdf).
160 FAO. 2020. FAO COVID-19 Response and Recovery
Programme: Economic inclusion and social protection to reduce
poverty: Pro-poor COVID-19 responses for an inclusive postpandemic economic recovery. Rome. (also available at
https://doi.org/10.4060/cb0282en).
151 Dixie, G. & Sweeney, E. 2021. Lessons learned from the
transformation of food systems in Southeast Asia though publicprivate-producer partnerships. Working paper for internal use
(unpublished).
161 Cistulli, V., Heikkilä, M. & Vos, R. 2016. Global dimensions
of malnutrition: Territorial perspectives on food security and
nutrition policies. In OECD, ed. OECD Regional Outlook 2016, pp.
281–294. Paris, OECD. (also available at www.oecd-ilibrary.org/
urban-rural-and-regional-development/oecd-regionaloutlook-2016/global-dimensions-of-malnutrition-territorialperspectives-on-food-security-and-nutritionpolicies_9789264260245-13-en).
152 Garbero, A., Improta, M. & Gonçalves, S. 2019. Impact
assessment report: Smallholder Commercial Agriculture Project
and Participatory Smallholder Agriculture and Artisanal
Fisheries Development Programme, São Tomé e Príncipe.
Rome, IFAD. (also available at www.ifad.org/
documents/38714170/41116204/ST_PAPAFPA+PAPAC_
IA+report.pdf/a388494d-8231-a372-ffd7-7925f972f988).
162 Kafle, K., Songsermsawas, T. & Winters, P. 2021. Impacts
of agricultural value chain development in a mountainous region:
evidence from Nepal. IFAD Research Series 65. Rome, IFAD.
(also available at www.ifad.org/documents/38714170/
42926104/research_65.pdf/74dee600-7e5e-98ea-944dd5d10bbc0eae?t=1620738318823).
153 FAO. 2019. Milan Urban Food Policy Pact Monitoring
Framework. Rome. (also available at www.fao.org/3/ca6144en/
CA6144EN.pdf).
154 Abu Hatab, A., Cavinato, M.E.R., Lindemer, A. &
Lagerkvist, C.-J. 2019. Urban sprawl, food security and
agricultural systems in developing countries: a systematic review
of the literature. Cities, 94: 129–142.
163 See endnote 20.
164 Quisumbing, A.R., Rubin, D., Manfre, C., Waithanji, E.,
van den Bold, M., Olney, D., Johnson, N. & Meinzen-Dick, R.
2015. Gender, assets, and market-oriented agriculture: learning
from high-value crop and livestock projects in Africa and Asia.
Agriculture and Human Values, 32(4): 705–725.
155 FAO. 2020. Agricultural Transformation and the Urban Food
Agenda. FAO Committee on Agriculture. Twenty-seventh Session
28 September - 2 October 2020. Rome. (also available at
https://doi.org/10.1007/s10887-015-9121-4).
165 FAO. 2011. The State of Food and Agriculture 2010-11.
Women in agriculture: closing the gap for development. Rome.
(also available at www.fao.org/3/i2050e/i2050e.pdf).
156 See endnote 155.
| 202 |
166 Heckert, J., Olney, D.K. & Ruel, M.T. 2019. Is women’s
empowerment a pathway to improving child nutrition outcomes
in a nutrition-sensitive agriculture program? Evidence from a
randomized controlled trial in Burkina Faso. Social Science &
Medicine, 233: 93–102.
176 Quisumbing, A.R., Sproule, K., Martinez, E.M. & Malapit,
H. 2021. Do tradeoffs among dimensions of women’s
empowerment and nutrition outcomes exist? Evidence from six
countries in Africa and Asia. Food Policy, 100: 102001.
177 Cavatassi, R. & Mallia, P. 2018. Impact assessment
report: Tajikistan Livestock and Pasture Development Project
(LPDP). Rome, IFAD.
167 United Nations Population Fund (UNFPA). 2014. The State
of World Population 2014. The power of 1.8 billion adolescents,
youth and the transformation of the future. New York, USA.
(also available at www.unfpa.org/sites/default/files/pub-pdf/
EN-SWOP14-Report_FINAL-web.pdf).
178 IFAD. 2012. President’s report. Proposed loan and grant to
the Republic of Indonesia for the Coastal Community
Development Project. Rome.
168 United Nations Department of Economic and Social
Affairs (UNDESA). 2019. World Population Prospects.
In: UNDESA [online]. New York, USA. [Cited 25 May 2021].
https://population.un.org/wpp
179 Cavatassi, R., Mabiso, A. & Brueckmann, P. 2019. Impact
assessment report: Republic of Indonesia Coastal Community
Development Project (CCDP). Rome, IFAD. (also available at
www.ifad.org/documents/38714170/41248489/IN_CCDP_
IA+report.pdf/0663268b-3f06-bee7-970a-9312ee70da93).
169 International Labour Organization (ILO). 2020. World
Employment and Social Outlook: trends 2020. Geneva, Switzerland.
180 Bandiera, O., Buehren, N., Burgess, R., Goldstein, M.,
Gulesci, S., Rasul, I. & Sulaiman, M. 2018. Women’s
empowerment in action: evidence from a randomized control trial
in Africa. Washington, DC, World Bank. (also available at
https://openknowledge.worldbank.org/handle/10986/28282).
170 FAO, Technical Centre for Agricultural and Rural
Cooperation (CTA) & IFAD. 2014. Youth and agriculture: key
challenges and concrete solutions. Rome, FAO. (also available at
www.fao.org/3/i3947e/i3947e.pdf).
171 Betcherman, G. & Khan, T. 2015. Youth employment in subSaharan Africa: Taking stock of the evidence and knowledge gaps.
Ottawa, International Development Research Centre (IDRC).
181 YAPASA. 2017. Home. In: YAPASA [online]. Lusaka.
[Cited 7 May 2021]. www.yapasa.org
182 FAO. 2019. Youth in motion for climate action! A compilation of youth initiatives in agriculture to address
the impacts of climate change. Rome. (also available at
www.fao.org/3/ca5746en/ca5746en.pdf).
172 FAO. 2020. Africa’s youth in agrifood systems: innovation in
the context of COVID-19. Rome. (also available at www.fao.org/3/
cb0539en/CB0539EN.pdf).
173 Deotti, L. & Estruch, E. 2016. Addressing rural youth
migration at its root causes: a conceptual framework. Rome, FAO.
(also available at www.fao.org/3/i5718e/i5718e.pdf).
183 Kadiyala, S., Aurino, E., Cirillo, C., Srinivasan, C.S. &
Zanello, G. 2019. Rural Transformation and the double burden
of malnutrition among rural youth in developing countries.
Rome, IFAD.
174 IFAD. 2019. 2019 Rural Development Report: creating
opportunities for rural youth. Rome. (also available at
www.ifad.org/en/web/knowledge/-/publication/2019-ruraldevelopment-report).
184 Harris, J.L., Pomeranz, J.L., Lobstein, T. & Brownell,
K.D. 2009. A Crisis in the marketplace: how food marketing
contributes to childhood obesity and what can be done. Annual
Review of Public Health, 30(1): 211–225.
175 Cunningham, K., Ploubidis, G.B., Menon, P., Ruel, M.,
Kadiyala, S., Uauy, R. & Ferguson, E. 2015. Women’s
empowerment in agriculture and child nutritional status in rural
Nepal. Public Health Nutrition, 18(17): 3134–3145.
185 Mallarino, C., Gómez, L.F., González-Zapata, L., Cadena,
Y. & Parra, D.C. 2013. Advertising of ultra-processed foods and
beverages: Children as a vulnerable population. Revista de Saude
Publica, 47(5): 1006–1010.
| 203 |
NOTES
NOTES
186 WHO. 2017. Guidance on ending the inappropriate
promotion of foods for infants and young children.
Implementation manual. Geneva, Switzerland. (also available at
www.who.int/nutrition/publications/infantfeeding/manualending-inappropriate-promotion-food).
[Cited 7 May 2021]. https://policydatabase.wcrf.org/level_
one?page=nourishing-level-one#step2=1%23step3=336
195 WHO. 2017. Tackling NCDs: ‘Best buys’ and other
recommended interventions for the prevention and control of
noncommunicable diseases. Geneva, Switzerland.
187 WHO. 2012. A Framework for Implementing on the
Marketing of Foods and Non-Alcoholic Beverages to Children.
Geneva, Switzerland. (also available at https://apps.who.int/iris/
bitstream/handle/10665/80148/9789241503242_eng.
pdf?sequence=1&isAllowed=y).
196 WHO. 2014. Kuwaitis lower blood pressure by reducing salt
in bread. In: WHO [online]. Geneva, Switzerland. [Cited 7 May
2021]. www.who.int/features/2014/kuwait-blood-pressure
197 Al Jawaldeh, A., Rafii, B. & Nasreddine, L. 2018. Salt
intake reduction strategies in the Eastern Mediterranean Region.
Eastern Mediterranean Health Journal, 24(12): 1172–1180.
188 WHO. 2021. Code and subsequent resolutions.
In: WHO [online]. Geneva, Switzerland. [Cited 21 June 2021].
www.who.int/nutrition/netcode/resolutions
198 Garde, A., Byrne, S., Gokani, N. & Murphy, B. 2018. A
child rights-based approach to food marketing: a guide for policy
makers. New York, USA, UNICEF. (also available at
www.unicef.org/csr/files/A_Child_Rights-Based_Approach_to_
Food_Marketing_Report.pdf).
189 Rubinstein, A., Elorriaga, N., Garay, O.U., Poggio, R.,
Caporale, J., Matta, M.G., Augustovski, F., Pichon-Riviere, A.
& Mozaffarian, D. 2015. Eliminating artificial trans fatty acids in
Argentina: estimated effects on the burden of coronary heart
disease and costs. Bulletin of the World Health Organization,
93(9): 614–622.
199 Cruz, L. 2020. Legal guide on school food and nutrition.
Rome, FAO. (also available at https://doi.org/10.4060/ca9730en).
190 WHO. 2018. Argentina regulating trans fats and monitoring
heart health. In: WHO [online]. Geneva, Switzerland. [Cited 7 May
2021]. www.who.int/news-room/feature-stories/detail/argentinaregulating-trans-fats-and-monitoring-heart-health
200 FAO. 2019. School Food and Nutrition Framework. Rome.
(also available at www.fao.org/3/ca4091en/CA4091EN.pdf).
201 WHO. 2010. Set of recommendations on the marketing of
foods and non-alcoholic beverages to children. Geneva,
Switzerland.
191 Korean Ministry of Food and Drug Safety. 2008. Special
Act on Safety Management of Children’s Dietary Lifestyle. Act No.
12391. (also available at https://extranet.who.int/nutrition/gina/
sites/default/files/KOR 2008 Special act on safety management
of children%27s dietary lifestyle.pdf).
202 WHO. 1981. International Code of Marketing of Breast-milk
Substitutes. Geneva, Switzerland.
192 WHO. 2009. Special Act on Safety Control of Children’s
Dietary Life. In: Global database on the Implementation of
Nutrition Action (GINA) [online]. Geneva, Switzerland.
[Cited 7 May 2021]. https://extranet.who.int/nutrition/gina/en/
node/22937
203 Ministry of Law Justice and Company Affairs of the
Government of India. 2003. The Infant Milk Substitutes,
Feeding Bottles and Infant Foods (Regulation of Production,
Supply and Distribution) Act, 1992 as amended in 2003. Act. 41
of 1992. (also available at legislative.gov.in/sites/default/files/
A1992-41.pdf).
193 World Cancer Research Fund International (WCRF).
2018. Building momentum: lessons on implementing a robust
sugar sweetened beverage tax. London. (also available at
www.wcrf.org/wp-content/uploads/2021/04/PPA-BuildingMomentum-Report-WEB.pdf).
204 Agência Nacional de Vigilância Sanitária (Anvisa). 2006.
Lei No 11.265, de 3 de janeiro de 2006. Regulamenta a
comercialização de alimentos para lactentes e crianças de
primeira infância e também a de puericultura correlatos. Brasília.
(also available at http://portal.anvisa.gov.br/documents/
33916/388704/Lei%2BN%25C2%25BA%2B11265.pdf/
9933e31b-83e6-4e69-bb1a-747470719b98).
194 WCRF. 2021. NOURISHING and MOVING policy databases.
In: World Cancer Research Fund International [online]. London.
| 204 |
205 Agência Nacional de Vigilância Sanitária (Anvisa).
forthcoming. Decreto No 8.552 de 3 de novembro de 2015.
Regulamenta a Lei no 11.265, de 3 de janeiro de 2006, que
dispõe sobre a comercialização de alimentos para lactentes e
crianças de primeira infância e de produtos de puericultura
correlatos. Brasilia.
213 Taillie, L.S., Reyes, M., Colchero, M.A., Popkin, B. &
Corvalán, C. 2020. An evaluation of Chile’s law of food labeling
and advertising on sugar-sweetened beverage purchases from
2015 to 2017: a before-and-after study. PLOS Medicine, 17(2):
e1003015.
214 WHO. 2017. NetCode Toolkit: Monitoring the marketing of
breast-milk substitutes: protocol for ongoing monitoring
systems. Geneva, Switzerland, WHO. (also available at
www.who.int/nutrition/publications/infantfeeding/netcodetoolkit-monitoring-systems).
206 Philippine Commission on Women of the Republic of
Philippines. 1986. Executive Order No. 51: National Code of
Marketing of Breastmilk Substitutes, Breastmilk Supplement and
Other Related Products. (also available at https://pcw.gov.ph/
executive-order-no-51-national-code-of-marketing-ofbreastmilk-substitutes-breastmilk-supplement-and-otherrelated-products).
215 Baker, P., Friel, S., Schram, A. & Labonte, R. 2016. Trade
and investment liberalization, food systems change and highly
processed food consumption: a natural experiment contrasting
the soft-drink markets of Peru and Bolivia. Globalization and
Health, 12(1): 24.
207 Biblioteca del Congreso Nacional de Chile. 2012.
Ley 20.606 - Sobre composición nutricional de los alimentos
y su publicidad. Valparaiso, Chile. (also available at
www.bcn.cl/leychile/navegar?idNorma=1041570).
216 Global Food Research Program. 2019. Peru. In: Global
Food Research Program [online]. Chapel Hill, USA. [Cited 7 May
2021]. https://globalfoodresearchprogram.web.unc.edu/wherewe-work/peru
208 Bosi, T., Erguder, T., Breda, J. & Jewell, J. 2018.
Monitoring food marketing to children in Turkey. Ankara, WHO.
(also available at www.euro.who.int/en/countries/turkey/
publications/monitoring-food-marketing-to-children-inturkey-2018).
209 Piwoz, E.G. & Huffman, S.L. 2015. The impact of
marketing of breast-milk substitutes on WHO-recommended
breastfeeding practices. Food and Nutrition Bulletin,
36(4): 373–386.
217 Friel, S., Hattersley, L., Snowdon, W., Thow, A.-M.,
Lobstein, T., Sanders, D., Barquera, S., Mohan, S., Hawkes,
C., Kelly, B., Kumanyika, S., L’Abbe, M., Lee, A., Ma, J.,
Macmullan, J., Monteiro, C., Neal, B., Rayner, M., Sacks, G.,
Swinburn, B., Vandevijvere, S. & Walker, C. 2013. Monitoring
the impacts of trade agreements on food environments. Obesity
Reviews, 14: 120–134.
210. WHO. 2020. Global Health Observatory (GHO) data
repository. In: WHO [online]. Geneva, Switzerland. [Cited
28 April 2020]. http://apps.who.int/gho/data/node.main.
A900A?lang=en
218 Barlow, P., McKee, M., Basu, S. & Stuckler, D. 2017. The
health impact of trade and investment agreements: a
quantitative systematic review and network co-citation analysis.
Globalization and Health, 13(1): 13.
211 Dillman Carpentier, F.R., Correa, T., Reyes, M. & Taillie,
L.S. 2020. Evaluating the impact of Chile’s marketing regulation
of unhealthy foods and beverages: pre-school and adolescent
children’s changes in exposure to food advertising on television.
Public Health Nutrition, 23(4): 747–755.
219 FAO & WHO. 2014. Conference Outcome Document:
Framework for Action. Second International Conference on
Nutrition. Rome, 19–21 November 2014. ICN2 2014/3 Corr.1.
Rome. (also available at www.fao.org/3/a-mm215e.pdf).
220 Thow, A.M., Annan, R., Mensah, L. & Chowdhury,
S.N. 2014. Development, implementation and outcome of
standards to restrict fatty meat in the food supply and prevent
NCDs: learning from an innovative trade/food policy in Ghana.
BMC Public Health, 14(1): 249.
212 Massri, C., Sutherland, S., Källestål, C. & Peña,
S. 2019. Impact of the food-labeling and advertising law
banning competitive food and beverages in Chilean public
schools, 2014–2016. American Journal of Public Health,
109(9): 1249–1254.
| 205 |
NOTES
NOTES
221 Annan, R.A., Apprey, C., Oppong, N.K., Petty-Agamatey,
V., Mensah, L. & Thow, A.M. 2018. Public awareness and
perception of Ghana’s restrictive policy on fatty meat, as well as
preference and consumption of meat products among Ghanaian
adults living in the Kumasi Metropolis. BMC Nutrition, 4(1): 2.
231 FAO, UNHCR, UNICEF, WFP & WHO. 2020. Global action
plan on child wasting: a framework for action to accelerate
progress in preventing and managing child wasting and the
achievement of the Sustainable Development Goals. Geneva,
Switzerland, WHO. (also available at www.who.int/
publications/m/item/global-action-plan-on-child-wasting-aframework-for-action).
222 Bell, C., Latu, C., Coriakula, J., Waqa, G., Snowdon, W. &
Moodie, M. 2020. Fruit and vegetable import duty reduction in
Fiji to prevent obesity and non-communicable diseases: a case
study. Public Health Nutrition, 23(1): 181–188.
232 FAO. 2017. FAO social protection framework: promoting
rural development for all. Rome. (also available at
www.fao.org/3/i7016e/i7016e.pdf).
223 Latu, C., Moodie, M., Coriakula, J., Waqa, G., Snowdon,
W. & Bell, C. 2018. Barriers and facilitators to food policy
development in Fiji. Food and Nutrition Bulletin, 39(4): 621–631.
233 World Bank. 2020. Poverty and Shared Prosperity 2020:
reversals of fortune. Washington, DC, World Bank. (also available
at http://hdl.handle.net/10986/34496).
224 FAO. forthcoming. The State of Food and Agriculture 2021.
Rome.
234 Borkowski, A., Santiago, J., Correa, O., Bundy, D.A.P.,
Burbano, C., Hayashi, C., Lloyd-Evans, E., Neitzel, J. & Reuge,
N. 2021. COVID-19: Missing More Than a Classroom The impact
of school closures on children’s nutrition. Florence, Italy, UNICEF.
(also available at www.unicef-irc.org/publications/1176-covid19-missing-more-than-a-classroom-the-impact-of-schoolclosures-on-childrens-nutrition.html).
225 Folberth, C., Khabarov, N., Balkovič, J., Skalský, R.,
Visconti, P., Ciais, P., Janssens, I.A., Peñuelas, J. &
Obersteiner, M. 2020. The global cropland-sparing potential of
high-yield farming. Nature Sustainability, 3(4): 281–289.
226 GBD 2017 Diet Collaborators. 2019. Health effects of
dietary risks in 195 countries, 1990–2017: a systematic analysis
for the Global Burden of Disease Study 2017. The Lancet,
393(10184): 1958–1972.
235 WFP & Economic Policy Research Institute (EPRI). 2020.
COVID-19 Policy Brief: Why does food security and nutrition
matter in social protection responses to systemic shocks in the
Southern African region? Rome, WFP.
227 WHO. 2015. The burden of foodborne diseases is substantial.
Geneva, Switzerland. (also available at https://apps.who.int/iris/
bitstream/handle/10665/327488/WHO-FOS-FZD-15.3-eng.
pdf?sequence=1&isAllowed=y).
236 WFP. 2020. Supporting national social protection responses
to the socioeconomic impact of COVID-19. Outline of a WFP offer
to governments. Rome.
228 World Bank. 2018. One Health – Operational Framework for
Strengthening Human, Animal, and Environmental Public Health
Systems at their Interface. Washington, DC. (also available at
https://documents1.worldbank.org/curated/
en/961101524657708673/pdf/122980-REVISED-PUBLICWorld-Bank-One-Health-Framework-2018.pdf).
237 FAO, UNICEF, WFP & WHO. 2021. Asia and the Pacific
Regional Overview of Food Security and Nutrition 2020: Maternal
and child diets at the heart of improving nutrition. Bangkok, FAO.
(also available at https://doi.org/10.4060/cb2895en).
238 Daidone, S., Davis, B., Handa, S. & Winters, P. 2019.
The household and individual-level productive impacts of cash
transfer programs in Sub-Saharan Africa. American Journal of
Agricultural Economics, 101(5): 1401–1431.
229 WHO, FAO & World Organisation for Animal Health (OIE).
2019. Taking a Multisectoral, One Health Approach: A Tripartite
Guide to Addressing Zoonotic Diseases in Countries. (also
available at www.fao.org/3/ca2942en/CA2942EN.pdf).
239 Kangasniemi, M., Knowles, M. & Karfakis, P. 2020. The
role of social protection in inclusive structural transformation.
Rome, FAO. (also available at www.fao.org/3/ca7333en/
CA7333EN.pdf).
230 WHO. 2019. Essential nutrition actions: mainstreaming
nutrition through the life-course. Geneva, Switzerland.
| 206 |
240 FAO. 2017. The State of Food and Agriculture 2017.
Leveraging food systems for inclusive rural transformation. Rome.
246 WHO. 2018. Global Nutrition Policy Review 2016-2017:
country progress in creating enabling policy environments for
promoting healthy diets ad nutrition. Geneva, Switzerland.
241 Hendriks, S., Soussana, J.-F., Cole, M., Kambugu, A. &
Zilberman, D. 2021. Ensuring access to safe and nutritious food
for all through transformation of food systems. A paper on Action
Track 1. The Scientific Group of the UN Food Systems Summit.
(also available at https://sc-fss2021.org/wp-content/uploads/
2021/04/Action_Track_1_paper_Ensuring_Access.pdf).
247 Termeer, C.J.A.M., Drimie, S., Ingram, J., Pereira, L. &
Whittingham, M.J. 2018. A diagnostic framework for food
system governance arrangements: The case of South Africa.
NJAS - Wageningen Journal of Life Sciences, 84: 85–93.
248 Grow Asia. 2021. Our Network. In: Grow Asia [online].
Singapore. [Cited 10 May 2021]. www.growasia.org/our-network
242 FAO. 2020. Outline of the strategic framework 2022-31 and
outline of the medium term plan 2022-25. Rome.
249 Barrett, C.B., Benton, T., Fanzo, J., Herrero, M., Nelson,
R.J., Bageant, E., Buckler, E., Cooper, K., Culotta, I., Fan, S.,
Gandhi, R., James, S., Kahn, M., Lawson-Lartego, L., Liu, J.,
Marshall, Q., Mason-D’Croz, D., Mathys, A., Mathys, C.,
Mazariegos-Anastassiou, V., Miller, A., Misra, K., Mude, A.G.,
Shen, J., Sibanda, L.M., Song, C., Steiner, R., Thornton, P. &
Wood, S. 2020. Socio-technical innovation bundles for agri-food
systems transformation. Report of the International Expert Panel
on Innovations to Build Sustainable, Equitable, Inclusive Food
Value Chains. Ithaca, USA and London, Cornell Atkinson Center
for Sustainability and Springer Nature.
243 Herrero, M., Thornton, P.K., Mason-D’Croz, D., Palmer,
J., Bodirsky, B.L., Pradhan, P., Barrett, C.B., Benton, T.G.,
Hall, A., Pikaar, I., Bogard, J.R., Bonnett, G.D., Bryan, B.A.,
Campbell, B.M., Christensen, S., Clark, M., Fanzo, J., Godde,
C.M., Jarvis, A., Loboguerrero, A.M., Mathys, A., McIntyre,
C.L., Naylor, R.L., Nelson, R., Obersteiner, M., Parodi, A.,
Popp, A., Ricketts, K., Smith, P., Valin, H., Vermeulen, S.J.,
Vervoort, J., van Wijk, M., van Zanten, H.H., West, P.C.,
Wood, S.A. & Rockström, J. 2021. Articulating the effect of
food systems innovation on the Sustainable Development
Goals. The Lancet Planetary Health, 5(1): e50–e62.
250 FAO. 2021. Hand-In-Hand Geospatial Platform.
In: FAO [online]. Rome. [Cited 1 June 2021].
www.fao.org/hih-geospatial-platform
244 Herrero, M., Thornton, P.K., Mason-D’Croz, D., Palmer,
J., Benton, T.G., Bodirsky, B.L., Bogard, J.R., Hall, A., Lee, B.,
Nyborg, K., Pradhan, P., Bonnett, G.D., Bryan, B.A.,
Campbell, B.M., Christensen, S., Clark, M., Cook, M.T., de
Boer, I.J.M., Downs, C., Dizyee, K., Folberth, C., Godde, C.M.,
Gerber, J.S., Grundy, M., Havlik, P., Jarvis, A., King, R.,
Loboguerrero, A.M., Lopes, M.A., McIntyre, C.L., Naylor, R.,
Navarro, J., Obersteiner, M., Parodi, A., Peoples, M.B.,
Pikaar, I., Popp, A., Rockström, J., Robertson, M.J., Smith, P.,
Stehfest, E., Swain, S.M., Valin, H., van Wijk, M., van Zanten,
H.H.E., Vermeulen, S., Vervoort, J. & West, P.C. 2020.
Innovation can accelerate the transition towards a sustainable
food system. Nature Food, 1(5): 266–272.
251 Reardon, T. & Vos, R. 2020. Food supply chains: business
resilience, innovation and adaptation. In IFPRI, ed. 2021 Global
Food Policy Report: transforming food systems after COVID-19,
pp. 64–74. Washington, DC, IFPRI.
252 Béné, C., Bakker, D., Rodriguez, M.C., Even, B., Melo, J.
& Sonneveld, A. 2021. Impacts of COVID-19 on people’s food
security: foundations for a more resilient food system.
Montpellier, France, CGIAR.
253 FAO. 2018. Solar powered irrigation: climate-friendly,
reliable and affordable. In: FAO [online]. Rome. [Cited 19 May
2021]. www.fao.org/neareast/news/view/en/c/1158041
245 Delaney, A., Evans, T., McGreevy, J., Blekking, J.,
Schlachter, T., Korhonen-Kurki, K., Tamás, P.A., Crane, T.A.,
Eakin, H., Förch, W., Jones, L., Nelson, D.R., Oberlack, C.,
Purdon, M. & Rist, S. 2018. Governance of food systems across
scales in times of social-ecological change: a review of
indicators. Food Security, 10(2): 287–310.
254 Parsons, K. & Hawkes, C. 2019. Brief 5: Policy coherence
in food systems. Rethinking food policy: a fresh approach to
policy and practice. London, Centre for Food Policy. (also
available at www.city.ac.uk/__data/assets/pdf_file/0018/
504621/7643_Brief-5_Policy_coherence_in_food_systems_
WEB_SP.pdf).
| 207 |
NOTES
NOTES
255 French Agricultural Research Centre for International
Development (CIRAD). 2018. Fostering territorial perspective for
development: towards a wider alliance. Paris. (also available at
https://collaboratif.cirad.fr/alfresco/s/d/workspace/
SpacesStore/70a168a9-f36c-4aeb-b8ea-a6f49b17084d/
TP4D_vENG.pdf.).
264 World Bank & UNICEF. 2020. Assessment of COVID-19
Impact on Poverty and Vulnerability in Iraq. (also available at
www.unicef.org/iraq/media/1181/file/Assessment of COVID-19
Impact on Poverty and Vulnerability in Iraq.pdf).
256 Agencia de Renovación del Territorio. 2020. Informe de
seguimiento a la implementación de los PDET. Bogotá.
266 Government of Iraq. 2020. The White Paper for
Economic Reforms: vision and key objectives. In: Government
of Iraq [online]. Baghdad. [Cited 1 June 2021].
https://gds.gov.iq/iraqs-white-paper-for-economic-reformsvision-and-key-objectives
265 See endnote 264.
257 United Nations Convention to Combat Desertification
(UNCCD). 2020. The Great Green Wall implementation status and
way ahead to 2030. Bonn, Germany. (also available at
https://catalogue.unccd.int/1551_GGW_Report_ENG_
Final_040920.pdf).
267 FAO. 2020. Socio-Economic & Food Security Survey 2018.
Jerusalem. (also available at www.fao.org/3/cb0721en/
CB0721EN.pdf).
258 Cernansky, R. 2021. New funds could help grow Africa’s
Great Green Wall. But can the massive forestry effort learn from
past mistakes? Science. February 11, 2021.
268 FAO. 2021. While peace awaits, do not let crises
compromise the way forward. In: FAO [online]. Rome. [Cited
21 June 2021]. www.fao.org/neareast/news/view/en/c/1369949
259 UN. 2018. The World’s Cities in 2018 – Data Booklet
(ST/ESA/ SER.A/417). New York, USA, United Nations,
Department of Economic and Social Affairs, Population Division.
(also available at www.un.org/en/events/citiesday/assets/pdf/
the_worlds_cities_in_2018_data_booklet.pdf).
269 FAO. 2020. National agrifood systems and COVID-19
in Palestine. Effects, policy responses, and long-term
implications. Rome. (also available at www.fao.org/3/
cb1340en/CB1340EN.pdf).
260 Milan Urban Food Policy Pact. 2020. Milan Urban Food
Policy Pact [online]. Milan, Italy. [Cited 1 June 2021].
www.milanurbanfoodpolicypact.org
270 Community Protection Approach (CPA). 2019. Toolkit
Operalizing the Humanitarian Development Nexus in the oPt.
Jerusalem. (also available at https://cpainitiative.org/wp-content/
uploads/2019/11/Nexus-Collection-Vol.4-Operationalizing-theHumanitarian-Development-Nexus-in-the-oPt.-Lesson-fromthe-Ground.pdf).
261 Batini, N., Serio, M. Di, Fragetta, M., Melina, G. &
Waldron, A. 2021. Building back better: how big are green
spending multipliers? Washington, DC, IMF. (also available at
www.imf.org/en/Publications/WP/Issues/2021/03/19/BuildingBack-Better-How-Big-Are-Green-Spending-Multipliers-50264).
271 Ministry of Agriculture of the Palestinian Authority.
2019. National food and nutrition security policy 2019-2030
(final draft). Ramallah.
262 Resilient Food Systems. 2021. Kenya - Upper Tana
Nairobi Water Fund (UTNWF). In: Resilient Food Systems
Knowledge Center [online]. Nairobi. [Cited 7 May 2021].
https://knowledgecentre.resilientfoodsystems.co/kc/countryprojects/kenya
272 Ministry of Agriculture of the Palestinian Authority.
2019. National Investment Plan for food and nutrition
security and sustainable agriculture 2020-2022
(NIP 2020-22). Ramallah.
263 Cavatassi, R., Alfani, F., Paolantonio, A. & Mallia, P. 2018.
Mexico Community-based Forestry Development Project in
Southern States (DECOFOS). Impact assessnent report. Rome,
IFAD. (also available at www.ifad.org/documents/
38714170/41096508/MX_DECOFOS_IA+report.pdf/d68154588f90-39b0-793a-cfbf9cb82211?t=1557928269000).
273 Global-Hub on Indigenous Peoples’ Food Systems.
forthcoming. The White/Wiphala paper on Indigenous Peoples’
Food Systems. Rome, FAO.
| 208 |
274 Intergovernmental Science-Policy Platform on
Biodiversity and Ecosystem Services (IPBES). 2019. Summary
for policymakers of the global assessment report on biodiversity
and ecosystem services of the Intergovernmental Science-Policy
Platform on Biodiversity and Ecosystem Services. Bonn,
Germany. (also available at https://ipbes.net/sites/default/
files/2020-02/ipbes_global_assessment_report_summary_
for_policymakers_en.pdf).
284 FAO. 2021. Community-based forest monitoring in
indigenous territories in Panama. In: FAO [online]. Rome.
[Cited 21 June 2021]. www.fao.org/indigenous-peoples/ourwork/monitoring-forests
285 IFAD & Bioversity International. 2021. How to do – Crop
selection for diet quality and resilience. Nutrition-sensitive
agriculture - Note no. 1. Rome.
275 FAO & Centre for Indigenous Peoples’ Nutrition and
Environment (CINE). 2013. Indigenous Peoples’ food systems &
well-being interventions & policies for healthy communities.
Rome, FAO.
286 IFAD & Bioversity International. 2021. How to do –
Promote neglected and underutilized species for domestic
markets. Nutrition-sensitive Agriculture - Note no. 3. Rome.
287 IFAD & Bioversity International. 2021. How to do –
Mainstreaming NUS in national policy for nutrition outcomes.
Nutrition-sensitive Agriculture - Note no. 5. Rome.
276 FAO. 2020. COVID-19 and indigenous peoples. Rome.
(also available at www.fao.org/3/ca9106en/CA9106EN.pdf).
277 IPBES. 2020. Workshop report on biodiversity and
pandemics of the Intergovernmental Platform on Biodiversity and
Ecosystem Services. Bonn, Germany. (also available at
www.ipbes.net/sites/default/files/2020-12/IPBES Workshop on
Biodiversity and Pandemics Report_0.pdf).
288 Agriculture and Agri-Food Canada. 2019. Food Policy for
Canada: everyone at the table. Ottawa. (also available at
https://multimedia.agr.gc.ca/pack/pdf/fpc_20190614-en.pdf).
289 Mamo, D. 2020. The Indigenous World 2020. Copenhagen,
IWGIA. (also available at https://iwgia.org/images/yearbook/
2020/IWGIA_The_Indigenous_World_2020.pdf).
278 See endnote 274.
279 Sobrevila, C. 2008. The role of indigenous peoples in
biodiversity conservation: the natural but often forgotten partners
(English). Washington, DC, World Bank. (also available at
http://documents.worldbank.org/curated/en/995271468177530126/
The-role-of-indigenous-peoples-in-biodiversity-conservation-thenatural-but-often-forgotten-partners).
290 FAO. 1996. Methodology for assessing food inadequacy in
developing countries. In FAO, ed. The Sixth World Food Survey,
pp. 114–143. Rome. (also available at www.fao.org/3/w0931e/
w0931e.pdf).
291 FAO. 2014. Advances in hunger measurement: traditional FAO
methods and recent innovations. FAO Statistics Division Working
Paper 14-04. Rome. (also available at www.fao.org/3/i4060e/
i4060e.pdf).
280 Gundersen, C. 2008. Measuring the extent, depth, and
severity of food insecurity: An application to American Indians in
the USA. Journal of Population Economics, 21(1): 191–215.
292 World Bank. 2021. World Development Indicators.
In: World Bank [online]. Washington, DC. [Cited 24 April 2020].
datatopics.worldbank.org/world-development-indicators
281 FAO. forthcoming. Indigenous youth as agents of change.
Rome.
282 FAO. 2020. FAO launches the Global-Hub on Indigenous
Peoples’ Food Systems. In: FAO [online]. Rome. [Cited 10 June
2021]. www.fao.org/indigenous-peoples/news-article/
en/c/1311821
293 FAO. 2014. Advances in hunger measurement: traditional
FAO methods and recent innovations. FAO Statistics Division
Working Paper 14-04. Rome.
294 UNICEF. 2019. Infant and young child feeding: exclusive
breastfeeding, predominant breastfeeding. In: United Nations
Children’s Fund [online]. New York, USA. [Cited 20 May 2021].
https://data.unicef.org/topic/%0Anutrition/infant-and-youngchild-feeding
283 FAO. 2021. Mujeres indígenas resguardan y mejoran
maíces criollos. In: FAO [online]. Rome. [Cited 21 June 2021].
www.fao.org/index.php?id=82904
| 209 |
NOTES
NOTES
295 Blencowe, H., Krasevec, J., de Onis, M., Black, R.E., An,
X., Stevens, G.A., Borghi, E., Hayashi, C., Estevez, D.,
Cegolon, L., Shiekh, S., Ponce Hardy, V., Lawn, J.E. &
Cousens, S. 2019. National, regional, and worldwide estimates
of low birthweight in 2015, with trends from 2000: a systematic
analysis. The Lancet Global Health, 7(7): e849–e860.
on Nutrition Monitoring (TEAM). Geneva, Switzerland and
New York, USA.
305 Uppsala University. 2021. Uppsala Conflict Data Program.
In: UCDP [online]. Uppsala, Sweden. [Cited 26 May 2021].
https://ucdp.uu.se
296 Blanc, A.K. & Wardlaw, T. 2005. Monitoring low birth
weight: An evaluation of international estimates and an updated
estimation procedure. Bulletin of the World Health Organization,
83(3): 178–185.
306 FAO. 2021. GIEWS - Global Information and Early Warning
System. In: FAO [online]. Rome. [Cited 26 May 2021].
www.fao.org/giews
307 Development Initiatives. 2020. Home. In: Development
Initiatives [online]. Bristol, UK. [Cited 26 May 2021].
https://devinit.org
297 See endnote 210.
298 NCD Risk Factor Collaboration (NCD-RisC). 2016.
Trends in adult body-mass index in 200 countries from
1975 to 2014: a pooled analysis of 1698 population-based
measurement studies with 19.2 million participants.
The Lancet, 387(10026): 1377–1396.
308 IPC Global Partners. 2019. Integrated Food Security
Phase Classification Technical Manual Version 3.0. Evidence
and Standards for Better Food Security and Nutrition
Decisions. Rome.
299 WHO. 2019. Nutrition Landscape Information System
(NLIS) country profile indicators: interpretation guide. Geneva,
Switzerland. (also available at www.who.int/publications/i/
item/9789241516952).
309 Agard, J., Schipper, E.L.F., Birkmann, J., Campos, M.,
Dubeux, C., Nojiri, Y., Olsoon, L., Osman-Elasha, B., Pelling,
M., Prather, M., Rivera-Ferre, M.G., Ruppel, O.C., Sallenger,
A., Smith, K.R., Clair, A.L.S., Mach, K.J., Mastrandrea, M.D. &
Eren Bilir, T. 2014. Glossary. In IPCC, ed. Climate Change 2014:
Impacts, Adaptation, and Vulnerability. Part A: Global and
Sectoral Aspects. Contribution of Working Group II to the Fifth
Assessment Report of the Intergovernmental Panel on Climate
Change [Field, C.B., V.R. Barros, D.J. Dokken, K.J., pp. 1757–
1776. Cambridge, UK and New York, USA, Cambridge University
Press. (also available at www.ipcc.ch/site/assets/
uploads/2018/02/WGIIAR5-AnnexII_FINAL.pdf).
300 World Bank. 2021. International Comparison Program
(ICP). In: World Bank [online]. Washington, DC. [Cited 6 May
2021]. www.worldbank.org/en/programs/icp
301 World Bank. 2021. Global Consumption Database –
Food and Beverages. In: World Bank [online]. Washington, DC.
[Cited 6 May 2021]. datatopics.worldbank.org/consumption/
sector/Food-and-Beverages
310 Intergovernmental Panel on Climate Change (IPCC).
2012. Managing the Risks of Extreme Events and Disasters to
Advance Climate Change Adaptation. C.B. Field, V. Barros, T.F.
Stocker, D. Qin, D.J. Dokken, K.L. Ebi, M.D. Mastrandrea, K.J.
Mach, G.-K. Plattner, S.K. Allen, M. Tignor & P.M. Midgley, eds.
A Special Report of Working Groups I and II of the
Intergovernmental Panel on Climate Change. [Field, C.B., V.
Barros, T.F. Stocker, D. Qin, D.J. Dokken, K.L. Ebi, M.D.
Mastrandrea, K.J. Mach, G.-K. Plattner, S.K. Allen, M. Tignor,
and P.M. Midgley (eds.). Cambridge, UK and New York, USA,
Cambridge University Press. (also available at www.ipcc.ch/site/
assets/uploads/2018/03/SREX_Full_Report-1.pdf).
302 Bai, Y., Ebel, A., Herforth, A. & Masters, W.A. 2021.
Methodology to update costs and affordability of healthy diets in
the gap years of the International Comparison Program, 9 April.
Working paper for internal use (unpublished).
303 Laborde, D. & Torero Cullen, M. forthcoming. A modelling
framework for food systems: Defining a common baseline.
Document prepared for the UN Food Systems Summit 2021
Scientific Group.
304 WHO & UNICEF. 2017. Methodology for monitoring
progress towards the global nutrition targets for 2025. Technical
report by the WHO-UNICEF Technical Expert Advisory Group
| 210 |
311 Chambers, R. & Conway, G.R. 1992. Sustainable Rural
Livelihoods: Practical Concepts for the 21st Century.
IDS Discussion Paper 296. Brighton, UK, Institute of
Development Studies (IDS). (also available at www.ids.ac.uk/
publications/sustainable-rural-livelihoods-practical-conceptsfor-the-21st-century).
320 FAO. 2020. Consumer price indices and food inflation.
FAOSTAT analytical brief 3. Rome.
321 FAO. 2021. The State of Food and Agriculture: Agriculture
Food Systems Transformation: from Strategy to Action.
FAO Conference – Forty-second session. 14–18 June 2021.
(also available at www.fao.org/3/nf243en/nf243en.pdf).
312 Dercon, S., Hoddinott, J. & Woldehanna, T. 2005.
Shocks and consumption in 15 Ethiopian villages, 1999–2004.
Journal of African Economies, 14(4): 559–585.
322 Jones, A.D. 2017. Critical review of the emerging
research evidence on agricultural biodiversity, diet diversity,
and nutritional status in low- and middle-income countries.
Nutrition Reviews, 75(10): 769–782.
313 WFP. 2009. Comprehensive Food Security & Vulnerability
Analysis (CFSVA) Guidelines - First Edition, 2009. Rome.
(also available at www.wfp.org/publications/comprehensivefood-security-and-vulnerability-analysis-cfsva-guidelines-firstedition).
323 European Centre for Medium-Range Weather Forecasts
(ECMWF). 2021. Datasets. In: ECMWF [online]. Reading, UK.
[Cited 10 June 2021]. www.ecmwf.int/en/forecasts/datasets
314 FAO. 2016. Managing climate risk using climate-smart
agriculture. Rome.
324 European Commission. 2021. Anomaly Hotspots of
Agricultural Production (ASAP). In: ASAP [online]. Brussels.
[Cited 10 June 2021]. mars.jrc.ec.europa.eu/asap
315 United Nations Office for Disaster Risk Reduction
(UNDRR). 2009. 2009 UNISDR terminology on disaster risk
reduction. Geneva, Switzerland (also available at
www.preventionweb.net/publications/view/7817).
325 Climate Hazards Center of the University of California Santa Barbara. 2021. CHIRPS: Rainfall estimates from rain
gauge and satellite observations. In: CHIRPS [online]. Santa
Barbara, USA. [Cited 10 June 2021]. www.chc.ucsb.edu/data/
chirps
316 UN. 2016. Report of the open-ended intergovernmental
expert working group on indicators and terminology relating to
disaster risk reduction. New York, USA, UN. (also available at
www.preventionweb.net/files/50683_oiewgreportenglish.pdf).
326 Centre for Research on the Epidemiology of Disasters
(CRED). 2021. EM-DAT: the international disasters database.
In: EM-DAT [online]. Brussels. [Cited 10 June 2021].
public.emdat.be
317 UN. 2017. Report of the High-Level Committee on
Programmes at its thirty-fourth session. Annex III. CEB/2017/6
(6 November 2017). New York, USA. (also available at
https://digitallibrary.un.org/record/3844899).
327 IMF. 2021. World Economic Outlook Database - April 2021.
In: IMF [online]. Washington, DC. [Cited 10 June 2021].
www.imf.org/en/Publications/WEO/weo-database/2021/April
318 American Meteorological Society (AMS). 2015. Weather Glossary of Meteorology. In: AMS [online]. Boston, USA. [Cited
26 May 2021]. https://glossary.ametsoc.org/wiki/Weather
319 World Bank. 2021. GDP per capita growth (annual %) Latin America & Caribbean | Data. In: World Bank [online].
[Cited 26 May 2021]. https://data.worldbank.org/indicator/NY.
GDP.PCAP.KD.ZG?end=2019&locations=ZJ&start=1961
| 211 |
NOTES ON GEOGRAPHIC REGIONS IN STATISTICAL TABLES
IN CHAPTER 2 AND ANNEXES 1 AND 2
Countries revise their official statistics
regularly for past periods as well as for
the latest reporting period. The same
holds for statistics presented in this
report. Whenever this happens,
estimates are revised accordingly.
Therefore, users are advised to refer to
changes in estimates over time only
within the same edition of The State of
Food Security and Nutrition in the World
and refrain from comparing data
published in editions for different years.
Geographic regions
This publication follows the
composition of geographic regions as
presented by the Statistics Division of
the United Nations Secretariat
primarily for use in its publications and
databases (https://unstats.un.org/unsd/
methodolog y/m49). The assignment of
countries or areas to specific groupings
is for statistical convenience and does
not imply any assumption regarding
political or other affiliation of
countries or territories by the United
Nations. Please refer to the list below
for the country composition of each
region in Annexes 1 and 2 tables as
well as in Tables 1–4 in Section 2.1.
Countries, areas and territories for
which there were insufficient or
unreliable data for conducting the
assessment are not reported and not
included in the aggregates.
Specifically:
Northern Africa: In addition to the
countries listed in the table, PoU
and food insecurity based on the
FIES include an estimate for
Western Sahara. Child wasting,
stunting and overweight, low
birthweight, adult obesity, exclusive
breastfeeding and anaemia
estimates exclude Western Sahara.
Eastern Africa: With respect to the M49
classification, it excludes British
Indian Ocean Territor y, French
Southern and Antarctic Territories,
Mayotte, and Réunion.
Western Africa: With respect to the
M49 classification, it excludes
Saint Helena.
Asia and Eastern Asia: With respect to the
M49 classification, low birthweight
and child wasting aggregates
exclude Japan.
Caribbean: With respect to the M49
classification, it excludes Anguilla;
Aruba; Bonaire, Sint Eustatius and
Saba; British Virgin Islands;
Cayman Islands; Curaçao;
Guadeloupe; Martinique;
Montserrat; Saint Barthélemy;
Saint Martin (French Part);
Sint Maarten (Dutch part); and
Turks and Caicos Islands.
Adult obesity, child wasting, low
birthweight and exclusive
breastfeeding exclude Puerto Rico
and the United States Virgin
Islands.
South America: With respect to the M49
classification, it excludes Bouvet
Island, Falkland Islands (Malv inas),
French Guyana, and South Georgia
and the South Sandwich Islands.
Australia and New Zealand: With respect to
the M49 classification, it excludes
Christmas Island, Cocos (Keeling)
Islands, Heard and McDonald
Islands, and Norfolk Island.
Melanesia: With respect to the M49
classification, anaemia, child
wasting, stunting and overweight,
low birthweight and exclusive
breastfeeding estimates exclude
New Caledonia.
Micronesia: With respect to the M49
classification, adult obesity,
anaemia, child wasting, low
birthweight and exclusive
breastfeeding estimates exclude
Guam, Northern Mariana Islands
and US Minor Outlying Islands.
Aggregates for child stunting and
overweight exclude only US Minor
Outlying Islands.
Polynesia: With respect to the M49
classification, it excludes Pitcairn
Islands, and Wallis and Futuna
Islands. Adult obesit y, child
wasting, low birthweight and
exclusive breastfeeding estimates
exclude American Samoa, French
Polynesia and Tokelau (Associate
Member). Aggregates for child
stunting and overweight exclude
only French Polynesia.
Northern America: With respect to the
M49 classification, it excludes Saint
Pierre and Miquelon. Adult obesit y,
anaemia, low birthweight and
exclusive breastfeeding aggregates
also exclude Bermuda and
Greenland. Aggregates for wasting
are based only on data for the
United States of America.
Northern Europe: With respect to the
M49 classification, it excludes
Å land Islands, Channel Islands,
Faroe Islands (Associate Member),
Isle of Man, and Svalbard and
Jan Mayen Islands.
Southern Europe: With respect to the
M49 classification, it excludes
Gibraltar, Holy See, and
San Marino. However, anaemia,
child stunting, overweight and low
birthweight estimates include
San Marino.
Western Europe: With respect to the
M49 classification, it excludes
Liechtenstein and Monaco.
However, child stunting,
overweight, anaemia and low
birthweight estimates include
Monaco.
Other groupings
Least Developed Countries, Land
Locked Developing Countries and
Small Island Developing States
groupings include the countries as
presented by the Statistics Div ision of
the United Nations (https://unstats.
un.org/unsd/methodolog y/m49).
Small Island Developing States: Estimates for
child stunting, wasting and
overweight, adult obesity, exclusive
breastfeeding and low birthweight
exclude French Polynesia, Ang uilla,
Aruba, Bonaire, Sint Eustatius and
Saba, British Virgin Islands, Curaçao,
Montserrat, New Caledonia, Sint
Maarten (Dutch part). In addition,
estimates for child wasting, adult
obesity, exclusive breastfeeding and
low birthweight also exclude
American Samoa and Puerto Rico.
High-income, upper-middle-income,
lower-middle-income and low-income countries
include the countries as presented
by the World Bank classification
for the 2020 –2021 fiscal year
(https://datahelpdesk.worldbank.
org/knowledgebase/articles/906519).
Low-income food-deficit countries (2018):
Afghanistan, Bangladesh, Benin,
Burkina Faso, Burundi, Cameroon,
Central African Republic, Chad,
Comoros, Congo, Côte d’Ivoire,
Democratic People’s Republic of Korea,
the Democratic Republic of the Congo,
Djibouti, Eritrea, Ethiopia, the
Gambia, Ghana, Guinea,
Guinea-Bissau, Haiti, India, Kenya,
Kyrg yzstan, Lesotho, Liberia,
Madagascar, Malawi, Mali,
Mauritania, Mozambique, Nepal,
Nicaragua, the Niger, Rwanda, Sao
Tome and Principe, Senegal, Sierra
Leone, Solomon Islands, Somalia,
South Sudan, the Sudan, the Syrian
Arab Republic, Tajikistan, Togo,
Uganda, the United Republic of
Tanzania, Uzbekistan, Viet Nam,
Yemen and Zimbabwe.
Composition of geographic regions
AFRICA
Northern Africa: A lgeria, Eg y pt, Libya, Morocco, Sudan, Tunisia and Western Sahara.
Sub-Saharan Africa
Eastern Africa: Burundi, Comoros, Djibouti, Eritrea, Ethiopia, Kenya, Madagascar, Malawi, Mauritius, Mozambique,
Rwanda, Seychelles, Somalia, South Sudan, Uganda, United Republic of Tanzania, Zambia and Zimbabwe.
Middle Africa: Angola, Cameroon, Central African Republic, Chad, Congo, Democratic Republic of the Congo,
Equatorial Guinea, Gabon, and Sao Tome and Principe.
Southern Africa: Botswana, Eswatini, Lesotho, Namibia and South Africa.
Western Africa: Benin, Burkina Faso, Cabo Verde, Côte d’Ivoire, Gambia, Ghana, Guinea, Guinea-Bissau, Liberia, Mali,
Mauritania, Niger, Nigeria, Senegal, Sierra Leone and Togo.
ASIA
Central Asia: Kazakhstan, Ky rg yzstan, Tajikistan, Turkmenistan and Uzbekistan.
Eastern Asia: China, Democratic People’s Republic of Korea, Japan, Mongolia and Republic of Korea.
South-eastern Asia: Brunei Darussalam, Cambodia, Indonesia, Lao People’s Democratic Republic, Malaysia, Myanmar,
Philippines, Singapore, Thailand, Timor-Leste and Viet Nam.
Southern Asia: Afghanistan, Bangladesh, Bhutan, India, Iran (Islamic Republic of ), Maldives, Nepal, Pakistan
and Sri Lanka.
Western Asia: A rmenia, A zerbaijan, Bahrain, Cy prus, Georgia, Iraq, Israel, Jordan, Kuwait, Lebanon, Oman, Palestine,
Qatar, Saudi A rabia, Sy rian A rab Republic, Turkey, United A rab Emirates and Yemen.
LATIN AMERICA AND THE CARIBBEAN
Caribbean: Antig ua and Barbuda, Bahamas, Barbados, Cuba, Dominica, Dominican Republic, Grenada, Haiti, Jamaica,
Puerto Rico, Saint Kitts and Nev is, Saint Lucia, Saint Vincent and the Grenadines, and Trinidad and Tobago.
Latin America
Central America: Belize, Costa Rica, El Salvador, Guatemala, Honduras, Mexico, Nicarag ua and Panama.
South America: A rgentina, Boliv ia (Plurinational State of ), Brazil, Chile, Colombia, Ecuador, Guyana, Parag uay, Peru,
Suriname, Urug uay and Venezuela (Bolivarian Republic of ).
OCEANIA
Australia and New Zealand: Australia and New Zealand.
Oceania excluding Australia and New Zealand
Melanesia: Fiji, New Caledonia, Papua New Guinea, Solomon Islands and Vanuatu.
Micronesia: Kiribati, Marshall Islands, Micronesia (Federated States of ), Nauru and Palau.
Polynesia: American Samoa, Cook Islands, French Polynesia, Niue, Samoa, Tokelau, Tonga and Tuvalu.
NORTHERN AMERICA AND EUROPE
Northern America: Bermuda, Canada, Greenland and United States of America.
Europe
Eastern Europe: Belarus, Bulgaria, Czechia, Hungar y, Poland, Republic of Moldova, Romania, Russian Federation,
Slovakia and Ukraine.
Northern Europe: Denmark, Estonia, Finland, Iceland, Ireland, Lat v ia, Lithuania, Norway, Sweden, and
United Kingdom of Great Britain and Northern Ireland.
Southern Europe: A lbania, Andorra, Bosnia and Herzegov ina, Croatia, Greece, Italy, Malta, Montenegro,
North Macedonia, Portugal, Serbia, Slovenia and Spain.
Western Europe: Austria, Belgium, France, Germany, Luxembourg, Netherlands and Switzerland.
THE STATE OF
FOOD SECURITY
AND NUTRITION
IN THE WORLD
TRANSFORMING FOOD SYSTEMS
FOR FOOD SECURITY, IMPROVED NUTRITION
AND AFFORDABLE HEALTHY DIETS FOR ALL
In recent years, several major drivers have put the world off track to ending world hunger and
malnutrition in all its forms by 2030. The challenges have only grown with the COVID-19 pandemic
and related containment measures. This report presents the first global assessment of food
insecurity and malnutrition for 2020 and offers some indication of what hunger might look like by
2030, in a scenario further complicated by the enduring effects of the COVID-19 pandemic. It also
includes new estimates of the cost and affordability of healthy diets, which provide an important
link between the food security and nutrition indicators and the analysis of their trends. Altogether,
the report highlights the need for a deeper reflection on how to better address the global food
security and nutrition situation.
To understand how hunger and malnutrition have reached these critical levels, this report draws on
the analyses of the past four editions, which have produced a vast, evidence-based body of
knowledge of the major drivers behind the recent changes in food security and nutrition. These
drivers, which are increasing in frequency and intensity, include conflicts, climate variability and
extremes, and economic slowdowns and downturns – all exacerbated by the underlying causes of
poverty and very high and persistent levels of inequality. In addition, millions of people around the
world suffer from food insecurity and different forms of malnutrition because they cannot afford
the cost of healthy diets. From a synthesized understanding of this knowledge, updates and
additional analyses are generated to create a holistic view of the combined effects of these drivers,
both on each other and on food systems, and how they negatively affect food security and nutrition
around the world.
In turn, the evidence informs an in-depth look at how to move from silo solutions to integrated food
systems solutions. In this regard, the report proposes transformative pathways that specifically
address the challenges posed by the major drivers, also highlighting the types of policy and
investment portfolios required to transform food systems for food security, improved nutrition and
affordable healthy diets for all. The report observes that, while the pandemic has caused major
setbacks, there is much to be learned from the vulnerabilities and inequalities it laid bare. If taken
to heart, these new insights and wisdom can help get the world back on track towards the goal of
ending hunger, food insecurity and malnutrition in all its forms. To that end, this global report
provides a clear diagnostic to put in place the policies needed.