/


Текст
THE BEST ALL-IN-ONE FUNDS • PULLOUT SECTION
VOL. CIV
NO. 2
JANUARY 8, 2024
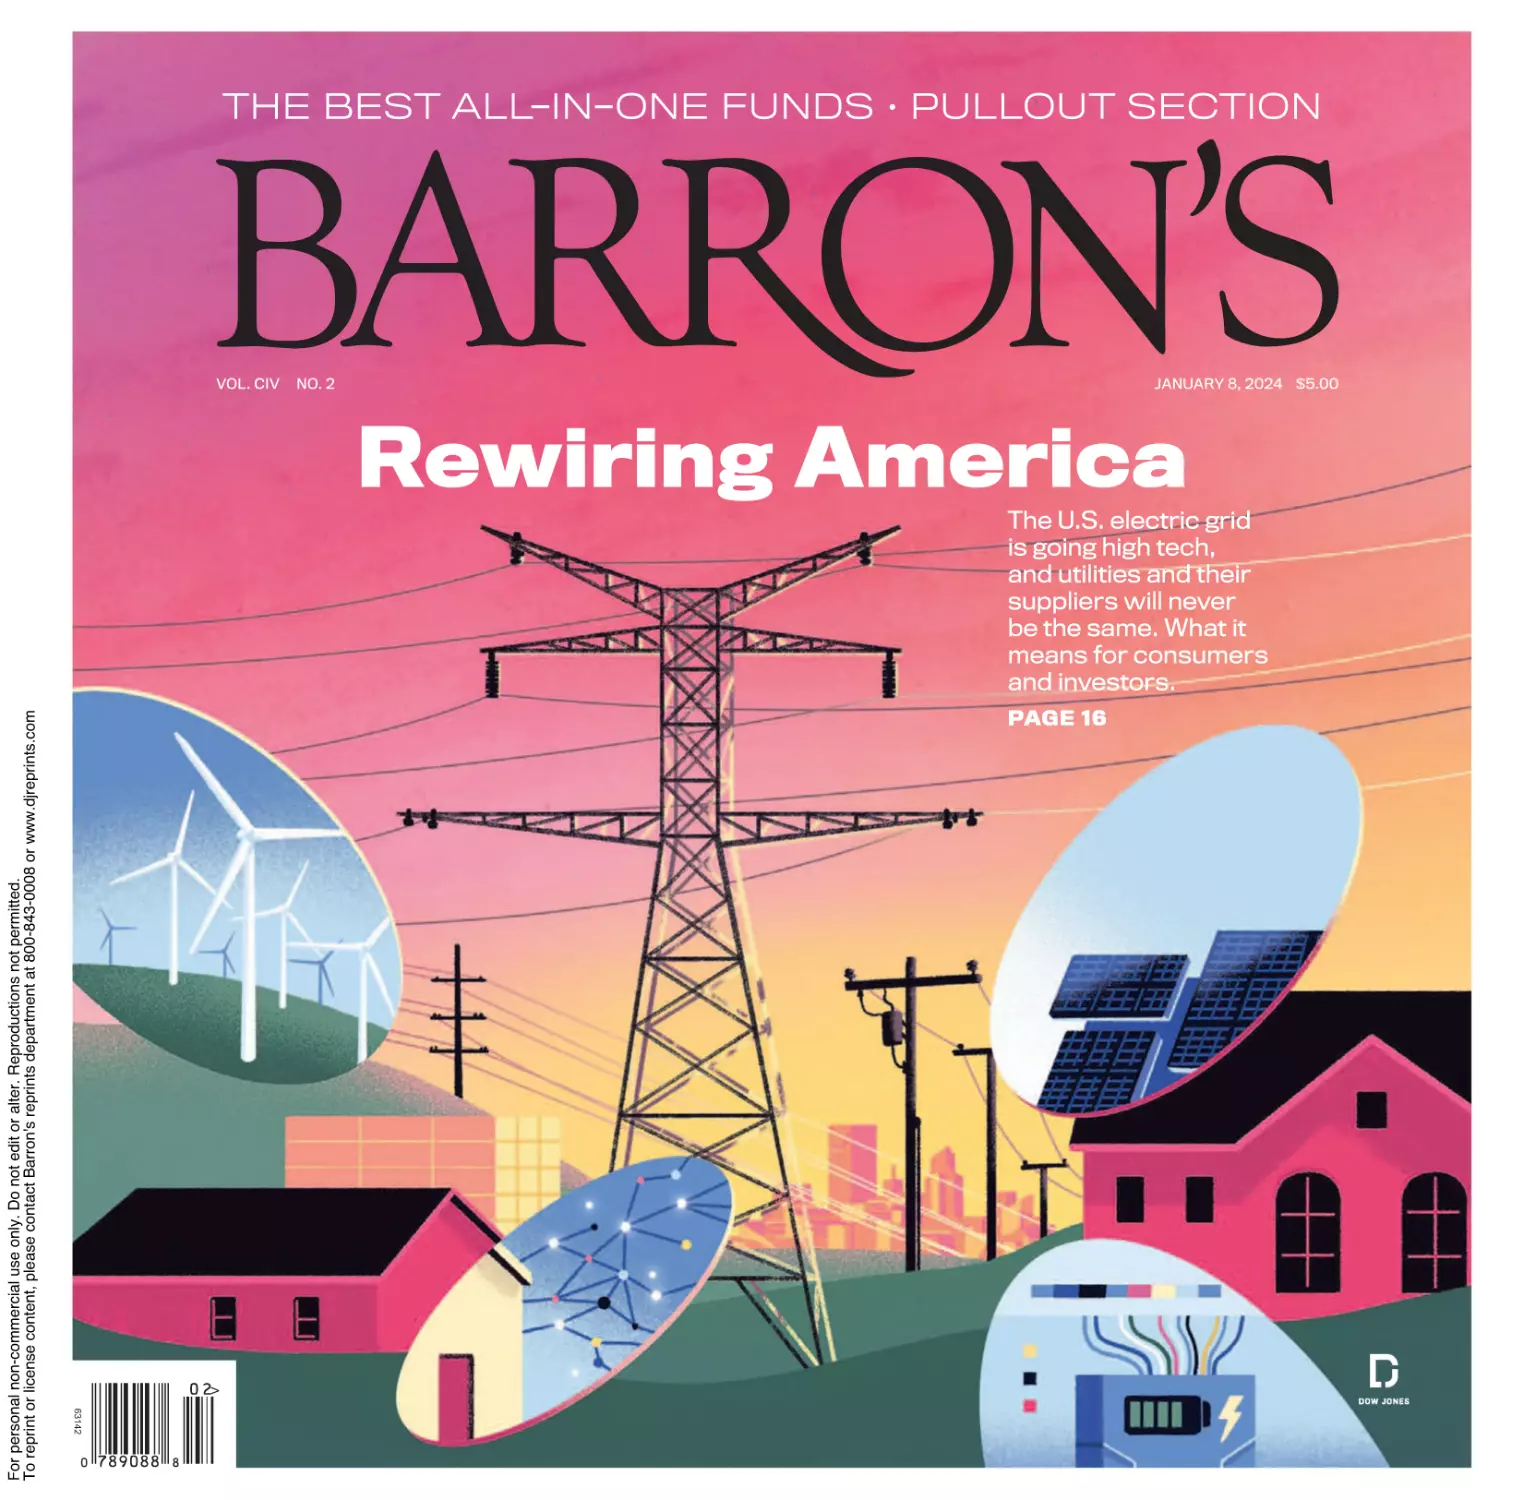
Rewiring America
PAGE 16
>
63142
For personal non-commercial use only. Do not edit or alter. Reproductions not permitted.
To reprint or license content, please contact Barron's reprints department at 800-843-0008 or www.djreprints.com
The U.S. electric grid
is going high tech,
and utilities and their
suppliers will never
be the same. What it
means for consumers
and investors.
$5.00
C O NTENTS
01.08.24
P. 16
SPECIAL PULLOUT: FUNDS QUARTERLY
P. 26
Cover Story: Big changes in the
way power is generated, stored,
and distributed are coming soon.
Here are the trends to watch—and
the companies likely to shine.
P. L2
Earnings season could determine
whether the downdraft continues.
Rising From the Ashes
Investing in the Power
Grid of the Future
Balanced asset mixes of stocks and bonds are back in favor. By LEWIS BRAHAM
Trader: Markets Reset
After 2023’s Surge
By CARLETON ENGLISH
P. L6
Japan’s long-awaited revival has legs. How to buy in. By LAWRENCE C. STRAUSS
P. 29
International: Lithium
Supplies Loosen Up
By AL ROOT
P. 11
The Braves and Other
Potential Home Runs
Chile and Australia are tapping
their abundant resources.
By CRAIG MELLOW
Medtronic, Comcast, and IAC are
among noted value investor
Jonathan Boyar’s 2024 stock picks.
P. 30
Striking Price: Invest
for the Unexpected
By NICHOLAS JASINSKI
This trade can protect you when
optimism overtakes the market.
P. 12
Abercrombie & Fitch
Racks Up Big Gains
By STEVEN M. SEARS
Outperforming even Nvidia in
2023, the retailer is sporting a
more mature image that’s
registering with shoppers.
P. 51
By SABRINA ESCOBAR
Preretirement planning could save
you thousands of dollars a year in
income-based surcharges.
Retirement: Save
Money on Medicare
P. 13
Home-Builder Stocks
May Have Hit a Wall
By ELIZABETH O’BRIEN
P. 50
A Defensive Portfolio
for a Riskier World
Keep Toll Brothers, Lennar, and
D.R. Horton on your investment
wish list and wait for a better
entry point in the coming months.
By SHAINA MISHKIN
P. 14
The Once Mighty U.S.
Steel in a New Light
THE BEST ALL-IN-ONE FUNDS • PULLOUT SECTION
VOL. CIV
NO. 2
JANUARY 8, 2024
$5.00
Rewiring America
The U.S. electric grid
is going high tech,
and utilities and their
suppliers will never
be the same. What it
means for consumers
and investors.
PAGE 16
Nippon Steel’s buyout of U.S. Steel
is perhaps a fitting epilogue to the
former No. 1 steel maker’s saga.
By KENNETH G. PRINGLE
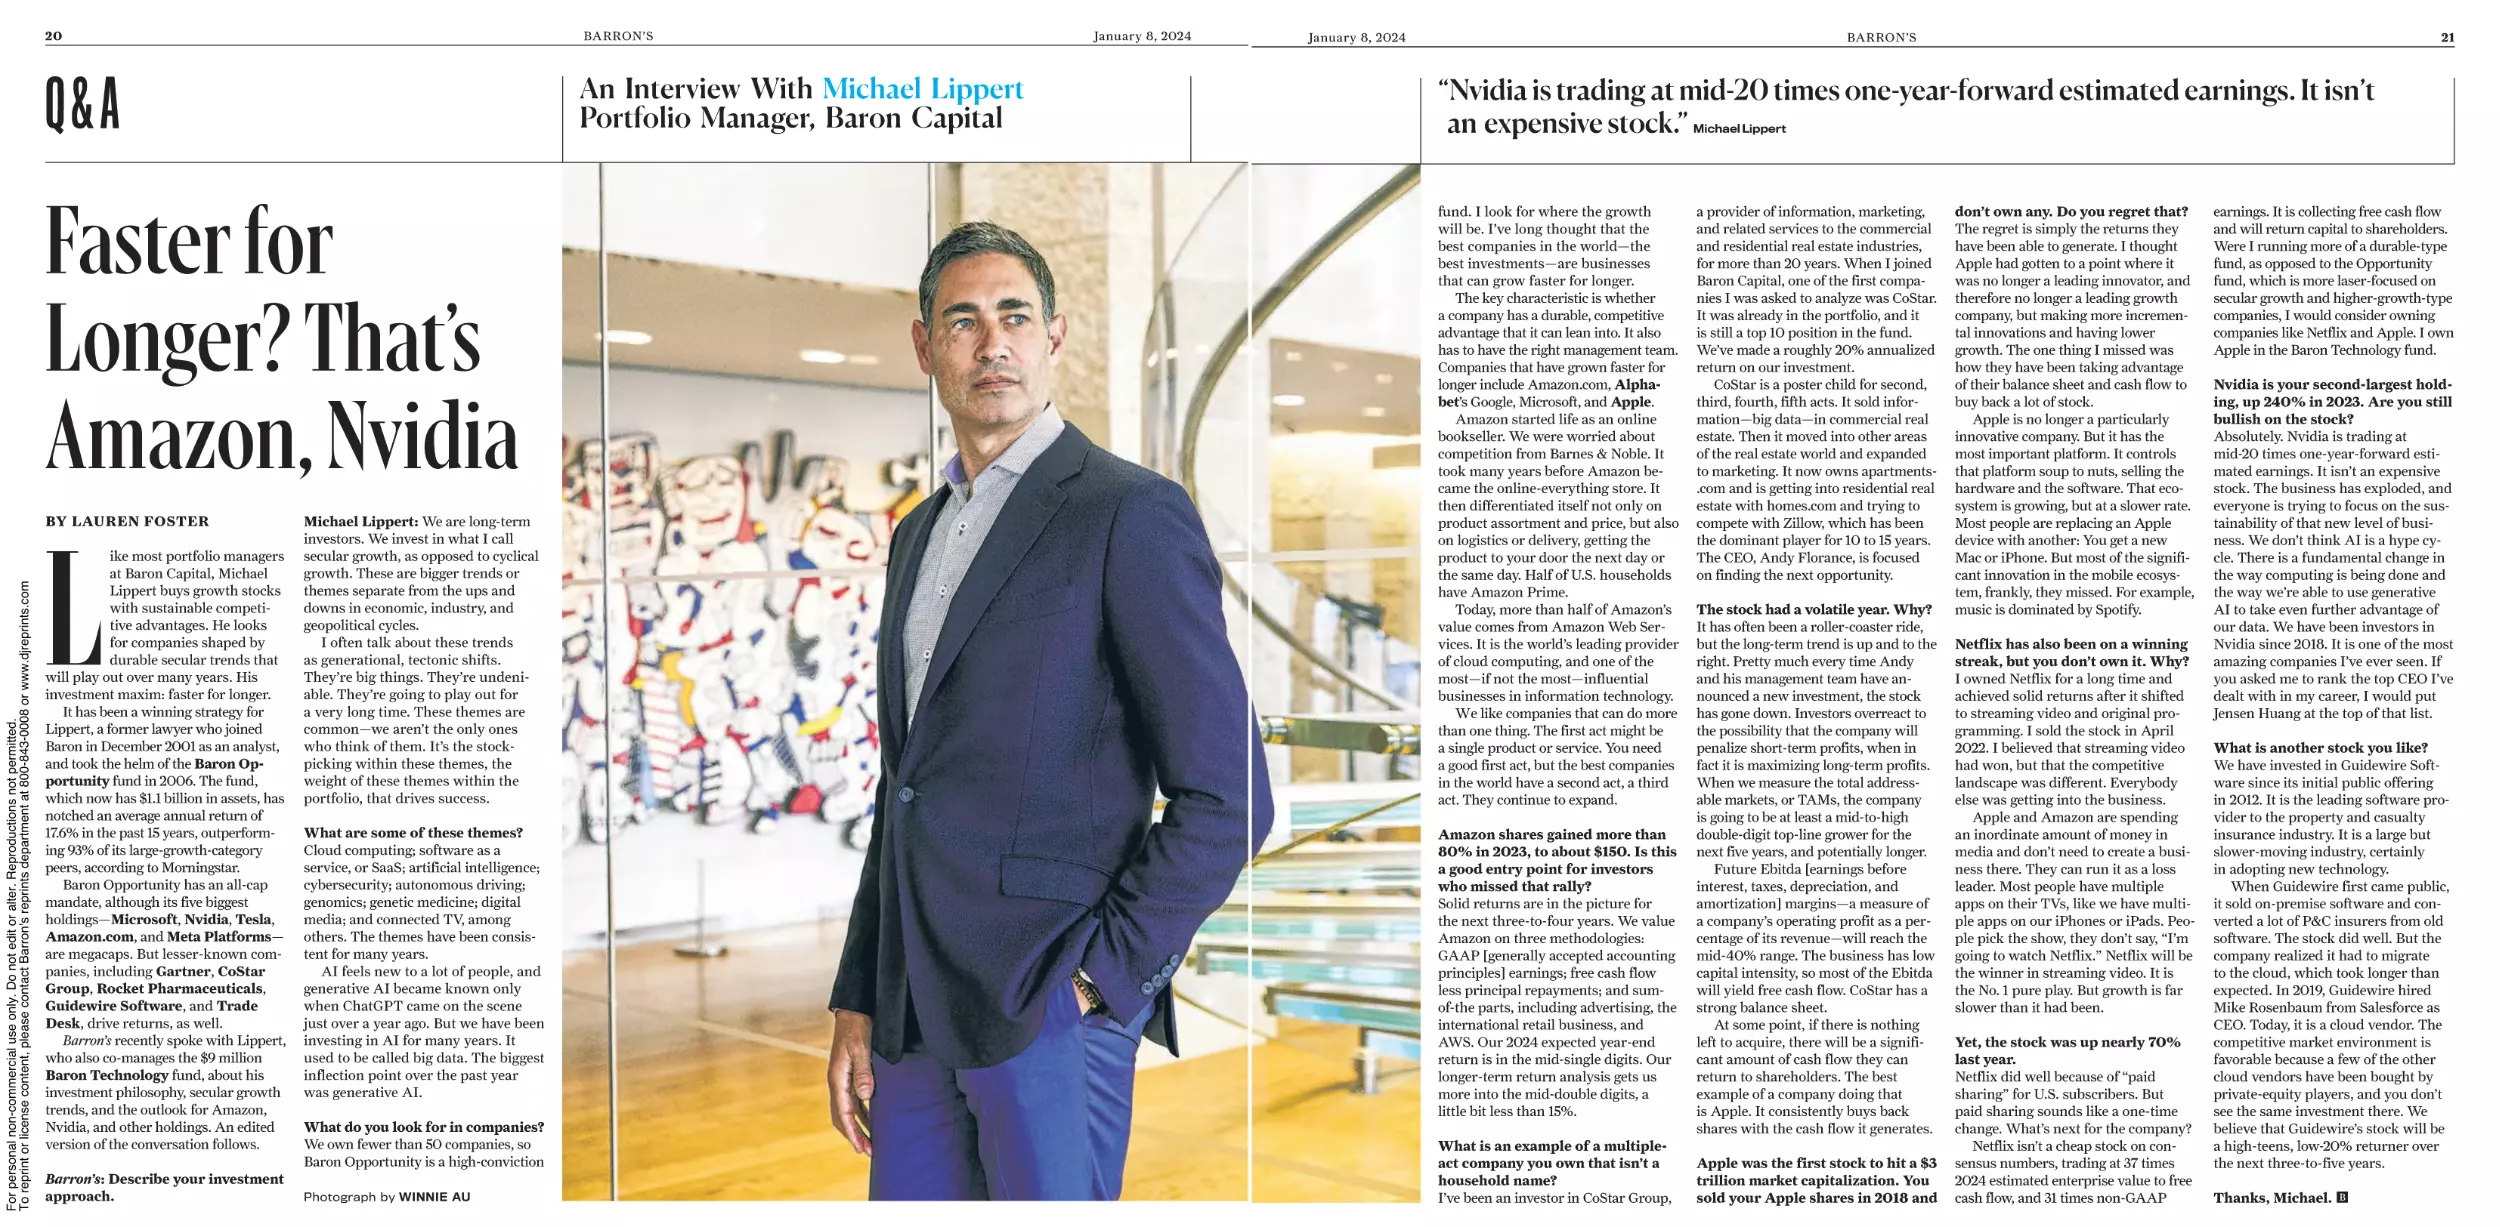
Q&A: Baron Capital fund manager
Michael Lippert looks for growth
stocks tied into durable trends
such as cybersecurity, genomics,
and AI. Why he soured on Apple.
By LAUREN FOSTER
Up & Down Wall Street:
A Dilemma for the Fed
By RANDALL W. FORSYTH
P. 22
Economy: The Limits
of Artificial Intelligence
Don’t count on AI to boost GDP.
By BRIAN SWINT
P. 9
Illustration by
Matt Chinworth
P. 20
The Best Companies
Grow Faster for Longer
P. 7
© 2024 Dow Jones & Company,
Inc. All Rights Reserved.
Our newspapers are 100% sourced
from sustainable certified mills.
BARRON’S (USPS 044-700) (ISSN
1077-8039) Published every
Monday. Editorial and Publication
Headquarters: 1211 Avenue of
the Americas, New York, N.Y.
10036. Periodicals postage paid at
Chicopee, MA and other mailing
offices. Postmaster: Send
address changes to Barron’s, 200
Burnett Rd., Chicopee, MA 01020
Streetwise: Two Names
That Could Gain 20%
Verizon and Truist Financial look
tempting, despite their flaws.
P. 23
Income: Cast a Wider
Net for Dividends
The appeal of international stocks.
By JACK HOUGH
By LAWRENCE C. STRAUSS
P. 15
P. 24
Follow-Up: Is Tesla
Stock a Buy or Sell?
By AL ROOT
Tech Trader: A Preview
of CES 2024
By ERIC J. SAVITZ
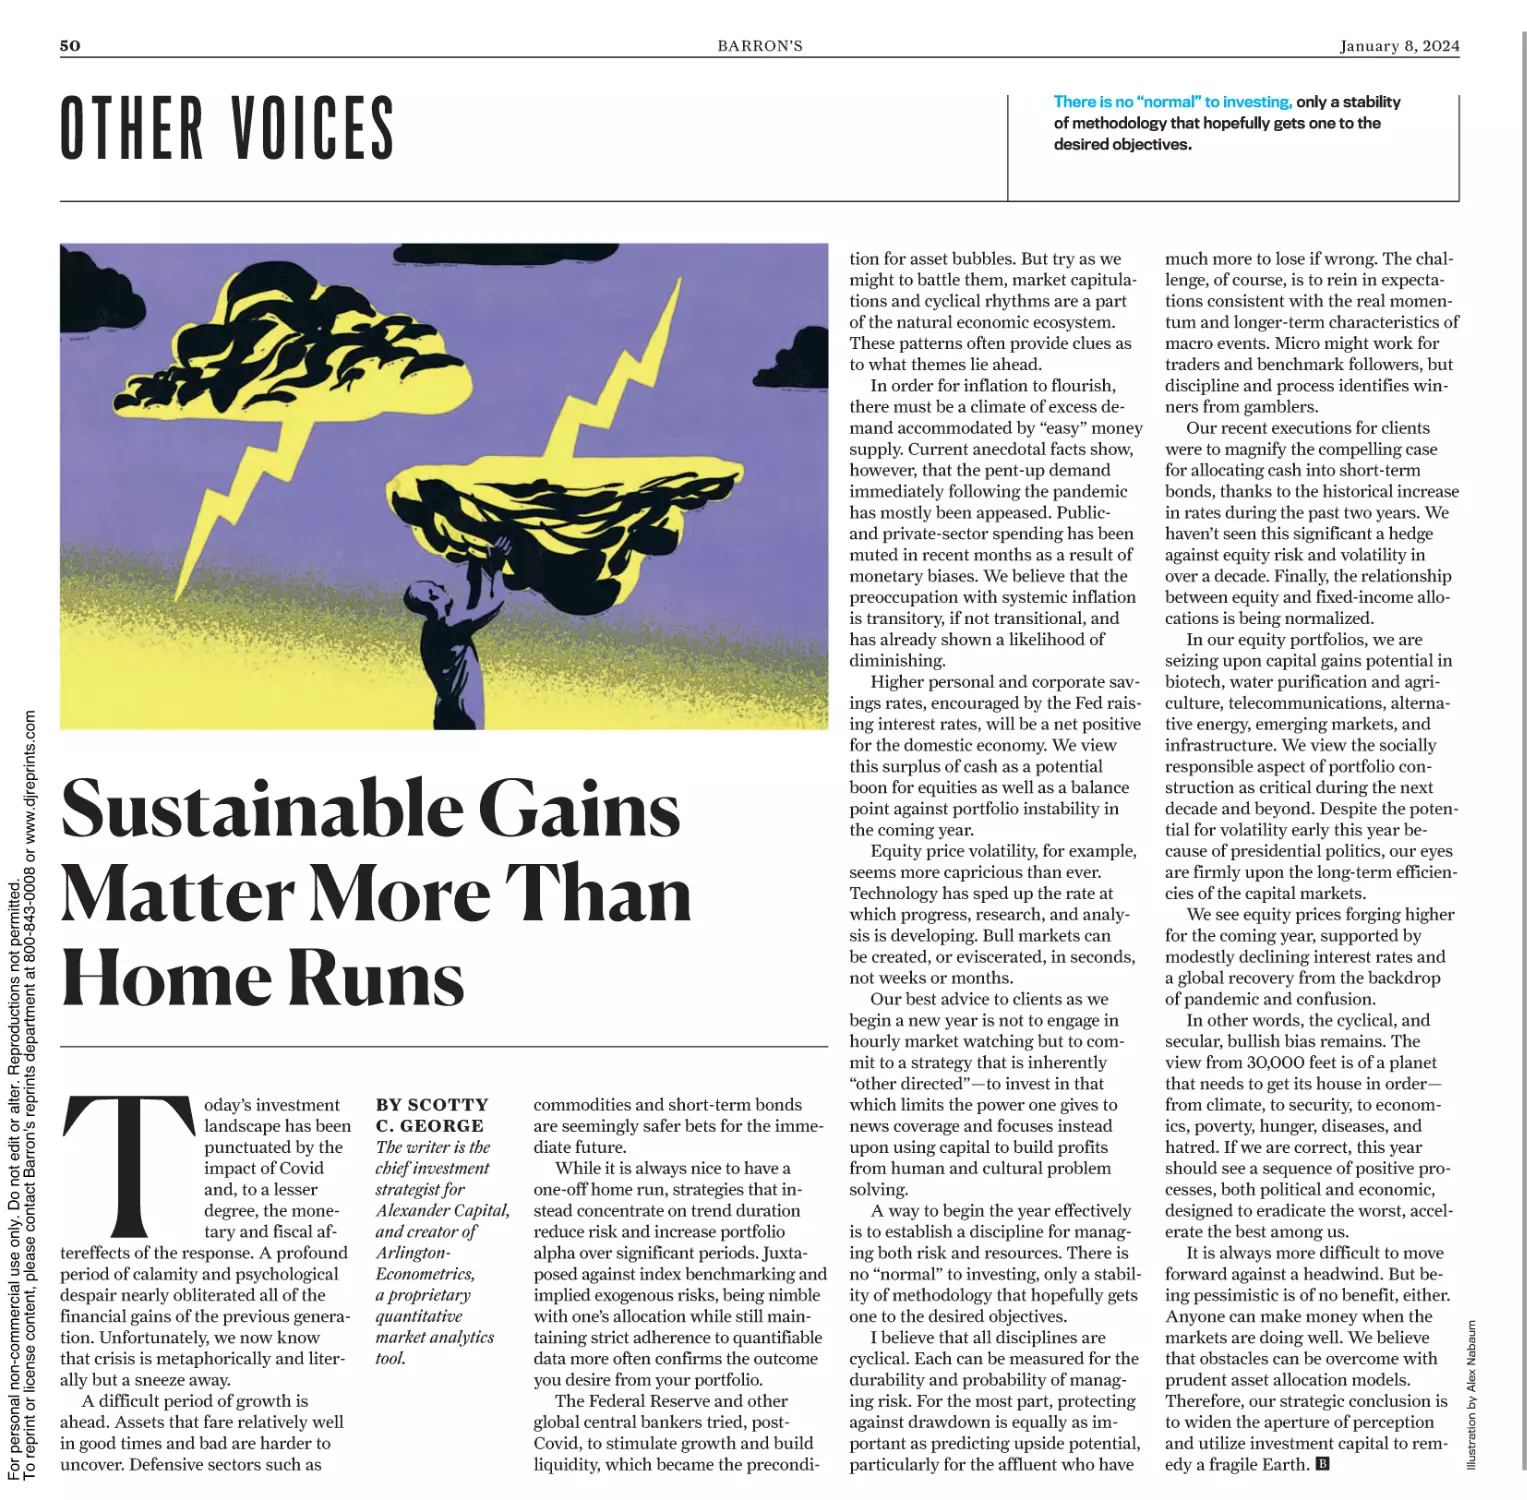
Other Voices: Alexander Capital’s
chief strategist is leaning into
socially responsible investments in
biotech, renewables, and more.
By SCOTTY C. GEORGE
Barron’s Roundtable
on Fox Business
Watch our TV show Fridays at
7:30 p.m. ET, and Saturdays and
Sundays at 9:30 a.m. and 10:30
a.m. This week, Invesco strategist
Brian Levitt on what’s needed to
sustain the economy and market.
Plus, a look at what’s behind the
rocky start to 2024 for Apple.
Index
P. 4
Charting the Market P. 32
Review & Preview P. 10
Winners and Losers P. 33
Mailbag
P. 51
Market View
P. 34
Inside Scoop
P. 31
Market Data
P. 35
Illustration by Alberto Miranda
For personal non-commercial use only. Do not edit or alter. Reproductions not permitted.
To reprint or license content, please contact Barron's reprints department at 800-843-0008 or www.djreprints.com
VOL.CIV NO.2
January 8, 2024
3
BARRON’S
For personal non-commercial use only. Do not edit or alter. Reproductions not permitted.
To reprint or license content, please contact Barron's reprints department at 800-843-0008 or www.djreprints.com
nuveen.com/income
It’s time to diversify
your income
Explore opportunities for portfolio growth and income
generation, even if that means looking in unexpected areas.
Delivering income
for 125 years1
Top 5 manager of U.S.
institutional tax-exempt assets2
#1 third-party manager of
assets in municipal separately
managed accounts3
1 Nuveen traces its history back to 1898 and TIAA was founded in 1918 2 Pensions & Investments, 12 Jun 2023. Rankings based on active U.S. bonds, U.S. institutional tax-exempt assets under management as of 31 Dec 2022 reported by each responding asset
manager; updated annually. 3 Cerulli Associates, The Cerulli Report, U.S. Managed Accounts 2023. Data as of 31 Dec 2022, updated annually; most recent data available. All asset manager data based on total assets, which includes proprietary program assets,
but does not include model separate accounts.
Investing involves risk; loss of principal is possible.
Nuveen, LLC provides investment solutions through its investment specialists.
GAD-3220739PR-W1123X
921195
4
I N D EX
A Abercrombie & Fitch . . . . . . . . . . . . . . . . . . . . . . 12
Advanced Micro Devices . . . . . . . . . . . . . . . . . . . 24
Albemarle . . . . . . . . . . . . . . . . . . . . . . . . . . . . . . . . . 29
Alphabet . . . . . . . . . . . . . . . . . . . . . . . . . . . . 21,24,L4
Amazon.com . . . . . . . . . . . . . . . . . . . . . . . . . 20,24,L4
Ambarella . . . . . . . . . . . . . . . . . . . . . . . . . . . . . . . . . 24
American Eagle Outfitters . . . . . . . . . . . . . . . . . 12
American Electric Power . . . . . . . . . . . . . . . . . . 18
American Funds American Balanced . . . . . . L3
American Funds 2035 Target Date Ret . . . . L4
A.P. Moeller-Maersk . . . . . . . . . . . . . . . . . . . . . . . 10
Apple . . . . . . . . . . . . . . . . . . . . . . . . . . . . . 21,24,26,32
Arm Holdings . . . . . . . . . . . . . . . . . . . . . . . . . . . . . 24
ASML Holding . . . . . . . . . . . . . . . . . . . . . . . . . . 10,32
Astellas Pharma . . . . . . . . . . . . . . . . . . . . . . . . . . . 23
Atlanta Braves Holdings . . . . . . . . . . . . . . . . . . . 11
AT&T . . . . . . . . . . . . . . . . . . . . . . . . . . . . . . . . . . . . . . 9
BARRON’S
Our index lists significant companies mentioned in stories and columns,
plus Research Reports, and Corrections & Amplifications. The references
are to the first page of the item in which the company is mentioned.
Intel . . . . . . . . . . . . . . . . . . . . . . . . . . . . . . . . . . . . . . . 24
iShares Core Growth Allocation . . . . . . . . . . . L3
J JOYY . . . . . . . . . . . . . . . . . . . . . . . . . . . . . . . . . . . . . . 10
JPMorgan Chase . . . . . . . . . . . . . . . . . . . . . . . . 10,28
K KeyCorp . . . . . . . . . . . . . . . . . . . . . . . . . . . . . . . . . . . 28
Kia . . . . . . . . . . . . . . . . . . . . . . . . . . . . . . . . . . . . . . . . 24
L Legrand . . . . . . . . . . . . . . . . . . . . . . . . . . . . . . . . . . . 23
For personal non-commercial use only. Do not edit or alter. Reproductions not permitted.
To reprint or license content, please contact Barron's reprints department at 800-843-0008 or www.djreprints.com
E Eaton . . . . . . . . . . . . . . . . . . . . . . . . . . . . . . . . . . . . . . 17
Eaton Vance Global Income Builder . . . . . . . L4
Elevance Health . . . . . . . . . . . . . . . . . . . . . . . . . . . 24
F FedEx . . . . . . . . . . . . . . . . . . . . . . . . . . . . . . . . . . . . . 31
Fidelity Multi-Asset Income . . . . . . . . . . . . . . . L3
Fidelity Puritan . . . . . . . . . . . . . . . . . . . . . . . . . . . L3
First Eagle Global . . . . . . . . . . . . . . . . . . . . . . . . L4
First Quantum Minerals . . . . . . . . . . . . . . . . . . . 10
First Republic Bank . . . . . . . . . . . . . . . . . . . . . . . 28
First Solar . . . . . . . . . . . . . . . . . . . . . . . . . . . . . . . . . 18
FPA Crescent . . . . . . . . . . . . . . . . . . . . . . . . . . . . . L3
Lenovo Group . . . . . . . . . . . . . . . . . . . . . . . . . . . . . 24
Leuthold Core Investment . . . . . . . . . . . . . . . . L2
Loomis Sayles Global Allocation . . . . . . . . . . . L4
L'Oreal . . . . . . . . . . . . . . . . . . . . . . . . . . . . . . . . . . . . 24
MIPS . . . . . . . . . . . . . . . . . . . . . . . . . . . . . . . . . . . . . . 24
Mitsubishi UFJ Financial Group . . . . . . . . . . L4
Mobileye Global . . . . . . . . . . . . . . . . . . . . . . . . . . . 32
Moderna . . . . . . . . . . . . . . . . . . . . . . . . . . . . . . . . . . . 32
M McDonald's . . . . . . . . . . . . . . . . . . . . . . . . . . . . . . . . 22
Medical Properties Trust . . . . . . . . . . . . . . . . . . 32
Medtronic . . . . . . . . . . . . . . . . . . . . . . . . . . . . . . . . . 11
Meta Platforms . . . . . . . . . . . . . . . . . . . . . . 12,20,24
Microsoft . . . . . . . . . . . . . . . . . . . . . . . 10,20,22,24,L4
N Netflix . . . . . . . . . . . . . . . . . . . . . . . . . . . . . . . . . . . . . 21
NextEra Energy . . . . . . . . . . . . . . . . . . . . . . . . . . . 18
Nucor . . . . . . . . . . . . . . . . . . . . . . . . . . . . . . . . . . . . . 15
Nvidia . . . . . . . . . . . . . . . . . . . . . . . . . . 10,12,20,22,24
Lachlan Murdoch, Executive Chairman, News Corp
Rupert Murdoch, Chairman Emeritus, News Corp
Robert Thomson, CEO, News Corp Almar Latour, CEO, Dow Jones
EXECUTIVE VICE PRESIDENT AND GENERAL MANAGER
EDITOR IN CHIEF
EXECUTIVE EDITOR
D Dell Technologies . . . . . . . . . . . . . . . . . . . . . . . . . . 24
Douglas Emmett . . . . . . . . . . . . . . . . . . . . . . . . . . L3
Dyne Therapeutics . . . . . . . . . . . . . . . . . . . . . . . . 32
For Customer Service, call 1 (800) 544-0422, or go to
customercenter.barrons.com. For reprints of articles,
call 1 (800) 843-0008, or go to djreprints.com.
O Omega Therapeutics . . . . . . . . . . . . . . . . . . . . . . . 32
ON Semiconductor . . . . . . . . . . . . . . . . . . . . . . . . . 24
B Baidu . . . . . . . . . . . . . . . . . . . . . . . . . . . . . . . . . . . . . . 10
Bank of America . . . . . . . . . . . . . . . . . . . . . . . . 10,28
Barrick Gold . . . . . . . . . . . . . . . . . . . . . . . . . . . . . . . 10
BlackRock Managed Income . . . . . . . . . . . . . . L3
Bloomin’ Brands . . . . . . . . . . . . . . . . . . . . . . . . . . . 31
BMW . . . . . . . . . . . . . . . . . . . . . . . . . . . . . . . . . . . . . . 24
BYD . . . . . . . . . . . . . . . . . . . . . . . . . . . . . . . . . . . . 10,15
C Capital Group Core Balanced . . . . . . . . . . . . . . L3
Citigroup . . . . . . . . . . . . . . . . . . . . . . . . . . . . . . . 10,28
Cleveland-Cliffs . . . . . . . . . . . . . . . . . . . . . . . . . . . . 15
Columbia Thermostat . . . . . . . . . . . . . . . . . . . . . L4
Conagra Brands . . . . . . . . . . . . . . . . . . . . . . . . . . . . 9
CoStar Group . . . . . . . . . . . . . . . . . . . . . . . . . . . . . . 20
Crown Castle . . . . . . . . . . . . . . . . . . . . . . . . . . . . . . 31
January 8, 2024
Bob Rose
David Cho
SENIOR MANAGING EDITOR
DEPUTY EDITORS
Dan Shar
Lauren R. Rublin
Alex Eule, Ben Levisohn
Phil Roosevelt
EDITORIAL DIRECTOR, MAGAZINE
EDITOR AT LARGE
MANAGING EDITORS
Andy Serwer
Kristen Bellstrom, Matt Bemer, Daren Fonda, Amey Stone, Joe Woelfel
Henry Cutter, Mel Gray, Anita Hamilton, Mary Romano,
Robert Sabat, Rupert Steiner (London bureau chief)
ASSISTANT MANAGING EDITORS
ASSOCIATE EDITORS
Andrew Bary, Randall W. Forsyth, Jack Hough, Reshma Kapadia, Eric J. Savitz
SENIOR WRITERS
Bill Alpert, Lauren Foster, Nicholas Jasinski, Tae Kim, Megan Leonhardt,
Joe Light, Elizabeth O’Brien, Al Root, Avi Salzman
Jacob Adelman, Janet H. Cho, Adam Clark, Emily Dattilo, Jack Denton, Catherine Dunn,
Carleton English, Sabrina Escobar, Callum Keown, Evie Liu, Shaina Mishkin, Josh Nathan-Kazis,
Angela Palumbo, Teresa Rivas, Connor Smith, Jacob Sonenshine, Brian Swint, Karishma Vanjani, Andrew Welsch
STORY EDITORS
Ed Lin, Erin McCarthy, Liz Moyer, Patrick O’Donnell, Stacy Ozol,
Ross Snel, Neal Templin, J.J. Thompson
Michael J. Burlingham, Robert Teitelman
COPY DESK
IDEAS EDITOR
I Iberdrola . . . . . . . . . . . . . . . . . . . . . . . . . . . . . . . . . . 10
Infineon Technologies . . . . . . . . . . . . . . . . . . . . . . 24
R Regis . . . . . . . . . . . . . . . . . . . . . . . . . . . . . . . . . . . . . . 31
RELX . . . . . . . . . . . . . . . . . . . . . . . . . . . . . . . . . . . . . 23
Rivian Automotive . . . . . . . . . . . . . . . . . . . . . . . . . 32
Rocket Pharmaceuticals . . . . . . . . . . . . . . . . . . . . 20
S Samsung Electronics . . . . . . . . . . . . . . . . . . . . . . . 24
Signature Bank . . . . . . . . . . . . . . . . . . . . . . . . . . . . 28
Silicon Laboratories . . . . . . . . . . . . . . . . . . . . . . . 24
SilverBow Resources . . . . . . . . . . . . . . . . . . . . . . 31
Sociedad Quimica y Minera De Chile . . . . . . . 29
SoFi Technologies . . . . . . . . . . . . . . . . . . . . . . . . . 32
Sony Group . . . . . . . . . . . . . . . . . . . . . . . . . . . . . . . . 24
Stellantis . . . . . . . . . . . . . . . . . . . . . . . . . . . . . . . . . . 24
Synaptics . . . . . . . . . . . . . . . . . . . . . . . . . . . . . . . . . . 24
SENIOR AUDIO MANAGER
Zoe Szathmary
Mette Lützhøft
Robert Cushing, Nick Devor, Clare McKeen
DIGITAL PRODUCERS
Chelsea Schiff
Lynne Carty, Shayanne Gal, Nick Hallam, Sue Ng
Sarina Finkelstein PHOTO EDITORS Alis Atwell, Halie Chavez, Nicole Silver
ART DIRECTORS
DIRECTOR OF PHOTOGRAPHY
RESEARCHER
STATISTICS MANAGER
T TCL Technology Group . . . . . . . . . . . . . . . . . . . . 24
Tesla . . . . . . . . . . . . . . . . . . . . . . . . . . . . . . 10,17,20,24
Tokio Marine Holdings . . . . . . . . . . . . . . . . . . . . L4
Trade Desk . . . . . . . . . . . . . . . . . . . . . . . . . . . . . . . . 20
T. Rowe Price Global Allocation . . . . . . . . . . . L4
T. Rowe Price Retirement . . . . . . . . . . . . . . . . . L4
Truist Financial . . . . . . . . . . . . . . . . . . . . . . . . . . . . . 9
Matt Peterson
DEPUTY DIGITAL MANAGING EDITOR
Dan Lam
Michael T. Kokoszka
STATISTICIAN
Darren Chima
James H. Balmer
NEWS editors@barrons.com STATISTICS barronsstats@barrons.com CUSTOMER SERVICE 800-544-0422
ADVERTISING SERVICES MANAGER
H HD Hyundai . . . . . . . . . . . . . . . . . . . . . . . . . . . . . . . 24
Heineken Holding . . . . . . . . . . . . . . . . . . . . . . . . . L3
Honda Motor . . . . . . . . . . . . . . . . . . . . . . . . . . . . . . 24
HP . . . . . . . . . . . . . . . . . . . . . . . . . . . . . . . . . . . . . . . . 24
Hundredfold Select Alternative . . . . . . . . . . . . L4
Q Qualcomm . . . . . . . . . . . . . . . . . . . . . . . . . . . . . . . . . 24
QuantumScape . . . . . . . . . . . . . . . . . . . . . . . . . . . . . 32
REPORTERS
HEAD OF VISUALS
G Gartner . . . . . . . . . . . . . . . . . . . . . . . . . . . . . . . . . . . . 20
General Motors . . . . . . . . . . . . . . . . . . . . . . . . . . . . 24
Goldman Sachs Group . . . . . . . . . . . . . . . . . . . . . 28
Goodyear Tire & Rubber . . . . . . . . . . . . . . . . . . 31
Grayscale Bitcoin Trust . . . . . . . . . . . . . . . . . . . . 10
Guidewire Software . . . . . . . . . . . . . . . . . . . . . . . . 20
P Palantir . . . . . . . . . . . . . . . . . . . . . . . . . . . . . . . . . . . . 22
Peloton Interactive . . . . . . . . . . . . . . . . . . . . . . . . 32
PENN Entertainment . . . . . . . . . . . . . . . . . . . . . 31
PNM Resources . . . . . . . . . . . . . . . . . . . . . . . . . . . 10
GLOBAL HEAD, WEALTH & ASSET MANAGEMENT
Jack Otter
Barron’s is a trademark of Dow Jones and its affiliates. Barron’s (USPS 044-700) (ISSN 1077-8039) Published every Monday. Editorial and Publication
Headquarters: 1211 Avenue of the Americas, New York, N.Y. 10036. Periodicals postage paid at Chicopee, MA and other mailing offices. Regular U.S.
subscription rate: one year, $359.88. Entire editorial content of this publication copyrighted by Dow Jones & Co., Inc. and must not be reproduced in whole
or in part without special permission. Unsolicited manuscripts should be accompanied by self-addressed envelope with proper postage. All advertising
published in Barron’s is subject to the applicable rate card, copies of which are available from the Advertising Director, 1211 Avenue of the Americas, New
York, N.Y. 10036. Barron’s reserves the right not to accept an advertiser’s order. Only publication of an advertisement shall constitute acceptance of the advertiser's
order. Postmaster: Send address changes to Barron’s, 200 Burnett Rd., Chicopee, MA 01020.
U Unilever . . . . . . . . . . . . . . . . . . . . . . . . . . . . . . . . . . L4
Urban Outfitters . . . . . . . . . . . . . . . . . . . . . . . . . . . 12
V Vanguard Balanced Index . . . . . . . . . . . . . . . . . L2
Vanguard Global Wellington . . . . . . . . . . . . . . . L4
Vanguard Wellington . . . . . . . . . . . . . . . . . . . . . . L3
Vanguard Wellesley Income . . . . . . . . . . . . . . . L3
Verizon Communications . . . . . . . . . . . . . . . . . . . . 9
Victory Cornerstone Conservative . . . . . . . . . L3
VinFast Auto . . . . . . . . . . . . . . . . . . . . . . . . . . . . . . 24
Volkswagen . . . . . . . . . . . . . . . . . . . . . . . . . . . . . . . . 24
W Walgreens Boots Alliance . . . . . . . . . . . . . . . . . . 32
Walmart . . . . . . . . . . . . . . . . . . . . . . . . . . . . . . . . . 9,24
Walt Disney . . . . . . . . . . . . . . . . . . . . . . . . . . 10,27,31
Webster Financial . . . . . . . . . . . . . . . . . . . . . . . . . 28
Wells Fargo . . . . . . . . . . . . . . . . . . . . . . . . . . . . . 10,28
January 8, 2024
5
BARRON’S
The best choice
is the one that gives you
For personal non-commercial use only. Do not edit or alter. Reproductions not permitted.
To reprint or license content, please contact Barron's reprints department at 800-843-0008 or www.djreprints.com
choices.
At Schwab you can expect full-service wealth management and advice when you need it.
Plus, investing, trading, and banking. And now that Ameritrade is part of Schwab,
we’re proud to offer a new and improved trading experience, featuring thinkorswim®.
Giving you better choices and more ways to manage your wealth.
Ranked #1
Most Trusted Bank
Ranked #1 in
Investor Satisfaction
with Full-Service
Wealth Management
Firms
Investing | Trading | Advice | Banking
Schwab.com/whyschwab
Charles Schwab received the highest score in the J.D. Power 2023 U.S. Full-Service Investor Satisfaction Study, which measures investor
satisfaction with full-service investment firms. Visit jdpower.com/awards for more details. The J.D. Power 2023 U.S. Full-Service Investor
Satisfaction Study is independently conducted, and the participating firms do not pay to participate. Use of study results in promotional materials
is subject to a license fee.
The IBD Most Trusted Bank award was given to Charles Schwab Bank on September 25, 2023, and expires December 31, 2024. The criteria, evaluation,
and ranking were determined by Investor’s Business Daily. Schwab paid a licensing fee to York Graphic Services, LLC. for the use of the award and logos.
Brokerage Products: Not FDIC Insured • No Bank Guarantee • May Lose Value
Investing involves risk, including loss of principal. The Charles Schwab Corporation provides a full range of brokerage, banking and financial advisory services through its operating subsidiaries.
Its broker-dealer subsidiaries, Charles Schwab & Co. Inc. (Member SIPC), and its affiliates offer investment services and products. Its banking subsidiary, Charles Schwab Bank, SSB (member
FDIC and an Equal Housing Lender), provides deposit and lending services and products.
© 2024 Charles Schwab & Co, Inc. All rights reserved. Member SIPC. (1023-3386) ADP121818-00
6
BARRON’S
January 8, 2024
If your business accepted Visa and/or Mastercard
between 2004 - 2019, you’re now eligible to claim
your share of a $5.5 billion Settlement.
Claim your share now.
Merchants (business owners) who accepted Visa and/or Mastercard at any time from January 1, 2004, to
January 25, 2019, are eligible to claim their share of a $5.5 billion Settlement.
Visa and Mastercard and their issuing banks (the “Defendants”) are alleged to have violated the law because they
wrongfully inflated Interchange Fees. Defendants say they have done nothing wrong. They claim their business
practices are legal.
For personal non-commercial use only. Do not edit or alter. Reproductions not permitted.
To reprint or license content, please contact Barron's reprints department at 800-843-0008 or www.djreprints.com
After years of appeals, the Settlement is now final, and Claim Forms are now being accepted. If you do not file a claim,
you will not receive a Settlement Payment.
Claim Forms are now being mailed to more than 15 million merchants. Even if you do not receive a Claim Form in the
mail, you may still be eligible, and you should visit www.PaymentCardSettlement.com to get more information about
the Settlement. The deadline to file a claim is May 31, 2024. You can file your claim online at the website. Or, if you
prefer, you can get a paper Claim Form at the website or by calling 1-800-625-6440. Assistance with preparing your
claim is available at no cost to you from the Class Administrator and Class Counsel.
Submitting your claim online can take less than five minutes.
STEP ONE:
Scan the QR code to go to
www.PaymentCardSettlement.com.
To get a Claim Form in Spanish
Chinese
, or Thai
STEP TWO:
Provide the information
requested about your business.
STEP THREE:
Submit your claim! Your claim
process is now complete.
, Russian
, Korean
, Vietnamese
, please visit www.PaymentCardSettlement.com.
Do you need additional
help or information?
, Japanese
,
Visit Online:
www.PaymentCardSettlement.com
Email:
info@PaymentCardSettlement.com
Call:
1-800-625-6440
January 8, 2024
UP & DOWN WALL STREET
T
Jeenah Moon/Bloomberg
For personal non-commercial use only. Do not edit or alter. Reproductions not permitted.
To reprint or license content, please contact Barron's reprints department at 800-843-0008 or www.djreprints.com
The Markets See
March Rate Cuts. The
Jobs Numbers Don’t.
he stock market has
predicted nine of
the past five recessions, the late economist Paul Samuelson famously
quipped. Is the futures market now erring similarly by
pricing in six of the next three Federal
Reserve interest-rate cuts?
Federal-funds futures settled Friday
at levels consistent with a 3.75% to 4%
target range for the central bank’s key
policy interest rate by December, according to the CME FedWatch site.
That is consistent with the median
expectation of the Federal Open Market Committee’s Summary of Economic Projections, but for the end of
2025. For this coming December, the
most recent projection from Chairman
Jerome Powell and the rest of the panel
released last month had a median projection implying three reductions of
one-quarter percentage point, from the
current target range of 5.25% to 5.5%.
The futures market further expects
the first cut to come just after the vernal equinox at the conclusion of the
March 19-20 FOMC meeting. No move
is expected at the confab at the end of
this month, but the market is all agog
about the spring.
The notion that the Fed will begin to
reverse monetary tightening is based
on the hypothesis that inflation is slowing toward its 2% target while the
economy’s strength is waning, especially as reflected by the labor market.
While the pace of price increases
has indeed decelerated, monetary policy’s impact on aggregate demand arguably has been less than the loosening of
7
BARRON’S
BY RANDALL
W. FORSYTH
supply constraints and the easing in
energy prices. The labor market, if anything, shows signs of tightness with
upward pressures on wages.
The employment report for December, released on Friday, provided grist
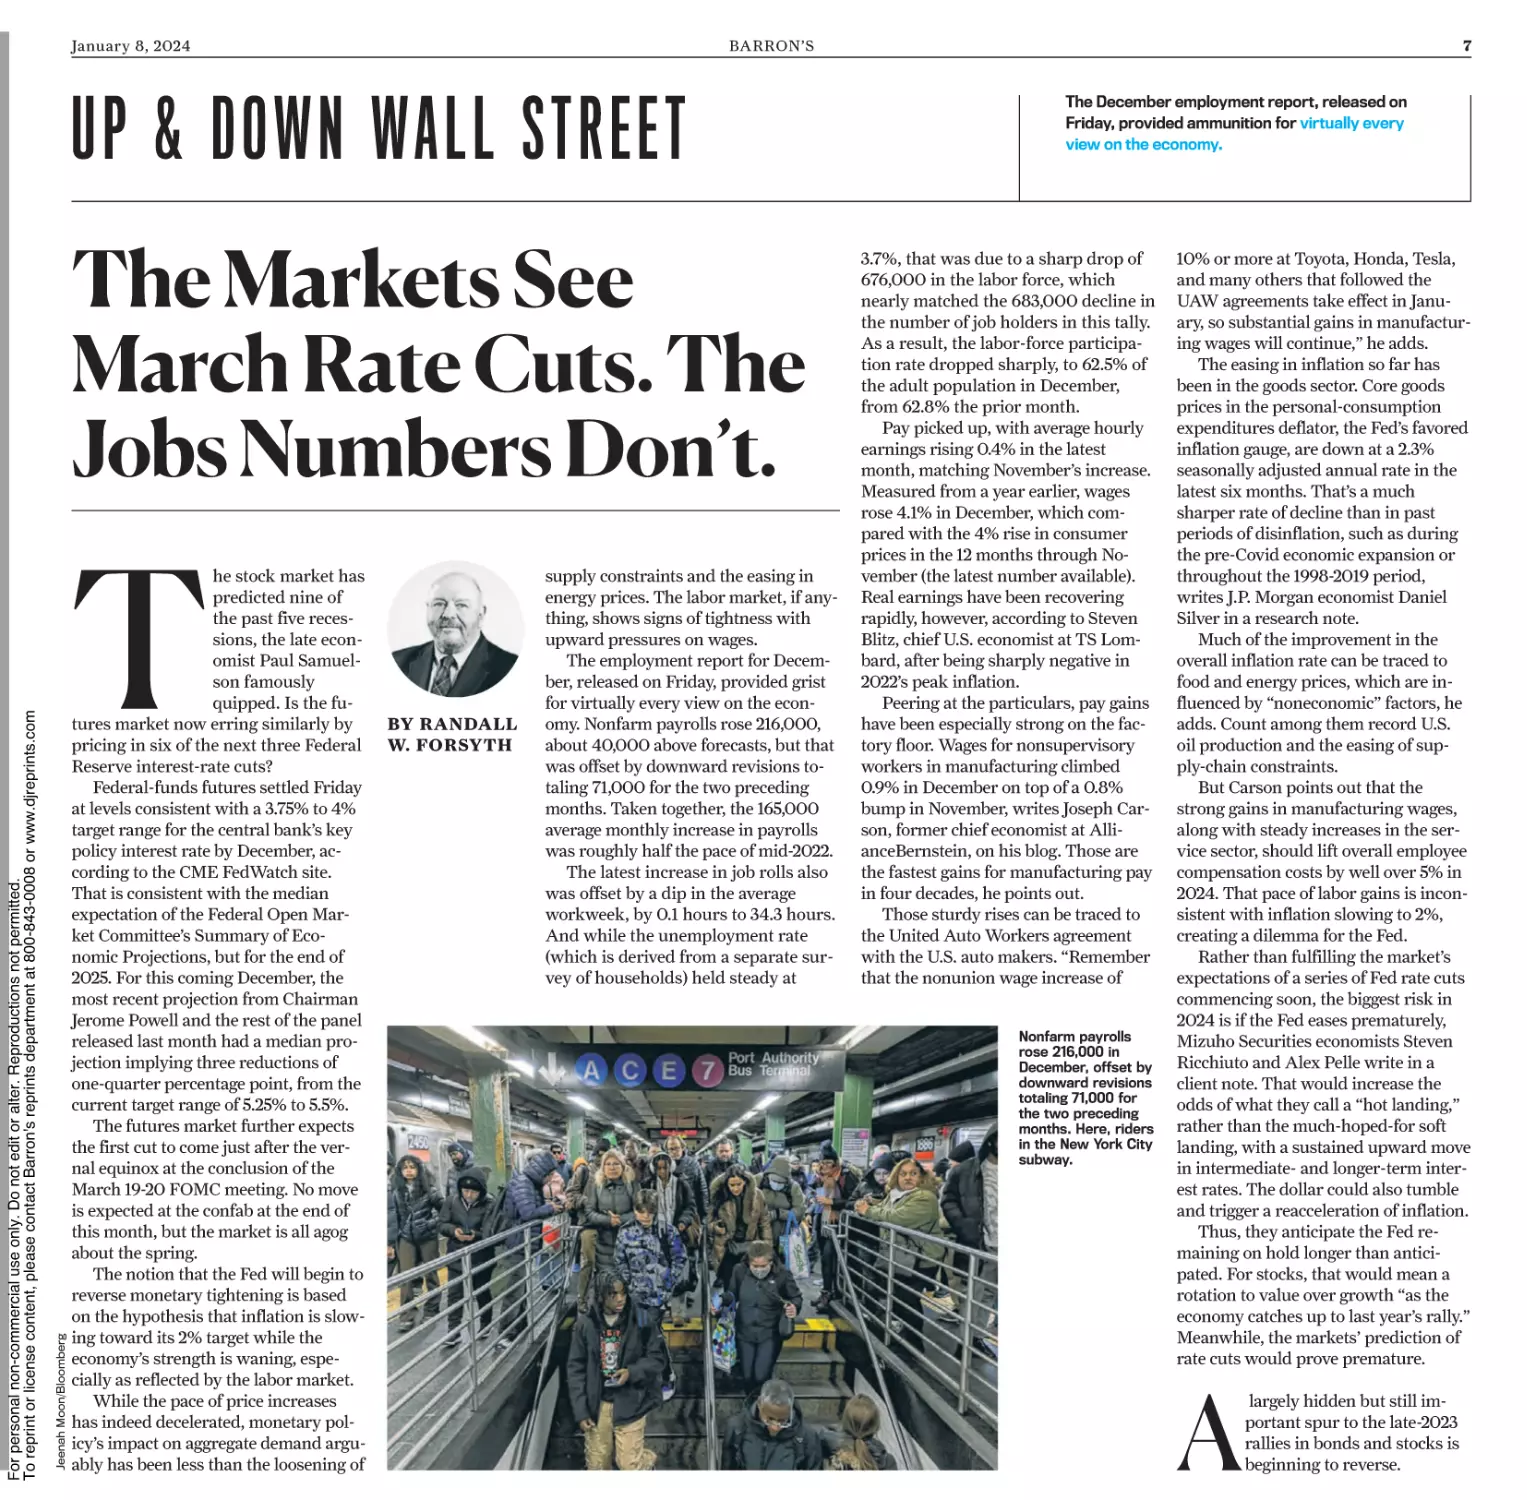
for virtually every view on the economy. Nonfarm payrolls rose 216,000,
about 40,000 above forecasts, but that
was offset by downward revisions totaling 71,000 for the two preceding
months. Taken together, the 165,000
average monthly increase in payrolls
was roughly half the pace of mid-2022.
The latest increase in job rolls also
was offset by a dip in the average
workweek, by 0.1 hours to 34.3 hours.
And while the unemployment rate
(which is derived from a separate survey of households) held steady at
The December employment report, released on
Friday, provided ammunition for virtually every
view on the economy.
3.7%, that was due to a sharp drop of
676,000 in the labor force, which
nearly matched the 683,000 decline in
the number of job holders in this tally.
As a result, the labor-force participation rate dropped sharply, to 62.5% of
the adult population in December,
from 62.8% the prior month.
Pay picked up, with average hourly
earnings rising 0.4% in the latest
month, matching November’s increase.
Measured from a year earlier, wages
rose 4.1% in December, which compared with the 4% rise in consumer
prices in the 12 months through November (the latest number available).
Real earnings have been recovering
rapidly, however, according to Steven
Blitz, chief U.S. economist at TS Lombard, after being sharply negative in
2022’s peak inflation.
Peering at the particulars, pay gains
have been especially strong on the factory floor. Wages for nonsupervisory
workers in manufacturing climbed
0.9% in December on top of a 0.8%
bump in November, writes Joseph Carson, former chief economist at AllianceBernstein, on his blog. Those are
the fastest gains for manufacturing pay
in four decades, he points out.
Those sturdy rises can be traced to
the United Auto Workers agreement
with the U.S. auto makers. “Remember
that the nonunion wage increase of
Nonfarm payrolls
rose 216,000 in
December, offset by
downward revisions
totaling 71,000 for
the two preceding
months. Here, riders
in the New York City
subway.
10% or more at Toyota, Honda, Tesla,
and many others that followed the
UAW agreements take effect in January, so substantial gains in manufacturing wages will continue,” he adds.
The easing in inflation so far has
been in the goods sector. Core goods
prices in the personal-consumption
expenditures deflator, the Fed’s favored
inflation gauge, are down at a 2.3%
seasonally adjusted annual rate in the
latest six months. That’s a much
sharper rate of decline than in past
periods of disinflation, such as during
the pre-Covid economic expansion or
throughout the 1998-2019 period,
writes J.P. Morgan economist Daniel
Silver in a research note.
Much of the improvement in the
overall inflation rate can be traced to
food and energy prices, which are influenced by “noneconomic” factors, he
adds. Count among them record U.S.
oil production and the easing of supply-chain constraints.
But Carson points out that the
strong gains in manufacturing wages,
along with steady increases in the service sector, should lift overall employee
compensation costs by well over 5% in
2024. That pace of labor gains is inconsistent with inflation slowing to 2%,
creating a dilemma for the Fed.
Rather than fulfilling the market’s
expectations of a series of Fed rate cuts
commencing soon, the biggest risk in
2024 is if the Fed eases prematurely,
Mizuho Securities economists Steven
Ricchiuto and Alex Pelle write in a
client note. That would increase the
odds of what they call a “hot landing,”
rather than the much-hoped-for soft
landing, with a sustained upward move
in intermediate- and longer-term interest rates. The dollar could also tumble
and trigger a reacceleration of inflation.
Thus, they anticipate the Fed remaining on hold longer than anticipated. For stocks, that would mean a
rotation to value over growth “as the
economy catches up to last year’s rally.”
Meanwhile, the markets’ prediction of
rate cuts would prove premature.
A
largely hidden but still important spur to the late-2023
rallies in bonds and stocks is
beginning to reverse.
8
BARRON’S
January 8, 2024
For personal non-commercial use only. Do not edit or alter. Reproductions not permitted.
To reprint or license content, please contact Barron's reprints department at 800-843-0008 or www.djreprints.com
Up & Down Wall Street (continued)
Finder,
Keepers.
Barron’s Advisor Finder matches Barron’s
ambitious readers with your financial expertise.
Get found, meet prospective clients, and let
Barron’s Advisor help grow your business.
Join Now
Barrons.com/AdvisorFinderApply
© 2023 Dow Jones & Company, Inc. All rights reserved. 2E287
While investors have been tracking every nuance in the rhetoric of Fed officials
from Powell on down, the impact of Treasury borrowing to finance the massive
federal deficit is largely out of the public’s
view. But it was a major force in the sharp
rise in bond yields and the resulting slump
in stocks late last summer and into the fall,
and an underappreciated factor in the rebounds of the debt and equity markets in
the last two months of the year.
It is rare that big market reversals can be
pinned on a single event, Strategas’ Washington policy team, led by Daniel Clifton,
wrote in a report over New Year’s. But Treasury’s decision in August to issue more longer-term debt for the first time in three years
led to a sharp tightening in financial conditions, reflected in the rise in bond yields and
the dollar, plus a slump in stocks.
That was reversed on Nov. 1, when the
Treasury trimmed its plans to issue more
long-term debt, a move abetted by Powell’s
acknowledgment that the Fed was likely
done raising short-term interest rates.
Remarkably, the federal debt has hit $34
trillion, an increase of $1 trillion just since
mid-September. The total is 120% of the size
of the U.S. economy. That’s at a time of full
employment and no declared war, circumstances that would suggest a balanced budget, or even a surplus—something last seen
in the early 2000s, after the dot-com boom.
Yet that massive tide of red ink, which
so spooked bond and stock markets back
in the dog days of summer, suddenly receded from the market’s mind. Arguably,
that was made possible by the Treasury’s
decision to shift borrowing to short-term
bills—and let’s recall that Treasury Secretary Janet Yellen, a former Fed chair, might
have some feel for the markets.
The actual money-market mechanics
that allowed Uncle Sam to borrow all that
dough in felicitous fashion are less interesting than that the aforementioned shift
not only halted stock and bond market
retreats but led to powerful year-end rallies—and that the turnaround came
roughly a year ahead of the 2024 presidential election, when easier financial conditions could have a salutary impact on the
economy. Only a cynic would think there
might be a connection.
But there are only so many times you
can use those techniques, observes George
Goncalves, who heads U.S. macro strategy
at MUFG Securities America. The maneuver allowed the Treasury to buy time, but
issuing “trillions upon trillions” of paper
will require lower rates from the Fed to
provide a “positive carry”—that is, a higher
yield on Treasuries than the cost to borrow
to finance them.
The cost of funding has been on the rise
in recent days as excess liquidity parked at
the Fed in reverse repurchase agreements,
or RRPs, by money-market funds has been
switched to a great extent to all those Tbills being auctioned, Bespoke Investment
Group wrote in a client note this past
week. The reduction in excess liquidity
also has pushed up dealer financing costs,
such that a Treasury position yields about
1.45 percentage points less than what dealers pay to finance it.
Such matters used to be inside baseball
for bond geeks. But the massive federal
budget deficit makes them more than that.
The Treasury market now is 14% bigger
than the U.S. banking system, Wells Fargo
economists wrote in a note last month. In
2006, the Treasury market was only 44%
the size of the banking system. Its growth
has strained the capacity of the financial
system to absorb all that borrowing.
The reduction in the Fed’s securities
holdings is tightening liquidity. Minutes of
the central bank’s December policy meeting, released this past week, showed several officials thought it was appropriate to
discuss slowing the pace of the runoff of
maturing securities to provide advance
guidance to the market. Goncalves also
noted the Bank Term Funding Program,
established last year after the failure of
Silicon Valley Bank and others to provide
liquidity to other strapped institutions, is
slated to end in March. A total of $141 billion of those loans was outstanding as of
Jan. 3, a record for the facility.
The bottom line is that the fourth-quarter rallies in bonds and stocks were helped
by adjusting the mix of the Treasury’s borrowing to short-term bills. These were
scooped up by money-market funds, whose
assets have swelled to a record just shy of
$6 trillion as savers and investors have
taken advantage of 5%-plus yields, the
highest since 2007, while large banks continue to pay next to nothing on deposits.
This pool of excess liquidity shows
signs of being absorbed, as indicated by
the aforementioned signs of rising dealer
financing costs. Deutsche Bank strategists
see the Fed beginning to phase out quantitative tightening in June as it starts to cut
rates in response to a “material” rise in
unemployment, they wrote in a client note
this past week. In which case, those eager
for Fed easing ought to be careful what
they wish for. B
email: randall.forsyth@barrons.com
January 8, 2024
9
BARRON’S
ST R E E TWI S E
Verizon and Truist Financial, languishing in Wall
Street’s bargain bin, both got upgrades this past
week. The analysts might be on to something.
For personal non-commercial use only. Do not edit or alter. Reproductions not permitted.
To reprint or license content, please contact Barron's reprints department at 800-843-0008 or www.djreprints.com
They Look Pretty Ugly,
But Verizon and Truist
Could Surprise You
F
or 6% yields, consider shares of a comatose wireless carrier and a bloated
bank.
You see, this is
why I didn’t do well
as a stockbroker. But a little acceptance of the two companies’ flaws
might be in order here.
The U.S. stock market is increasingly driven by artificial-intelligence
world beaters. Its seven biggest tech
companies are now worth more than
the combined stock markets of
Japan, Canada, and the United Kingdom, points out private-equity investor Apollo Global Management. For
index fund buyers, valuations look
puffy, with the S&P 500 index back
up to 20 times earnings.
But there are still plenty of
cheapies. Only 27% of stocks in the
S&P 500 outperformed the index
last year—the narrowest leadership
in data going back to 1987. I count
more than 150 index members trading below 15 times forward earnings
projections.
A few of these companies are
deeply challenged, but most are just
unexciting. For example, Conagra
Brands makes a frozen economic
miracle called Marie Callender’s
Chicken Pot Pie. Walmart sells the
10-ounce, 610-calorie one for $2.98.
This past week, Conagra cut its sales
guidance, saying that stretched shoppers are doing more scratch cooking.
Shares lost 2%. I suppose they’re
inexpensive at 11 times earnings,
with a 4.9% dividend. But the sub-$3
dinner market sounds like a tough
BY JACK
HOUGH
place to find returns.
Two stocks that are even further
out on the value end of the S&P 500
attracted analyst upgrades this past
week.
Let’s start with Verizon Communications, which KeyBanc Capital
Markets took to Overweight from
Sector Weight. A report outlining
the bank’s reasoning contained the
saddest of bullish points: “Adjusted
Ebitda” growth is projected to top
2% this year, versus zero in 2023,
which would be the second-fastest
rate since 2018. In other words, a
financial measure engineered for
flattery might show barely perceptible improvement, which would qualify as better news than usual.
There are some brighter points,
it turns out. One is that the wireless
industry looks poised for benign
competition in 2024. Subscriber
counts are broadly growing. Churn,
or the rate of customer defections, is
stable. Device promotions don’t look
overly generous. Revenue per user is
rising. And funding needs for network investments are falling.
Easing competition could be particularly helpful for Verizon, which
has been a market share donor for
years. Its share of postpaid accounts,
or ones with recurring monthly billing, fell from over 41% in 2019 to an
estimated 36% last year. KeyBanc
predicts steady improvement in net
customer additions from here.
Broadband momentum is another
plus. KeyBanc sees telecom players
in broadband generally gaining market share from cable. Verizon in particular is estimated to have added
more than a million connections in
2023, net of losses, counting 5G and
Fios. AT&T is estimated to have lost
broadband connections overall.
Both trends appear poised to continue this year.
All of this should be good for
Verizon’s free cash flow, which Wall
Street sees approaching $19 billion this
year, or 11.5% of the company’s market
value. That makes its dividend yield of
6.7%—a high enough figure to raise
suspicion—appear sustainable. It also
makes debt reduction in 2024 look
likely, and stock buybacks in 2025 not
out of the question.
Shares, at a recent $39 and change,
trade at 8.5 times forward earnings
projections. The five-year average is
just over 10 times. KeyBanc sees potential for a near-term rise to $45 a
share. Add in the dividend and that
would work out to a total return of
more than 20%.
Let’s move on to Truist Financial. It’s both huge and not quite
familiar to investors, for good reason. The company was formed by a
2019 merger between SunTrust and
BB&T, making it the No. 6 bank by
BARRONS.COM/PODCASTS
Barron’s Streetwise
In a weekly podcast by Barron’s, columnist Jack Hough looks
at the companies, people, and trends you should be watching.
This is Wall Street like you’ve never heard before. Subscribe
to Barron’s Streetwise on Spotify, Apple Podcasts,
or your favorite listening app.
deposits. And it gave itself a new and
totally made-up name. Atlanta
Braves fans, at least, are basking in
the branding—they see games now at
Truist Park, formerly SunTrust
Park.
So far, the merger has been a dud
for shareholders, who are down 21%
since the closing date, and that’s
counting the hefty dividend yield,
recently 5.6%. The S&P 500 over
that same stretch has returned 57%.
The stock is up 30%, though, since
Barron’s recommended it in September. BofA Securities this past week
upgraded Truist shares to Buy from
Neutral, giving a few reasons for
optimism.
M
ore so than its peers,
Truist’s net interest income stands to benefit
from the Federal Reserve shifting from interest-rate
hikes to cuts, as expected. Long
term, a footprint in the U.S. Southeast bolsters growth prospects. Cost
cuts should help. Management aims
to bring cost growth down from 7%
last year to a range of flat to negative
1% this year.
Savings will come from shrinking
the workforce and branch networks
and consolidating tech and administrative work. BofA says there is room
for cost-cutting to continue beyond
2024. A recent shrinking of the
board and some senior management
replacements suggest that change is
gathering pace.
There is also Truist’s 80% ownership in Truist Insurance Holdings,
the sixth-largest U.S. insurance brokerage. Selling that stake would free
up cash to refinance debt and boost
earnings per share. BofA calls that
business “differentiated” but “not
strategically integral,” which I’m
pretty sure nets out to a “ditch it.”
Shares, at about $37, sell for 10.8
times estimated 2024 earnings, versus over 13 times before the pandemic. BofA says they ought to be
able to fetch $43 within a year, which
would put the total return on this
one, too, at over 20%. B
email: jack.hough@barrons.com
BARRON’S
37,466.11
R E VIEW & PREV IEW
Dow Industrials: - 223.43
January 8, 2024
541.15
Dow Global Index: - 9.41
LAST WEEK
TH IS WEEK
For personal non-commercial use only. Do not edit or alter. Reproductions not permitted.
To reprint or license content, please contact Barron's reprints department at 800-843-0008 or www.djreprints.com
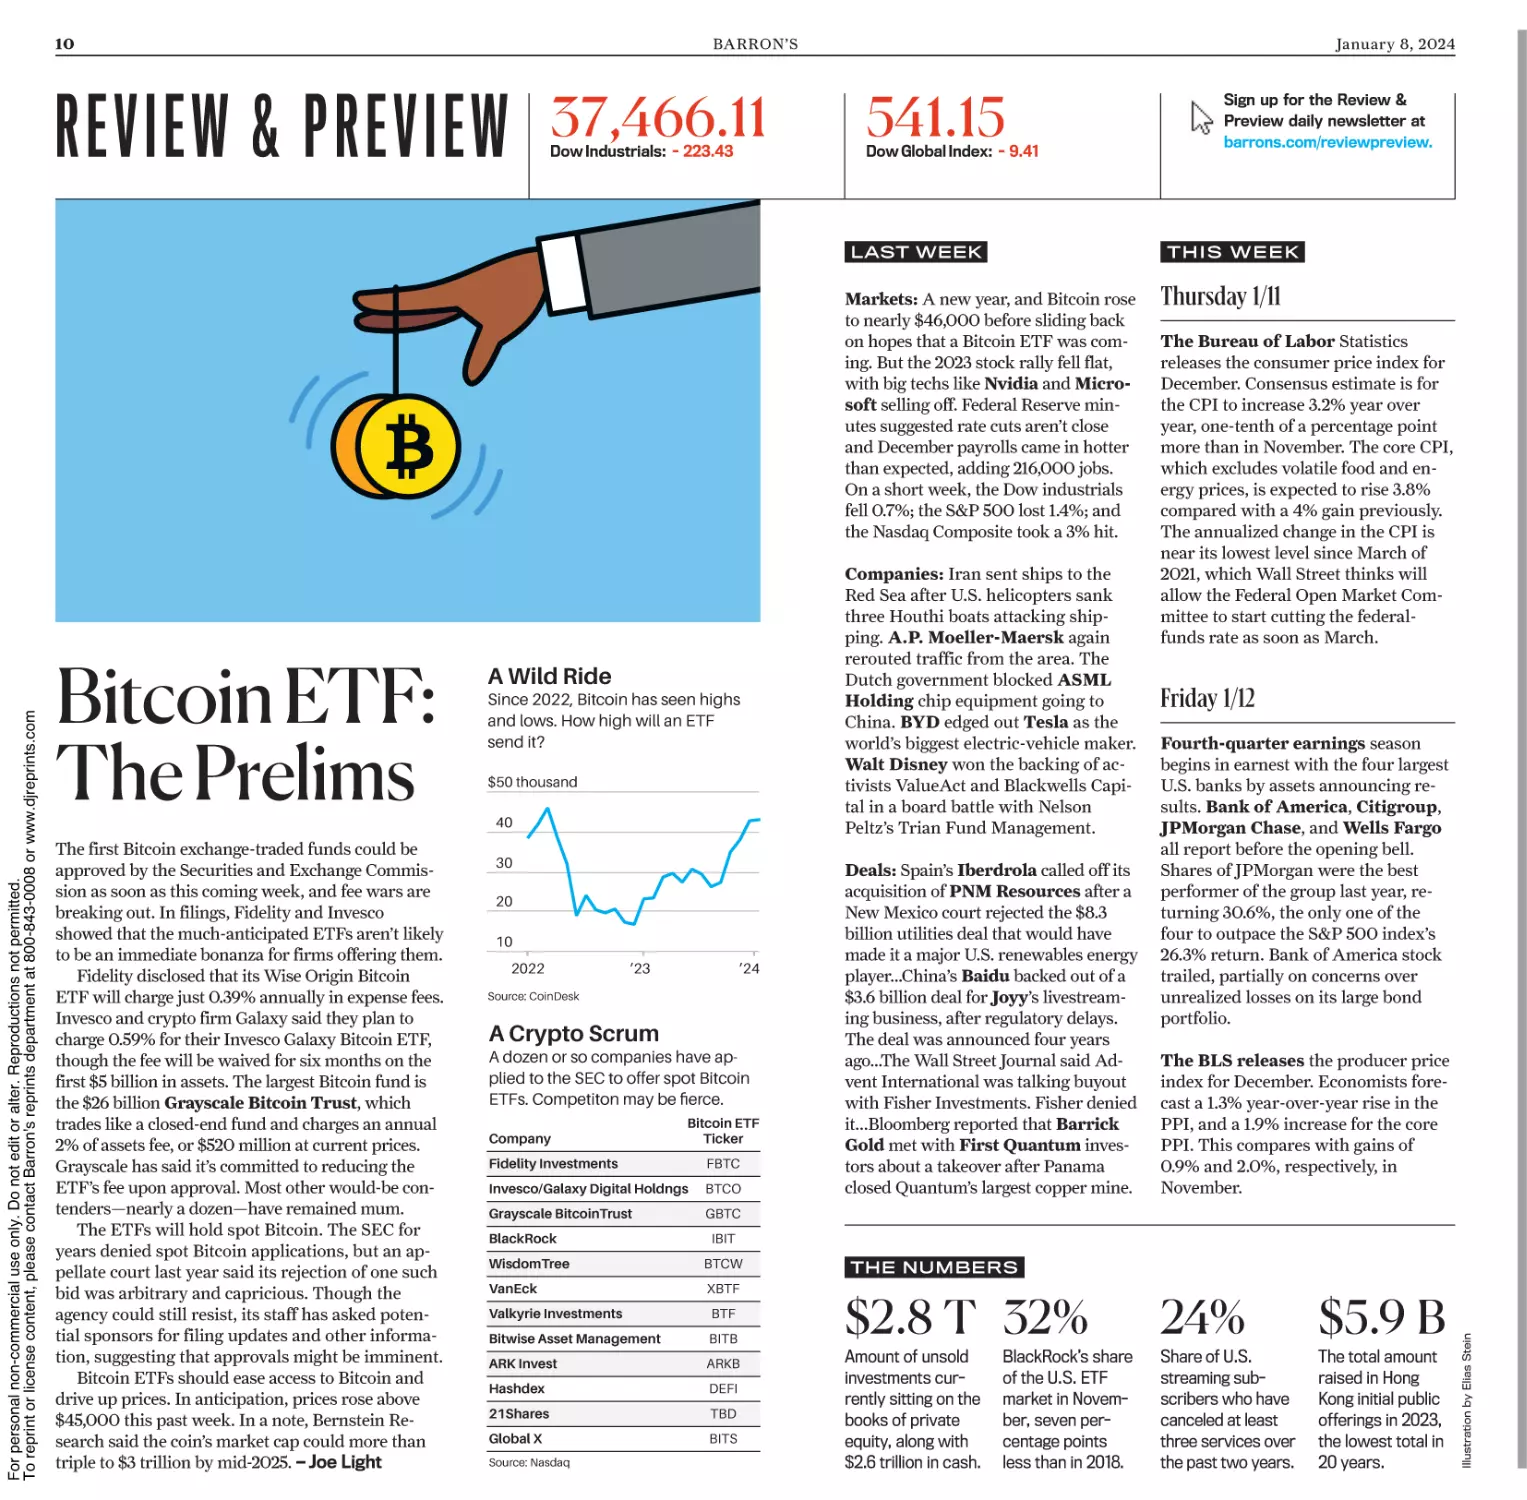
Markets: A new year, and Bitcoin rose
to nearly $46,000 before sliding back
on hopes that a Bitcoin ETF was coming. But the 2023 stock rally fell flat,
with big techs like Nvidia and Microsoft selling off. Federal Reserve minutes suggested rate cuts aren’t close
and December payrolls came in hotter
than expected, adding 216,000 jobs.
On a short week, the Dow industrials
fell 0.7%; the S&P 500 lost 1.4%; and
the Nasdaq Composite took a 3% hit.
Bitcoin ETF:
The Prelims
The first Bitcoin exchange-traded funds could be
approved by the Securities and Exchange Commission as soon as this coming week, and fee wars are
breaking out. In filings, Fidelity and Invesco
showed that the much-anticipated ETFs aren’t likely
to be an immediate bonanza for firms offering them.
Fidelity disclosed that its Wise Origin Bitcoin
ETF will charge just 0.39% annually in expense fees.
Invesco and crypto firm Galaxy said they plan to
charge 0.59% for their Invesco Galaxy Bitcoin ETF,
though the fee will be waived for six months on the
first $5 billion in assets. The largest Bitcoin fund is
the $26 billion Grayscale Bitcoin Trust, which
trades like a closed-end fund and charges an annual
2% of assets fee, or $520 million at current prices.
Grayscale has said it’s committed to reducing the
ETF’s fee upon approval. Most other would-be contenders—nearly a dozen—have remained mum.
The ETFs will hold spot Bitcoin. The SEC for
years denied spot Bitcoin applications, but an appellate court last year said its rejection of one such
bid was arbitrary and capricious. Though the
agency could still resist, its staff has asked potential sponsors for filing updates and other information, suggesting that approvals might be imminent.
Bitcoin ETFs should ease access to Bitcoin and
drive up prices. In anticipation, prices rose above
$45,000 this past week. In a note, Bernstein Research said the coin’s market cap could more than
triple to $3 trillion by mid-2025. — Joe Light
A Wild Ride
Since 2022, Bitcoin has seen highs
and lows. How high will an ETF
send it?
$50 thousand
40
30
20
10
2022
’23
’24
Source: CoinDesk
A Crypto Scrum
A dozen or so companies have applied to the SEC to offer spot Bitcoin
ETFs. Competiton may be fierce.
Company
Bitcoin ETF
Ticker
Fidelity Investments
FBTC
Invesco/Galaxy Digital Holdngs
BTCO
Grayscale BitcoinTrust
GBTC
BlackRock
Companies: Iran sent ships to the
Red Sea after U.S. helicopters sank
three Houthi boats attacking shipping. A.P. Moeller-Maersk again
rerouted traffic from the area. The
Dutch government blocked ASML
Holding chip equipment going to
China. BYD edged out Tesla as the
world’s biggest electric-vehicle maker.
Walt Disney won the backing of activists ValueAct and Blackwells Capital in a board battle with Nelson
Peltz’s Trian Fund Management.
Deals: Spain’s Iberdrola called off its
acquisition of PNM Resources after a
New Mexico court rejected the $8.3
billion utilities deal that would have
made it a major U.S. renewables energy
player…China’s Baidu backed out of a
$3.6 billion deal for Joyy’s livestreaming business, after regulatory delays.
The deal was announced four years
ago…The Wall Street Journal said Advent International was talking buyout
with Fisher Investments. Fisher denied
it...Bloomberg reported that Barrick
Gold met with First Quantum investors about a takeover after Panama
closed Quantum’s largest copper mine.
Thursday 1/11
The Bureau of Labor Statistics
releases the consumer price index for
December. Consensus estimate is for
the CPI to increase 3.2% year over
year, one-tenth of a percentage point
more than in November. The core CPI,
which excludes volatile food and energy prices, is expected to rise 3.8%
compared with a 4% gain previously.
The annualized change in the CPI is
near its lowest level since March of
2021, which Wall Street thinks will
allow the Federal Open Market Committee to start cutting the federalfunds rate as soon as March.
Friday 1/12
Fourth-quarter earnings season
begins in earnest with the four largest
U.S. banks by assets announcing results. Bank of America, Citigroup,
JPMorgan Chase, and Wells Fargo
all report before the opening bell.
Shares of JPMorgan were the best
performer of the group last year, returning 30.6%, the only one of the
four to outpace the S&P 500 index’s
26.3% return. Bank of America stock
trailed, partially on concerns over
unrealized losses on its large bond
portfolio.
The BLS releases the producer price
index for December. Economists forecast a 1.3% year-over-year rise in the
PPI, and a 1.9% increase for the core
PPI. This compares with gains of
0.9% and 2.0%, respectively, in
November.
IBIT
WisdomTree
BTCW
VanEck
XBTF
Valkyrie Investments
BTF
Bitwise Asset Management
BITB
ARK Invest
ARKB
Hashdex
DEFI
21Shares
TBD
Global X
BITS
Source: Nasdaq
Sign up for the Review &
Preview daily newsletter at
barrons.com/reviewpreview.
THE NUMBERS
$2.8 T 32%
24%
$5.9 B
Amount of unsold
investments currently sitting on the
books of private
equity, along with
$2.6 trillion in cash.
Share of U.S.
streaming subscribers who have
canceled at least
three services over
the past two years.
The total amount
raised in Hong
Kong initial public
offerings in 2023,
the lowest total in
20 years.
BlackRock’s share
of the U.S. ETF
market in November, seven percentage points
less than in 2018.
Illustration by Elias Stein
10
11
BARRON’S
Forgotten
Value Stocks
With Growth
Potential
Boyar Value Group identified 40
“forgotten” stocks that could shine
in 2024. We highlight five on the
list.
G
For personal non-commercial use only. Do not edit or alter. Reproductions not permitted.
To reprint or license content, please contact Barron's reprints department at 800-843-0008 or www.djreprints.com
BY NICHOLAS JASINSKI
rowth stocks and largecaps led the market in
2023. That suggests the
best bargains now reside
in value and small-cap
names.
That’s the view of Jonathan Boyar, head of Boyar Value
Group, a New York–based asset manager and research firm that compiles
an annual list of 40 undervalued
stocks with potential turnaround catalysts. “There are a lot of good opportunities in small-caps today, but you have
to be choosy,” Boyar says. “Almost half
[of small-caps] are unprofitable, and
debt maturities are coming due.”
Boyar Value has compiled the socalled Forgotten Forty for the past 30
years. The portfolio has gained an average of 9.9% annually over the past 15
years, versus 8.4% for the Russell
3000 Value index. But it has lagged
behind the S&P 500’s 11.8% average
annual gain in that same span. Barron’s
recently spoke with Boyar about five
ideas from the 2024 edition of the Forgotten Forty.
Medtronic, a maker of medical
devices, has been buffeted by supplychain disruptions and the underperformance of its diabetes-management
business. The latest hit to the stock
came from investor excitement about a
new class of weight-loss drugs; their
uptake is expected to dent demand for
medical procedures and devices.
Boyar sees aging populations in
developed countries and improving
standards of medical care in emerging
markets as long-term tailwinds to the
sale of medical devices and equipment.
Medtronic also has a promising robotic-assisted surgery system.
Medtronic shares have fallen almost
40% from their mid-2021 high, and
now trade around $84. Boyar applies a
five-year average enterprise value-toEbitda (earnings before interest, taxes,
depreciation, and amortization) multiple of 17 times to fiscal 2025 estimated
Ebitda, to yield a price target of $121 a
share—a prospective gain of 44%.
Medtronic yields 3.3% and has lifted its
payout for 46 consecutive years.
Boyar also sees a favorable risk/reward for Comcast stock, up 16% in the
past year. The company’s Xfinity cable
business is highly profitable, and its
NBCUniversal Media unit has the best
balance sheet in traditional media.
Although broadband subscriber
growth has slowed, Boyar says Comcast has been able to continue growing
due to price increases. NBCUniversal
generated cash from the sale of Comcast’s Hulu stake to Walt Disney.
Meanwhile, theme parks are performing well, and losses are shrinking at the
Peacock streaming service.
All that means plenty of free cash
flow to direct toward Comcast’s dividend—current yield: 2.7%—and share
buybacks. Boyar calculates an intrinsic
value for Comcast of $70 a share, up
63% from the stock’s recent $43.
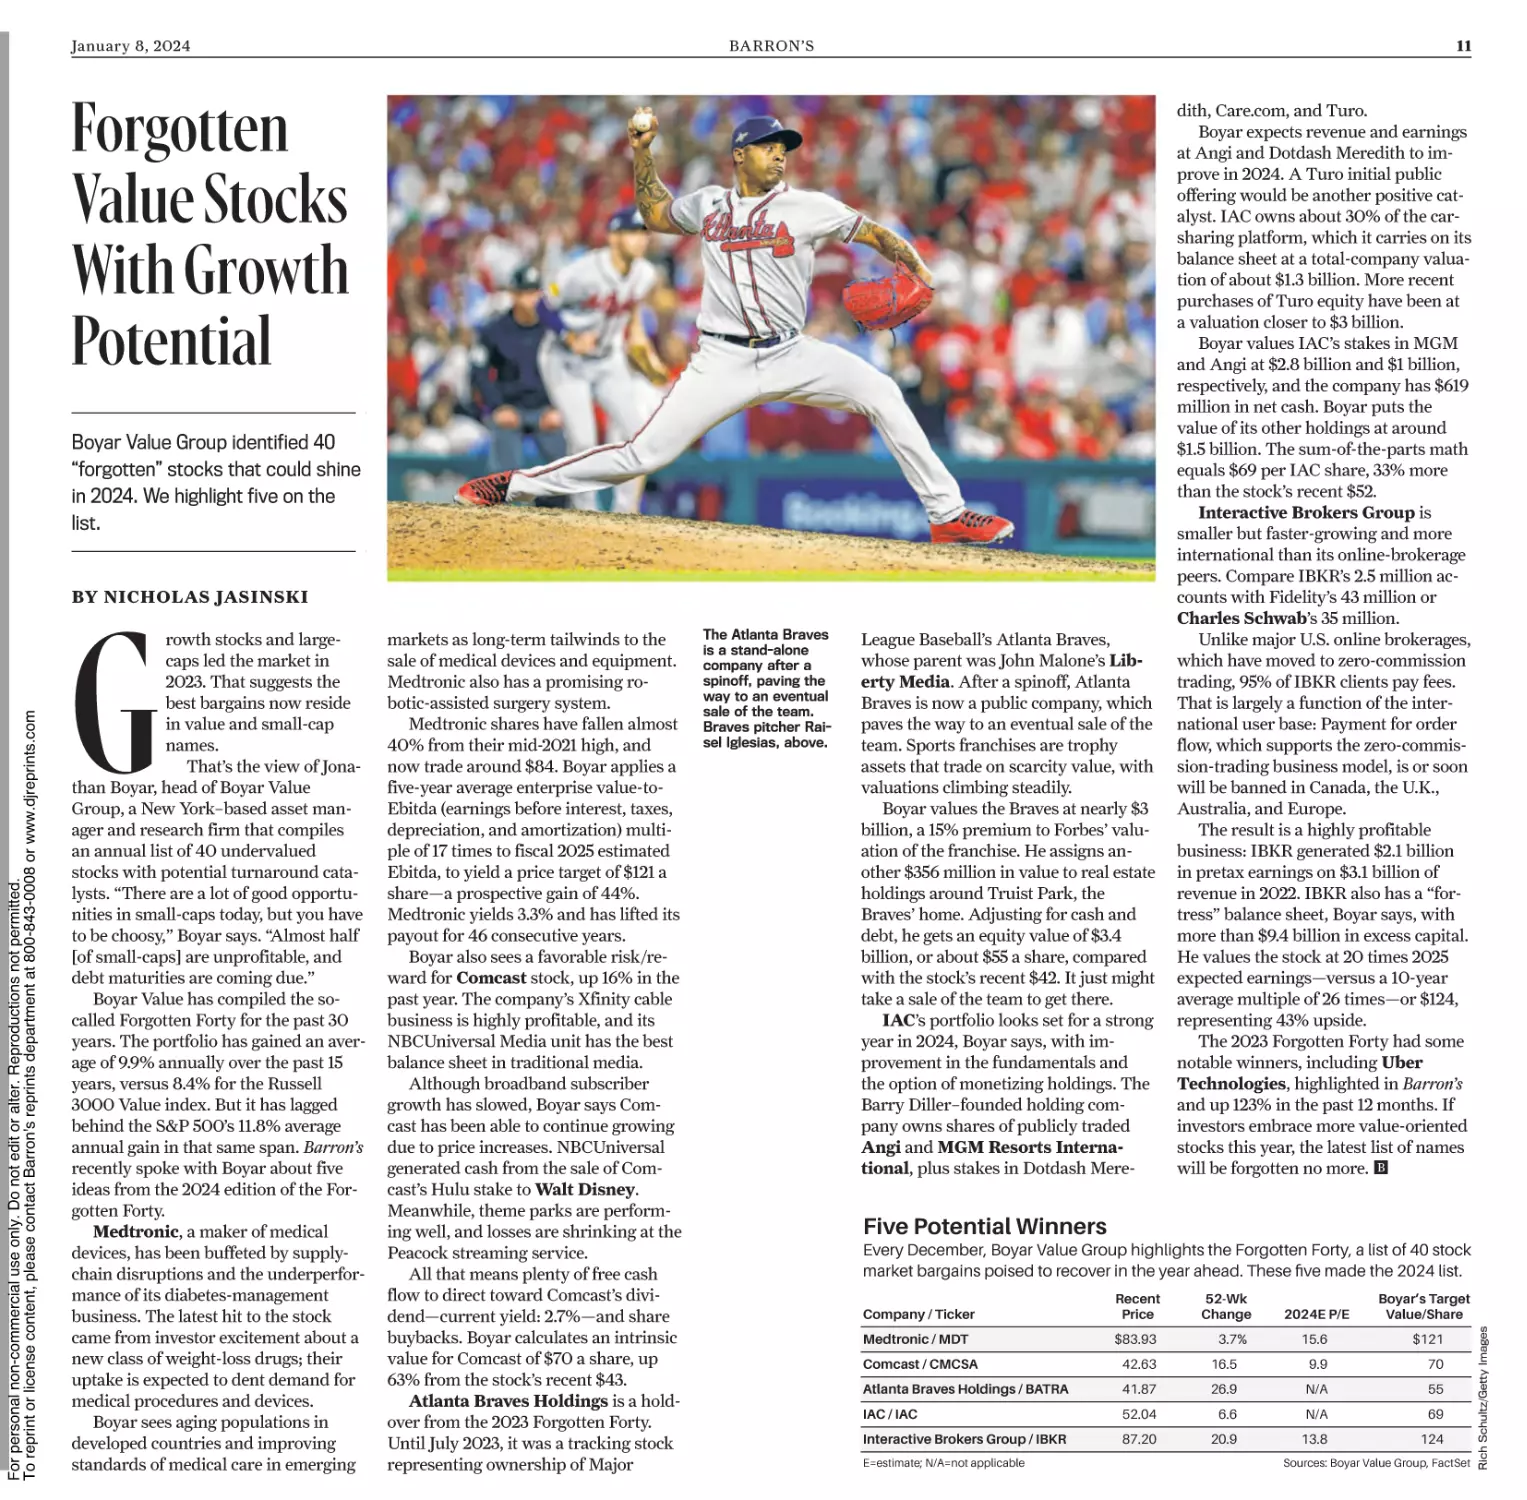
Atlanta Braves Holdings is a holdover from the 2023 Forgotten Forty.
Until July 2023, it was a tracking stock
representing ownership of Major
The Atlanta Braves
is a stand-alone
company after a
spinoff, paving the
way to an eventual
sale of the team.
Braves pitcher Raisel Iglesias, above.
League Baseball’s Atlanta Braves,
whose parent was John Malone’s Liberty Media. After a spinoff, Atlanta
Braves is now a public company, which
paves the way to an eventual sale of the
team. Sports franchises are trophy
assets that trade on scarcity value, with
valuations climbing steadily.
Boyar values the Braves at nearly $3
billion, a 15% premium to Forbes’ valuation of the franchise. He assigns another $356 million in value to real estate
holdings around Truist Park, the
Braves’ home. Adjusting for cash and
debt, he gets an equity value of $3.4
billion, or about $55 a share, compared
with the stock’s recent $42. It just might
take a sale of the team to get there.
IAC’s portfolio looks set for a strong
year in 2024, Boyar says, with improvement in the fundamentals and
the option of monetizing holdings. The
Barry Diller–founded holding company owns shares of publicly traded
Angi and MGM Resorts International, plus stakes in Dotdash Mere-
dith, Care.com, and Turo.
Boyar expects revenue and earnings
at Angi and Dotdash Meredith to improve in 2024. A Turo initial public
offering would be another positive catalyst. IAC owns about 30% of the carsharing platform, which it carries on its
balance sheet at a total-company valuation of about $1.3 billion. More recent
purchases of Turo equity have been at
a valuation closer to $3 billion.
Boyar values IAC’s stakes in MGM
and Angi at $2.8 billion and $1 billion,
respectively, and the company has $619
million in net cash. Boyar puts the
value of its other holdings at around
$1.5 billion. The sum-of-the-parts math
equals $69 per IAC share, 33% more
than the stock’s recent $52.
Interactive Brokers Group is
smaller but faster-growing and more
international than its online-brokerage
peers. Compare IBKR’s 2.5 million accounts with Fidelity’s 43 million or
Charles Schwab’s 35 million.
Unlike major U.S. online brokerages,
which have moved to zero-commission
trading, 95% of IBKR clients pay fees.
That is largely a function of the international user base: Payment for order
flow, which supports the zero-commission-trading business model, is or soon
will be banned in Canada, the U.K.,
Australia, and Europe.
The result is a highly profitable
business: IBKR generated $2.1 billion
in pretax earnings on $3.1 billion of
revenue in 2022. IBKR also has a “fortress” balance sheet, Boyar says, with
more than $9.4 billion in excess capital.
He values the stock at 20 times 2025
expected earnings—versus a 10-year
average multiple of 26 times—or $124,
representing 43% upside.
The 2023 Forgotten Forty had some
notable winners, including Uber
Technologies, highlighted in Barron’s
and up 123% in the past 12 months. If
investors embrace more value-oriented
stocks this year, the latest list of names
will be forgotten no more. B
Five Potential Winners
Every December, Boyar Value Group highlights the Forgotten Forty, a list of 40 stock
market bargains poised to recover in the year ahead. These five made the 2024 list.
Company / Ticker
Recent
Price
Medtronic / MDT
$83.93
52-Wk
Change
3.7%
2024E P/E
Boyar’s Target
Value/Share
15.6
$121
9.9
70
Comcast / CMCSA
42.63
16.5
Atlanta Braves Holdings / BATRA
41.87
26.9
N/A
55
IAC / IAC
52.04
6.6
N/A
69
Interactive Brokers Group / IBKR
87.20
20.9
13.8
124
E=estimate; N/A=not applicable
Sources: Boyar Value Group, FactSet
Rich Schultz/Getty Images
January 8, 2024
12
BARRON’S
How Abercrombie &
Fitch Went From
Rags to Riches
Y
BY SABRINA ESCOBAR
Yuki Iwamura/AFP/Getty Images
For personal non-commercial use only. Do not edit or alter. Reproductions not permitted.
To reprint or license content, please contact Barron's reprints department at 800-843-0008 or www.djreprints.com
The retailer began a makeover in mid-2022 that ignited share gains of
285%. Driving the change: new stores, products, and target customers.
ou don’t normally associate fashion brand Abercrombie & Fitch with
members of the Magnificent Seven. But 2023 was
a strange year—one that
saw Abercrombie shares
soar 285%, beating not just the S&P
500, up 24%, but the top five performers in the S&P, including
Nvidia, at 239%, and Meta Platforms, at a mere 194%.
Abercrombie’s 2023 romp shatters
its own past performance and underscores the fickle nature of fashion
retailing. In 2022, the stock shed 34%
as the company struggled through a
year of tough quarterly reports. Inflation squeezed consumer spending,
while elevated inventories and fallout
from pandemic-era supply-chain
problems forced the company to engage in heavy discounting, squeezing
earnings.
What changed? For starters, Abercrombie’s macro problems eased in
2023. Both inflation and inventories
fell, helping Abercrombie regain its
financial footing. In 2023’s third
quarter—just before holiday shopping began—Abercrombie powered
through rising interest rates and con-
Abercrombie &
Fitch’s airy, sundrenched Fifth Avenue flagship store
reflects the brand’s
evolution. Here,
shoppers on the
recent Black Friday.
January 8, 2024
cerns over consumer buying power.
The company increased sales by 20%
year over year in the quarter to $1.06
billion, grew operating margins by 11
percentage points to 13.1%, and was
one of the few retailers that raised
fiscal-year guidance.
And given a solid holiday season,
analysts now expect Abercrombie to
continue its momentum through the
fourth quarter. Consensus estimates
for full-year 2023 show earnings
growing 2,200% from 2022 to $5.78
per share, and sales rising 13% to
$4.2 billion.
Still, as important as inventories
are, they don’t drive triple-digit stock
performance. The key for Abercrombie is regaining its “cool kid” status—
something the fashion retailer has
been striving for since falling from
grace in the mid 2010s, though
“kids” is no longer the mantra. Today,
Abercrombie is inches away from
meeting its goal to rake in up to $4.3
billion in annual sales by 2025, outlined in an investor day in 2022, and
is also close to its long-term target of
$5 billion in annual revenue.
“We’ve evolved the purpose and
positioning at each of our brands,
executing a turnaround at Abercrombie adults that many, many thought
was impossible,” CEO Fran Horowitz
said when outlining the plan.
You get a flavor of that remake at
the company’s new Fifth Avenue flagship store, which Horowitz called a
celebration of the brand’s evolution.
The airy, sun-drenched store hardly
resembles the old dimly lit, colognedrenched outlets. The now-infamous
posters of pouty shirtless models
have been replaced by plants and
landscapes, and the most popular
products of the 2000s, from graphic
T-shirts to branded polos, are gone.
Abercrombie’s new product lines
feature tailored pants, athleisure,
long-sleeved turtlenecks, and wedding-guest attire—all aimed at a
broader, older audience. Horowitz
said in November that target customers range from 20 to 40 years old; the
younger crowd is funneled to Hollister, the company’s teen-centric brand.
“[Abercrombie’s] a little different,”
says Vanessa Oweh, a 34-year-old
shopper at Abercrombie in Manhattan. “I think now it’s a little bit more
mature. Before, it was more beachy—
just younger.”
As Jefferies retail analyst Corey
Tarlowe wrote in a late-November
note, “Multiyear efforts spanning
marketing, product, and in-store presentation have yielded distinctive
brands that strongly resonate with
their particular audiences.” Tarlowe
had a Buy rating on the stock, and
following Abercrombie’s third-quarter results, he raised his price target
to $85 from $80.
He could have gone higher. Abercrombie shares ended the year at
$88.22 and were up 2.6% more on
Friday, in a week that saw the S&P
500’s drop 1.5%. Yet despite consumer—and investor—enthusiasm
for Abercrombie, many on the Street
appear uncertain what to make of the
shares in 2024. Only a third of analysts have Buy ratings on the stock;
two-thirds rate them Hold, according
to FactSet.
“The No. 1 question we field following the [stock’s] move is simply:
Is this all real?” wrote William Blair
analyst Dylan Carden in a note this
past week. Carden has a Market Perform rating on the stock, but no price
target. Abercrombie’s management
deserves “an immense amount of
credit” for the progress it has made in
revamping the brand, he wrote. But
it’s likely the company will struggle
to sustain the growth levels it needs
to justify its valuation.
That’s Abercrombie’s challenge:
How do you replicate an off-the-chart
performance in a business driven by
fashion? Shares of Abercrombie trade
at 15.6 times 12-month forward earnings, according to FactSet. While
that’s below its five-year average of
16.5, it’s higher than many competitors. American Eagle Outfitters has
a price/earnings ratio of 13.8, Urban
Outfitters, 10.4. Meanwhile, analysts
predict Abercrombie & Fitch earnings per share will tick up a little less
than 3% in 2024 from 2023, and revenue will grow by 3.4%, according to
FactSet consensus estimates.
Part of the slowdown can be traced
to concerns that consumers will rein
in spending in 2024. Abercrombie
also plans to open fewer stores in
2024 than in the past few years,
which will curb top-line growth. And
higher labor and marketing costs
could weigh on further margin
growth, Carden said, especially if the
fashion cycle turns against any of
Abercrombie’s brands.
When it comes to fashion—and the
stock market—one day you’re in, the
next you’re out. Abercrombie’s challenge now is to prove it’s a stock for
all seasons. B
January 8, 2024
Home Builder Stocks
Are Now a Shaky Bet
Using the often-cited maxim for
investing in home builders—buy at
book value, sell at two-times book—
the stocks are too expensive to buy but
too cheap to sell. Excluding NVR,
which trades at a much higher valuation than the rest of the group, the
nation’s 10 largest builders were trading at a recent average of 1.4 times
forward book value, according to
FactSet.
T
H
Daniel Acker/Bloomberg
For personal non-commercial use only. Do not edit or alter. Reproductions not permitted.
To reprint or license content, please contact Barron's reprints department at 800-843-0008 or www.djreprints.com
High expectations for the spring buying season are already priced into
most of the stocks, analysts say. A better entry point could be coming.
BY SHAINA MISHKIN
ome-builder
stocks trounced
the broader market in 2023, fueled
by buyers who
flocked to new
construction and
the shift late in the year to a brighter
housing outlook.
The housing business will rebound in 2024 as lower mortgage
rates draw more buyers to the market, but home-builder stocks may
already reflect a lot of the good news
after 2023’s big gains. The 10 largest
home builders by market capitalization jumped an average of 95% in
2023, while the S&P 500 index was
up 24%. Indeed, builder stocks,
along with the broader market, had a
13
BARRON’S
weak start this year.
Builders of all sizes climbed in
2023. The smaller M/I Homes soared
nearly 200%, followed by the larger
PulteGroup, which gained 127%.
Even the group’s laggards had a significant trajectory: NVR and Lennar
were up 52% and 65%, respectively.
Builders earlier this year were
helped by the lack of existing homes
for sale. But a big chunk of the stocks’
gains came in the past two months, as
expectations for Federal Reserve interest-rate cuts rapidly brightened at the
end of 2023. The 10-year Treasury
yield, with which mortgage rates often
move, fell from just below 5% to a recent 3.8% in a matter of months.
Mortgage rates, as a result, retreated
to 6.6% at year’s end from almost 8%
as recently as October, according to
Freddie Mac.
A brighter outlook
for housing late in
2023 gave a boost
to builder stocks.
he good news: Economists
expect mortgage rates to
continue to fall throughout
2024 as inflation eases.
That, in turn, will cut down on skyhigh homebuying costs, prompting
buyers to return in greater force. With
more demand, builders could sell
more homes with fewer discounts.
Lennar, one of the nation’s largest
home builders, “will be well prepared”
for pent-up demand if rates fall, Stuart
Miller, the company’s executive chairman, said on a December earnings
call. “Most recent movements in interest rates suggest a better road
ahead,” he said.
The bad news: High expectations
for the spring buying season are already priced into most of the stocks,
analysts say. “The market is telling the
Street that prospects are better than
the Street thinks,” says BTIG analyst
Carl Reichardt, who rates most of the
group Hold.
Jay McCanless, a Wedbush analyst,
lowered his ratings on a slate of builders and building-product companies
to Neutral from Outperform precisely
because the stock prices have baked in
“a robust start” to 2024. “Our longterm bullish view on housing demand
in the U.S. has not changed,” he wrote
in a mid-December note.
Structural factors that made the
sector attractive are in place for the
long term: Aging Millennials, followed
by Gen Zers, are looking to own
homes while baby boomers are downsizing. There’s a general U.S. housing
shortage, economists say, compounded by the need to eventually
replace aging housing stock. And a
fragmented and localized market
means large public builders are better
suited than private companies to gain
market share, leveraging their scale to
reduce costs.
“Home-building stocks can continue to generate strong shareholder
returns over the next few years,” says
Jeffrey Kolitch, who manages the $1.5
billion Baron Real Estate fund.
Shares trade at lower price/earnings
ratios than the broader S&P 500, he
notes, and that’s even with changes to
their businesses, such as controlling
more land via options, that he says
make the companies less cyclical than
in the past.
For now, it’s a waiting game for
investors. But an entry point could be
coming. The market could be disappointed if the Fed doesn’t cut rates as
many times as expected. That could
send mortgage rates higher, and
builder stocks lower, if expectations
for a robust spring selling season appear too optimistic.
Investors should keep their eyes
on the 10-year Treasury yield; its
fluctuations drove big changes in
builder stocks in 2023. The five biggest daily losses in the iShares U.S.
Home Construction exchangetraded fund in 2023 accompanied
gains in the yield, according to data
form FactSet and Tradeweb ICE
Closes. Mortgage rates don’t need to
climb back to nearly 8% to shake
home buyers and investors: “The
level of mortgage rates isn’t nearly as
big of a headwind to demand as volatility is,” says McCanless.
The builders worth considering are
some of the sector’s biggest names. Of
the five most widely covered builder
stocks, analysts expect new orders to
grow fastest at Toll Brothers, Lennar, and D.R. Horton. Analysts are
broadly positive on these stocks, with
the majority holding Buy ratings.
D.R. Horton and Lennar are among
the stocks Reichardt prefers. “Local
market share is a critical driver to returns,” he says. The bigger presence a
company has in a local market, the better its cost advantage. “They’re able to
provide homes to customers more affordably than many of their peers, and
they’re able to do it at good margins
because their costs are low,” he says.
Baron’s Kolitch says Toll Brothers,
Lennar, and D.R. Horton “have dramatically improved” their balance
sheets and their ability to generate
strong, long-term earnings growth and
cash flow and return capital to shareholders. His fund owns all three.
Kolitch adds that the three stocks
deserve higher multiples. “There’s an
argument for a paradigm shift in the
valuation multiples higher because of
many of these improvements. If they
just grow their earnings, and then
they get a bit of a bump in the valuation metric, they’re going to be very
good stocks,” he says. B
14
BARRON’S
January 8, 2024
U.S. Steel Is
Back in the
Spotlight It
Once Owned
The former corporate colossus is
now dwarfed by steel makers in
China and India.
I
t has been a long time since
United States Steel lived up to
its illustrious name.
Once the largest company
in the world, a true corporate
colossus, it has been all downhill for U.S. Steel for more
than a half-century. It was dethroned
as the global No. 1 steel maker in 1970,
booted from the Dow Jones Industrial
Average in 1991, and relegated to the
S&P MidCap 400 in 2014.
By 2022, U.S. Steel had fallen to
27th in global steel output, making it
almost a bit player on the world stage.
Its output of 14.49 million tons was
just a ninth that of the world’s current
No. 1, China Baowu Steel. Even in
America, it trailed two other steel
companies in production. But U.S.
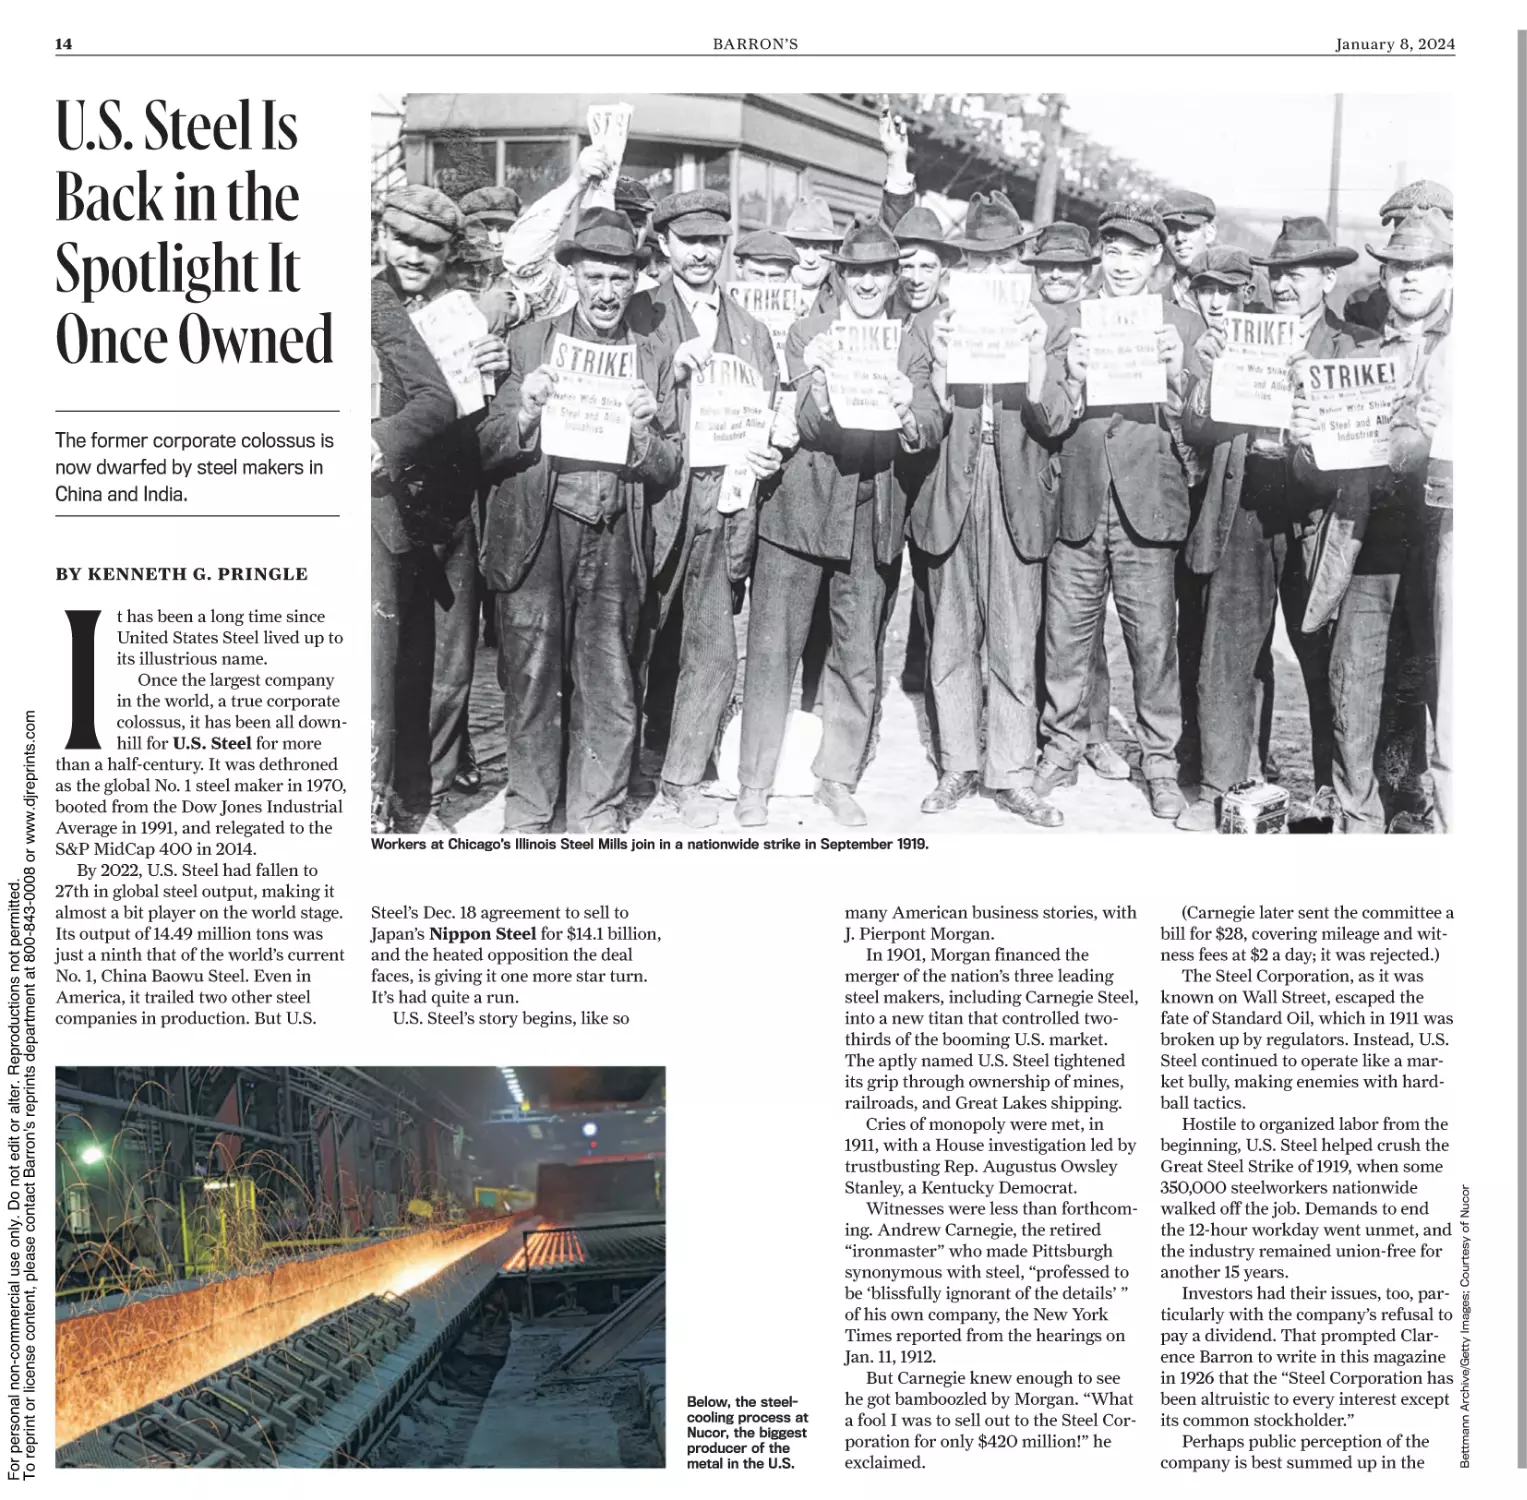
Workers at Chicago’s Illinois Steel Mills join in a nationwide strike in September 1919.
Steel’s Dec. 18 agreement to sell to
Japan’s Nippon Steel for $14.1 billion,
and the heated opposition the deal
faces, is giving it one more star turn.
It’s had quite a run.
U.S. Steel’s story begins, like so
Below, the steelcooling process at
Nucor, the biggest
producer of the
metal in the U.S.
many American business stories, with
J. Pierpont Morgan.
In 1901, Morgan financed the
merger of the nation’s three leading
steel makers, including Carnegie Steel,
into a new titan that controlled twothirds of the booming U.S. market.
The aptly named U.S. Steel tightened
its grip through ownership of mines,
railroads, and Great Lakes shipping.
Cries of monopoly were met, in
1911, with a House investigation led by
trustbusting Rep. Augustus Owsley
Stanley, a Kentucky Democrat.
Witnesses were less than forthcoming. Andrew Carnegie, the retired
“ironmaster” who made Pittsburgh
synonymous with steel, “professed to
be ‘blissfully ignorant of the details’ ”
of his own company, the New York
Times reported from the hearings on
Jan. 11, 1912.
But Carnegie knew enough to see
he got bamboozled by Morgan. “What
a fool I was to sell out to the Steel Corporation for only $420 million!” he
exclaimed.
(Carnegie later sent the committee a
bill for $28, covering mileage and witness fees at $2 a day; it was rejected.)
The Steel Corporation, as it was
known on Wall Street, escaped the
fate of Standard Oil, which in 1911 was
broken up by regulators. Instead, U.S.
Steel continued to operate like a market bully, making enemies with hardball tactics.
Hostile to organized labor from the
beginning, U.S. Steel helped crush the
Great Steel Strike of 1919, when some
350,000 steelworkers nationwide
walked off the job. Demands to end
the 12-hour workday went unmet, and
the industry remained union-free for
another 15 years.
Investors had their issues, too, particularly with the company’s refusal to
pay a dividend. That prompted Clarence Barron to write in this magazine
in 1926 that the “Steel Corporation has
been altruistic to every interest except
its common stockholder.”
Perhaps public perception of the
company is best summed up in the
Bettmann Archive/Getty Images; Courtesy of Nucor
For personal non-commercial use only. Do not edit or alter. Reproductions not permitted.
To reprint or license content, please contact Barron's reprints department at 800-843-0008 or www.djreprints.com
BY KENNETH G. PRINGLE
January 8, 2024
FOLLOW-UP
Dominant No More
Global steel production since 1905
U.S.
Japan
15
BARRON’S
China
ROW (Rest of World)
Baird analyst Ben Kallo, who has a Buy rating
on the stock, sees enough catalysts to drive
Tesla’s shares to $300, up about 25%.
2,000 million tons
Tesla Stock Has Doubled.
Where It’s Headed Next.
1,500
1,000
500
0
1900
1950
2000
Here’s the bull and bear cases on the
electric-vehicle maker’s stock.
Sources: U.S. Geological Survey, International Iron & Steel Institute
For personal non-commercial use only. Do not edit or alter. Reproductions not permitted.
To reprint or license content, please contact Barron's reprints department at 800-843-0008 or www.djreprints.com
BY AL ROOT
popular midcentury phrase, “Rooting
for the Yankees is like rooting for U.S.
Steel.” The baseball team and the steel
maker were both successful but hard
to love.
U.S. Steel’s power and prestige
peaked in the 1940s and ‘50s, when it
helped build the U.S.’s World War II
war machine, and then aided in the
rebuilding of war-torn Europe.
But its output peaked at around 35
million tons and plateaued, even as
global steel production soared. Then, in
1970, the once unthinkable happened.
“[I]t seems clear that by now Nippon Steel is ‘ichiban’—the global
leader in the grey metal,” Barron’s
wrote on Sept. 14, 1970.
Nippon Steel, the same company
now proposing to digest U.S. Steel,
was created through the merger of
Japan’s two largest steel makers. Their
history also dates to 1901, when the
rapidly industrializing Japanese empire established its first modern blast
furnace in Yawata.
Dubbed the “Nipponese Pittsburgh” by The Wall Street Journal,
Yawata was soon producing 90% of
the nation’s steel, much of it used to
equip the modern, Western-style military that Japan fought with in World
War II. So essential was Yawata to
Japan’s war efforts, it was targeted in
strategic allied bombing campaigns.
Japanese industry was in ruins
after the war, but it rebuilt with modern, efficient technology. Between
1950 and 1970, Japan’s steel-making
capacity grew at an annual rate of 15%,
according to Barron’s, compared with
a 2.2% rate for the U.S. and Canada.
Amid a “business slowdown in the
U.S.,” Barron’s wrote, “here in the
Land of the Rising Sun, Nippon Steel
and other steel makers are expanding
like there’s no tomorrow.”
This was the start of the so-called
Japanese miracle economy, which
caused such teeth-gnashing in the
U.S., before it gave way to the Japan’s
“lost decade” of the ’90s.
F
oreign competition wasn’t
U.S. Steel’s only worry.
In 1969, a former car company turned nuclear-services
provider bought an electric arc furnace—a smaller, cheaper alternative to
traditional blast furnaces, like U.S.
Steel’s—and started making steel from
scrap metal in North Carolina. Earnings soared, and within a few years
the company renamed itself Nucor.
On the strength of its cheaper technology, Nucor is now the U.S.’s largest
steel maker, and 16th in the world,
producing 20.60 million tons in 2022.
Cleveland-Cliffs, which was outbid
for U.S. Steel by Nippon, is America’s
No. 2 at 16.8 million tons.
U.S. Steel’s output of 14.49 million
tons could be pushed to 20 million,
said Nippon Steel, which is targeting
100 million tons combined. That
would elevate the Japanese company
to No. 2 in the world, ahead of European-Indian steel maker ArcelorMittal (68.89 million tons), and
within shouting distance of industry
leader China Baowu (131.84 million
tons).
But the deal is no sure thing. The
Biden administration is calling for
scrutiny of the transaction, joining a
chorus of politicians and pundits
suddenly singing the praises of
America’s onetime corporate bully.
Rooting for U.S. Steel seems a lot easier these days. B
I
nvesting in Tesla requires wits, nerves
of steel, and a solid framework. That’s
more true than ever in 2024.
We recommended buying Tesla
stock in January 2023, arguing, in part, that
declines linked to Elon Musk’s purchase of
Twitter, now called X, and electric-vehicle
price cuts were overdone. That turned out
to be a good call. Coming into Friday trading, Tesla stock was up about 110% from
that recommendation.
No one expected a double, but Tesla
stock is one of the most volatile stocks in
the market and led by an iconoclast. Shares
rarely do what is expected. Being able to
endure all that volatility is why nerves of
steel are required. Now the question is
whether to take the money and run or double down and bet on another big year.
The sell case is strong. Bernstein analyst
Toni Sacconaghi, who called Tesla a short
in a December report, points out that this
year’s earnings estimates fell by half, even
as the stock doubled last year—an odd situation he sees reversing. He predicts weakening demand, a result of the fact that Tesla
has only two cars widely available to buy,
the Model 3 and Model Y.
Tesla
(TSLA / Nasdaq)
$350
300
250
200
150
100
Jan. 2023
Source: FactSet
’24
Analysts now expect 2.1 million vehicles
to be sold this year, up less than 17% from
2023. That’s far short of Tesla’s goal to grow
volume 50% a year on average. That growth
bogey would have required Tesla to eventually sell 3 to 4 million Model 3 and Y vehicles
a year, which is “completely unrealistic and
unanchored in basic market sizing data,”
says Sacconaghi, who has a Sell rating and a
$150 price target on the stock.
But the bull case is also strong. Baird
analyst Ben Kallo, who has a Buy rating on
the stock, sees enough catalysts to drive
Tesla’s shares to $300, up about 25% from
Thursday’s close. They include a low-price
model to help revive demand, a refreshed
Model Y, falling raw material costs, and
streamlined production. “We continue to
view Tesla as the EV leader and recommend it as a core holding for our coverage,”
Kallo writes.
Who’s right? Perhaps neither. Many
years ago a fund manager—a Tesla bull—
explained the way he managed his position.
When shares were beaten up, he would buy
more stock up to about 5% of his portfolio
value. When shares were soaring, he’d sell
his position down to 2%.
That seems sensible to us, and though
we, too, are long-term Tesla bulls, we believe this is the time to be at the low end of
the range. We already recommended selling
up to half of our position in June, when the
stock was trading above $250, leaving us
with roughly our original stake. With
shares still at similar levels, we see no reason to sell more.
Now, though, everything hinges on the
Model 2. Last quarter, China’s BYD sold
more battery electric cars than Tesla
mainly by selling cheaper vehicles. Tesla
has one coming—it has already announced
plans for a lower-priced EV—but when the
car will arrive is still a guess. Collecting
orders in late 2024 and seeing them on
roads in mid-to-late 2025 is a reasonable
guess.
Until then, we’re content holding what’s
left of our theoretical position. It rarely
pays to bet against the market leader, even
one as volatile as Tesla. B
16
BARRON’S
January 8, 2024
January 8, 2024
The New
Power Grid
Is Coming
BY AL ROOT
T
total cost of operating by not relying
on the grid.
Olivia gets something, too. By the
time she leaves work, her car has discharged about 40 miles worth of electricity, knocking $3 off her monthly
bill. She could have sold more, but she
wanted to make sure she had enough
left to get home.
Olivia’s car isn’t the only thing
responding to the heat wave. So does
her two-bedroom bungalow in a nice
suburban neighborhood, which uses
a heat pump to cool down. In an alert
on another app, she learns that the
electric company had lowered her
thermostat to 68 degrees in the morning, cooling her home ahead of expected peak demand. The utility then
set the thermostat to 75 degrees in the
afternoon, and reset it to 72 degrees
about an hour before she got home.
Olivia isn’t surprised—she elected
to allow the utility to change temperatures to get more favorable rates. Now
she’s thinking about adding solar panels and battery storage to her home
so she can sell power back to the grid
when demand is highest. There would
be an upfront cost, but her electricity
bill would drop even further.
Sure, it’s complicated—and Olivia
isn’t always a fan of the apps that keep
pushing alerts to her phone. It’s worth
it, though. Olivia spends less on electricity and gas than her parents did a
generation ago. Welcome to the grid
of the future.
Getting there won’t be easy. “The
grid” refers to everything that goes into
the production, storage, transmission,
distribution, and consumption of electricity, and it’s set to go through big
changes. Production of electricity will
have to increase as power-hungry data
centers proliferate along with EVs, and
as home heating and cooling go electric.
The sources of all that electricity will
shift to more renewable sources like
Illustration by Matt Chinworth
For personal non-commercial use only. Do not edit or alter. Reproductions not permitted.
To reprint or license content, please contact Barron's reprints department at 800-843-0008 or www.djreprints.com
What the changes will mean for utility
stocks—and your electricity bill.
he year is 2051
and newly married, first-time
homeowner
Olivia is driving
to work. (Olivia
was one of the
most popular
baby names in
2020, and she just turned 31.)
She parks her electric vehicle at an
office building at 6:45 a.m. and plugs
in her EV, getting a free charge at
work. About half of the vehicles sold
in the U.S. are still gasoline-powered,
but there are enough EVs that it
makes sense to get there early. Just
after lunch, Olivia gets an alert on
her phone that her car isn’t charging.
On this scorching July day, the electric company needs the energy to
meet peak cooling demand. She
understands—and also understands
the opportunity it offers, as she taps a
“sell” button on an app. Her car starts
to discharge electricity to the building’s battery, which will power the
lights and air conditioning during
peak hours, lowering the building’s
solar and wind, which will also necessitate more energy storage assets—
think batteries—as well as more-robust
transmission lines. Behind the curtain
will be more software and artificialintelligence tools coordinating it all.
For homeowners, it means more
complexity in exchange for a lower
total energy bill. For utilities, it means
growth. And for the companies that
17
BARRON’S
build grid infrastructure, make the
electrical hardware, and write the
software to control it all, it means big
opportunities.
Not much has changed for the
power grid over the past couple of
decades. The U.S. consumed about
4.2 trillion kilowatt-hours of electricity in 2022, a record, but overall demand has been sluggish—just 0.4%
growth annually since 2000. About
60% of that comes from burning coal
and natural gas. Another 20% comes
from nuclear power, with another
20% from renewable sources.
The subdued demand growth has
meant that the industry has been focused on the maintenance of existing
assets, and not investing for the future.
The transformers—those buzzing boxes
that convert voltage into levels that can
be used in homes and offices—are essentially identical to the ones used 20
years ago. The biggest change homeowners may have noticed is the automatic meters that have replaced the
monthly visits by a utility employee.
All told, publicly traded electric
utilities have spent some $134 billion
a year on average maintaining their
$2 trillion asset base, according to the
Edison Electric Institute, with few dollars going to drive the modest growth.
Such complacency won’t cut it
in the years ahead. Data centers are
growing as more data move to the
cloud. What’s more, AI computers
are power hungry, needing five or six
times more power compared with
their less-sophisticated computing
ancestors. Heat pumps, which are
replacing conventional heating and air
conditioning, shift demand from natural gas and heating oil to the grid.
While the transition away from internal combustion engines to EVs hasn’t
happened as quickly as some imagined, it’s still happening—and powering all of those cars will take a lot of
electricity. Right now, EVs account for
less than 1% of total electricity demand. That could be anywhere from
5% to 15% by 2050, depending on how
fast EVs get adopted.
All told, electricity use could grow
by 2% a year over the next decade,
ending years of stagnation. “I just
think we’re going to have massive
amounts of electrification everywhere,” says Reaves Asset Management CEO Jay Rhame. “Every utility
has a story where demand growth is
the highest it has been in forever.”
Demand isn’t the only thing that’s
changing—so is how electricity is produced. In the past, coal- or gas-fired
power plants would be cranked up as
needed to deliver electricity. For the
most part, it has worked. But that’s
about to change. New capacity is desperately needed—the Department of
Energy sees capacity expanding by
2.6% annually over the next 20 years,
about double the rate since 1990—
making the grid 70% larger. Roughly
70% of that will be renewable, a source
of energy that is more dependent on
climate conditions than fossil fuels.
Production will also be increasingly
decentralized. Utilities will still generate the bulk of the electricity, but it
will also come from a Walmart store
with a solar roof, a Tesla owner with
a backup battery, or a homeowner
with a standby generator made by
Generac Holdings. They’re all potential producers that will be able to send
electricity to the grid at times of peak
demand.
All of that is still very much a work
in progress. As unpopular as a local
utility might be when prices spike, the
U.S. grid is incredibly reliable. The
average American spends about six or
seven hours without power each year.
Decentralization could lead to more
price volatility, with electric-power
prices rising faster than inflation at
times, and customers will be forced
to deal with a less reliable grid, with
a neighborhood transformer going
down when too many EVs plug in all
at once—a problem that can be addressed with newer, more sophisticated equipment.
In the worst-case scenario, the result looks a lot like Texas in February
2021, when millions of residents lost
power for as many as four days, due
to severe cold. Both natural gas and
wind assets failed, with a lack of gas
production accounting for a significant portion of outages.
Some of the problems will be
solved by creating better infrastructure, including the development of
higher-capacity cables, which would
add transmission capacity without
increasing the number of transmission towers needed, and updated
hardware designed to handle the ebbs
and flows of demand. Texas, for its
part, didn’t cast aside renewable energy after the blackout. Instead, it
reassessed margins of safety and
updated forecasting and interdependence methodologies.
The grid has “got to be slightly bigger, but a lot smarter,” says Thierry
Godart, general manager of Eaton’s
Energy Automation Solutions unit,
which sells hardware and software
ranging from smart electric meters to
automation software and predictive
analytics.
The industry already employs complicated acronyms, including Droms,
Derms, and VPPs, for the kinds of software it needs to handle the grid of the
future. Droms is short for “demand
18
BARRON’S
January 8, 2024
Feeling Electric
The electrification of everything means big business for utilities and other stocks.
Company / Ticker
Recent
Price
52-Wk
Change
American Electric Power / AEP
$82.98
-15%
$43.6
14.5
Serves states with growing populations
Eaton / ETN
237.84
55
95.0
24.2
Sells hardware and software to make the grid work
72.13
10
27.6
13.9
Benefits from California’s embrace of EVs and the increased demand for power it brings
324.80
40
17.4
20.2
Invented the plug in the 1800s, now provides electrical components for utilities
61.53
-27
125.9
17.8
Largest generator of renewable power in the U.S.
Edison International / EIX
Hubbell / HUBB
NextEra Energy / NEE
Quanta Services / PWR
Market
Value (billion)
2024E
P/E
Description
208.63
53
30.3
25.9
Builds electrical infrastructure in the U.S.
Schneider Electric / SBGSY
39.06
38
112.4
21.5
Develops software and systems for managing electricity at the home and at the utility
Sterling Infrastructure / STRL
83.95
178
2.6
18.7
Constructs data centers and other infrastructure in the U.S.
For personal non-commercial use only. Do not edit or alter. Reproductions not permitted.
To reprint or license content, please contact Barron's reprints department at 800-843-0008 or www.djreprints.com
Note: E=estimate
response optimization and management systems,” which can change the
thermostats in houses to manage electricity demand when the grid is under
strain. The more sophisticated systems
include demand forecasts and logic to
precool homes so there is no spike in
demand following a weather event.
Derms, short for “distributed energy
resource management systems,” can
orchestrate the growing number of
distributed generating assets, including
solar roofs, businesses with their own
generators, and even battery storage
owned by anyone. VPPs, or virtual
power plants, will aggregate megawatts
of electricity generation from things
such as solar panels on top of a Walmart and sell them to a utility.
“It isn’t about putting in poles and
wires,” says AutoGrid CEO Ruben
Llanes. “Optimization and efficiency
are very important.”
Over the next 30 years, some $9
trillion, or about $300 billion a year
on average, should be spent adding
generating, transmission, and distribution assets while upgrading inhome technology such as smart metering, connected thermostats, and
smart, connected circuit breakers.
Some of that will be spent by businesses looking to cut their utility bills,
and some will be spent by homeowners adding solar panels to their
roofs or adding batteries and backup
generators to ensure they never go
without power. Most of the spending
will fall to the existing utilities and
independent power companies.
U
tilities won’t mind. The grid
of the future will mean more
electricity to generate, distribute, and manage—and
faster growth than they have had in
the recent past. The capital spending
means sales and earnings growth as
Sources: FactSet, company reports
regulators allow utilities to earn a return on their outlays. NextEra Energy, with about 34 gigawatts of clean
generating capacity, is already the
largest producer of utility-scale renewable power in the U.S., with
roughly 10% of total U.S. nonnuclear
renewable capacity.
More important for investors, it
has grown earnings at a rate of about
11% a year on average for the past
three years. While Wall Street projects growth to slow to about 7% for
the coming three years, that slower
growth may already be reflected in the
stock, which trades for 18 times estimated 2024 earnings, down from a
three-year average of almost 26 times.
Edison International should
benefit from being based in California,
an early adopter of renewable energy.
California means wildfire risks, something that has kept a lid on valuations
for utilities based in the state, but
more than 20% of all the cars sold in
the state during the first three quarters of 2023 were all-electric, which
should drive demand for electricity.
Edison International’s earnings are
expected to grow at an 8% clip over
the next three years, up from 1% annually over the past three. Shares
trade for about 14 times earnings,
in line with historical levels.
American Electric Power, one of
the largest utilities in the U.S., serves
more than five million customers
across 11 states, including Oklahoma,
Texas, and Tennessee. Those states are
among the fastest-growing, and power
demand is increasing with the population. That provides AEP with a kicker,
with the utility expected to grow at
a 6% annual rate over the next three
years, about the same as the past three.
It trades at 15 times 2024 earnings,
down from an average of 18 times.
Growth has already started to show
up for the established suppliers of
electrical components and software,
including Hubbell, Eaton, and
France’s Schneider Electric. Those
opportunities are starting to be reflected in the stocks. Hubbell, a key
supplier of transmission and distribution equipment to utilities, has grown
earnings at an average annual rate of
about 26% a year for the past three
years, including fourth-quarter estimates for 2023, but is expected to grow
by just 8% over the next three years.
That is probably a conservative
view. Mizuho Securities analyst Brett
Linzey, who has a Buy rating and
$370 price target on the stock, expects
the inventory adjustments that hurt
volumes in 2023 to have normalized in
the fourth quarter, which should help
earnings beat consensus estimates.
Other stocks benefiting from that
dynamic include Schneider Electric,
which has grown earnings at about
22% a year on average for the past
three years but is expected to grow
them at a 10% clip over the next three,
and Eaton, which has grown earnings
Burning Up
As of 2022, about 60% of electricity in the U.S. came from
fossil fuels and 40% came from renewable energy sources,
including nuclear.
Electricity generated in the U.S.
Solar (3.4%)
Other (2.5%)
Hydropower (6.0%)
Wind (10.3%)
Natural Gas (39.9%)
Nuclear (18.2%)
Coal (19.7%)
Source: U.S. Energy Information Administration
at 29% a year for the past three years
but is expected to grow by just 9%.
The expectation that growth will
return to normal is playing out at infrastructure companies that will build
out the grid, too. Quanta Services
has grown earnings at about 23% a
year on average for the past three
years, but analysts project growth of
16% for the coming three years. That
solid growth is reflected in the stock,
which trades for about 24 times
estimated 2024 earnings. Likewise,
Sterling Infrastructure provides
building services for data centers,
transportation, energy, and other customers. It has grown earnings at 40%
a year on average for three years, but
Wall Street sees that falling to about
12% a year. Sterling shares are up
120% over the past 12 months, but the
stock trades at less than 17 times 2024
earnings per share.
Clough Capital Partners CEO
Vincent Lorusso is a fan of Sterling.
“They are just so well positioned in
areas where [the U.S. is] going to continue to invest a lot of capital,” he says.
Wall Street sees earnings growth
decelerating at Hubbell, Eaton,
Schneider, Quanta, and Sterling. That
doesn’t mean they have peaked, just
that analysts are loath to assume good
times last forever and tend to project
normalized results into the future.
Don’t expect rooftop solar stocks
like Sun Power and Sunnova Energy International to get the biggest
boost from the grid of the future.
There is roughly 40 to 50 gigawatts of
small-scale solar generating capacity
in the U.S., representing some 3% of
total U.S. generating capacity, and the
$2.7 billion in sales expected to be
generated in 2024 is a tiny portion of
the hundreds of billions spent growing and maintaining the grid. What’s
more, neither stock is profitable, and
neither generates free cash flow yet.
They are also as dependent on interest
rates and capital markets to fund their
growth as they are on the grid.
First Solar, on the other hand, is a
leader in utility-scale solar technology.
It has a market capitalization of about
$18 billion and is profitable. Sales and
earnings are expected to grow at about
25% and 60% a year on average, respectively, over the coming three
years. Shares trade for just 13 times
estimated 2024 earnings because sales
and earnings tend to be cyclical and
tied to government policy.
The grid of the future could make it
a winner. B
For personal non-commercial use only. Do not edit or alter. Reproductions not permitted.
To reprint or license content, please contact Barron's reprints department at 800-843-0008 or www.djreprints.com
January 8, 2024
BARRON’S
ALPS International Sector Dividend Dogs ETF (IDOG)
LEARN MORE | alpsfunds.com | 1-866-759-5679
An investor should consider the investment objectives, risks, charges and expenses carefully before investing. To obtain a prospectus
containing this and other information, call 1-866-759-5679 or visit www.alpsfunds.com. Read the prospectus carefully before investing.
Shares of ETFs are bought and sold at market price (not NAV) and are not individually redeemable.
All investments are subject to risks, including the loss of money and the possible loss of the entire principal amount invested. Additional information
regarding the risks of this investment is available in the prospectus. The Fund is subject to the additional risks associated with concentrating its
in non-US issuers may involve unique risks compared to investing in securities of US issuers, including, among others, less liquidity generally, greater
developments could undermine the value of the Fund’s investments or prevent the Fund from realizing the full value of its investments. Finally, the value
investment to US investors.
ALPS Portfolio Solutions Distributor, Inc. is the distributor for the Fund.
Not FDIC Insured • No Bank Guarantee • May Lose Value
19
20
BARRON’S
An Interview With Michael Lippert
Portfolio Manager, Baron Capital
Q&A
Faster for
Longer? That’s
Amazon, Nvidia
L
For personal non-commercial use only. Do not edit or alter. Reproductions not permitted.
To reprint or license content, please contact Barron's reprints department at 800-843-0008 or www.djreprints.com
BY LAUREN FOSTER
ike most portfolio managers
at Baron Capital, Michael
Lippert buys growth stocks
with sustainable competitive advantages. He looks
for companies shaped by
durable secular trends that
will play out over many years. His
investment maxim: faster for longer.
It has been a winning strategy for
Lippert, a former lawyer who joined
Baron in December 2001 as an analyst,
and took the helm of the Baron Opportunity fund in 2006. The fund,
which now has $1.1 billion in assets, has
notched an average annual return of
17.6% in the past 15 years, outperforming 93% of its large-growth-category
peers, according to Morningstar.
Baron Opportunity has an all-cap
mandate, although its five biggest
holdings—Microsoft, Nvidia, Tesla,
Amazon.com, and Meta Platforms—
are megacaps. But lesser-known companies, including Gartner, CoStar
Group, Rocket Pharmaceuticals,
Guidewire Software, and Trade
Desk, drive returns, as well.
Barron’s recently spoke with Lippert,
who also co-manages the $9 million
Baron Technology fund, about his
investment philosophy, secular growth
trends, and the outlook for Amazon,
Nvidia, and other holdings. An edited
version of the conversation follows.
Barron’s: Describe your investment
approach.
Michael Lippert: We are long-term
investors. We invest in what I call
secular growth, as opposed to cyclical
growth. These are bigger trends or
themes separate from the ups and
downs in economic, industry, and
geopolitical cycles.
I often talk about these trends
as generational, tectonic shifts.
They’re big things. They’re undeniable. They’re going to play out for
a very long time. These themes are
common—we aren’t the only ones
who think of them. It’s the stockpicking within these themes, the
weight of these themes within the
portfolio, that drives success.
What are some of these themes?
Cloud computing; software as a
service, or SaaS; artificial intelligence;
cybersecurity; autonomous driving;
genomics; genetic medicine; digital
media; and connected TV, among
others. The themes have been consistent for many years.
AI feels new to a lot of people, and
generative AI became known only
when ChatGPT came on the scene
just over a year ago. But we have been
investing in AI for many years. It
used to be called big data. The biggest
inflection point over the past year
was generative AI.
What do you look for in companies?
We own fewer than 50 companies, so
Baron Opportunity is a high-conviction
Photograph by WINNIE AU
January 8, 2024
January 8, 2024
21
BARRON’S
“Nvidia is trading at mid-20 times one-year-forward estimated earnings. It isn’t
an expensive stock.”
Michael Lippert
fund. I look for where the growth
will be. I’ve long thought that the
best companies in the world—the
best investments—are businesses
that can grow faster for longer.
The key characteristic is whether
a company has a durable, competitive
advantage that it can lean into. It also
has to have the right management team.
Companies that have grown faster for
longer include Amazon.com, Alphabet’s Google, Microsoft, and Apple.
Amazon started life as an online
bookseller. We were worried about
competition from Barnes & Noble. It
took many years before Amazon became the online-everything store. It
then differentiated itself not only on
product assortment and price, but also
on logistics or delivery, getting the
product to your door the next day or
the same day. Half of U.S. households
have Amazon Prime.
Today, more than half of Amazon’s
value comes from Amazon Web Services. It is the world’s leading provider
of cloud computing, and one of the
most—if not the most—influential
businesses in information technology.
We like companies that can do more
than one thing. The first act might be
a single product or service. You need
a good first act, but the best companies
in the world have a second act, a third
act. They continue to expand.
Amazon shares gained more than
80% in 2023, to about $150. Is this
a good entry point for investors
who missed that rally?
Solid returns are in the picture for
the next three-to-four years. We value
Amazon on three methodologies:
GAAP [generally accepted accounting
principles] earnings; free cash flow
less principal repayments; and sumof-the parts, including advertising, the
international retail business, and
AWS. Our 2024 expected year-end
return is in the mid-single digits. Our
longer-term return analysis gets us
more into the mid-double digits, a
little bit less than 15%.
What is an example of a multipleact company you own that isn’t a
household name?
I’ve been an investor in CoStar Group,
a provider of information, marketing,
and related services to the commercial
and residential real estate industries,
for more than 20 years. When I joined
Baron Capital, one of the first companies I was asked to analyze was CoStar.
It was already in the portfolio, and it
is still a top 10 position in the fund.
We’ve made a roughly 20% annualized
return on our investment.
CoStar is a poster child for second,
third, fourth, fifth acts. It sold information—big data—in commercial real
estate. Then it moved into other areas
of the real estate world and expanded
to marketing. It now owns apartments.com and is getting into residential real
estate with homes.com and trying to
compete with Zillow, which has been
the dominant player for 10 to 15 years.
The CEO, Andy Florance, is focused
on finding the next opportunity.
The stock had a volatile year. Why?
It has often been a roller-coaster ride,
but the long-term trend is up and to the
right. Pretty much every time Andy
and his management team have announced a new investment, the stock
has gone down. Investors overreact to
the possibility that the company will
penalize short-term profits, when in
fact it is maximizing long-term profits.
When we measure the total addressable markets, or TAMs, the company
is going to be at least a mid-to-high
double-digit top-line grower for the
next five years, and potentially longer.
Future Ebitda [earnings before
interest, taxes, depreciation, and
amortization] margins—a measure of
a company’s operating profit as a percentage of its revenue—will reach the
mid-40% range. The business has low
capital intensity, so most of the Ebitda
will yield free cash flow. CoStar has a
strong balance sheet.
At some point, if there is nothing
left to acquire, there will be a significant amount of cash flow they can
return to shareholders. The best
example of a company doing that
is Apple. It consistently buys back
shares with the cash flow it generates.
Apple was the first stock to hit a $3
trillion market capitalization. You
sold your Apple shares in 2018 and
don’t own any. Do you regret that?
The regret is simply the returns they
have been able to generate. I thought
Apple had gotten to a point where it
was no longer a leading innovator, and
therefore no longer a leading growth
company, but making more incremental innovations and having lower
growth. The one thing I missed was
how they have been taking advantage
of their balance sheet and cash flow to
buy back a lot of stock.
Apple is no longer a particularly
innovative company. But it has the
most important platform. It controls
that platform soup to nuts, selling the
hardware and the software. That ecosystem is growing, but at a slower rate.
Most people are replacing an Apple
device with another: You get a new
Mac or iPhone. But most of the significant innovation in the mobile ecosystem, frankly, they missed. For example,
music is dominated by Spotify.
Netflix has also been on a winning
streak, but you don’t own it. Why?
I owned Netflix for a long time and
achieved solid returns after it shifted
to streaming video and original programming. I sold the stock in April
2022. I believed that streaming video
had won, but that the competitive
landscape was different. Everybody
else was getting into the business.
Apple and Amazon are spending
an inordinate amount of money in
media and don’t need to create a business there. They can run it as a loss
leader. Most people have multiple
apps on their TVs, like we have multiple apps on our iPhones or iPads. People pick the show, they don’t say, “I’m
going to watch Netflix.” Netflix will be
the winner in streaming video. It is
the No. 1 pure play. But growth is far
slower than it had been.
Yet, the stock was up nearly 70%
last year.
Netflix did well because of “paid
sharing” for U.S. subscribers. But
paid sharing sounds like a one-time
change. What’s next for the company?
Netflix isn’t a cheap stock on consensus numbers, trading at 37 times
2024 estimated enterprise value to free
cash flow, and 31 times non-GAAP
earnings. It is collecting free cash flow
and will return capital to shareholders.
Were I running more of a durable-type
fund, as opposed to the Opportunity
fund, which is more laser-focused on
secular growth and higher-growth-type
companies, I would consider owning
companies like Netflix and Apple. I own
Apple in the Baron Technology fund.
Nvidia is your second-largest holding, up 240% in 2023. Are you still
bullish on the stock?
Absolutely. Nvidia is trading at
mid-20 times one-year-forward estimated earnings. It isn’t an expensive
stock. The business has exploded, and
everyone is trying to focus on the sustainability of that new level of business. We don’t think AI is a hype cycle. There is a fundamental change in
the way computing is being done and
the way we’re able to use generative
AI to take even further advantage of
our data. We have been investors in
Nvidia since 2018. It is one of the most
amazing companies I’ve ever seen. If
you asked me to rank the top CEO I’ve
dealt with in my career, I would put
Jensen Huang at the top of that list.
What is another stock you like?
We have invested in Guidewire Software since its initial public offering
in 2012. It is the leading software provider to the property and casualty
insurance industry. It is a large but
slower-moving industry, certainly
in adopting new technology.
When Guidewire first came public,
it sold on-premise software and converted a lot of P&C insurers from old
software. The stock did well. But the
company realized it had to migrate
to the cloud, which took longer than
expected. In 2019, Guidewire hired
Mike Rosenbaum from Salesforce as
CEO. Today, it is a cloud vendor. The
competitive market environment is
favorable because a few of the other
cloud vendors have been bought by
private-equity players, and you don’t
see the same investment there. We
believe that Guidewire’s stock will be
a high-teens, low-20% returner over
the next three-to-five years.
Thanks, Michael.
B
BARRON’S
THE EC ONOMY
The slow and uneven rollout of artificial
intelligence will limit its ability to meaningfully
boost productivity anytime soon.
For personal non-commercial use only. Do not edit or alter. Reproductions not permitted.
To reprint or license content, please contact Barron's reprints department at 800-843-0008 or www.djreprints.com
Why AI Won’t Rescue
The Economy From
Weak Growth
A
rtificial intelligence is
taking off, boosting
the stock market and
generating plenty of
buzz about new leaps
the technology may
bring. Stocks such as
Nvidia, Microsoft, Palantir Technologies, and others have seen their
valuations lifted substantially because
of AI.
But there’s one area where it will
undoubtedly take a long time for AI to
have a major effect: the economy. The
technology almost certainly won’t be
used widely enough to produce a
boost to overall productivity for another few years, at least.
“The potential is enormous—60%
to 70% of all the work we do now
could already be automated with today’s technology,” says Tera Allas,
director of research and economics at
McKinsey in London. “But on an
economywide level, it’s a little overhyped. The real question mark is
about adoption.”
McKinsey and others have come up
with estimates for how much AI
might boost productivity and economic growth over the long term.
McKinsey believes AI could add between 0.1 and 0.6 percentage point to
productivity growth each year, which
would generate similar advances in
economic growth rates.
For Goldman Sachs, the growth
effect could be as much as 1.5 percentage points with maximum adoption.
But realistically, it’s more like an average of 0.4 point over the next 10 years.
And it will take a while to build to
that; the impact will start much lower
BY BRIAN
SWINT
January 8, 2024
and eventually reach that average.
That’s unfortunate, because prospects for economic growth are particularly grim at the moment. In its December forecasts, the Federal Reserve
said it sees growth cooling to 1.4% this
year from 2.6% at the end of 2023.
Officials see only a moderate pickup
after that, remaining below 2% in
2025 and 2026. The long-term average
growth rate in the U.S. is around 3%.
“We don’t see as much upside to
GDP growth in the next two years
from generative AI,” says Goldman’s
Joseph Briggs. “It’s a second half of the
decade and 2030s story, at least from
a macroeconomic perspective.”
The economic promise of AI is that
it will bolster productivity, which is
the magic ingredient driving grossdomestic-product gains. As Nobel
Prize–winning economist Paul Krugman likes to say, productivity isn’t
everything, but in the long run it’s
almost everything.
One way to think about the size of
the economy is output per worker
multiplied by the number of workers.
The number of workers tends to
change slowly. Worryingly, in the U.S.
and other advanced economies with
aging populations, the share of the
working-age population is barely
growing, or it’s going down.
Analysts at McKinsey reckon that
productivity has been the main driver
of economic growth for the past three
decades. However, productivity gains
have cooled substantially since 2012.
Past booms in productivity have
been huge drivers of economic
growth—for example, with the introduction of steam power or the use of
electricity. Most recently, the advent of
the internet was huge. Arguably, former Federal Reserve Chairman Alan
Greenspan’s biggest claim to fame is
recognizing that productivity was picking up in the 1990s, which allowed him
to keep interest rates unusually low
because the economy could grow faster
without sparking inflation.
The gains from AI will be similar in
magnitude to previous major advances, McKinsey and Goldman say.
But they will be unevenly spread
across different industries. Technology firms are benefiting first. Nvidia
has been boosted by producing the
faster chips needed for AI; Microsoft
by helping to create and adopting
OpenAI’s ChatGPT. The next sectors
to benefit will probably be white-collar office jobs that involve repetitive
work, from computer programming to
legal services.
Eventually, AI will take a prominent
role in services such as retail or restaurants. McDonald’s said in December
that it will start applying generative AI
to its operations in 2024, which it says
will allow it to automate more order
stations and optimize food delivery.
But it will take much longer for AI
to benefit industries that require a lot
of manual labor—construction or
landscaping, for example. It isn’t that
those areas will be left behind by technological advances—experts reckon
that all parts of the economy will be
affected—but that the timeline for
effectively adopting AI is longer.
“What we’re seeing now is just the
first wave,” says Scott Likens, head of
global AI and innovation technology
at PwC. “Mass acceptance and mass
adoption of generative AI will start to
sharpen the curve.”
The underlying reason AI won’t be
giving a big lift to GDP anytime soon is
because its introduction will be slow
and uneven. On top of that, precise
predictions about how much AI will
help are hard to make with any degree
of accuracy, hence the wide ranges projected by McKinsey and Goldman.
Tangible growth benefits may require
more breakthroughs like generative AI.
“Productivity isn’t well understood, and it’s difficult to measure,”
says Neil Shearing, chief economist at
Capital Economics. “I would treat the
forecasts with a healthy dose of skepticism. If there’s an upside surprise to
U.S. growth in 2024, it will be because U.S. consumers are stronger
than expected.” B
email: brian.swint@dowjones.com
Illustration by Allison Vu
22
January 8, 2024
23
BARRON’S
I N C O M E I N V E ST I N G
Where to Find Dividends
In Europe and Japan
BY LAWRENCE C. STRAUSS
For personal non-commercial use only. Do not edit or alter. Reproductions not permitted.
To reprint or license content, please contact Barron's reprints department at 800-843-0008 or www.djreprints.com
F
or dividend investors looking to
broaden their portfolios beyond the
U.S., there are some good opportunities in developed markets like
France, the United Kingdom, and Japan.
Besides attractive yields, these stocks
often have cheaper valuations relative to
the U.S. market.
International equities, which yield 3.4%
on average, trade at 12 times normalized
earnings, according to J.P. Morgan Asset
Management, while U.S. stocks yield 1.6%
and fetch 16 times.
“Global dividend-paying stocks have
valuation support, very resilient fundamentals, and their dividends are growing
very steadily,” says Sam Witherow, a
London-based equity portfolio manager
at J.P. Morgan Asset Management.
Dividends in Europe fell sharply when
the pandemic started in 2020, as many
banks and other financial firms were forced
by regulators to suspend their payouts. But
dividends have rebounded strongly since
then, up roughly 60% across the board in
that region, according to Witherow.
The payout ratio for stocks globally—
that is, the percentage of company earnings paid out in dividends—bottomed at
about 35% in 2021 and is now in the low
40s, he says. “So, you have got a lot of
headroom for a dividend recovery.”
He adds, “Dividends have followed the
earnings, but they haven’t really played
catch-up that much in terms of the payout
ratio.”
Witherow points out that global
“higher-income stocks” have done well
overall during the past four 12-month periods following the Federal Reserve’s final
interest-rate hike at the end of a cycle, reflecting the “value plus defensiveness”
characteristics of those stocks.
Among the stocks he favors are
Legrand, a Limoges, France–based maker
of electrical equipment, which yields 2%,
and RELX, a U.K. digital media company.
The latter yields nearly 2%. That may not
seem like much, but the payouts are growing nicely, a key feature of any good dividend stock. Witherow expects RELX to
grow its dividend at a 9% annual clip over
the next five years.
The company provides various analytical tools such as LexisNexis, which is used
for legal documents, records, and news.
Legrand makes such gear as transformers and switches for data centers and other
clients. Witherow thinks the company can
grow its dividend at an 8% annual pace
over the next five years.
Japan is also well worth a look.
Dividends and stock buybacks in that
country have increased in recent years,
owing to various reforms enacted under
former Prime Minister Shinzo Abe.
“The 2015 corporate governance code
and the 2014 stewardship code are now
being enforced, leading to better governance,” according to a UBS research note.
Drew Edwards, a portfolio manager and
head of Japan value equities at GMO who
has been traveling to that country for the
past 30 years, says he sees “more of a
shareholder-centric governance model,
encouraging management to make better
use of capital and generate growth.”
That includes paying more dividends.
The MSCI Japan Index’s dividend yield
has been bouncing around, but it’s up
sharply since the beginning of this century
to about 2% recently.
John Tobin, a portfolio manager of the
MainStay Epoch Global Equity Yield fund,
says he’s finding plenty of potential dividend payers in Japan. One is Astellas
Pharma, which yields 3.9%.
“They have a nice diversified portfolio of
drugs across a variety of therapeutic areas,
with a couple of new drugs coming along
that have significant growth in the coming
years,” he says. The company’s main products include drugs for treating different
forms of cancer and kidney disease.
Those are good reasons for U.S. investors
to look for dividends overseas. B
Mentor the Next
Generation of
Business Leaders
Investing in Education, a program from Barron’s Group,
provides students with complimentary access to Barron’s
and MarketWatch digital content and experiential
learning resources thanks to our donors’ involvement
at more than 100 colleges, universities, and high
schools nationwide.
If you would like to promote financial proficiency and
philanthropically support a school of your choice,
please get in touch with BarronsEDU@barrons.com
to learn more on how to get involved.
© 2023 Barron’s Group & Dow Jones & Company, Inc. All rights reserved. 2EIIE6120
24
BARRON’S
T E C H T R ADER
This year’s CES will have 4,000 exhibitors, spread
across 2.5 million square feet of exhibit space, up
15% from 2023.
T
BY ERIC J.
SAVITZ
nightmare. There was less to see at
CES two years ago, when attendance
plunged on Covid fears, but at least
you could get a cab.
Over the years, CES has been the
launchpad for digital watches, camcorders, DVD players, and Atari Pong.
There were also spectacular misses like
3-D TVs and Quibi. This year, the story
will be the rapid emergence of artificial
intelligence software and hardware.
Here’s a rundown on what to watch
for at CES 2024:
Keynotes Galore: You can get a
sense of CES’ breadth by looking at the
long list of keynote speakers this year.
There are a couple of tech stalwarts—
Intel CEO Pat Gelsinger on Tuesday
and Qualcomm CEO Cristiano Amon
on Wednesday. Siemens CEO Roland
Busch gets the opening keynote Monday night, a spot once held for 12
straight years by Microsoft founder
Bill Gates. Walmart CEO Doug McMillon speaks Tuesday afternoon.
Also on the agenda are some unexpected choices: L’Oréal CEO Nicolas
Hieronimus will open proceedings
Tuesday morning. He’ll be talking
about “beauty tech.” Gail Boudreaux,
the CEO of Elevance Health, the
health insurer once called Anthem,
will give a Tuesday evening address
on digital health. Wednesday’s roster
includes Kisun Chung, the CEO of
HD Hyundai, one of the world’s largest shipbuilders.
But also note who isn’t keynoting
CES this year: auto makers. Internet
companies. Or any of the Magnificent
Seven. This show is a big platform, but
if you’re Apple, Amazon, Meta Platforms, Alphabet, Microsoft, Nvidia,
or Tesla, you can make news without
a glitzy keynote. (Nvidia is holding its
own virtual event on Monday, discussing AI PCs, cars, and other topics.)
AI Everything and Everywhere:
You don’t need me to tell you that AI
will be everywhere at the show. It’s
one of four themes laid out this year
by the Consumer Technology Association, the trade group that convenes
CES, along with mobility, sustainability, and “human security for all.” AI is
an amorphous idea for a trade show,
but you’ll see evidence of it everywhere, and it all starts with...
...Semiconductors: Intel, Advanced Micro Devices, Arm Holdings, and Qualcomm will all be active
at the show, talking about the AI PC,
among other topics. Computer hardware makers like HP, Dell, and Lenovo will be there, too.
Both the chip and PC companies
have been pushing the potential for
“AI at the edge,” the idea that AI software workloads can be handled by
laptops and mobile phones—that not
everything has to be in the cloud.
Synaptics, Silicon Labs, Mobileye,
Ambarella, MIPS, On Semiconductor, and Infineon will be there as
well, and they’ll all be talking AI.
AI for Cars: Cars, boats, tractors,
bikes, trucks, and other wheeled vehicles will fill up the Las Vegas Convention Center’s West Hall—CTA says
there will be more than 250 exhibitors
in the mobility category, including Mercedes, VinFast, BMW, Honda, Kia,
and Volkswagen. (Along with Tesla,
General Motors, Stellantis, and Ford
are skipping the show this year.)
There will be EVs and autonomous
cars and weird personal-transport
vehicles. There will also be a host of
updates about auto makers’ push for
“software defined vehicles.” And that
means AI chatbots inside your car.
Expect announcements on automotive AI from Intel, Arm, Nvidia, and
others. It’s all part of car makers’ push
to add premium services to the incabin experience—to make cars an
upgradeable platform attached to subscription fees and to wrest back control
of the cockpit from Apple and Google.
Handy Tips! If you like big TVs,
you should head to the convention
center’s Central Hall, where Samsung
Electronics, Sony, and TCL Technology will have massive booths. If
planes, trains and automobiles are
your thing, check out West Hall.
The weird stuff is in Eureka Park,
in the Venetian—these are tiny companies with card tables, not giant multimillion-dollar displays.
And did I mention that I’m moderating a panel on AI and content creation? That one is going to be the talk
of the show. B
Tech’s biggest show is pulling in new attractions. This year’s keynotes include the chief
executive of L’Oréal, a health insurance exec,
and the head of one of the world’s largest
shipbuilders.
Alex Wong/Getty Images
For personal non-commercial use only. Do not edit or alter. Reproductions not permitted.
To reprint or license content, please contact Barron's reprints department at 800-843-0008 or www.djreprints.com
CES Is Back. Expect
Big News in AI, AI, and
AI—and a Few Cars.
his coming week, a
ridiculous number
of people will be in
Las Vegas for the
annual extravaganza that is CES.
First held in 1967,
and originally known as the Consumer Electronics Show, the event
now covers so many technology segments and products that it’s either the
show about nothing or everything,
depending on your perspective. Expectations are that the crowd will top
130,000, which would make it the
largest CES since Covid-19, and by a
wide margin.
In the debut 1967 edition, which
was held in New York City, CES featured modern technological marvels
like turntables, TVs, and radios. This
year, the show will include cars, boats,
helicopters, computers, robots,
streaming services, digital ad services,
televisions, virtual reality headsets,
consumer appliances, semiconductors, the Goodyear Blimp, Mark Cuban, Linda Yaccarino, the Wu-Tang
Clan, Robert Downey Jr., and AI, AI,
and AI. There will be more than
4,000 exhibitors spread across 2.5
million square feet of exhibit space, up
15% from 2023. And that isn’t counting random private meeting spaces in
nearby Las Vegas Strip hotels.
I have a love/hate relationship with
the show. It’s a fantastic opportunity
to meet tech companies new and old,
to see inventive but often ridiculous
ideas, and to generally get up to speed
on trends. It’s also completely exhausting—with meetings from dawn
into the wee hours—and a logistical
January 8, 2024
For personal non-commercial use only. Do not edit or alter. Reproductions not permitted.
To reprint or license content, please contact Barron's reprints department at 800-843-0008 or www.djreprints.com
January 8, 2024
BARRON’S
25
26
BARRON’S
January 8, 2024
MARKET WEEK
January 1 through January 5, 2024
International Trader
P. 29
Charting the Market
P. 32
Striking Price
P. 30
Winners & Losers
P. 33
Inside Scoop
P. 31
Market View
P. 34
13D Filings
P. 31
Statistics
P. 35
Power Play
P. 31
MARKET PERFORMANCE DASHBOARD
Dow Jones Industrials
S&P 500
Nasdaq Composite
SPDR S&P Bank ETF (KBE)
52-wk: +11.40% YTD: -0.59% Wkly: -0.59%
52-wk: +20.59% YTD: -1.52% Wkly: -1.52%
52-wk: +37.42% YTD: -3.25% Wkly: -3.25%
52-wk: -1.25% YTD: -0.76% Wkly: -0.76%
37,466.11
4697.24
14,524.07
For personal non-commercial use only. Do not edit or alter. Reproductions not permitted.
To reprint or license content, please contact Barron's reprints department at 800-843-0008 or www.djreprints.com
Fed Whispers
The Fed’s December minutes released on Wednesday
confirmed rate cuts are coming. Chatters of an
“unusually elevated degree of uncertainty”
dampened hopes of how deep they might be.
$45.67
2%
Mixed Signals
The U.S. added 216,000 jobs in December, per data
released on Friday, but downward revisions of prior months
signaled a weakening labor market. The S&P 500 broke a
nine-week winning streak.
1
0
-1
-2
-3
Apple Peels Out
Apple shares fell more than 3% on Tuesday after analysts raised
an alarm over slowing iPhone sales. The drop marked a weak
start to 2024 for the so-called Magnificent Seven stocks.
Dividends Slashed
Walgreens Boots Alliance said on Thursday it was cutting its
dividend by nearly half as it pays down debt and improves its cash
position. Investors fled, sending shares down more than 5%.
-4
-5
Tuesday
Note: Markets were closed Monday for New Year’s.
THE TRADER
Brace
Yourself for
A Rocky
Start. It
Shouldn’t
Last.
Wednesday
I
f the end of 2023 were a party
for markets, the first few trading days of 2024 have certainly felt like the hangover.
It may not be an entirely bad
thing if the headache is a result of investors rethinking
past decisions and planning to be
more responsible in the future.
Such a reassessment would explain
much of the first four trading days of
the year. After the so-called Magnificent Seven dominated headlines and
portfolios for much of 2023, the techheavy Nasdaq Composite slid 3.25%
on the week. Apple, down 5.9%, was
a particularly poor performer following a couple of analyst downgrades.
Losses in other indexes, where Apple
is a smaller weighting, were more
Thursday
Friday
Close
Source: Barron’s Statistics
BY
CARLETON
ENGLISH
muted, if still painful. The S&P 500
index slid 1.5% while the Dow Jones
Industrial Average fell 0.6%—snapping
a nine-week winning streak for both.
If falling yields helped drive markets higher last year, their rise this
past week couldn’t have helped. The
10-year Treasury, for one, ticked above
4% by week’s end as traders tried to
gauge what Friday’s nonfarm payrolls
data implied about the Federal Reserve’s path on interest rates.
At first blush, employment data
for December looked strong, with the
economy gaining 216,000 jobs on
the month, above the consensus for
173,000. Unemployment also held
steady at 3.7%. But a look below the
surface showed weaknesses: Job gains
for October and November were cut by
a combined 71,000. The mixed message whipsawed the market, which
couldn’t decide whether it meant that
the Fed would hold rates steady for
longer to subdue a too-hot economy, or
cut rates as it managed a soft landing
before the cracks in the labor market
turned into fractures.
That uncertainty could lead investors to shy away from making any big
moves during the first few weeks of the
year. “There is nothing on the charts or
in the data that suggests the markets
are finished [with] their correction,”
writes Guy Ortmann, senior technical
analyst at R.F. Lafferty & Co. “Caution
remains the name of the game, as more
downside appears likely.”
But a weak start to the year doesn’t
portend weakness for the full year.
January 8, 2024
Even when the S&P 500 ended each of the
first four trading days of the year lower—a
feat it managed to dodge this past week, but
which has happened twice since 1928—it
finished the year with gains both times.
Earnings season, which kicks off next
Friday with big banks, airlines, and healthcare stocks all reporting, could determine
whether the downdraft continues or not.
What CEOs say about 2024 will probably
matter more than fourth-quarter numbers,
particularly with the market expecting profits to grow by 11.6% in 2024.
With a bit of luck, the hangover will be
over by then.
The Kingdom Gets Its Magic Back
For personal non-commercial use only. Do not edit or alter. Reproductions not permitted.
To reprint or license content, please contact Barron's reprints department at 800-843-0008 or www.djreprints.com
27
BARRON’S
Walt Disney is caught in a contentious
battle with multiple activist investors.
Shareholders should come out ahead
no matter who the winner is.
Right now, there are no fewer than four
activists taking aim at the House of Mouse.
That should come as no surprise, given that
Disney stock has lost more than half of its
value since hitting a record high in March
2021. It isn’t all contentious, though. Just
this past week, Disney entered into an
information-sharing agreement with one
activist, ValueAct Capital, which is also
pledging to support Disney’s board slate,
while rival Blackwells Capital appears
sympathetic to management but is pushing
three of its own directors. Trian Fund Management is the most belligerent—it’s seeking two board seats and lambastes Disney
for “continued poor performance.” It has
an ally in Ancora Holdings.
That’s a lot of drama—even for the entertainment conglomerate behind the Marvel Cinematic Universe. There’s likely to be
even more mudslinging over the next few
months. Proxy fights, especially ones with
multiple actors, are expensive and can be
distracting to management. But in this
case, it may be just what Disney needs.
Disney has already responded to activist
pressure. Early last year, amid the first salvo
from Trian, Disney announced $5.5 billion
in cost cuts. That was enough to keep Peltz
at bay, until performance continued to languish, forcing Disney to announce an additional $2 billion in cost cuts in November
and its intention to reinstate its dividend.
Trian still wasn’t placated, but the announcement sent Disney stock up 6.9%.
Change should keep coming, whether it’s
board refreshment, improved succession
planning, or tying executive pay to financial
performance, as Trian has demanded.
“Having a constructive activist partner can
be a good thing,” says Guggenheim Partners analyst Michael Morris, who has a
$115 price target on Disney stock, up 27%.
Morris sees Disney’s gains coming
through improving the performance of its
content slate. Disney, like most media companies, was “overserving” its customers in
the earlier phases of its streaming ambitions,
pursuing growth at any cost. The writers’
strike may have leveled the playing field for
providers, forcing them to be more disciplined with their spending as production
ramps up. Disney also has an enviable catalog of movies—one that parents will pay up
for—that should give it an advantage. “Disney has the unique power of its intellectual
property and franchises,” Morris says.
Its stock also looks like a compelling
value. At 19.8 times forward earnings, it
trades roughly on par with the S&P 500 and
well below its five-year average of 29.4 times,
though getting back to that level is probably
wishful thinking. Still, the average analyst
surveyed by FactSet sees shares climbing
12.5%, which could prove conservative.
This early in proxy season, it’s tough to
know just who will prevail in the battle for
the future of Disney. Just know that the journey back to the Magic Kingdom has begun.
The IBKR
Mutual Funds Marketplace
The Interactive Brokers Mutual Fund Marketplace
provides our clients around the world with a large
availability of funds at low cost.
48,000+ funds worldwide
No transaction fees on 19,000+ funds
No custody fees
Neutral - no proprietary funds
Available globally
The best-informed investors choose Interactive Brokers
3 Bank Stocks That Stand to Gain
Bank earnings are coming, and once again,
it’s about the outlook, not the earnings.
ibkr.com/funds
Vital Signs
Friday’s
Close
Week’s
Change
Week’s
% Chg.
DJ Industrials
37466.11
-223.43
-0.59
Barron’s Future Focus
DJ Transportation
15508.67
-390.18
-2.45
Barron’s Next 50
898.67
+17.00
+1.93
Barron’s 400
1050.36
DJ 65 Stocks
12149.14
-100.83
-0.82
DJ US Market
1147.93
-19.79
-1.69
NYSE Advances
NYSE Comp.
16758.24
-94.65
-0.56
Declines
NYSE Amer Comp.
4600.53
+6.21
+0.14
Unchanged
35
50
S&P 500
4697.24
-72.59
-1.52
New Highs
137
373
S&P MidCap
2712.50
-69.04
-2.48
New Lows
32
16
2,771.8
DJ Utilities
S&P SmallCap
Nasdaq
Value Line (arith.)
Russell 2000
DJ US TSM Float
Friday’s
Close
Week’s
Change
Week’s
% Chg.
1009.87
-18.49
-1.80
3035.91
-94.32
-3.01
-22.04
-2.05
Last Week
1,080
Week Earlier
1,476
1,854
1,454
1270.66
-47.60
-3.61
Av Daily Vol (mil)
3,813.4
14524.07
-487.28
-3.25
Dollar (Finex spot index)
102.42
101.33
9746.36
-271.80
-2.71
T-Bond (CBT nearby futures)
121-30
124-30
1951.14
-75.93
-3.75
Crude Oil (NYM light sweet crude)
46929.95
-857.52
-1.79
Inflation KR-CRB (Futures Price Index)
Gold (CMX nearby futures)
73.81
71.65
265.91
263.83
2042.40
2062.40
Interactive Brokers
Rated #1 ... Again
Best Online Broker
2023 by Barron’s1
Rated Best
Online Broker 2023
for Mutual Funds
by Benzinga1
Member - NYSE, FINRA, SIPC – Supporting documentation for any claims and statistical information will be provided upon request.
[1] For more information, see ibkr.com/awards. Barron’s is a registered trademark of Dow Jones & Co. Inc. Mutual Funds are
investments that pool the funds of investors to purchase a range of securities to meet specified objectives, such as growth, income
or both. Investors are reminded to consider the various objectives, fees, and other risks associated with investing in Mutual Funds.
Please read the prospectus accordingly. This communication is not to be construed as a recommendation, solicitation or promotion
of any specific fund, or family of funds. Interactive Brokers may receive compensation from fund companies in connection with
purchases and holdings of mutual fund shares. Such compensation is paid out of the funds’ assets. However, IBKR does not solicit
you to invest in specific funds and does not recommend specific funds or any other products to you. For additional information
please visit ibkr.com/mutualfunds
06-IB23-1632
28
BARRON’S
January 8, 2024
Industry Action
Performance of the Dow Jones U.S. Industrials, ranked by weekly percent change.*
Telecommunications
4.61%
Health Care
1.77
Utilities
1.74
Oil & Gas
–0.21
–1.52
–1.74
COMMUNICATIONS SERVICES SECTOR
OF THE S&P 500 IN ONE ETF
Visit www.sectorspdrs.com or call 1-866-SECTOR-ETF
For personal non-commercial use only. Do not edit or alter. Reproductions not permitted.
To reprint or license content, please contact Barron's reprints department at 800-843-0008 or www.djreprints.com
An investor should consider investment objectives, risks, charges and expenses carefully before investing. To obtain a
prospectus, which contains this and other information, call 1-866-SECTOR-ETF or visit www.sectorspdrs.com. Read the
prospectus carefully before investing.
All ETFs are subject to risk, including possible loss of principal. Sector ETF products are also subject to sector risks and non-diversification risks, which generally
results in greater price fluctuations than the overall stock market. Ordinary brokerage commissions apply.
The S&P 500 is an index of 500 common stocks that is generally considered representative of the U.S. stock market. You cannot invest directly in an index.
ALPS Portfolio Solutions Distributor, Inc., a registered broker-dealer, is distributor for the Select Sector SPDR Trust.
–2.46
–2.66
–3.79
0.89
Financials
Basic Materials
Consumer Goods
Industrials
Consumer Services
Technology
Source: S&P Dow Jones Indices
Investors are hoping that bank executives
paint a rosy picture of the economy.
JPMorgan Chase, Citigroup, Bank
of America, and Wells Fargo are all set to
report this coming Friday, and investors will
be waiting with bated breath for signs that
2024 will be better than 2023. Remember
2023? It was the year that saw rising Treasury yields hammer the valuation of the
bonds that banks owned, forcing First
Republic Bank, Silicon Valley Bank, and
Signature Bank into receivership.
Still, the year looks to have ended on a
high note. Falling Treasury yields helped
to boost the value of bonds sitting on banks’
balance sheets and narrow their unrealized
losses. This was especially true for Bank of
America, which faced a hit of as much as
$130 billion. Bank stocks rallied in the last
three months of the year, with the KBW
Nasdaq Bank Index gaining 22.6%.
Unfortunately, the stocks may have gotten ahead of themselves. Earnings are likely
to be solid, as banks have benefited from
higher net interest income and generally
favorable credit trends, but the stocks will
have to deal with the impact of the Federal
Deposit Insurance Corp.’s assessment on
large and midsize banks to replenish the
deposit insurance fund. The one-time charge
could hit fourth-quarter earnings per share
by as much as 35% at large banks and 12%
at midsize banks, according to Janney Montgomery Scott’s Christopher Marinac.
Uncertainty around the direction of Treasury yields could also weigh on the stocks.
If they head higher after the fourth quarter’s
wild rally, portfolio fears could return. Or
the Federal Reserve could start cutting
rates—it’s likely to happen in March, according to the CME’s FedWatch tool—which
could cause net interest income to drop. Analysts at Goldman Sachs Group see a 3%
decrease for the year in net interest income,
coming off a 16% expected increase for 2023.
Credit quality could also be an issue. Consumers have remained resilient over the past
four years, with signs of borrower weakness
only just starting to show up at banks as
delinquencies and charge-offs hover around
prepandemic levels. It’s enough to keep
some investors on the sidelines as they fret
over how much worse things could get if
the economy weakens. Analysts at Keefe,
Bruyette & Woods are effectively neutral
on banks, warning that deteriorating credit
could cause earnings per share to drop by as
much as 25% across their coverage universe.
Against that uncertain backdrop, selectivity is essential, and KBW highlights KeyCorp, Webster Financial, and Goldman
Sachs as potential opportunities. KeyCorp
ended the year with a strong run-up, but
analysts see shares advancing a further 18%.
It was one of the first banks to post weak net
interest margins in 2023, but KBW analysts
expect that it will be among the first to benefit as interest rates—hopefully—stabilize in
2024. Meanwhile, investors get a 5.8% yield.
Webster often flies under the radar, with
assets of $73 billion at the close of the third
quarter. That could be a good thing, as the
bank is largely immune from an onslaught of
regulations expected to hit banks with assets
north of $100 billion. Its return on tangible
common equity is 21%,s and it trades at 1.7
tangible book value, roughly in line with its
five-year average. KBW analysts see shares
advancing 23%.
Finally, after being a punching bag for
much of 2023, Goldman could have a strong
year. Having shed much of its money-losing
consumer businesses, the slimmed-down
company can focus on what it does best:
investment banking. With rates normalizing,
deal activity and initial public offerings
should come back, which will get shares
humming again, with as much as 8% upside.
This year may be a bumpy one for banks,
but there’s still plenty of opportunity. B
January 8, 2024
29
BARRON’S
INTERNATIONAL TRADER
Chile’s Lithium Deal
Is Good News for EVs
BY CRAIG MELLOW
For personal non-commercial use only. Do not edit or alter. Reproductions not permitted.
To reprint or license content, please contact Barron's reprints department at 800-843-0008 or www.djreprints.com
C
hile’s government sneaked in
a last-minute New Year’s gift
for the coming generation of
electric-vehicle owners around
the world: a public-private partnership to
extend the life of the world’s cheapest
lithium basin by 30 years.
That would be the Atacama salt flats in
the high Andean desert, where local miner
Sociedad Química y Minera and U.S.based Albemarle produce a quarter of the
global supply of the essential mineral for
EV batteries. SQM’s concession was set
to expire in 2030. That will now move to
2060, as the firm enters a 50-50 joint
venture with state copper giant Codelco.
The deal marks a pragmatic tilt for
Gabriel Boric, the 37-year-old ex-student
activist who became Chile’s president in
2022, vowing extensive progressive reforms. He’s making common cause with
SQM’s dominant shareholder, Julio Ponce
Lerou, a son-in-law of late dictator Augusto Pinochet who was fined in a stock
manipulation scandal 10 years ago. “For
the government, Ponce has been considered a sort of devil,” says Juan Carlos Guajardo, founder of the Plusmining consultancy in Santiago.
Chile will need a lot more compromise
to fulfill its lithium destiny. The nation
of 20 million sits on the world’s largest
proven reserves. But exploration has been
constrained by a Pinochet-era law designating lithium a strategic metal, for its
presumed importance to nuclear energy.
Moves to scrap that statute have been
stymied by divisions between statists
and free marketers in Congress, says
Francisco Acuna, a Santiago-based
consultant with raw-materials specialist
CRU. “There’s a political paralysis around
lithium,” he says.
Australia has taken advantage to power
past Chile in production of the now-strategic metal. Neighboring Argentina should
surpass it by 2028, shrinking Chile’s global
market share to 15%, CRU projects.
Plenty remains unresolved on the
Atacama deal itself, which is still in
memorandum-of-understanding, or MOU,
stage. The current extraction method
there—sucking lithium brine to the surface and then letting the liquid evaporate
over a few months—could exhaust water
resources over the next 35 years. Sustainable exploitation depends on so-far unproved improvements like reinjecting
brine or “direct extraction” of metal from
underground deposits. “There’s guidance
in the MOU on ‘moving toward new technologies,’ but it’s very vague,” Acuna says.
Albemarle’s concession, in a different
section of Atacama, stretches until 2043.
So, it isn’t a primary concern for now. SQM
and Codelco will pool resources at a greenfield deposit called Maricunga. Production
there is years away, at best.
Argentina’s lithium prospects benefit
from that country’s federal structure,
which has given mining-friendly governors
in two northern provinces a free hand to
nurture investment. An obstacle, Acuna
notes, is the national government’s tangle
of currency controls, which can keep foreign investors from repatriating profit.
Just-elected pro-business President Javier
Milei may lack the political strength to
untangle them. “It will take a bit more time
to see if Milei can change course,” Acuna
says.
Consultant Guajardo, for his part, is
opening an office in Melbourne. “It looks
like Australia will do the right thing in the
current mining boom, while Latin American countries struggle,” he says.
Chile’s cost advantage may grow increasingly important as the lithium market
matures, though. Prices plunged 80% last
year to below $10,000 a ton. Guajardo sees
them settling at $20,000 to $25,000 over
the next decade. “Lithium is not a scarce
mineral, and that’s starting to be evident
on the supply side,” he says.
More good news for EV manufacturers
and drivers. B
Building Influence Through
Corporate Boards
January 30, 2024 | 1:00 PM ET
Women and underrepresented groups now hold
nearly 45% of board seats at Fortune 500 companies.
Join Medley Co-Founder; PepsiCo and Amazon Board
Director Edith Cooper and Korn Ferry Vice Chair
Jane Stevenson for a conversation about the role of
the modern board, their biggest business challenges
and how diversity can bring fresh perspectives to
corporate governance.
Register Now
events.barrons.com/levelup-jan
© 2023 Dow Jones & Company, Inc. All rights reserved. 4E6018
30
BARRON’S
January 8, 2024
T H E ST RIKING PRIC E
Curb Those Animal Spirits
Before It’s Too Late
Markets rise over time, though not in a straight
line, while strong returns rarely accrue to people who fail to question passing trends.
Equity Options
CBOE Volatility Index
VIX Close
The Equity-Only Put-Call Ratio
VIX Futures
Put-Call Ratio
S&P 500 Index
27
314
286
258
22
BY STEVEN M. SEARS
For personal non-commercial use only. Do not edit or alter. Reproductions not permitted.
To reprint or license content, please contact Barron's reprints department at 800-843-0008 or www.djreprints.com
E
very new year begins with pure
intentions. Most everyone vows to
be a better version of themselves
and to live a healthier life of action and consequence. Unfortunately, the
stock and options markets are immune to
the feel-good bromides that people like to
tell themselves.
The risks that plagued markets last year
have carried into 2024, with at least one
critical caveat that now seems poised to
define the new year—provided the regional
wars in the Middle East and Europe don’t
bring global powers into direct conflict.
The caveat? The Federal Reserve,
which raised rates so aggressively last
year, is widely expected to start lowering
rates this year.
All Barron’s readers know that, as do
even those who have little interest in financial markets. After all, the world has experienced unusually gentle financial conditions for almost 25 years. Generations of
people have been conditioned to think that
low interest rates are their birthright.
Decades of rising stocks have overpopulated the world with financial geniuses—
even in some unlikely places. A friend recently shared that staff, and residents, of a
homeless shelter in the Northeast are all
excitedly talking about day-trading stocks
and cryptocurrencies.
Some will view their enthusiasm as an
indication that they want to improve their
lot in life. Others will view it as a warning
that may prove as emblematic as the apocryphal 1920s shoeshine boy who liked to
pass out stock tips to his customers.
Anyone who wants to avoid homelessness must maintain what can best be described as skeptical bullishness. Markets
rise over time, though not in a straight line,
while strong returns rarely accrue to people who fail to question passing trends.
A key question for 2024 thus concerns
the federal-funds futures curve, which is
renowned for accurately predicting the
future of interest rates. As of now, it tells us
that rate cuts are expected in 2024. But we
find ourselves wondering if the investors
who influence the curve have become less
logical and more like the market mob. If
investor narcissism has polluted normally
clinical areas of the market, could the
curve’s prediction of rate cuts be distorted?
W
e recognize that it is near
heretical for an equity-oriented investor to question
the bond market. But it is
hard to understand why data-dependent
Fed governors would so quickly declare
victory over inflation without ensuring
that the economy’s strength isn’t transitory. Hence, pending meetings to discuss
rates might be more significant for the
stock market’s trajectory, and options volatility levels, than presently anticipated.
The Fed’s rate-setting committee concludes its first meeting of the year on Jan.
31 and its second meeting on March 20.
Investors who want to buy blue-chip
stocks at lower prices—and profit from any
gains—can consider a so-called risk-reversal trade on the SPDR S&P 500 exchange-traded fund, which entails selling a
put option and buying a call option with a
higher strike price but a similar expiration
date. The strategy monetizes investor fear,
subtle or pronounced, which is captured in
the put premium, but still profits if the
ETF gains.
With the SPDR S&P 500 ETF at
$467.92, investors can sell the April $450
put for about $6.15 and buy the April $485
call for about $7.25.
If the ETF is at $500 at expiration, the
call is worth $15. The strategy’s primary
risk is that the ETF falls far below the put
strike price. In that event, investors are
obligated to buy it at the put strike price or
to adjust the position to avoid assignment.
The approach is designed to put a leash
on the animal spirits that continue to define the markets after 2023’s extraordinary
stock rally. B
230
202
174
17
146
118
90
12
F M
A M
J
J
A
S
O
N
Daily Values
D
J
62
F M
A M
J
J
A
Source: CBOE
S
O
N
D
J
Source: McMillan Analysis Corp.
SPX Skew
NDX Skew
Implied volatility %
Implied volatility %
13%
11%
12
10
11
9
10
8
9
7
8
6
7
F M
A M
J
J
A
S
O
N
D
J
5
F M
Source: Credit Suisse Equity Derivatives Strategy
A M
J
J
A
S
O
N
D
J
Source: Credit Suisse Equity Derivatives Strategy
Skew indicates whether the options market expects a stock-market advance or decline. It measures the difference between the implied
volatility of puts and calls that are 10% out of the money and expire in three months. Higher readings are bearish.
Week’s Most Active
Company
Symbol
China Green Agriculture
CGA
Tot Vol
Calls
Puts
Avg Tot Vol
IV %ile
Ratio
2533
1914
619
4
97
633.3
Omega Therapeutics
OMGA
12146
8235
Voyager Therapeutics
VYGR
8757
7484
3911
136
98
89.3
1273
240
32
Dyne Therapeutics
DYN
19489
9813
36.5
9676
1092
95
Astra Space
ASTR
5721
17.8
5156
565
476
70
12.0
Mobileye Global
MBLY
Immunocore
IMCR
87718
45616
42102
10532
64
8.3
4823
4237
586
596
79
Inhibrx
8.1
INBX
6315
6128
187
824
97
7.7
Corcept Therapeutics
CORT
13631
9498
4133
1896
94
7.2
Zevra Therapeutics
ZVRA
7805
7646
159
1100
19
7.1
Torrid
CURV
9833
9757
76
1472
4
6.7
Safe Bulkers
SB
11194
5115
6079
1952
98
5.7
QuantumScape
QS
393486
286756
106730
69912
100
5.6
Sysco
SYY
17833
15611
2222
3192
25
5.6
MannKind
MNKD
23982
14566
9416
4452
24
5.4
Fluor
FLR
25002
22768
2234
4744
4
5.3
Lamb Wesson
LW
27281
16160
11121
6016
22
4.5
R1 RCM
RCM
3449
3261
188
832
89
4.1
American Superconductor
AMSC
12732
11288
1444
3184
86
4.0
Hawaiian Electric
HE
39257
18956
20301
10060
71
3.9
This table of the most active options this week, as compared to average weekly activity – not just raw volume. The idea is that the unusually heavy trading in these options might be a predictor of
corporate activity – takeovers, earnings surprises, earnings pre-announcements, biotech FDA hearings or drug trial result announcements, and so forth. Dividend arbitrage has been eliminated. In
short, this list attempts to identify where heavy speculation is taking place. These options are likely to be expensive in comparison to their usual pricing levels. Furthermore, many of these
situations may be rumor-driven. Most rumors do not prove to be true, so one should be aware of these increased risks if trading in these names
Ratio is the Tot Vol divided by Avg Tot Vol. IV %ile is how expensive the options are on a scale from 0 to 100. Source: McMillan Analysis
January 8, 2024
I N S I DE SC OOP
FedEx’s New Finance Chief
Bought the Stock’s Dip
F
For personal non-commercial use only. Do not edit or alter. Reproductions not permitted.
To reprint or license content, please contact Barron's reprints department at 800-843-0008 or www.djreprints.com
BY ED LIN
edEx stock dove after the
logistics firm reported disappointing earnings. The
new chief financial officer,
John Dietrich, bought
shares as they languished.
FedEx reported on Dec.
19 that fiscal-second-quarter earnings
per share and sales both missed expectations. The company maintained
EPS guidance for the fiscal year of
$17 to $18.50, but investors weren’t
allayed. FedEx stock dropped 12% the
next trading day to $246.25. On Dec.
26, FedEx announced an agreement
to buy back $1 billion of its stock from
Mizuho Markets Americas. News of
fewer shares outstanding usually provides a boost, but FedEx stock still
languished.
Dietrich paid $252,000 on Dec. 28
for 1,000 FedEx shares, an average
31
BARRON’S
price of $252.02 each. According to a
form he filed with the Securities and
Exchange Commission, Dietrich now
owns 4,745 shares.
FedEx didn’t make Dietrich available for comment. He became the
company’s finance chief on Aug. 1,
succeeding Michael Lenz, who retired
on July 31. Dietrich is a former CEO
of outsourced aircraft and aviation
firm Atlas Air Worldwide, which was
taken private last March.
FedEx’s stock-ownership guidelines state that members of senior
management are expected to own
shares valued at three times their annual base salary within five years of
joining the company. Dietrich’s annual
base salary is $919,000, according to
regulatory records, and the FedEx
shares he currently owns are valued
at about $1.2 million, but he still has
time to come into compliance with the
guidelines. B
Activist
Holdings
board representation is necessary
in response to the stock’s “persistent
underperformance” and Penn’s
“capital-allocation track record.”
Penn Entertainment
HG Vora Capital switched to an
active investor as it reported holding 14,500,000 shares of the gaming and entertainment company.
HG Vora owns exposure to an additional 13,500,000 Penn shares
through cash-settled swaps. When
combined with the common stock,
HG Vora owns a 18.5% interest
in Penn. HG Vora believes that
Penn’s stock “is significantly undervalued,” and believes that
Regis
Galloway Capital Partners owns
111,800 shares of the parent of
branded salons including Supercuts,
equal to 4.9% of the tradable stock.
Those figures account for Galloway
Capital’s purchase of 16,100 Regis
shares from Nov. 1 through Dec. 20 at
prices ranging from $6.08 to $12.04
each. In a letter addressed to Regis
CEO Matthew Doctor and Chairman
David J. Grissen dated Dec. 28, Galloway wrote that the stock is “signifi-
FedEx stock slid
in December after
a disappointing
earnings report.
Finance chief John
Dietrich bought
$252,000 worth
of shares of the
logistics firm.
cantly undervalued and requires
[Galloway’s] support and expertise
in creating shareholder value.”
Galloway noted that Regis has
formed a special committee to look
at “strategic alternatives,” which it
says isn’t necessary. Galloway cited
Regis’ recent success at cutting
expenses and transitioning into a
franchise system, moves that are
“certainly not reflected in the stock
price.” Galloway believes that it
“can bring strong insight and constructive actions,” and is thus seeking the addition of two representatives on Regis’ board.
Bloomin’ Brands
Starboard Value revealed a stake
of 8,441,000 shares of the parent
of Outback Steakhouse and Carrabba’s Italian Grill, equal to 9.7%
of the outstanding stock. On Jan. 2,
Starboard Value and Bloomin’
Brands entered into a cooperation
agreement that provided for the
appointment of two Starboard
Value–chosen directors, partner
John Sagal and former COO of
Darden Restaurants Dave
George. Along with their appointment, Bloomin’ Brands formed a
new operating committee of the
board, which George will chair and
Sagal will join. The agreement carries standard standstill provisions
that Starboard Value will abide by.
Increases in
Holdings
These disclosures are
from 13Ds filed with
the Securities and
Exchange Commission.
13Ds are filed within
10 days of an entity’s
attaining more than
5% in any class of a
company’s securities.
Subsequent changes
in holdings or intentions must be reported in amended
filings. This material is
from Dec. 28, 2023,
through Jan 3, 2024.
Source: VerityData
(verityplatform.
com)
SilverBow Resources
Riposte Capital raised its position
in the gas and oil explorer to
2,475,000 shares. From Dec. 20
through Dec. 29, Riposte Capital
bought 506,000 SilverBow shares
at per share prices ranging from
$28.08 to $29.78. Following the fresh
investment, Riposte owns a 9.7%
stake in the energy company. Riposte has been critical of SilverBow,
including its roughly $700 million
acquisition of Chesapeake Energy’s South Texas assets last year.
In November 2023, Riposte called
for a board refresh, including the
nomination of three new, independent directors, which it was “keen
to support or put forward.”
POWER PLAY
2024 May Be
Another Big
Activist Year
T
BY CARLETON ENGLISH
his year could be shaping up to be a big one for
activist investors if 2023
data are indications.
Amid a volatile market last year, there were
823 new activist campaigns launched globally, marking
a 24% increase from the prior year,
according to Bloomberg data. But
most investors weren’t aware of the
scope of the boardroom battles because many were at smaller companies and closed-end funds—both of
which aren’t prone to much media
attention.
Elliott Management was a standout in 2023. It launched 15 campaigns during the year, topping the
league table for campaigns at companies with market caps of more
than $1 billion. Three runner-up
funds shared the second place
spot, each having launched seven
campaigns.
Elliott also notched wins, replacing CEOs at some companies,
including Crown Castle, and
added 16 board seats at six companies through settlements, avoiding
costly proxy battles.
There’s reason to believe that
2024 will be just as active—for
Elliott and the activist community
at large.
So far, the biggest battle is brewing at Walt Disney, which has four
activists, including Trian Fund
Management and ValueAct Capital,
jockeying for changes at the entertainment conglomerate.
In any case, 2024 is shaping up
to be a choppy year for markets
as investors digest the Federal
Reserve’s path on interest rates.
Volatility often provides opportunities for activists to seize upon
price discrepancies to build their
positions. B
32
BARRON’S
January 8, 2024
CHARTING THE MARKET
Apple
QuantumScape
Rivian Automotive
Mobileye Global
AAPL (NASD) • $181.18 • -11.35
QS (NYSE) • $8.70 • 1.75
RIVN (NASD) • $19.08 • -4.38
MBLY (NASD) • $30.49 • -12.83
Barclays downgraded the iPhone maker from Equal
Weight to Underweight—saying that iPhone sales
are soft and service revenue could slow this year.
Volkswagen said that early samples of QuantumScape’s solid-state battery for electric vehicles
had exceeded expectations in tests.
December-quarter deliveries of the firm’s EVs met
most expectations, but declined from Sept. Investors
also sold other EV stocks, even on record deliveries.
March-quarter revenue will fall 50%, year over
year, warned the firm. Car makers have excess
inventories of its driver-assistance computer chips.
Stock Price $
Stock Price $
Stock Price $
Stock Price $
Volume in Millions
J
For personal non-commercial use only. Do not edit or alter. Reproductions not permitted.
To reprint or license content, please contact Barron's reprints department at 800-843-0008 or www.djreprints.com
A graphic look at selected stock activity
for the week ended on Jan. 5, 2024
Edited by Bill Alpert.
F
M
A M
203
14
34
51
187
12
29
42
171
10
24
33
155
8
19
24
139
6
14
15
123
4
9
482
J
J
A
S
O N
Volume in Millions
170
Volume in Millions
534
241
85
267
0
0
0
D
J
F
M
A M
J
J
A
S
O N
D
J
F
M
A M
J
J
A
S
O N
D
6
Volume in Millions
68
34
0
J
F
M
A M
J
J
A
S
O N
D
ASML Holding
SoFi Technologies
Omega Therapeutics
Moderna
ASML (NASD) • $703.34 • -53.58
SOFI (NASD) • $8.22 • -1.73
OMGA (NASD) • $4.39 • 1.38
MRNA (NASD) • $111.12 • 11.67
The Dutch government blocked the company from
exporting its leading-edge lithography systems to
China’s semiconductor manufacturers.
After rallying on hopes that the Fed will cut rates,
shares of the consumer lender were cut to a Sell
by KBW, which cited valuation and accounting.
Wegovy’s maker Novo Nordisk will team with the
firm to develop other obesity treatments, by controlling genes that govern the body’s metabolism.
Oppenheimer upgraded the stock from Hold to
Buy, saying the vaccine maker will expand beyond
Covid—to shots against RSV, the flu, and herpes.
Stock Price $
Stock Price $
Stock Price $
Stock Price $
Volume in Millions
J
F
M
A M
775
13
15
210
726
11
12
180
677
9
9
150
628
7
6
120
579
5
3
90
530
3
0
60
12
J
J
A
S
O N
Volume in Millions
562
Volume in Millions
98
6
281
49
0
0
0
D
J
F
M
A M
J
J
A
S
O N
D
J
F
M
A M
J
J
A
S
O N
D
Volume in Millions
54
27
0
J
F
M
A M
J
J
A
S
O N
D
Peloton Interactive
Medical Properties Trust
Walgreens Boots Alliance
Dyne Therapeutics
PTON (NASD) • $6.72 • 0.63
MPW (NYSE) • $3.55 • -1.36
WBA (NASD) • $25.01 • -1.10
DYN (NASD) • $17.96 • 4.66
Tik-Tok will create a workout hub with short-form
videos that exclusively feature content from the
supplier of home exercise equipment.
The real estate investment trust has hospitals as
tenants. One of them—the Steward Health Care
System—is $50 million behind on the rent.
To save $800 million in annual cash flow, the drugstore chain cut its dividend nearly in half—from 48
cents a quarter, to 25 cents. It will pay down debt.
Early phase trials of the firm’s drugs boosted
strength of patients with Duchenne muscular
dystrophy, by canceling faulty genetic instructions.
Stock Price $
Stock Price $
Stock Price $
Stock Price $
Volume in Millions
J
F
M
A M
19
17
42
21
16
14
37
18
13
11
32
15
10
8
27
12
7
5
22
9
4
2
17
6
192
J
J
A
S
O N
D
Volume in Millions
212
Volume in Millions
122
96
106
61
0
0
0
J
F
M
A M
J
J
A
S
O N
D
J
F
M
A M
J
J
A
S
O N
D
Volume in Millions
46
23
0
J
F
M
A M
J
J
A
S
O N
D
The charts record the net change in share price, the high, low and closing trades, and share volume for companies with noteworthy stock activity last week. In addition, the graphs depict last week’s daily price activity in detail. The dotted line on some graphs denotes the stock’s 200-day moving average; lack of a moving average means the shares have traded for less than
that time period. If the close from the current week is lower than a year ago the graph will be presented in red. If the close from the current week is higher than a year ago then the graph will be presented in green.
January 8, 2024
33
BARRON’S
W I N N E R S & LO S E R S
NYSE Biggest % Movers
NYSE Most Active
NYSE American Most Active
Winners
Volume Percentage Leaders
Volume Percentage Leaders
Name (Sym)
BrightHealth(BHG)
ZimIntShipping(ZIM)
WheelsUp(UP)
Beachbody(BODY)
TDCX(TDCX)
YirenDigital(YRD)
QuantumScape(QS)
ScullyRoyalty(SRL)
Volume
Close
Change
%Chg.
Name (Sym)
873
65911
7863
169
3140
1413
169098
186
11.47
14.59
4.93
11.25
6.33
3.91
8.70
7.35
+3.84
+4.72
+1.50
+2.96
+1.48
+0.79
+1.75
+1.25
+50.3
+47.8
+43.7
+35.7
+30.5
+25.3
+25.2
+20.5
Pinstripes(PNST)
PNM Resources(PNM)
BrightHealth(BHG)
ZalatorisAcqn(TCOA)
QuantumScape(QS)
PureStorage(PSTG)
OkeanisEcoTankers(ECO)
ScullyRoyalty(SRL)
DiversifiedEnergy(DEC)
AP Acqn A(APCA)
PyrophyteAcqn(PHYT)
ZimIntShipping(ZIM)
Cazoo(CZOO)
agilon health(AGL)
FranklinCovey(FC)
GlobalIndemnity(GBLI)
CallonPetrol(CPE)
SelectMedical(SEM)
RigelResourceA(RRAC)
Lazard(LAZ)
Losers
Name (Sym)
Volume
Close
Change
%Chg.
Pinstripes(PNST)
AnnovisBio(ANVS)
CanoHealth(CANO)
agilon health(AGL)
NuScalePower(SMR)
Perfect(PERF)
AvanosMedical(AVNS)
ForgeGlobal(FRGE)
1471
2222
1716
47583
7815
106
1592
2257
5.49
12.25
3.99
8.63
2.62
2.47
17.98
2.76
–5.41
–6.45
–1.88
–3.92
–0.67
–0.63
–4.45
–0.67
–49.6
–34.5
–32.0
–31.2
–20.4
–20.3
–19.8
–19.5
NYSE American Biggest % Movers
Name (Sym)
Name (Sym)
Volume
Close
Change
%Chg.
Polished.com(POL)
flyExclusive(FLYX)
QuantumFin(QFTA)
SkyHarbour(SKYH)
Oragenics(OGEN)
EllomayCapital(ELLO)
IndonesiaEnergy(INDO)
MexcoEnergy(MXC)
23392
208
8
109
145
5
138
21
7.50
6.75
7.42
11.36
6.14
16.30
2.95
9.73
+1.47
+1.25
+1.22
+1.70
+0.51
+1.35
+0.24
+0.60
+24.4
+22.7
+19.7
+17.6
+9.1
+9.0
+8.9
+6.6
Volume
Close
Change
%Chg.
1617
175
176
114
723
1635
172
1559
2.75
3.56
8.95
19.82
2.23
2.35
15.65
1.78
–1.23
–0.98
–2.04
–3.91
–0.39
–0.37
–2.46
–0.27
–30.9
–21.6
–18.6
–16.5
–14.9
–13.6
–13.6
–13.2
Losers
Name (Sym)
PalatinTech(PTN)
SifcoInd(SIF)
EmpirePetrol(EP)
EVI Industries(EVI)
DakotaGold(DC)
Cel-Sci(CVM)
ContangoOre(CTGO)
AmpioPharm(AMPE)
Nasdaq Biggest % Movers
NIO(NIO)
FordMotor(F)
PalantirTech(PLTR)
Pfizer(PFE)
BankofAmerica(BAC)
QuantumScape(QS)
ArcadiumLithium(ALTM)
AT&T(T)
Carnival(CCL)
Fisker(FSR)
Uber(UBER)
SouthwesternEner(SWN)
Verizon(VZ)
Citigroup(C)
Kenvue(KVUE)
NuHoldings(NU)
Barclays(BCS)
Snap(SNAP)
Alibaba(BABA)
GinkgoBioworks(DNA)
Name (Sym)
Name (Sym)
Volume
Close
Change
%Chg.
LongboardPharm(LBPH)
RevelstoneCapA(RCAC)
OmegaTherap(OMGA)
WerewolfTherap(HOWL)
DyneTherap(DYN)
EnantaPharma(ENTA)
SanaBiotech(SANA)
PonoCapitalThree(PTHR)
56465
842
96534
1253
44167
1851
14094
159
25.20
10.80
4.39
5.36
17.96
12.11
5.10
10.20
+19.17
+5.30
+1.38
+1.50
+4.66
+2.70
+1.02
+1.88
+317.9
+96.4
+45.8
+38.9
+35.0
+28.7
+25.0
+22.6
Name (Sym)
Volume
Close
Change
%Chg.
FLJ(FLJ)
View(VIEW)
AnavexLifeSci(AVXL)
LifeMD(LFMD)
AppliedTherap(APLT)
Mobileye(MBLY)
VastRenewables(VSTE)
Nukkleus(NUKK)
3098
711
17602
12372
15498
66483
401
539
1.15
2.33
6.01
5.45
2.25
30.49
3.66
2.05
–0.85
–1.31
–3.30
–2.84
–1.10
–12.83
–1.53
–0.82
–42.5
–36.0
–35.4
–34.3
–32.8
–29.6
–29.6
–28.5
Losers
BerkHathwy A(BRK.A)
ExxonMobil(XOM)
Uber(UBER)
JPMorganChase(JPM)
EliLilly(LLY)
UnitedHealth(UNH)
Alibaba(BABA)
BankofAmerica(BAC)
BerkHathwy B(BRK.B)
Pfizer(PFE)
Chevron(CVX)
J&J(JNJ)
Boeing(BA)
Visa(V)
Walmart(WMT)
McDonald's(MCD)
ThermoFisher(TMO)
Citigroup(C)
Merck(MRK)
Salesforce(CRM)
Volume Percentage Leaders
%Chg.
Close
Change
Name (Sym)
Volume
%Chg.
Close
Change
Name (Sym)
Volume
%Chg.
Close
Change
1471
24743
873
672
169098
75888
220
186
194
194
405
65911
139
47583
1043
67
22149
6951
1021
8780
968.1
911.7
687.5
671.0
648.8
535.1
446.1
374.0
340.2
331.6
306.4
290.9
279.2
278.3
274.8
229.5
211.0
199.5
195.4
182.5
5.49
39.19
11.47
10.75
8.70
35.89
29.05
7.35
15.75
11.14
11.03
14.59
8.09
8.63
40.66
32.26
35.12
26.87
11.04
37.96
–5.41
–2.41
+3.84
+0.08
+1.75
+0.23
+2.25
+1.25
+0.75
+0.01
+0.03
+4.72
–1.41
–3.92
–2.87
+0.02
+2.72
+3.37
+0.08
+3.16
ViveonHealth(VHAQ)
CatchaInvtA(CHAA)
M-tronInds(MPTI)
BattalionOil(BATL)
Polished.com(POL)
AcmeUnited(ACU)
AlphaProTech(APT)
Southland(SLND)
DecisionPointSys(DPSI)
Oragenics(OGEN)
LGL Group(LGL)
CompX Intl(CIX)
EVI Industries(EVI)
TompkinsFin(TMP)
IvanhoeElectric(IE)
GencorInds(GENC)
flyExclusive(FLYX)
BlueRiverA(BLUA)
InfuSystems(INFU)
Myomo(MYO)
435
114
889
580
23392
86
332
217
75
145
63
41
114
333
2264
101
208
48
214
2894
1421.2
271.7
232.9
223.2
124.8
107.1
106.7
105.8
96.0
90.4
63.0
54.3
51.0
49.6
46.6
42.9
36.2
33.0
32.4
29.8
11.40
11.16
33.70
9.62
7.50
42.19
5.21
5.23
6.49
6.14
6.05
23.86
19.82
55.85
9.98
15.73
6.75
10.73
9.91
4.74
+0.12
+0.03
–2.00
+0.01
+1.47
–0.67
–0.08
+0.07
+0.23
+0.51
–0.09
–1.42
–3.91
–4.38
–0.10
–0.41
+1.25
+0.07
–0.63
–0.27
LongboardPharm(LBPH)
VoyagerTherap(VYGR)
BlueOceanA(BOCN)
SpringValleyII A(SVII)
DyneTherap(DYN)
CapitalProduct(CPLP)
VinciPartners(VINP)
Mobileye(MBLY)
RevelstoneCapA(RCAC)
ClimateRockA(CLRC)
Evotec(EVO)
ViaRenewables(VIA)
Nextracker(NXT)
HorizonSpaceI(HSPO)
EchoStar(SATS)
Patterson(PDCO)
SilenceTherap(SLN)
IsraelAcqns(ISRL)
NatlResearch(NRC)
LifeMD(LFMD)
56465 17942.0
23129 2810.1
674 2157.4
5338 1661.2
44167 1593.9
2009 1093.2
2254 1052.7
66483
675.9
842
579.5
222
557.5
676
523.5
505
493.3
47962
487.6
390 406.5
24132 405.8
20713 405.4
1144
401.2
1009
392.1
1016
351.2
12372
340.5
25.20
8.85
10.86
10.83
17.96
16.10
10.70
30.49
10.80
11.14
9.74
10.70
41.99
10.73
12.64
28.60
17.92
10.69
38.13
5.45
+19.17
+0.41
+0.08
+0.02
+4.66
+1.90
–0.25
–12.83
+5.30
+0.13
–1.99
+1.30
–4.86
0.00
–3.93
+0.15
+0.55
–0.05
–1.43
–2.84
Volume
Close
Change
%Chg.
Volume
Close
Change
%Chg.
Volume
Close
Change
%Chg.
219187
216919
185758
180212
171640
169098
158907
149868
149114
147468
111985
104870
104342
96273
95612
93432
93250
92329
86279
85805
8.06
11.85
15.98
29.47
34.43
8.70
7.11
17.47
17.33
1.33
57.58
6.87
40.20
54.33
21.35
8.57
8.03
16.55
73.01
1.53
–1.01
–0.34
–1.19
+0.68
+0.76
+1.75
0.00
+0.69
–1.21
–0.42
–3.99
+0.32
+2.50
+2.89
–0.18
+0.24
+0.15
–0.38
–4.50
–0.16
–11.1
–2.8
–6.9
+2.4
+2.3
+25.2
0.0
+4.1
–6.5
–24.0
–6.5
+4.9
+6.6
+5.6
–0.8
+2.9
+1.9
–2.2
–5.8
–9.5
132440
66182
40447
40083
38784
25752
23392
20488
14647
14596
14164
12813
11457
11387
10935
10494
10370
9988
9802
9466
0.75
0.18
0.08
3.04
1.66
2.03
7.50
6.41
0.16
0.18
0.62
1.44
0.96
6.72
0.41
0.53
0.58
0.38
1.49
0.16
–0.00
+0.07
–0.01
–0.12
–0.11
+0.09
+1.47
+0.01
+0.00
–0.02
+0.22
–0.02
–0.17
–0.47
–0.00
–0.04
–0.08
+0.06
+0.03
+0.01
–0.6
+62.2
–11.8
–3.8
–6.2
+4.6
+24.4
+0.2
+0.1
–10.7
+54.2
–1.4
–15.0
–6.5
–1.2
–6.8
–12.5
+18.3
+2.1
+6.9
542584
420633
274801
255601
254438
197816
197582
163762
144962
143545
142298
141067
128575
123816
121003
109331
100008
96725
96534
94741
0.77
237.49
181.18
0.89
138.58
8.22
145.24
46.89
490.97
0.03
13.60
19.08
3.78
6.72
25.01
2.28
2.11
135.73
4.39
2.72
–0.10
–10.99
–11.35
–0.62
–8.83
–1.73
–6.70
–3.36
–4.25
–0.03
–0.14
–4.38
–0.43
+0.63
–1.10
–0.02
–0.20
–3.96
+1.38
–0.19
–11.8
–4.4
–5.9
–41.2
–6.0
–17.4
–4.4
–6.7
–0.9
–45.3
–1.0
–18.7
–10.2
+10.3
–4.2
–0.9
–8.7
–2.8
+45.8
–6.5
$ Volume
Close
Change
%Chg.
Name (Sym)
$ Volume
Close
Change
%Chg.
Close
Change
%Chg.
11035855554300.00+11675.00
4015173 102.63
+2.65
3503030
57.58
–3.99
3441502 172.27
+2.17
3363734 618.55 +35.63
3344903 537.38 +10.91
3209982
73.01
–4.50
2922149
34.43
+0.76
2784732 365.59
+8.93
2696803
29.47
+0.68
2448316 150.40
+1.24
2430316 161.13
+4.39
2424758 249.00 –11.66
2382918 259.69
–0.66
2377814 156.71
–0.94
2305799 288.99
–7.52
2221862 531.23 +0.44
2214338
54.33
+2.89
2145425 117.22
+8.20
2138864 251.12 –12.02
+2.2
+2.7
–6.5
+1.3
+6.1
+2.1
–5.8
+2.3
+2.5
+2.4
+0.8
+2.8
–4.5
–0.3
–0.6
–2.5
+0.1
+5.6
+7.5
–4.6
CheniereEnergy(LNG)
Polished.com(POL)
UraniumEner(UEC)
B2Gold(BTG)
Tellurian(TELL)
ImperialOil(IMO)
EnergyFuels(UUUU)
DenisonMines(DNN)
Globalstar(GSAT)
CheniereEnerPtrs(CQP)
Seaboard(SEB)
EquinoxGold(EQX)
NatlHealthcare(NHC)
CentrusEnergy(LEU)
NovaGoldRscs(NG)
SigningDaySports(SGN)
M-tronInds(MPTI)
MAG Silver(MAG)
ParkNational(PRK)
IvanhoeElectric(IE)
519791 167.57
–3.14
212870
7.50
+1.47
68250
6.41
+0.01
58908
3.04
–0.12
52507
0.75 –0.00
45380
58.79
+1.60
43483
6.72
–0.47
32162
1.66
–0.11
31826
2.03
+0.09
23288
53.00
+3.21
21843 3635.00 +64.90
21041
4.58
–0.31
20701
92.20
–0.22
14062
50.13
–4.28
13988
3.66 –0.08
13684
0.96
–0.17
13311
33.70
–2.00
12997
10.01 –0.40
12984 128.76
–4.10
11942
9.98
–0.10
–1.8
+24.4
+0.2
–3.8
–0.6
+2.8
–6.5
–6.2
+4.6
+6.4
+1.8
–6.3
–0.2
–7.9
–2.1
–15.0
–5.6
–3.8
–3.1
–1.0
237.49 –10.99
490.97
–4.25
181.18 –11.35
138.58
–8.83
367.75
–8.29
145.24
–6.70
351.95
–2.01
135.73
–3.96
153.98 –19.94
1049.28 –66.97
137.39
–3.54
46.89
–3.36
474.06 –12.82
656.01
–4.07
564.60 –32.00
111.12 +11.67
83.45
–1.89
3408.14 –139.08
149.00 –13.07
631.08
–0.54
–4.4
–0.9
–5.9
–6.0
–2.2
–4.4
–0.6
–2.8
–11.5
–6.0
–2.5
–6.7
–2.6
–0.6
–5.4
+11.7
–2.2
–3.9
–8.1
–0.1
By Share Volume
Name (Sym)
Tellurian(TELL)
TrinityPlace(TPHS)
AultAlliance(AULT)
B2Gold(BTG)
DenisonMines(DNN)
Globalstar(GSAT)
Polished.com(POL)
UraniumEner(UEC)
KelsoTech(KIQ)
Zomedica(ZOM)
PerspectiveTherap(CATX)
NewGold(NGD)
SigningDaySports(SGN)
EnergyFuels(UUUU)
Cybin(CYBN)
Senseonics(SENS)
GeniusGroup(GNS)
NorthernDynasty(NAK)
RingEnergy(REI)
Nuburu(BURU)
By Share Volume
By Dollar Volume
By Dollar Volume
Winners
Nasdaq Most Active
Volume
By Share Volume
Winners
For personal non-commercial use only. Do not edit or alter. Reproductions not permitted.
To reprint or license content, please contact Barron's reprints department at 800-843-0008 or www.djreprints.com
Saturday Inbox: Sign up for the
Market Lab Newsletter every Saturday
at Barrons.com/newsletters
Name (Sym)
Nikola(NKLA)
Tesla(TSLA)
Apple(AAPL)
OPKO Health(OPK)
AdvMicroDevices(AMD)
SoFiTech(SOFI)
Amazon.com(AMZN)
Intel(INTC)
NVIDIA(NVDA)
LumiraDx(LMDX)
AmerAirlines(AAL)
Rivian(RIVN)
Lucid(LCID)
Peloton(PTON)
WalgreensBoots(WBA)
TilrayBrands(TLRY)
Canaan(CAN)
Alphabet A(GOOGL)
OmegaTherap(OMGA)
Bitfarms(BITF)
By Dollar Volume
Includes Common shares only. All figures reflect activity for the most-recent five-day trading week. Share volume figures are expressed in thousands. Volume percentage leaders exclude stocks with average daily volume of fewer than 5,000 shares or priced under $5.
Average volume is based on 65 trading days. Volume figures do not reflect extended trading hours. a-Stock has not been in existence or not been traded for 65 consecutive sessions. S-Stock split or stock dividend amounting to 10% or more. X-Ex-dividend
Name (Sym)
Tesla(TSLA)
NVIDIA(NVDA)
Apple(AAPL)
AdvMicroDevices(AMD)
Microsoft(MSFT)
Amazon.com(AMZN)
MetaPlatforms(META)
Alphabet A(GOOGL)
CoinbaseGlbl(COIN)
Broadcom(AVGO)
Alphabet C(GOOG)
Intel(INTC)
Netflix(NFLX)
Costco(COST)
Adobe(ADBE)
Moderna(MRNA)
MicronTech(MU)
Booking(BKNG)
ApplMaterials(AMAT)
MicroStrategy(MSTR)
$ Volume
47852954
39845814
26232499
18615536
16711105
13591038
11356046
6203426
6020207
5445532
4764163
3807953
3597709
3175334
2731883
2637175
2404140
2259309
2141909
2130486
34
BARRON’S
January 8, 2024
MARKET VIEW
Unreliable Labor Data
For personal non-commercial use only. Do not edit or alter. Reproductions not permitted.
To reprint or license content, please contact Barron's reprints department at 800-843-0008 or www.djreprints.com
Economic Update
Regions Financial
regions.com
Jan. 5: Total nonfarm employment rose by
216,000 jobs in December, ahead of expectations, with private-sector payrolls up by
164,000 jobs and public-sector payrolls up
by 52,000 jobs. Prior estimates of job growth
in October and November were revised
down by a net 71,000 jobs for the two-month
period, with the net gain in private-sector
payrolls revised down by 55,000 jobs. The
household survey data show massive declines in both the size of the labor force and
the level of household employment, both
down by over 600,000 persons, which left
the unemployment rate at 3.7%. Average
hourly earnings were up by 0.4%, yielding a
year-on-year increase of 4.1%.
While [these are] the numbers that analysts, market participants, and headline
numbers will react to, here is what is, or at
least should be, a much more relevant number: 49.4%. That is the response rate to the
December establishment survey and is the
lowest monthly response rate since January
1991. We have been pointing out that response rates to the Bureau of Labor Statistics’ surveys have been significantly lower
since the onset of the pandemic than had
been the case prior to the pandemic. This
lessens the reliability of the initial estimates
of any metrics flowing from these surveys.
It is hard to say much about the state of
the labor market when the reliability of the
data is as lacking as we see it. Perhaps the
most significant takeaway is that the slowing
trend rate of job growth remains a function
of less hiring, not more layoffs.
—Richard F. Moody
Inflation Risks Rise
Strategy Report
BCA Research
bcaresearch.com
Jan. 4: We agree with the consensus that a
soft landing can be achieved but disagree that
it can be maintained for very long. The reason is straightforward: When an economy
To be considered for this section, material, with
the author’s name and address, should be sent
to MarketWatch@barrons.com.
This commentary was issued recently by
money managers, research firms, and market
newsletter writers. Edited by Barron’s Staff
reaches full employment, the central bank
needs to calibrate monetary policy almost
perfectly to keep it there. If it doesn’t cut
rates fast enough, unemployment will increase; if it cuts too fast, inflation will rise.
Until December’s FOMC meeting, our
strong bias was to think that the Fed would
cut rates too slowly. However, in light of the
apparent shift in the Fed’s reaction function
and the resulting easing in financial conditions, the risk of a second inflation wave
has gone up.
—Peter Berezin and team
“The biggest winner over the past two years
wasn’t Big Tech but rather the energy sector,
which surged more than 63%, although most of
its return was front-loaded in 2022. Energy
shares limped in 2023, losing 1.4% for the year.”
Jack Ablin, Cresset
Negative “Santa Claus Rally”
more than 63%, although most of its return
was front-loaded in 2022. Energy shares
limped in 2023, losing 1.4% for the year.
—Jack Ablin
U.S. Investment Policy Notes
CFRA
cfra.com
Political Pressure on the Fed?
Jan. 3: The S&P 500 jumped nearly 16%
from the low on Oct. 27 through year-end
2023, notching gains of nearly 9% in November and 4.4% in December, and surging
24.2% for the entire year. The first two trading days of the new year saw the S&P 500
fall in price, however, as investors delayed
locking in taxable gains. This selloff resulted
in a negative “Santa Claus Rally” period,
popularized by the Stock Trader’s Almanac,
as the 500 slipped 0.9% during the final five
trading days of 2023 and first two of 2024.
A negative seven-day period occurred
23% of the time since 1945, accompanied by
a below-average calendar-year gain (4.7%
versus 9.1% for all years), and frequency of
advance (33% versus 71%). Though history
is a guide and not gospel, it implies that
2024 may endure more challenges than anticipated at year-end 2023. CFRA still forecasts a good year to follow a great year, but
sees elevated volatility along the way.
—Sam Stovall
And the Winner Was...Energy!
Portfolio Review
Adrian Day Asset Management
adriandayassetmanagement.com
Dec. 31: The Federal Reserve’s pivot is
clear. In September, a majority of Fed
members, in their famous “dot plot,” were
calling for another rate hike in 2023 and
some were calling for more hikes in 2024,
while the weighted average forecast for
rates this coming year was 5.2%. The rate
hike didn’t come, and by December no
members were seeing a hike this coming
year, with the median forecast for 2024
rates of 4.6%. For 2025, the forecast is for
3.6% and down from there. That’s a dramatic shift, and in his press conference
following the December Fed meeting,
Chairman Jerome Powell took no pains to
moderate the conclusions of the dot plot,
but instead indicated rate hiking was over
and cuts lay ahead.
What caused the change? It would be
difficult to argue that economic reports between September and December demanded
such a change in policy. A pause, to allow
the impact of tightening to play out, as Powell had discussed, would be justified, but not
the dramatic reversal of policy. There are
only two reasonable explanations: One, the
Fed has additional intelligence of a sharp
deterioration coming in the economy; and
two, political pressure was exerted.
We don’t give much credence to the first,
since the Fed’s economic forecasting has
historically been quite dismal, although they
are seeing the same reports as we. But after
Powell at the beginning of December said, “It
would be premature to speculate on when
policy might ease,” he became subject to a
constant barrage of political pressure, starting with President Biden saying recent jobs
reports “should not encourage the Fed to
raise rates,” a very unusual presidential intervention into interest-rate policy, and ending with Treasury Secretary Yellen appearing on CNBC literally minutes before
Powell’s press conference in which she forecast inflation declining to 2%, adding that
that meant rate cuts were now necessary.
—Adrian Day
Market Sentiment
Citigroup Panic/Euphoria Model Last +0.18
Euphoria
Neutral
Panic
0.6
Market Commentary
Cresset
cressetcapital.com
Jan. 3: Compared to other markets, megacap tech did relatively well [in 2022-23], but
not as well as 2023 might have suggested.
In fact, the Magnificent Seven matched the
returns of the broader technology sector
over the 24-month span. The biggest winner over the past two years wasn’t Big Tech
but rather the energy sector, which surged
0.4
0.2
0
-0.2
-0.4
-0.6
D
J
F
M
A
M
J
J
A
S
O
N
D
J
The panic/euphoria model is a gauge of investor sentiment. It identifies "Panic" and "Euphoria" levels which are statistically driven buy and sell
signals for the broader market. Historically, a reading below panic supports a better than 95% likelihood that stock prices will be higher one year
later, while euphoria levels generate a better than 80% probability of stock prices being lower one year later.
Source: Citigroup Investment Research - US Equity Strategy
January 8, 2024
35
BARRON’S
DATA
Barron's 50-Stock Average
Cash Track
Charting the Market
Coming Earnings
Conference Call Calendar
Consensus Estimate
Delta Tactical Sentiment
Distributions & Offerings
Dividend Boosts - Reductions
Dividend Ex-Payment Dates
DJ Averages
DJ U.S. Total Market Industry Groups
49
L26
32
47
47
47
47
49
48
48
45
47
Dow Jones Averages
Dow Jones Per Share Values
Exchange Traded Portfolios
Federal Reserve Data Bank
Foreign Exchange
Gold & Silver Prices
Gold Mining Index
Indexes P/Es & Yields
Initial Public Offerings
Investor Sentiment Readings
Key Foreign Market Indexes
Market Lab
45
46
44
48
47
48
48
46
46
46
43
45
Money Rates, U.S. & Foreign
Mutual Funds
N.Y. Stock Exchange
Nasdaq National Market
New Corporate Listings
New Highs & Lows
NYSE Half-Hourly Volume
Other Market Indexes
Pulse of the Economy
Stock Splits - Special Dividends
Stock Volume
Trading Diary
47
L8
35
39
46
49
46
45
47
48
46
45
Statistics from January 2-5, 2024
NEW YORK STOCK EXCHANGE COMPOSITE LIST –52-Week–
High
Low
Name
Tick
Sym Yld P/E
Last
Div
Chg. Amt.
60.00
42.45
6.40
9.41
2.03
6.52
88.72
18.80
82.72
122.01
6.28
9.55
5.17
74.14
4.08
1.78
11.14
3.07
8.57
90.95
17.47
43.20
6.23
40.97
12.92
56.37
36.12
56.56
11.32
110.80
162.14
90.54
16.82
9.85
336.62
205.38
61.10
10.79
34.29
56.91
61.52
128.55
28.25
5.72
73.09
1.12
149.41
130.56
8.05
8.63
52.63
63.14
40.25
270.15
200.38
12.99
37.95
92.28
135.83
23.04
32.13
75.08
18.29
218.41
126.51
73.01
8.73
122.78
1.27
62.32
31.10
55.93
149.98
3.43
35.18
7.21
367.32
16.92
11.73
10.66
47.12
–2.40 ...
–2.38 .225
+0.32 .075
–0.21 ...
+0.37 ...
–0.30 .035
–3.71 .22
–0.45.1725
+0.22 .42
+0.60 .29
–0.07 .05
+1.50 ...
–0.95 ...
–0.74 ...
–0.09 ...
–0.02 ...
+0.01 ...
–0.21 .05
–0.84.5714
–5.22 ...
+0.69.2775
–2.27 ...
+0.09 ...
–2.10 ...
–0.25 .06
+1.00 .44
–2.13 ...
–1.53 .17
+0.44 .125
+0.73 .55
+7.17 1.55
+2.32 ...
–0.17 .18
–0.42 ...
–14.29 1.29
+0.55 .13
–2.07 .195
–0.31.1649
–2.07 ...
–2.04 ...
+0.49 .25
–12.09 .14
–1.71 .16
–0.04.1528
–1.23 ...
+0.36 ...
–2.01 .01
–8.47 .236
+0.13 ...
–3.92 ...
–2.22 .40
+0.19 .247
–1.69 .21
–3.65 1.75
–9.81 .26
–0.48 .025
–1.12 ...
–5.94 .26
–8.65 .40
+0.04 .12
–1.87 .10
–3.04 ...
–0.73.2225
+4.844.50
–0.26 1.27
–4.50 1.00
+0.20 ...
–3.91 .45
–0.08 ...
+1.16.6775
+0.07 .65
–2.22 .23
+10.00 .89
–0.31 ...
+0.26 .30
+0.04 ...
+28.40 .50
+0.01 .275
–0.64 .057
+0.10 ...
–0.04 ...
For personal non-commercial use only. Do not edit or alter. Reproductions not permitted.
To reprint or license content, please contact Barron's reprints department at 800-843-0008 or www.djreprints.com
A
73.95
53.05
6.62
10.25
5.75
9.84
94.01
28.18
84.64
145.53
7.05
22.08
75.26
113.85
36.40
6.90
11.20
3.87
9.55
97.80
21.53
47.92
25.00
48.89
16.31
63.99
39.04
58.75
16.16
115.83
168.11
94.27
17.36
12.05
355.38
207.96
64.81
12.51
47.50
62.23
158.22
145.68
44.57
5.83
75.48
2.10
180.63
159.59
19.68
29.44
61.15
75.71
46.20
320.90
216.34
14.95
57.18
115.39
293.01
23.88
57.61
86.20
20.49
242.63
172.65
121.30
10.19
128.43
4.89
66.69
42.00
61.53
151.46
10.94
35.78
7.23
379.19
20.79
20.60
10.80
70.63
45.20
37.61
4.30
6.62
0.36
4.89
74.40
11.43
60.20
109.81
4.82
3.60
5.08
57.80
3.67
1.70
10.35
2.62
6.50
63.27
13.43
31.60
5.78
33.02
10.04
51.25
21.34
34.59
6.72
89.67
130.96
21.74
12.37
8.28
242.80
149.30
42.96
7.34
30.11
33.59
47.73
75.02
23.93
4.02
49.58
0.47
120.22
96.80
5.07
7.59
43.22
52.69
33.33
251.63
140.87
9.78
30.75
78.20
112.00
19.14
23.07
63.78
15.56
155.60
90.73
70.08
6.33
95.94
0.99
49.29
25.83
41.43
100.57
2.63
21.59
4.80
132.72
14.25
8.76
9.92
27.92
AAR
ABMIndustries
ACCO Brands
AcresCmclRlty
ADC Therap
ADT
AECOM
AES
Aflac
AGCO
AG Mortgage
a.k.a.Brands
AMC Ent
AMN Healthcare
AMTD Digital
AMTD IDEA
AP Acqn A
ARC Document
ASE Tech
ASGN
AT&T
ATI
ATI PhysTherapy
ATS
A10Networks
AXIS Capital
AZEK
AZZ
Aaron's
AbbottLabs
AbbVie
Abercrombie&Fitch
AcadiaRealty
AccelEnt
Accenture
AcuityBrands
Acushnet
Adecoagro
Adient
AdtalemGlbEduc
AdvanceAuto
AdvDrainageSys
AdvanSix
Aegon
AerCap
AevaTech
AffiliatedMgrs
AgilentTechs
Agiliti
agilon health
AgnicoEagleMines
AgreeRealty
AirLease
AirProducts
AlamoGroup
AlamosGold
AlaskaAir
AlbanyIntl
Albemarle
Albertsons
Alcoa
Alcon
Alexander&Baldwin
Alexander's
AlexandriaRlEst
Alibaba
Alight
Allegion
Allego
Allete
AllianceBernstein
AllisonTransm
Allstate
AllurionTech
AllyFinancial
AlmacenesExito
AlphaMetal
AlpineIncmProp
AltaEquipment
AltC Acqn
Alteryx
AIR
...
ABM 2.1
ACCO 4.7
ACR ...
ADCT ...
ADT 2.1
ACM .9
AES 3.5
AFL 2.4
AGCO 1.0
MITT11.5
AKA ...
AMC ...
AMN ...
HKD ...
AMTD ...
APCA ...
ARC 6.5
ASX 5.0
ASGN ...
T
6.4
ATI
...
ATIP ...
ATS ...
ATEN 1.9
AXS 3.1
AZEK ...
AZZ 1.2
AAN 4.4
ABT 2.0
ABBV 3.8
ANF ...
AKR 4.3
ACEL ...
ACN 1.5
AYI
.3
GOLF 1.3
AGRO 3.0
ADNT ...
ATGE ...
AAP 1.6
WMS .4
ASIX 2.3
AEG 4.2
AER ...
AEVA ...
AMG .0
A
.7
AGTI ...
AGL ...
AEM 3.0
ADC 4.7
AL 2.1
APD 2.6
ALG .5
AGI .8
ALK ...
AIN 1.1
ALB 1.2
ACI 2.1
AA 1.2
ALC ...
ALEX 4.8
ALX 8.2
ARE 4.0
BABA 1.3
ALIT ...
ALLE 1.5
ALLG ...
ALE 4.3
AB 8.4
ALSN 1.6
ALL 2.4
ALUR ...
ALLY 3.4
EXTO ...
AMR .5
PINE 6.5
ALTG 1.9
ALCC ...
AYX ...
31
11
11
dd
dd
cc
cc
dd
11
8
12
dd
dd
11
18
1
63
12
15
20
dd
21
dd
33
24
9
80
20
39
38
44
23
66
20
31
19
19
8
16
25
20
22
9
dd
7
dd
5
31
dd
dd
10
37
9
26
18
25
19
29
5
12
dd
83
dd
11
91
10
dd
19
dd
14
14
8
dd
dd
10
dd
7
34
54
56
dd
–52-Week–
High
Low
5.57
48.11
8.58
17.75
3.23
12.37
30.13
91.18
65.86
23.07
29.73
10.12
21.62
56.09
189.51
143.15
37.97
69.76
31.59
99.19
15.70
235.57
23.67
162.59
4.28
33.90
386.33
165.52
4.00
99.93
10.23
10.63
22.58
10.92
11.20
30.27
67.09
24.43
23.89
13.46
30.90
9.85
347.37
40.28
8.93
34.92
12.75
96.41
18.22
176.44
133.79
1.75
39.07
4.08
11.26
2.40
8.45
15.79
69.71
18.40
16.00
16.04
6.29
9.95
31.57
140.91
105.22
28.79
45.66
11.69
75.20
6.15
154.58
8.41
114.25
0.93
24.31
275.09
131.52
2.15
72.00
5.47
2.60
11.31
10.31
6.00
14.91
51.66
14.52
5.42
9.56
19.91
4.09
280.89
28.22
5.63
18.47
8.58
55.16
13.66
118.73
107.89
Name
AlticeUSA
Altria
AltusPower
AmbacFin
Ambev
Amcor
AmerantBncpA
Ameren
Ameresco
AmericaMovil
AmericanAssets
AmericanAxle
AmerEagle
AmerEquity
AmerExpress
AmericanFin
AmHomes4Rent
AIG
AmRltyInv
AmerStWater
AmerStratInvt
AmerTowerREIT
AmerVanguard
AmerWaterWorks
AmericanWell
AmericoldRealty
Ameriprise
Ametek
Ampco-Pitt
Amphenol
AmplifyEnergy
AmpriusTech
Amrep
AndrettiAcqnA
AngelOakMtgREIT
AngloGoldAsh
AB InBev
AnnalyCap
AnnovisBio
AnteroMidstream
AnteroResources
AnywhereRealEst
Aon
AptIncmREIT
ApartmtInv
APi Group
ApolloComRlEst
ApolloGlbMgmt
AppleHospREIT
AppliedIndlTechs
Aptargroup
Tick
Sym Yld P/E
ATUS ...
MO 9.4
AMPS ...
AMBC ...
ABEV 3.9
AMCR 5.1
AMTB 1.5
AEE 3.4
AMRC ...
AMX 1.9
AAT 5.8
AXL ...
AEO 2.5
AEL ...
AXP 1.3
AFG 2.3
AMH 2.5
AIG 2.1
ARL ...
AWR 2.2
NYC ...
AMT 3.0
AVD 1.1
AWK 2.1
AMWL ...
COLD 2.9
AMP 1.4
AME .6
AP
...
APH .9
AMPY ...
AMPX ...
AXR ...
WNNR ...
AOMR12.3
AU 1.2
BUD .9
NLY 13.6
ANVS ...
AM 7.2
AR
...
HOUS ...
AON .8
AIRC 5.2
AIV ...
APG ...
ARI 12.2
APO 1.8
APLE 5.7
AIT .8
ATR 1.3
dd
8
12
4
15
15
12
17
33
15
29
dd
18
7
18
12
34
13
6
23
dd
cc
70
27
dd
dd
16
29
35
30
1
dd
6
cc
dd
cc
21
dd
dd
17
8
dd
22
5
dd
79
dd
20
24
18
30
Last
3.01
41.49
6.24
16.19
2.78
9.74
24.34
74.05
28.69
18.28
22.78
8.29
19.84
55.28
189.06
121.19
35.41
69.01
19.50
77.54
8.10
214.28
10.53
131.89
1.19
29.88
382.10
160.74
2.61
94.46
6.13
4.60
21.75
10.91
10.41
17.68
64.25
19.10
12.25
12.45
23.25
7.44
289.59
34.46
7.70
30.99
11.51
94.93
16.86
164.89
124.20
Div
Chg. Amt.
–0.24 ...
+1.15 .98
–0.59 ...
–0.29 ...
–0.02.1443
+0.10 .125
–0.23 .09
+1.71 .63
–2.98 ...
–0.24.1967
+0.27 .33
–0.52 ...
–1.32 .125
–0.52 ...
+1.72 .60
+2.30 .71
–0.55 .22
+1.26 .36
+2.09 ...
–2.88 .43
+0.13 ...
–1.60 1.70
–0.44 .03
–0.10.7075
–0.30 ...
–0.39 .22
+2.27 1.35
–4.15 .25
–0.12 ...
–4.67 .22
+0.20 ...
–0.69 ...
–0.22 ...
+0.04 ...
–0.19 .32
–1.01.0337
–0.37.8245
–0.27 .65
–6.45 ...
–0.08 .225
+0.57 ...
–0.67 ...
–1.43 .615
–0.27 .45
–0.13 ...
–3.61 ...
–0.23 .35
+1.74 .43
+0.25 .05
–7.80 .35
+0.58 .41
–52-Week–
High
Low
124.88
33.01
17.74
7.27
32.49
177.51
7.49
89.32
16.04
13.00
84.21
25.47
5.90
19.41
10.76
12.75
120.99
48.51
16.86
240.68
11.54
13.73
33.38
99.75
147.42
45.92
19.00
26.27
256.39
7.52
112.71
17.32
33.00
24.21
40.98
173.61
76.42
165.69
41.04
24.69
125.28
25.39
3.50
38.91
111.30
182.08
2750.00
198.66
44.77
31.99
25.25
71.01
23.55
10.10
6.50
21.30
102.42
1.77
69.31
8.78
7.02
52.71
12.95
2.57
11.59
10.10
7.52
67.41
36.56
6.69
108.91
3.37
9.81
13.32
62.03
106.54
28.98
11.44
11.32
178.40
1.75
70.82
5.33
22.92
14.47
31.01
104.49
45.21
114.99
23.32
15.06
101.00
18.21
1.30
25.74
77.41
104.31
2277.88
153.07
27.46
17.24
16.63
Name
Aptiv
Aramark
ArborRealty
ArcadiumLithium
ArcelorMittal
ArchResources
ArcherAviation
ADM
Archrock
ArcosDorados
Arcosa
ArcusBiosci
ArdaghMetalPkg
ArdmoreShipping
AresAcqnII A
AresCommRealEst
AresMgmt
Argan
ArisWater
AristaNetworks
ArloTech
ArmadaHoffler
ArmourResREIT
ArmstrongWorld
ArrowElec
ArtisanPtrsAsset
Artivion
Asana
AsburyAutomotive
AshfordHosp
Ashland
AspenAerogels
AssetMarkFin
AssociatedBanc
AssocCapital
Assurant
AssuredGuaranty
Atkore
AtlUnionBkshs
AtlasEnergy
AtmosEnergy
AtmusFiltration
ATRenew
Autohome
Autoliv
AutoNation
AutoZone
Avalonbay
Avangrid
AvanosMedical
Avantor
Tick
Sym Yld P/E
APTV ...
ARMK 1.3
ABR 11.5
ALTM ...
MT
...
ARCH .6
ACHR ...
ADM 2.5
AROC 4.1
ARCO 1.6
ACA .3
RCUS ...
AMBP10.6
ASC 7.7
AACT ...
ACRE13.1
ARES 2.6
AGX 2.6
ARIS 4.3
ANET ...
ARLO ...
AHH 6.4
ARR 15.2
AWI 1.1
ARW ...
APAM 5.4
AORT ...
ASAN ...
ABG ...
AHT ...
ASH 1.9
ASPN ...
AMK ...
ASB 4.1
AC
.6
AIZ 1.7
AGO 1.5
ATKR ...
AUB 3.6
AESI 3.6
ATO 2.7
ATMU ...
RERE ...
ATHM 6.2
ALV 2.6
AN
...
AZO ...
AVB 3.6
AGR 5.2
AVNS ...
AVTR ...
10
11
8
...
5
4
dd
10
29
14
13
dd
cc
4
66
cc
55
18
17
38
dd
46
dd
20
7
14
dd
dd
5
dd
24
dd
19
9
22
17
10
9
13
9
19
10
dd
12
21
6
19
28
24
dd
41
Last
83.48
28.22
14.56
7.11
27.79
175.36
5.53
70.81
15.30
12.05
78.37
17.73
3.78
15.00
10.48
10.06
117.05
46.04
8.33
230.92
9.41
12.28
18.96
97.63
116.90
42.84
16.75
16.88
205.54
1.82
79.76
14.48
29.37
21.34
34.40
168.08
75.69
152.38
35.93
16.73
117.98
22.81
1.62
27.05
104.04
140.21
2550.93
182.67
33.86
17.98
21.79
Div
Chg. Amt.
–6.24 ...
+0.12 .11
–0.62 .43
... ...
–0.60 ...
+9.42 .88
–0.61 ...
–1.41 .45
–0.10 .155
–0.64 .04
–4.27 .05
–1.37 ...
–0.06 .10
+0.91 .16
+0.04 ...
–0.30 .33
–1.87 .77
–0.75 .30
–0.06 .09
–4.59 ...
–0.11 ...
–0.09 .195
–0.36 .24
–0.69 .28
–5.35 ...
–1.34 .65
–1.13 ...
–2.13 ...
–19.43 ...
–0.12 ...
–4.55 .385
–1.30 ...
–0.58 ...
–0.05 .22
–1.31 .10
–0.41 .72
+0.86 .28
–7.62 ...
–0.61 .32
–0.49 .05
+2.08 .805
–0.68 ...
–0.30 ...
–1.01 1.15
–6.15 .68
–9.97 ...
–34.68 ...
–4.55 1.65
+1.45 .44
–4.45 ...
–1.04 ...
Five-Day Dow Composite
End of the Line: The Dow fell 0.6% last week, ending a nine week winning streak—amid signs the economy may be too resilient for rate cuts.
Merck rose 7.5% after an upgrade, while Intel dropped 6.7%.
Monday
Tuesday
Wednesday
Thursday
Friday
37,800
H
(Prev Fri)
O
L
I
D
A
Y
37,675
37,550
37,425
+25.50
-284.85
+10.15
+25.77
37,300
10 12 2
4
10 12 2
4
10 12 2
4
10 12 2
4
10 12 2
4
–52-Week–
High
Low
203.70
44.74
45.13
34.45
57.12
13.87
Name
Tick
Sym Yld P/E
Last
Div
Chg. Amt.
158.93
27.73
30.53
25.03
32.05
3.82
AveryDennison
Avient
Avista
AxaltaCoating
AxosFinancial
Azul
AVY
AVNT
AVA
AXTA
AX
AZUL
1.7
2.7
5.1
...
...
...
33
85
17
31
10
dd
196.09
38.16
36.21
32.96
52.48
8.50
–6.07 .81
–3.41.2575
+0.47 .46
–1.01 ...
–2.12 ...
–1.19 ...
0.70
7.20
36.15
1.68
8.85
54.28
51.94
1.75
60.33
33.62
2.39
2.51
1.06
16.01
55.47
0.96
103.93
0.64
42.81
7.28
9.72
3.73
6.24
2.12
17.96
15.82
16.31
4.76
15.46
3.13
21.55
24.96
22.93
30.83
73.98
39.65
39.80
15.83
6.23
6.96
0.75
18.79
13.82
27.30
9.60
14.64
5.57
31.01
2.89
6.31
13.28
228.62
60.55
25.32
20.58
0.13
55.50
442363
292.42
18.07
53.83
62.30
13.71
3.47
0.70
698.00
137.01
12.35
261.59
271.00
35.83
46.43
3.23
596.18
1.04
Bark
B&G Foods
BCE
BEST
BGSF
BHP Group
BILL
BitMining
BJ'sWholesale
BP
BP Prudhoe
BRC
BRF
BRT Apartments
BWX Tech
Babcock&Wilcox
BadgerMeter
Bakkt
Ball
Bally's
BancCalifornia
BancoBBVA
BBVA
BancoBradesco
BancodeChile
Bladex
BancoMacro
BancSanBrasil
BcoSantChile
BancoSantander
BanColombia
BankofAmerica
BankofButterfield
BankofHawaii
BankMontreal
BankNY Mellon
BankNovaScotia
BankUnited
Barclays
BaringsBDC
Barnes&NobleEduc
BarnesGroup
BarrickGold
Bath&BodyWks
BatteryFutureA
Bausch+Lomb
BauschHealth
BaxterIntl
BaytexEnergy
Beachbody
BeazerHomes
BectonDicknsn
Belden
BellRing
BenchmarkElec
BensonHill
Berkley
BerkHathwy A
BerkHathwy B
BerkshireHills
BerryGlobal
BestBuy
Beyond
BigLots
BigBear.ai
BiglariA
BiglariB
Biohaven
Bio-RadLab A
Bio-RadLab B
Birkenstock
BlackHills
BlackBerry
BlackRock
BlackSkyTech
BARK ...
BGS 7.4
BCE 6.9
BEST ...
BGSF 6.3
BHP 5.1
BILL ...
BTCM ...
BJ
...
BP 4.1
BPT 35.1
BRCC ...
BRFS ...
BRT 5.4
BWXT 1.2
BW
...
BMI .7
BKKT ...
BALL 1.4
BALY ...
BANC 3.1
BBAR .0
BBVA 4.4
BBDO 5.1
BCH 7.2
BLX 3.8
BMA .0
BSBR 3.8
BSAC 4.9
SAN 2.5
CIB 3.3
BAC 2.8
NTB 5.7
BOH 4.0
BMO 3.5
BK 3.2
BNS 6.6
BKU 3.5
BCS 4.6
BBDC11.4
BNED ...
B
2.1
GOLD 2.3
BBWI 1.8
BFAC ...
BLCO ...
BHC ...
BAX 3.0
BTE 2.0
BODY ...
BZH ...
BDX 1.6
BDC .3
BRBR ...
BHE 2.5
BHIL ...
WRB .6
BRK.A ...
BRK.B ...
BHLB 3.0
BERY 1.6
BBY 4.9
BYON ...
BIG 16.5
BBAI ...
BH.A ...
BH
...
BHVN ...
BIO
...
BIO.B ...
BIRK ...
BKH 4.5
BB
...
BLK 2.6
BKSY ...
dd
dd
23
dd
16
13
dd
dd
17
4
3
dd
dd
cc
31
dd
51
dd
30
dd
7
2
7
12
8
6
4
...
19
7
11
10
7
14
23
12
11
11
...
10
dd
64
cc
14
46
dd
dd
dd
4
dd
6
49
12
42
14
dd
15
11
10
11
13
13
dd
dd
dd
25
25
dd
dd
dd
49
14
dd
22
dd
.75
10.27
40.79
2.37
9.50
66.02
75.00
5.20
65.24
36.03
2.85
3.75
2.59
18.52
75.06
1.26
149.12
1.84
57.39
11.92
12.85
4.93
9.29
3.04
22.40
26.32
26.13
6.58
19.45
4.24
34.05
34.43
31.02
70.44
97.61
52.39
47.46
31.19
8.03
8.95
1.77
30.26
17.49
44.71
10.84
16.39
8.20
39.16
3.33
11.25
31.15
242.09
73.92
51.43
26.67
.15
74.36
554300
365.59
24.29
66.82
75.83
25.34
7.27
1.94
814.69
164.05
42.59
316.38
317.30
45.70
55.21
3.26
782.83
1.28
–0.05 ...
–0.23 .19
+1.41.7157
–0.18 ...
+0.10 .15
–2.29 1.60
–6.59 ...
+0.16 ...
–1.42 ...
+0.63.4362
+0.38.2974
+0.12 ...
–0.19 ...
–0.07 .25
–1.67 .23
–0.20 ...
–5.25 .27
–0.39 ...
–0.13 .20
–2.02 ...
–0.58 .10
–0.51.064
+0.18.1685
–0.14.0901
–0.682.1466
+1.58 .25
–2.57.4262
+0.03.0596
–0.041.2511
+0.10.0631
+3.28 .758
+0.76 .24
–0.99 .44
–2.02 .70
–1.331.1137
+0.34 .42
–1.23.7946
–1.24 .27
+0.15.1398
+0.37 .26
+0.28 ...
–2.37 .16
–0.60 .10
+1.55 .20
–0.01 ...
–0.67 ...
+0.18 ...
+0.50 .29
+0.01.0166
+2.96 ...
–2.64 ...
–1.74 .95
–3.33 .05
–4.00 ...
–0.97 .165
–0.02 ...
+3.64 .50
+11675 ...
+8.93 ...
–0.54 .18
–0.57 .275
–2.45 .92
–2.35 ...
–0.52 .30
–0.20 ...
+20.76 ...
–0.88 ...
–0.21 ...
–6.51 ...
–3.35 ...
–3.03 ...
+1.26 .625
–0.28 ...
–28.975.00
–0.12 ...
27
46
48
33
Contact Us
For queries, email us at
memberservices@dowjones.com
-
NEW HIGHS
B
2.29
16.68
48.38
3.72
16.02
71.52
139.50
6.95
78.88
41.38
13.31
8.27
3.09
22.35
81.66
6.83
170.86
2.87
62.14
21.45
18.26
6.60
9.52
3.21
23.80
26.56
31.68
6.66
21.81
4.29
34.43
37.00
38.31
81.73
102.79
52.76
55.91
40.22
9.44
9.47
2.52
47.36
20.75
49.55
11.55
21.95
10.23
50.38
4.66
44.50
35.93
287.32
99.13
57.00
29.46
2.84
75.53
566570
373.34
31.52
69.94
93.32
39.27
19.97
6.77
1058.50
218.50
44.29
509.62
467.95
52.12
73.98
5.75
819.00
2.37
Vital Signs
Week In Stocks
Weekly Bond Statistics
Winners & Losers Stocks
NEW LOWS
–52-Week–
High
Low
133.53
24.80
2.75
49.14
89.97
26.55
15.27
15.26
75.60
117.09
267.54
131.47
104.91
131.28
47.05
9.01
420.50
28.69
79.42
58.52
2.17
17.45
34.98
73.00
61.62
5.60
7.25
6.07
12.67
44.52
15.61
86.40
98.87
3.44
26.88
8.01
9.16
90.13
44.97
75.18
0.17
31.89
40.75
24.47
207.29
18.54
6.11
40.85
24.12
41.05
48.23
37.32
41.04
40.80
36.16
76.25
72.65
71.27
99.68
50.35
15.74
30.49
171.03
116.59
17.70
239.94
3.22
26.00
Name
Tick
Sym Yld P/E
Last
Div
Chg. Amt.
76.19
16.61
0.53
28.83
38.85
9.51
11.68
9.70
23.35
61.80
176.25
59.32
59.21
87.99
31.63
4.97
296.27
13.55
46.18
44.35
0.48
8.85
23.29
52.42
46.77
1.91
3.42
4.49
6.26
23.19
6.87
4.94
67.44
0.81
15.23
5.20
5.16
56.59
28.23
48.25
0.02
20.08
28.35
19.40
132.98
13.68
2.27
28.35
14.00
28.25
25.48
21.03
28.30
32.75
21.77
52.82
53.52
52.59
66.47
30.18
6.45
17.85
65.88
87.87
6.09
115.66
0.76
16.40
Blackstone
BlackstoneMtg
BlendLabs
BlockHR
Block
BloomEnergy
BlueOwlCapital
BlueOwlCapital
BluegreenVac
BlueLinx
Boeing
BoiseCascade
BootBarn
BoozAllen
BorgWarner
BorrDrilling
BostonBeer
BostonOmaha
BostonProps
BostonSci
BowFlex
Bowlero
Box
BoydGaming
Brady
BraemarHtls
BrandywineRealty
BrasilAgro
Braskem
BreadFinancial
BridgeInvt
BrightHealth
BrightHorizons
BrightScholar
BrightSphere
BrightSpire
BrightView
Brink's
BrinkerIntl
BristolMyers
BristolMyersRt
Bristow
BritishAmTob
BrixmorProp
BroadridgeFinl
Broadstone
BrookdaleSrLiving
BrookfieldAsset
BrookfieldBus
Brookfield
BrookfieldInfr
BrookfieldInfr
BrookfieldReinsur
BrookfieldReinsA1
BrookfieldRenew
Brown&Brown
Brown-Forman A
Brown-Forman B
Brunswick
Buckle
Buenaventura
Build-A-Bear
BuildersFirst
BungeGlobal
BurfordCapital
BurlingtonStrs
ButterflyNtwk
BylineBancorp
BX 2.7
BXMT11.7
BLND ...
HRB 2.7
SQ
...
BE
...
OBDC 9.4
OWL 3.8
BVH 1.1
BXC ...
BA
...
BCC .6
BOOT ...
BAH 1.5
BWA 1.3
BORR .0
SAM ...
BOC ...
BXP 5.6
BSX ...
BFX ...
BOWL ...
BOX ...
BYD 1.0
BRC 1.6
BHR 8.0
BDN 10.9
LND 12.2
BAK ...
BFH 2.6
BRDG 7.0
BHG ...
BFAM ...
BEDU ...
BSIG .2
BRSP11.0
BV
...
BCO 1.1
EAT ...
BMY 4.6
CELG.RT ...
VTOL ...
BTI 9.2
BRX 4.8
BR 1.6
BNL 6.8
BKD ...
BAM 3.3
BBUC 1.1
BN
.7
BIPC 4.4
BIP 5.0
BNRE .0
BNRE.A .0
BEPC 4.6
BRO .7
BF.A 1.5
BF.B 1.6
BC 1.8
BKE 3.1
BVN .6
BBW .0
BLDR ...
BG 2.7
BUR 1.7
BURL ...
BFLY ...
BY 1.6
51
19
dd
13
dd
dd
7
cc
20
10
dd
10
13
56
11
dd
48
cc
58
71
dd
22
cc
9
16
dd
dd
10
dd
3
dd
dd
63
...
11
cc
dd
28
13
13
...
dd
7
20
35
17
dd
8
8
dd
6
91
...
...
7
26
35
34
13
10
39
7
14
8
...
42
dd
9
122.21
21.23
2.53
46.77
66.96
13.77
14.96
14.71
74.88
109.65
249.00
128.22
71.40
123.77
34.99
7.17
327.25
15.53
70.36
58.16
.67
13.88
24.67
62.28
60.05
2.50
5.51
5.22
8.29
32.51
9.73
11.47
94.90
1.37
18.38
7.30
7.79
82.48
39.80
52.23
.08
27.62
30.28
22.58
196.35
16.73
5.58
38.33
21.96
38.52
34.75
30.30
38.55
38.44
29.64
69.60
57.44
55.09
89.64
44.93
14.99
22.57
159.78
98.02
14.76
190.05
1.01
23.07
–8.71 .80
–0.04 .62
–0.02 ...
–1.60 .32
–10.39 ...
–1.03 ...
+0.20 .35
–0.19 .14
–0.24 .20
–3.66 ...
–11.66 ...
–1.145.00
–5.36 ...
–4.14 .47
–0.86 .17
–0.19 .05
–18.34 ...
–0.20 ...
+0.19 .98
+0.35 ...
–0.10 ...
–0.28 ...
–0.94 ...
–0.33 .16
+1.36 .235
... .05
+0.11 .15
–0.06 .621
–0.53 ...
–0.43 .21
–0.05 .17
+3.84 ...
+0.66 ...
+0.12 ...
–0.78 .01
–0.14 .20
–0.63 ...
–5.47 .22
–3.38 ...
+0.92 .60
–0.01 ...
–0.65 ...
+0.99.7006
–0.69.2725
–9.40 .80
–0.49 .285
–0.24 ...
–1.84 .32
–1.32.0625
–1.60 .07
–0.53.3825
–1.19.3825
–1.82 .07
–1.56 .07
+0.85.3375
–1.51 .13
–2.15.2178
–2.01.2178
–7.11 .40
–2.59 2.50
–0.25 .073
–0.42 1.50
–7.16 ...
–2.93.6625
–0.84.0625
–4.43 ...
–0.07 ...
–0.49 .09
275.79
29.05
0.58
45.22
19.90
64.63
60.08
83.35
3.34
49.87
36.17
9.77
19.95
CACI Intl
CAVA
CBD Pao
CBIZ
CBL&Assoc
CBRE Group
CF Industries
CGI A
CI&T
CMS Energy
CNA Fin
CNH Indl
CNO Financial
CACI ...
CAVA ...
CBD ...
CBZ ...
CBL 6.1
CBRE ...
CF 2.0
GIB
...
CINT ...
CMS 3.3
CNA 3.9
CNHI 3.3
CNO 2.2
20
dd
dd
25
dd
46
8
20
21
23
11
7
11
323.36
41.15
.81
60.70
24.60
87.05
81.14
101.84
5.05
59.34
43.38
12.06
27.19
–0.50 ...
–1.83 ...
+0.01 ...
–1.89 ...
+0.18 .375
–6.04 ...
+1.64 .40
–5.37 ...
–0.21 ...
+1.27.4875
+1.07 .42
–0.12.3823
–0.71 .15
C
359.33
58.10
1.49
63.12
27.38
94.27
91.23
109.16
8.60
65.72
45.42
17.98
28.39
36
BARRON’S
D ATA
For personal non-commercial use only. Do not edit or alter. Reproductions not permitted.
To reprint or license content, please contact Barron's reprints department at 800-843-0008 or www.djreprints.com
–52-Week–
High
Low
23.68
114.30
28.69
69.47
10.77
20.10
49.59
48.87
4.96
39.36
118.38
93.25
861.89
86.67
57.40
18.91
31.45
33.62
25.04
31.99
58.44
63.92
71.59
44.49
127.60
46.95
57.24
32.88
24.73
48.92
127.15
68.74
85.40
1.51
25.51
190.00
134.26
69.25
108.85
23.49
318.74
87.50
19.74
17.95
74.06
35.99
60.04
22.84
86.76
62.59
74.49
299.20
10.67
680.00
47.95
159.06
30.36
5.60
8.46
212.83
21.37
79.98
31.47
7.71
71.97
8.82
24.55
9.58
92.14
79.66
13.65
262.00
184.65
14.38
3.58
26.51
596.91
39.05
7.24
132.91
187.81
52.88
7.81
4.45
12.50
2348.42
136.02
231.37
41.58
100.52
10.80
54.25
319.92
19.85
54.75
44.82
4.00
10.24
36.88
86.58
11.99
16.98
179.49
14.36
49.35
21.59
42.12
5.07
15.63
35.50
10.48
0.58
22.60
60.50
64.41
506.18
63.73
31.37
16.52
16.95
16.58
18.89
16.85
34.02
45.44
31.95
28.62
82.81
23.09
37.94
16.18
9.80
34.35
103.96
48.81
68.92
0.92
15.93
3.60
83.93
34.17
68.53
17.86
203.66
55.77
8.37
7.65
37.82
18.06
40.28
13.70
60.66
4.23
31.45
204.04
6.54
7.26
34.04
97.12
10.50
4.65
4.41
147.48
14.97
60.83
25.42
4.51
46.74
5.67
13.22
4.69
54.01
55.62
1.79
161.65
101.44
8.92
1.64
7.32
481.99
22.88
2.77
83.80
140.72
16.53
4.45
1.61
6.92
1365.12
109.19
183.40
35.45
78.63
10.00
39.94
240.50
8.33
38.17
22.77
1.64
3.46
17.87
55.00
6.07
9.60
111.18
Name
CNX Resources
CONSOL Energy
COPTDefenseProp
CRH
CS Disco
CTO Realty
CTS
C3.ai
Curo
CVR Energy
CVR Partners
CVS Health
CableOne
Cabot
Cactus
Cadeler
CadenceBank
Cadre
CAE
Caleres
CaliforniaRscs
CalWtrSvc
Calix
CallonPetrol
CamdenProperty
Cameco
CampbellSoup
CampingWorld
CanadaGoose
CIBC
CanNtlRlwy
CanadianNatRscs
CdnPacKC
Cango
Cannae
CanoHealth
CapitalOne
Capri
CardinalHealth
CareTrustREIT
Carlisle
CarMax
Carnival
Carnival
CarpenterTech
CarriageSvcs
CarrierGlobal
Cars.com
Carter's
Carvana
Catalent
Caterpillar
Cato
Cazoo
CedarFairRec
Celanese
Celestica
CementosPacasm
Cemex
Cencora
CenovusEnergy
Centene
CenterPointEner
CenterraGold
Centerspace
CentraisElBras
CentralPacFin
CentralPuerto
CenturyComm
CeridianHCM
ChargePoint
CharlesRiverLabs
ChartIndustries
ChathamLodging
CheetahMobile
Chegg
Chemed
Chemours
CherryHillMtg
ChesapeakeUtil
Chevron
Chewy
ChimeraInvt
ChinaGreenAg
ChinaYuchai
Chipotle
ChoiceHotels
Chubb
ChunghwaTel
Church&Dwight
ChurchillVII A
Ciena
Cigna
Cinemark
Citigroup
CitizensFin
Citizens
CityOfficeREIT
Civeo
CivitasRscs
Clarivate
ClarosMtg
CleanHarbors
January 8, 2024
NEW YORK STOCK EXCHANGE COMPOSITE LIST
Tick
Sym Yld P/E
CNX ...
CEIX 2.1
CDP 4.5
CRH 2.0
LAW ...
CTO 8.9
CTS .4
AI
...
CURO ...
CVI 6.4
UAN 38.3
CVS 3.3
CABO 2.2
CBT 2.1
WHD 1.1
CDLR ...
CADE 3.3
CDRE 1.0
CAE ...
CAL .9
CRC 2.4
CWT 2.1
CALX ...
CPE ...
CPT 4.1
CCJ
...
CPB 3.4
CWH 2.0
GOOS ...
CM 5.3
CNI 1.9
CNQ 4.3
CP
.8
CANG ...
CNNE ...
CANO ...
COF 1.8
CPRI ...
CAH 1.9
CTRE 5.1
CSL 1.1
KMX ...
CCL ...
CUK ...
CRS 1.2
CSV 1.8
CARR 1.4
CARS ...
CRI 4.0
CVNA ...
CTLT ...
CAT 1.8
CATO 9.7
CZOO ...
FUN 3.2
CE 1.9
CLS ...
CPAC ...
CX
...
COR 1.0
CVE 1.9
CNC ...
CNP 2.7
CGAU 3.6
CSR 5.4
EBR .5
CPF 5.4
CEPU ...
CCS 1.1
CDAY ...
CHPT ...
CRL ...
GTLS ...
CLDT 2.6
CMCM ...
CHGG ...
CHE .3
CC 3.2
CHMI15.2
CPK 2.3
CVX 4.0
CHWY ...
CIM 9.0
CGA ...
CYD 3.4
CMG ...
CHH 1.0
CB 1.5
CHT 3.0
CHD 1.2
CVII ...
CIEN ...
CI
1.6
CNK ...
C
3.9
CFG 5.0
CIA
...
CIO 6.4
CVEO 4.4
CIVI 11.4
CLVT ...
CMTG 9.6
CLH ...
2
5
dd
17
dd
dd
23
dd
dd
4
3
12
43
10
19
14
14
33
31
7
8
68
63
4
47
93
16
cc
23
12
23
14
24
dd
dd
dd
10
19
cc
52
21
23
dd
dd
31
13
40
10
14
dd
dd
16
dd
dd
13
8
17
9
25
25
10
17
23
dd
24
30
8
27
11
cc
dd
24
dd
cc
dd
dd
35
dd
dd
21
11
cc
10
dd
8
53
21
13
25
54
cc
27
18
25
9
8
8
dd
dd
7
39
dd
25
Last
20.66
104.50
25.45
66.87
7.39
17.10
42.60
27.26
.80
31.19
69.55
81.42
538.11
77.51
43.42
18.07
28.80
31.35
21.33
29.48
51.57
49.17
43.20
35.12
98.19
42.25
43.61
24.75
11.40
47.68
125.88
67.07
78.63
1.00
20.66
3.99
132.42
50.69
105.72
21.79
306.25
73.00
17.33
15.78
66.84
24.70
55.72
17.16
74.40
46.87
45.73
288.93
7.04
8.09
37.37
150.13
27.91
5.02
7.68
211.36
16.50
77.38
29.24
5.71
54.25
8.48
19.19
8.93
85.27
63.15
2.23
223.89
133.13
10.87
2.21
10.78
566.18
31.28
3.94
102.98
150.40
20.43
4.90
3.21
8.20
2212.80
114.62
227.70
38.17
93.87
10.52
46.43
313.59
13.78
54.33
33.37
2.74
6.25
22.69
66.61
8.67
12.89
164.70
Div
Chg. Amt.
+0.66 ...
+3.97 1.10
–0.18 .285
–2.29 1.08
–0.20 ...
–0.23 .38
–1.14 .04
–1.45 ...
... ...
+0.89 1.50
+4.05 1.55
+2.46 .665
–18.48 2.95
–5.99 .40
–1.98 .12
–0.33 ...
–0.79 .235
–1.54 .08
–0.26 ...
–1.25 .07
–3.11 .31
–2.70 .26
–0.49 ...
+2.72 ...
–1.10 1.00
–0.85 ...
+0.38 .37
–1.51 .125
–0.45 ...
–0.46.6612
+0.25.5734
+1.55.7373
–0.43.1417
–0.02 ...
+1.15 ...
–1.88 ...
+1.30 .60
+0.45 ...
+4.92.5006
–0.59 .28
–6.18 .85
–3.74 ...
–1.21 ...
–1.08 ...
–3.96 .20
–0.31.1125
–1.73 .19
–1.81 ...
–0.49 .75
–6.07 ...
+0.80 ...
–6.74 1.30
–0.10 .17
–1.41 ...
–2.43 .30
–5.24 .70
–1.37 ...
–0.12 ...
–0.07 ...
+5.98 .51
–0.15.1035
+3.17 ...
+0.67 .20
–0.25.0522
–3.95 .73
–0.14.0443
–0.49 .26
–0.17 ...
–5.87 .23
–3.97 ...
–0.11 ...
–12.51 ...
–3.20 ...
+0.15 .07
–0.07 ...
–0.58 ...
–18.57 .40
–0.26 .25
–0.10 .15
–2.65 .59
+1.24 1.51
–3.20 ...
–0.09 .11
+0.18 ...
–0.18 .28
–74.16 ...
+1.32.2875
+1.70 .86
–0.901.4779
–0.69.2725
+0.02 ...
+1.42 ...
+14.14 1.23
–0.31 ...
+2.89 .53
+0.23 .42
+0.05 ...
+0.14 .10
–0.16 .25
–1.77 1.09
–0.59 ...
–0.74 .25
–9.81 ...
–52-Week–
High
Low
2.14
35.00
21.89
40.08
33.23
35.14
22.83
7.25
178.21
86.91
4.10
64.99
99.34
4.55
78.87
60.46
82.09
77.34
211.61
58.09
64.86
8.01
43.88
15.54
4.40
2.75
8.91
8.25
4.03
17.74
22.94
5.16
47.68
13.67
41.30
10.90
11.55
1.81
138.47
127.35
100.92
12.15
273.65
20.68
5.80
15.05
14.50
22.74
121.20
40.70
27.95
23.39
35.48
15.06
37.10
40.42
16.90
65.21
17.51
11.85
29.89
13.46
19.99
21.26
28.66
118.71
63.36
13.68
13.51
160.15
14.22
8.59
30.40
153.98
96.35
10.69
48.93
139.33
5.99
265.28
224.74
15.63
7.64
60.09
Name
Tick
Sym Yld P/E
Last
Div
Chg. Amt.
0.99
15.28
13.02
29.22
17.47
18.59
13.61
4.40
114.69
37.56
1.41
51.55
66.72
2.00
50.05
26.29
67.62
28.40
112.74
39.85
35.38
2.01
25.18
8.45
2.80
1.92
4.92
7.32
2.11
10.82
16.88
1.82
22.40
8.29
25.16
9.95
10.23
0.92
88.01
91.53
80.46
10.09
208.45
12.78
1.56
5.52
11.00
9.87
78.12
20.25
16.69
14.01
12.50
7.84
25.26
28.96
8.63
43.22
10.13
7.71
22.25
9.00
12.67
9.91
17.40
67.28
35.92
5.33
5.26
116.42
9.17
5.59
13.51
84.72
75.61
9.87
33.17
82.25
4.20
203.18
156.76
6.24
4.42
6.87
ClearChannelOutdr
ClearSecure
ClearwaterAnalytic
ClearwaterPaper
ClearwayEnergyA
ClearwayEnergyC
Cleveland-Cliffs
ClipperRealty
Clorox
Cloudflare
CN Finance
Coca-Cola
Coca-Cola Femsa
CoeurMining
Cohen&Steers
Coherent
ColgatePalm
Comerica
ComfortSystems
CommercialMetals
CommBkSys
CommunityHlthSys
CommunityHlthcr
SABESP
EngGr-Cmg C
EngGr-Cmg
COPEL
COPEL
CiaSiderurgica
CerveceriasUnid
CompassDiversif
Compass
CompassMinerals
ComstockRscs
ConagraBrands
ConcordAcqnIIA
ConcordAcqnIII A
ConcordMed
Conmed
ConocoPhillips
ConEd
ConstellationI A
ConstBrands A
Constellium
ContainerStore
Volaris
Cool
Cooper-Standard
Copa
Core&Main
CoreLabs
CorebridgeFin
CoreCard
CoreCivic
Corning
Vesta
CorpAmAirports
Corteva
Cosan
Costamare
CoterraEnergy
Coty
Coupang
Coursera
CousinsProperties
Crane
CraneNXT
CrawfordA
Crawford B
Credicorp
CrescentEnergy
CrescentPoint
CrossTimbers
CrownCastle
Crown Holdings
CrownPropA
CubeSmart
Cullen/Frost
Culp
Cummins
Curtiss-Wright
Cushman&Wkfd
CustomTruck
CustomersBancorp
CCO ...
YOU 1.7
CWAN ...
CLW ...
CWEN.A 5.1
CWEN 5.6
CLF
...
CLPR 7.3
CLX 3.4
NET ...
CNF ...
KO 3.1
KOF 3.2
CDE ...
CNS 3.3
COHR ...
CL 2.4
CMA 5.0
FIX
.5
CMC 1.3
CBU 3.5
CYH ...
CHCT 7.1
SBS 1.5
CIG.C 8.0
CIG 10.6
ELP 3.0
ELPC ...
SID 11.7
CCU 3.2
CODI 4.5
COMP ...
CMP 2.7
CRK 5.6
CAG 5.0
CNDA ...
CNDB ...
CCM ...
CNMD .7
COP 2.0
ED 3.5
CSTA ...
STZ 1.4
CSTM ...
TCS ...
VLRS ...
CLCO12.5
CPS ...
CPA 3.2
CNM ...
CLB .2
CRBG 4.0
CCRD ...
CXW ...
GLW 3.7
VTMX 1.5
CAAP ...
CTVA 1.4
CSAN ...
CMRE 4.1
CTRA 3.1
COTY ...
CPNG ...
COUR ...
CUZ 5.2
CR
.6
CXT 1.0
CRD.A 2.2
CRD.B 2.3
BAP ...
CRGY 4.4
CPG 4.3
CRT 11.9
CCI 5.5
CCK 1.1
CPTK ...
CUBE 4.4
CFR 3.4
CULP ...
CMI 2.8
CW .4
CWK ...
CTOS ...
CUBI ...
dd
cc
dd
7
54
58
29
dd
cc
dd
6
24
16
dd
26
dd
42
6
24
7
18
2
cc
17
7
5
...
13
dd
18
dd
dd
63
4
14
42
cc
dd
58
13
14
cc
29
18
dd
dd
...
dd
...
19
20
8
28
24
45
9
12
36
dd
3
9
28
66
dd
42
...
10
36
35
9
14
dd
9
32
22
27
27
10
dd
12
24
dd
23
8
1.70
21.57
19.55
36.00
25.05
26.85
19.17
5.24
141.29
76.28
2.27
59.67
90.56
2.83
69.09
41.17
79.98
56.51
195.89
48.22
50.86
3.38
25.40
14.79
3.08
2.32
8.32
7.60
3.91
12.61
22.10
3.41
22.54
8.90
28.21
10.42
10.58
1.05
106.88
116.53
93.52
11.05
247.53
18.56
2.35
8.87
13.08
17.64
103.02
39.42
17.49
23.27
12.79
13.83
30.57
38.44
15.79
47.33
15.70
11.35
25.66
11.52
15.74
18.80
24.39
114.42
54.23
12.52
12.10
145.83
12.11
6.92
17.58
113.77
91.23
10.68
46.17
107.56
5.54
238.16
217.73
9.91
6.20
51.81
–0.12 ...
+0.92 .55
–0.48 ...
–0.12 ...
–0.53.3964
–0.58.3964
–1.25 ...
–0.16 .095
–1.30 1.20
–6.98 ...
+0.05 ...
+0.74 .46
–4.081.6528
–0.43 ...
–6.64 .57
–2.36 ...
+0.27 .48
+0.70 .71
–9.78 .25
–1.82 .16
–1.25 .45
+0.25 ...
–1.24 .455
–0.44.2527
–0.07.1216
....1216
–0.16.1588
–0.27 ...
–0.02.1175
+0.07.1146
–0.35 .25
–0.35 ...
–2.78 .15
+0.05 .125
–0.45 .35
+0.04 ...
+0.02 ...
–0.05 ...
–2.63 .20
+0.46 .58
+2.55 .81
... ...
+5.78 .89
–1.40 ...
+0.07 ...
–0.51 ...
+0.36 .41
–1.90 ...
–3.29 .82
–0.99 ...
–0.17 .01
+1.61 .23
–1.04 ...
–0.70 ...
+0.12 .28
–1.18.1703
–0.27 ...
–0.59 .16
+0.04 ...
+0.94 .115
+0.14 .20
–0.90 ...
–0.45 ...
–0.57 ...
+0.04 .32
–3.72 .18
–2.64 .14
–0.66 .07
–0.98 .07
–4.10 ...
–1.10 .12
–0.01 .072
+0.02 .15
–1.421.565
–0.86 .24
+0.03 ...
–0.18 .51
–0.93 .92
–0.25 ...
–1.41 1.68
–5.06 .20
–0.89 ...
+0.02 ...
–5.81 ...
1.97
7.30
6.75
90.14
45.11
0.40
18.61
11.10
182.09
51.19
0.87
21.48
133.36
38.97
71.51
392.21
DHI Group
DHT
DRDGOLD
DTE Energy
DT Midstream
D-WaveQuantum
DXC Tech
Dana
Danaher
Danaos
DanimerScientific
DaqoNewEnergy
Darden
DarlingIngred
DaVita
DeckersOutdoor
DHX ...
DHT 10.5
DRD 4.5
DTE 3.7
DTM 5.1
QBTS ...
DXC ...
DAN 2.9
DHR .4
DAC 4.0
DNMR ...
DQ
...
DRI 3.2
DAR ...
DVA ...
DECK ...
30
9
9
18
15
dd
dd
dd
29
3
dd
3
20
10
17
28
2.42
10.94
7.69
110.65
54.27
.82
22.53
13.67
230.29
79.37
.94
23.61
162.08
46.21
107.24
652.29
–0.17 ...
+1.13 .19
–0.26.3463
+0.39 1.02
–0.53 .69
–0.06 ...
–0.34 ...
–0.94 .10
–1.05 .27
+5.31 .80
–0.08 ...
–2.99 ...
–2.22 1.31
–3.63 ...
+2.48 ...
–16.14 ...
D
6.31
12.13
13.85
121.32
58.30
3.20
30.27
19.75
247.58
80.39
4.59
55.60
173.06
71.60
116.97
723.42
–52-Week–
High
Low
450.00
58.81
31.22
77.45
49.81
21.97
13.44
2.55
10.27
13.88
66.96
190.02
17.32
10.02
4.85
152.61
29.32
139.35
18.43
51.69
417.86
82.43
6.62
11.50
122.50
118.18
29.80
91.02
14.01
251.00
23.60
63.68
415.81
66.96
63.85
49.54
42.51
41.40
5.02
17.98
160.66
60.88
40.12
73.17
37.00
35.95
16.98
58.28
106.43
15.45
78.74
41.44
117.25
3.25
56.18
15.00
Name
Tick
Sym Yld P/E
Last
Div
Chg. Amt.
345.55
36.50
19.39
35.96
30.60
13.61
6.14
0.61
4.91
8.85
42.59
135.63
9.50
7.14
2.82
100.98
16.50
86.33
9.99
19.39
272.58
42.00
1.45
10.31
79.04
78.73
13.88
71.06
9.75
101.09
3.86
39.18
285.84
57.05
35.71
16.08
20.38
23.15
1.57
10.09
127.25
47.26
19.71
51.17
9.32
20.56
8.93
40.24
83.06
8.68
62.80
22.67
77.33
2.31
35.39
9.57
Deere
DelekLogistics
DelekUS
DellTechC
DeltaAir
Deluxe
DesignerBrands
DesktopMetal
Despegar.com
DeutscheBank
DevonEnergy
Diageo
DiamondOffshore
Diamondrock
DianaShipping
Dick's
DieboldNixdorf
DigitalRealty
DigitalBridge
DigitalOcean
Dillard's
DineBrands
Dingdong
DirectSellingA
DiscoverFinSvcs
Disney
DiversifiedEnergy
DolbyLab
Dole
DollarGeneral
Doma
DominionEner
Domino's
Donaldson
DonnelleyFin
DorianLPG
DoubleVerify
DouglasDynamics
DouglasElliman
DouglasEmmett
Dover
Dow
Doximity
DrReddy'sLab
DreamFinders
Dril-Quip
DuckhornPtf
Ducommun
DukeEnergy
Dun&Bradstreet
DuPont
DutchBros
DycomInds
DynagasLNG
Dynatrace
DynexCapital
DE 1.5
DKL 9.4
DK 3.7
DELL ...
DAL 1.0
DLX 5.9
DBI 2.4
DM
...
DESP ...
DB
...
DVN 6.2
DEO 2.8
DO
...
DRH 1.3
DSX 19.5
DKS 2.9
DBD ...
DLR 3.7
DBRG .2
DOCN ...
DDS .3
DIN 4.4
DDL ...
DSAQ ...
DFS 2.5
DIS
.7
DEC ...
DLB 1.4
DOLE 2.6
DG 1.7
DOMA ...
D
5.4
DPZ 1.2
DCI 1.6
DFIN ...
LPG .0
DV
...
PLOW 4.4
DOUG .0
DEI 5.3
DOV 1.4
DOW 5.1
DOCS ...
RDY .6
DFH ...
DRQ ...
NAPA ...
DCO ...
DUK 4.2
DNB 1.7
DD 1.9
BROS ...
DY
...
DLNG ...
DT
...
DX 12.7
11
13
25
21
8
30
5
dd
dd
6
8
18
29
24
5
12
1
46
dd
dd
8
10
dd
dd
8
71
15
41
9
16
dd
25
27
22
22
8
cc
22
dd
cc
20
30
48
19
13
dd
17
35
63
dd
8
cc
15
3
90
69
395.96
44.64
26.16
75.84
40.54
20.46
8.50
.62
9.43
13.73
45.94
141.51
12.47
9.36
3.20
138.93
28.84
130.83
17.09
35.34
372.74
45.86
1.50
10.89
111.85
90.90
15.75
84.32
12.52
135.76
4.42
49.04
400.03
63.56
59.31
47.80
34.25
26.67
2.88
14.31
147.49
54.82
28.10
70.53
32.89
22.40
9.71
51.63
98.54
11.97
76.69
31.11
109.06
2.92
51.75
12.29
–3.91 1.47
+1.471.045
+0.36 .24
–0.66 ...
+0.31 .10
–0.99 .30
–0.35 .05
–0.13 ...
–0.03 ...
+0.18 ...
+0.64 .57
–4.152.5088
–0.53 ...
–0.03 .03
+0.23 .15
–8.02 1.00
–0.11 ...
–3.75 1.22
–0.45 .01
–1.35 ...
–30.91 .25
–3.79 .51
... ...
... ...
–0.55 .70
+0.61 .30
+0.75 ...
–1.86 .30
+0.23 .08
–0.19 .59
–0.21 ...
+2.04.6675
–12.20 1.21
–1.79 .25
–3.06 ...
+3.93 1.00
–2.53 ...
–3.01 .295
–0.07.0476
–0.19 .19
–6.32 .51
–0.02 .70
+0.06 ...
+0.95.4877
–2.64 ...
–0.87 ...
–0.14 ...
–0.43 ...
+1.501.025
+0.27 .05
–0.24 .36
–0.56 ...
–6.03 ...
+0.12 ...
–2.94 ...
–0.23 .13
48.10
142.63
25.10
98.52
197.99
33.92
28.11
49.33
85.50
0.75
2.15
39.15
129.76
10.27
146.53
68.89
3.15
150.86
143.91
8.59
8.26
33.71
58.82
60.57
7.88
46.18
8.12
0.31
17.08
412.00
10.82
5.09
12.44
8.63
11.49
11.11
3.26
2.20
1.81
76.94
5.39
35.43
6.52
31.03
elfBeauty
EMCOR
ENI
EOG Rscs
EPAM Systems
EPR Prop
EQT
ESAB
ESCO Tech
ESSTech
E2open
EagleBulkShip
EagleMaterials
EasterlyGovtProp
EastGroup
EastmanChem
EastmanKodak
Eaton
Ecolab
Ecopetrol
Ecovyst
EdgewellPersonal
EdisonIntl
EdwardsLife
ElancoAnimal
Elastic
EldoradoGold
ElectriqPower
ElementSolns
ElevanceHealth
EllingtonFin
EllingtonResiMtg
ElmeComms
EmbotellAndinaA
EmbotellAndinaB
Embraer
EmeraldHldg
Emeren
EmergentBiosol
EmersonElec
EmpireStateRealty
EmployersHldgs
EmpresaDisCom
Enbridge
ELF
...
EME .3
E
...
EOG 3.0
EPAM ...
EPR 6.9
EQT 1.6
ESAB .3
ESE .3
GWH ...
ETWO ...
EGLE .7
EXP .5
DEA 7.9
EGP 2.8
EMN 3.6
KODK ...
ETN 1.5
ECL 1.2
EC 18.4
ECVT ...
EPC 1.7
EIX 4.3
EW
...
ELAN ...
ESTC ...
EGO ...
ELIQ ...
ESI 1.4
ELV 1.2
EFC 8.8
EARN15.8
ELME 5.0
AKO.A 6.8
AKO.B 5.7
ERJ ...
EEX ...
SOL ...
EBS ...
EMR 2.2
ESRT 1.4
EIG 2.8
EDN ...
ENB 7.3
65
18
10
9
36
25
5
24
29
dd
dd
25
15
41
45
18
6
31
45
5
18
16
23
31
dd
dd
dd
68
cc
19
11
16
dd
11
13
dd
dd
46
dd
dd
30
9
5
33
138.02
212.45
33.86
120.38
288.85
47.79
38.71
84.42
103.81
1.05
4.04
56.22
200.12
13.41
179.32
89.19
3.62
234.86
195.25
12.55
9.26
35.59
72.57
72.85
15.45
104.10
11.96
.33
22.35
480.03
12.24
6.08
14.28
11.90
15.66
17.50
6.04
2.50
2.20
95.47
9.81
39.61
18.39
36.70
–6.32 ...
–2.98 .18
–0.15 ...
–0.57 .91
–8.49 ...
–0.66 .275
+0.05.1575
–2.20 .06
–13.22 .08
–0.09 ...
–0.35 ...
+0.82 .10
–2.72 .25
–0.03 .265
–4.22 1.27
–0.63 .81
–0.28 ...
–5.96 .86
–3.10 .57
+0.63.1479
–0.51 ...
–1.04 .15
+1.08 .78
–3.40 ...
+0.55 ...
–8.60 ...
–1.01 ...
+0.01 ...
–0.79 .08
+8.47 1.48
–0.47 .09
–0.05 .08
–0.32 .18
–1.10.1442
+0.75.1586
–0.95 ...
+0.06 ...
–0.23 ...
–0.20 ...
–1.86 .525
+0.12 .035
+0.21 .28
–0.98 ...
+0.68.6731
E
153.53
227.50
34.30
137.95
385.96
49.10
45.23
87.98
118.60
2.57
7.21
67.09
206.47
16.79
188.85
92.21
6.34
241.97
201.62
13.14
12.35
46.13
74.92
94.87
15.94
118.24
13.71
11.85
23.75
508.78
14.42
8.15
19.82
13.50
17.66
20.13
6.42
5.60
16.66
100.62
10.15
46.12
21.80
42.11
–52-Week–
High
Low
72.06
95.00
26.26
4.55
3.90
8.36
37.89
14.15
5.51
32.94
18.17
113.34
12.32
23.10
16.64
23.17
58.64
66.71
10.89
161.66
111.90
27.95
7.33
69.22
10.01
43.29
52.00
2.74
252.60
34.73
34.80
10.71
34.99
26.42
74.40
69.45
1.75
16.36
24.38
53.91
26.43
49.28
252.85
283.62
36.20
19.18
11.05
11.91
174.04
11.91
417.92
19.85
86.84
42.03
36.70
25.52
129.18
29.40
25.04
170.30
120.70
Name
B A R R ON S .C OM / D ATA
Tick
Sym Yld P/E
Last
Div
Chg. Amt.
51.15
44.62
17.65
1.77
2.10
3.94
27.68
11.45
1.35
22.94
12.84
73.24
7.37
15.45
7.12
18.94
35.30
43.04
10.00
91.74
87.10
24.66
3.35
33.12
5.64
20.00
0.61
1.00
159.95
25.23
21.89
4.60
20.50
18.10
60.47
52.57
1.32
10.40
11.35
36.53
20.49
32.07
195.03
102.22
24.76
12.94
5.10
5.72
104.36
10.24
331.08
9.94
52.03
31.55
23.33
13.70
102.89
7.36
14.33
101.19
97.48
EncompassHealth
Endava
Endeavor
EndeavourSilver
EnelChile
Enerflex
Energizer
EnergyTransfer
EnergyVault
EnerpacTool
Enerplus
EnerSys
Enfusion
EngageSmart
Enhabit
Ennis
EnovaIntl
Enovis
EnphysAcqnA
Enpro
Entergy
EnterpriseProd
Entravision
Envestnet
Enviri
Envista
Enviva
EnzoBiochem
Equifax
Equinor
Equitable
EquitransMdstm
EquityBcshs
EquityCommnwlth
EquityLife
EquityResdntl
EquusTotReturn
ErmenegildoZegna
EroCopper
EssentGroup
EssentialProp
EssentialUtil
EssexProp
EsteeLauder
EthanAllen
Euronav
EveHolding
Eventbrite
EvercoreA
EverestConsolA
Everest
Everi
EversourceEner
Evertec
EvolentHealth
ExcelerateEner
ExpeditorsIntl
Express
Expro
ExtraSpaceSt
ExxonMobil
EHC .9
DAVA ...
EDR 1.0
EXK ...
ENIC 9.6
EFXT 1.6
ENR 3.9
ET 9.0
NRGV ...
EPAC .1
ERF 1.3
ENS .9
ENFN ...
ESMT ...
EHAB ...
EBF 4.7
ENVA ...
ENOV ...
NFYS ...
NPO .8
ETR 4.3
EPD 7.5
EVC 5.0
ENV ...
NVRI ...
NVST ...
EVA .0
ENZ ...
EFX .7
EQNR 2.8
EQH 2.7
ETRN 5.6
EQBK 1.3
EQC .0
ELS 2.6
EQR 4.4
EQS ...
ZGN 1.0
ERO ...
ESNT 1.9
EPRT 4.5
WTRG 3.3
ESS 3.8
EL
1.9
ETD 4.8
EURN13.0
EVEX ...
EB
...
EVR 1.8
MNTN ...
EG 1.9
EVRI ...
ES 4.3
EVTC .5
EVH ...
EE
.7
EXPD 1.1
EXPR ...
XPRO ...
EXR 4.1
XOM 3.7
19
47
dd
32
3
dd
16
13
dd
28
5
17
cc
cc
dd
12
9
dd
30
20
15
11
cc
dd
dd
22
dd
dd
56
6
10
15
11
28
44
34
2
31
19
8
22
21
30
90
8
5
dd
dd
21
dd
7
9
19
27
dd
17
24
0
cc
29
10
68.04
74.65
23.53
1.85
3.12
4.51
30.54
13.95
1.98
28.71
14.92
96.48
9.17
22.93
9.76
21.18
55.03
56.21
10.69
144.71
103.94
26.70
4.00
48.28
8.49
23.38
.79
1.36
237.02
32.03
33.05
10.67
34.25
19.50
69.04
60.70
1.57
10.93
16.39
52.85
25.47
37.69
243.58
137.30
30.00
17.60
7.28
7.93
166.59
10.91
371.41
10.80
62.07
39.26
32.36
14.57
128.52
8.41
16.80
158.08
102.63
+1.32 .15
–3.20 ...
–0.20 .06
–0.12 ...
–0.12.3076
–0.16.0184
–1.14 .30
+0.15.3125
–0.35 ...
–2.38 .04
–0.42.0607
–4.48 .225
–0.53 ...
+0.03 ...
–0.59 ...
–0.73 .25
–0.33 ...
+0.19 ...
+0.02 ...
–12.03 .29
+2.75 1.13
+0.35 .50
–0.17 .05
–1.24 ...
–0.51 ...
–0.68 ...
–0.20 .905
–0.03 ...
–10.27 .39
+0.39 .30
–0.25 .22
+0.49 .15
+0.35 .12
+0.30 4.25
–1.50.4475
–0.46.6625
+0.12 ...
–0.64 .109
+0.60 ...
+0.11 .25
–0.09 .285
+0.34.3071
–4.36 2.31
–8.95 .66
–1.92 .36
+0.01 .57
–0.04 ...
–0.43 ...
–4.46 .76
–0.03 ...
+17.83 1.75
–0.47 ...
+0.35 .675
–1.68 .05
–0.67 ...
–0.89 .025
+1.32 .69
+0.04 ...
+0.88 ...
–2.25 1.62
+2.65 .95
14.76
24.34
5.16
49.49
10.09
1.40
17.07
154.60
90.19
377.89
575.39
9.44
7.97
2.99
97.00
115.31
85.27
47.83
30.23
180.88
123.17
216.20
11.55
31.84
46.91
0.68
3.55
49.55
10.18
11.16
3.69
8.99
40.44
4.38
32.18
0.65
99.85
1.30
2.00
F&GAnnuities
FB Financial
Figs
FMC
FNB
FreyrBattery
FS KKR Cap
FTI Consulting
Fabrinet
FactSet
FairIsaac
FarmlandPtrs
Fastly
FathomDigital
FedAgriMtg A
FedAgriMtg C
FederalRealty
FederalSignal
FederatedHermes
FedEx
Ferguson
Ferrari
FidelisInsurance
FidNatlFinl
FidNatlInfo
FinanceofAm
FinVolution
FirstAmerFin
FirstBanCorp
FirstCmwlthFin
FirstFoundation
FirstHorizon
FirstIndRlty
FirstMajestic
FirstEnergy
FiscalNote
Fiserv
Fisker
FivePoint
FG 1.9
FBK 1.5
FIGS ...
FMC 3.8
FNB 3.5
FREY ...
FSK 12.4
FCN ...
FN
...
FDS .9
FICO ...
FPI 2.0
FSLY ...
FATH ...
AGM.A 2.9
AGM 2.4
FRT 4.3
FSS .6
FHI 3.4
FDX 2.0
FERG 1.7
RACE .6
FIHL ...
FNF 3.9
FIS 3.4
FOA ...
FINV 4.0
FAF 3.4
FBP 3.5
FCF 3.4
FFWM .4
FHN 4.1
FR 2.5
AG
.3
FE 4.3
NOTE ...
FI
...
FSR ...
FPH ...
38
14
70
15
9
dd
9
29
27
37
66
40
dd
dd
10
12
30
30
11
16
21
48
...
20
dd
dd
4
27
10
10
dd
9
26
dd
42
dd
28
dd
12
42.87
38.84
6.15
60.78
13.71
1.72
20.72
194.72
184.29
456.58
1115.46
11.88
16.17
4.67
151.46
186.88
101.97
72.14
33.27
246.81
187.15
334.93
12.26
48.85
61.41
.95
4.87
61.66
15.97
14.83
9.95
14.49
51.82
5.57
38.13
1.01
132.57
1.33
3.03
–3.13 .21
–1.01 .15
–0.80 ...
–2.27 .58
–0.06 .12
–0.15 ...
+0.75 .05
–4.43 ...
–6.04 ...
–20.47 .98
–48.55 ...
–0.60 .06
–1.63 ...
+0.21 ...
–5.66 1.10
–4.34 1.10
–1.08 1.09
–4.60 .10
–0.59 .28
–6.16 1.26
–5.92 .79
–3.501.9963
–0.41 ...
–2.17 .48
+1.34 .52
–0.15 ...
–0.03 .215
–2.78 .53
–0.48 .14
–0.61 .125
+0.27 .01
+0.33 .15
–0.85 .32
–0.58.0046
+1.47 .41
–0.13 ...
–0.27 ...
–0.42 ...
–0.04 ...
F
48.14
41.00
10.20
133.37
14.68
11.16
20.99
232.15
199.99
478.60
1185.42
13.66
24.31
39.24
159.49
198.17
115.08
78.54
45.55
285.53
194.13
372.42
15.30
51.48
79.32
2.25
6.05
65.55
17.15
16.53
16.70
24.90
55.51
9.07
43.31
6.60
136.49
8.66
3.74
–52-Week–
High
Low
47.66
12.50
284.39
35.97
116.70
9.24
29.23
41.99
40.77
133.62
47.22
15.42
34.92
4.02
46.28
79.90
4.20
80.33
33.84
29.30
161.25
14.92
49.77
34.37
46.73
27.72
32.49
22.95
3.87
10.18
83.64
10.31
Name
Tick
Sym Yld P/E
Last
Div
Chg. Amt.
20.04
10.04
180.84
27.76
74.41
2.90
19.64
29.99
25.69
78.71
14.84
9.63
13.72
1.10
36.30
62.70
2.58
54.10
19.31
20.51
102.29
11.08
32.19
21.88
32.83
16.37
21.41
11.10
0.96
5.41
62.57
5.27
FiverrIntl
FlameAcqnA
FleetCorTech
FlexLNG
Floor&Decor
FlotekIndustries
FlowersFoods
Flowserve
Fluor
FomentoEconMex
FootLocker
FordMotor
Forestar
ForgeGlobal
Fortis
Fortive
FortunaSilver
FortuneBrands
ForumEnergyTech
FourCornersProp
Franco-Nevada
FrankBSPRealty
FranklinCovey
FranklinRscs
FreeportMcM
FreseniusMedCare
FreshDelMonte
Frontline
fuboTV
FullTruck
FullerHB
FutureFuel
FVRR ...
FLME ...
FLT ...
FLNG 9.6
FND ...
FTK ...
FLO 4.0
FLS 2.0
FLR ...
FMX 1.1
FL 5.5
F
5.1
FOR ...
FRGE ...
FTS 4.1
FTV .4
FSM ...
FBIN 1.3
FET ...
FCPT 5.5
FNV 1.2
FBRT10.6
FC
...
BEN 4.3
FCX 1.4
FMS 2.0
FDP 2.8
FRO 15.4
FUBO ...
YMM ...
FUL 1.1
FF 4.0
dd
dd
22
12
40
dd
36
21
62
12
35
8
10
dd
18
31
dd
22
dd
23
31
22
32
17
28
20
12
7
dd
28
29
9
26.04
11.88
280.76
31.27
104.53
3.60
22.80
39.94
38.31
126.35
29.12
11.85
33.97
2.76
41.63
71.44
3.65
74.72
22.58
25.02
110.04
13.35
40.66
28.88
41.41
20.57
27.10
22.24
2.93
6.73
77.82
6.00
–1.18 ...
+0.49 ...
–1.85 ...
+2.21 .75
–7.03 ...
–0.32 ...
+0.29 .23
–1.28 .20
–0.86 ...
–4.001.0138
–2.03 .40
–0.34 .15
+0.90 ...
–0.67 ...
+0.50 .435
–2.19 .08
–0.21 ...
–1.42 .24
+0.41 ...
–0.28 .345
–0.77 .34
–0.16 .355
–2.87 ...
–0.91 .31
–1.16 .075
–0.26.6181
+0.85 .20
+2.19 .30
–0.25 ...
–0.28 ...
–3.59 .205
–0.08 .06
97.21
6.94
26.87
50.33
2.00
33.20
43.57
174.45
11.83
1.62
2.22
7.22
93.22
292.60
10.68
3.51
12.39
79.86
202.35
70.75
60.33
26.30
10.12
17.31
8.05
8.28
3.41
29.41
126.35
4.51
8.05
4.20
0.14
3.42
25.95
26.98
1.12
26.77
1.30
44.03
4.01
4.76
24.14
20.52
8.04
7.56
27.07
94.05
16.08
135.41
102.23
43.39
67.44
8.89
12.75
289.36
22.92
65.93
1.88
9.11
545.00
543.46
33.74
3.97
4.82
20.07
5.97
6.24
GATX
GEO Group
GFLEnvironmental
GMS
GOL Linhas
GSK
GXO Logistics
Gallagher
GameStop
Gannett
GaotuTechedu
Gap
Garmin
Gartner
GatesIndustrial
GatosSilver
GencoShipping
Generac
GeneralDynamics
GeneralElec
GeneralMills
GeneralMotors
GenAsia I A
Genesco
GenesisEnergy
GenieEnergy
GeniusSports
Genpact
GenuineParts
GenworthFin
GeoPark
Gerdau
Getaround
GettyImages
GettyRealty
Gildan
GinkgoBioworks
GlacierBancorp
Glatfelter
Glaukos
GlobalBlue
GlblBusTravel
GlobalIndemnity
GlobalIndl
GlobalMedREIT
GlobalNetLease
GlobalPtrs
GlobalPayments
GlobalShipLease
Globant
GlobeLife
GlobusMedical
GoDaddy
GoldFields
GoldmanSachsBDC
GoldmanSachs
Gorman-Rupp
Graco
GrafTechIntl
Graham
GrahamHoldings
Grainger
GraniteConstr
GranitePointMtg
GraniteRidge
GraphicPkg
GrayTelevision
GrayTelevision A
GATX 1.9
GEO ...
GFL .2
GMS ...
GOL ...
GSK 3.5
GXO ...
AJG 1.0
GME ...
GCI
...
GOTU ...
GPS 2.9
GRMN 2.4
IT
...
GTES ...
GATO ...
GNK 3.6
GNRC ...
GD 2.1
GE
.3
GIS 3.6
GM 1.0
GAQ ...
GCO ...
GEL 5.0
GNE 1.1
GENI ...
G
1.6
GPC 2.8
GNW ...
GPRK 5.7
GGB .5
GETR ...
GETY ...
GTY 6.2
GIL 2.3
DNA ...
GBCI 3.3
GLT ...
GKOS ...
GB
...
GBTG ...
GBLI 3.1
GIC 2.2
GMRE 7.9
GNL 14.5
GLP 6.4
GPN .8
GSL 7.1
GLOB ...
GL
.7
GMED ...
GDDY ...
GFI 2.6
GSBD12.2
GS 2.8
GRC 2.2
GGG 1.2
EAF 2.0
GHM ...
GHC 1.0
GWW .9
GVA 1.1
GPMT13.9
GRNT 7.6
GPK 1.6
GTN 3.6
GTN.A 3.7
18
13
dd
11
72
11
35
43
dd
17
38
cc
23
37
14
dd
68
46
21
14
16
5
36
dd
27
12
dd
15
15
8
4
5
dd
dd
20
12
dd
18
dd
dd
91
dd
21
20
44
dd
11
38
2
62
13
34
43
17
11
19
31
27
41
71
21
23
82
dd
4
12
12
12
118.45
10.67
32.31
78.69
3.21
39.21
58.99
225.28
15.96
2.33
3.76
20.79
122.85
425.37
13.15
5.92
16.90
117.62
253.90
126.29
64.99
35.99
10.95
31.06
12.09
27.01
5.66
34.19
136.62
6.72
9.33
4.75
.20
5.15
29.02
31.81
1.53
40.26
1.67
79.11
4.64
6.10
32.26
36.79
10.68
9.78
42.94
127.39
21.05
221.31
122.28
52.96
100.22
12.78
14.81
386.44
33.41
83.16
1.99
19.40
679.39
818.71
48.20
5.74
5.82
25.74
8.94
8.54
–1.77 .55
–0.16 ...
–2.20 .013
–3.74 ...
–0.41 ...
+2.15.3613
–2.17 ...
+0.40 .55
–1.57 ...
+0.03 ...
+0.14 ...
–0.12 .15
–5.69 .73
–25.74 ...
–0.27 ...
–0.62 ...
+0.31 .15
–11.62 ...
–5.77 1.32
–1.34 .08
–0.15 .59
+0.07 .09
+0.08 ...
–4.15 ...
+0.51 .15
–1.12 .075
–0.52 ...
–0.52.1375
–1.88 .95
+0.04 ...
+0.76 .134
–0.10.0962
–0.03 ...
–0.10 ...
–0.20 .45
–1.25 .186
–0.16 ...
–1.06 .33
–0.27 ...
–0.38 ...
–0.09 ...
–0.35 ...
+0.02 .25
–2.05 .20
–0.42 .21
–0.17 .354
+0.63 .685
+0.39 .25
+1.23 .375
–16.67 ...
+0.56 .225
–0.33 ...
–5.94 ...
–1.68.1717
+0.16 .45
+0.67 2.75
–2.12 .18
–3.60 .255
–0.20 .01
+0.43 ...
–17.13 1.65
–9.98 1.86
–2.66 .13
–0.20 .20
–0.20 .11
+1.09 .10
–0.02 .08
–0.03 .08
G
133.01
12.42
39.06
84.65
5.59
39.31
67.57
254.00
27.65
3.60
5.49
22.08
129.32
469.58
14.93
7.49
19.84
156.95
261.39
129.20
90.89
43.63
11.20
51.04
12.78
30.90
8.45
48.58
181.37
6.93
16.17
6.34
0.81
8.22
36.49
37.65
2.55
50.03
4.87
86.53
7.60
8.05
37.00
39.74
11.79
15.28
43.62
138.07
21.83
250.39
125.02
80.04
107.82
17.78
16.52
389.47
36.69
87.94
6.74
19.93
702.40
841.00
52.24
7.07
9.21
27.56
14.40
14.05
January 8, 2024
NEW YORK STOCK EXCHANGE COMPOSITE LIST
D ATA
–52-Week–
High
Low
9.24
59.30
21.37
50.76
12.49
6.78
84.87
76.00
19.04
62.45
9.09
310.08
4.40
200.85
314.48
2.68
4.78
6.57
35.70
24.84
111.00
14.89
140.83
4.08
26.46
7.30
25.41
4.72
3.28
62.07
57.38
14.50
25.97
4.49
179.44
1.46
107.25
165.00
2.02
1.76
2.10
22.12
17.21
60.34
9.45
60.15
Name
GreatAjax
GreenBrickPtrs
GreenDot
Greenbrier
GreenfireResources
GreenTree
Greif B
Greif A
GreystoneHousing
Griffon
Grindr
Group1Auto
GroveCollab
GpoAeroportuar
GpoAeroportSur
GpoAvalAcc
GpoSupervielle
GrupoTelevisa
GuarantyBcshrs
Guess
Guidewire
GuildHldgs
GulfportEnergy
Tick
Sym Yld P/E
AJX 8.3
GRBK ...
GDOT ...
GBX 2.6
GFR ...
GHG ...
GEF.B 4.8
GEF 3.2
GHI 8.8
GFF 1.0
GRND ...
GPI
.6
GROV ...
PAC 4.5
ASR 1.8
AVAL 6.4
SUPV ...
TV 2.5
GNTY 2.9
GES 5.2
GWRE ...
GHLD .0
GPOR ...
dd
9
13
14
51
...
8
10
9
42
dd
6
dd
17
15
42
6
dd
12
9
dd
22
1
Last
5.27
49.93
8.76
46.58
5.43
3.41
63.91
64.18
16.88
58.19
8.30
282.75
1.94
169.46
286.41
2.60
3.37
3.11
32.13
23.05
105.09
13.68
125.34
Div
Chg. Amt.
NYSE Cumulative Daily Breadth vs DJIA
–0.03 .11
–2.01 ...
–1.14 ...
+2.40 .30
+0.57 ...
–0.35 ...
–2.10 .77
–1.41 .52
+0.09 .37
–2.76 .15
–0.48 ...
–21.99 .45
+0.17 ...
–5.761.943
–7.865.727
+0.17.0184
–0.69 ...
–0.23.0985
–1.49 .23
–0.01 .30
–3.95 ...
–0.41 .50
–7.86 ...
Slow Start: The S&P 500 fell 1.5% in the firsts days of 2024. As markets took a breather, so did NYSE Composite breadth—falling for the
first week in two months. NYSE losers outnumbered gainers, 2-to-1.
Breadth
For personal non-commercial use only. Do not edit or alter. Reproductions not permitted.
To reprint or license content, please contact Barron's reprints department at 800-843-0008 or www.djreprints.com
DJIA
600,000
37,800
Breadth 597,496
595,600
35,400
586,800
34,200
582,400
33,000
578,000
31,800
F
215.96
38.49
55.95
37.12
10.12
24.61
25.22
32.41
2.15
72.26
7.52
7.49
27.84
9.21
13.98
3.54
13.22
103.83
25.43
2.93
64.25
25.05
26.10
9.06
10.16
9.80
13.86
15.24
3.55
152.60
119.78
37.50
6.19
30.41
11.14
93.97
10.94
1.81
178.82
113.82
25.63
13.66
58.81
17.06
37.19
26.78
33.14
127.29
4.30
5.65
6.65
8.50
1.93
19.61
274.26
23.36
27.81
30.12
89.05
83.92
43.35
65.42
38.17
219.77
267.99
3.94
4.05
423.29
188.51
22.14
92.56
0.52
27.88
HCA Healthcare
HCI Group
HDFC Bank
HF Sinclair
HH&L Acqn
HNI
HP
HSBC
HUYA
Haemonetics
Hagerty
Haleon
Halliburton
HamiltonBeach
HamiltonIns
Hanesbrands
HannonArmstrong
HanoverIns
HarleyDavidson
HarmonyGold
HartfordFinl
HavertyFurn
HavertyFurn A
HawaiianElec
HaymakerAcqnCorp.4
Hayward
HealthcareRealty
HealthpeakProp
HeclaMining
Heico
Heico A
HeliosTech
HelixEnergy
Helm&Payne
Herbalife
HercHoldings
HerculesCapital
HeritageInsurance
Hershey
Hess
HessMidstream
HewlettPackard
Hexcel
HighwoodsProp
Hillenbrand
Hilltop
HiltonGrandVac
Hilton
HimalayaShipping
Hims&HersHealth
Hippo
HireRight
Holley
HomeBancShares
HomeDepot
HondaMotor
HoraceMann
HormelFoods
DR Horton
HoulihanLokey
Hovnanian
HowardHughes
HowmetAerospace
Hubbell
HubSpot
HudbayMinerals
HudsonPacProp
Humana
HuntingIngalls
Huntsman
HyattHotels
Hyliion
HysterYaleMatls
HCA .9
HCI 1.8
HDB .9
DINO 3.4
HHLA ...
HNI 3.2
HPQ 3.7
HSBC 6.5
HUYA ...
HAE ...
HGTY ...
HLN 1.2
HAL 1.8
HBB 2.4
HG
...
HBI
...
HASI 6.2
THG 2.7
HOG 1.9
HMY ...
HIG 2.3
HVT 3.4
HVT.A 3.2
HE
.0
HYAC ...
HAYW ...
HR 7.4
PEAK 6.1
HL
.3
HEI
.1
HEI.A .1
HLIO .9
HLX ...
HP 2.8
HLF ...
HRI 1.8
HTGC 9.3
HRTG ...
HSY 2.5
HES 1.2
HESM 7.8
HPE 3.0
HXL .7
HIW 8.7
HI 2.0
HTH 1.9
HGV ...
HLT .3
HSHP ...
HIMS ...
HIPO ...
HRT ...
HLLY ...
HOMB 3.0
HD 2.4
HMC 2.6
HMN 4.0
HRL 3.5
DHI .8
HLI 1.9
HOV ...
HHH ...
HWM .4
HUBB 1.5
HUBS ...
HBM ...
HPP .0
HUM .8
HII 2.1
HUN 3.8
H
.5
HYLN ...
HY 2.0
14
21
20
5
dd
44
9
6
dd
33
dd
29
12
20
dd
dd
70
dd
7
14
11
9
9
8
...
43
dd
46
dd
59
47
27
73
9
7
11
9
6
20
28
16
11
38
18
25
21
14
36
dd
dd
dd
cc
cc
12
22
8
dd
22
11
30
6
dd
35
25
dd
cc
dd
19
19
55
29
dd
10
275.84
89.46
65.57
53.60
10.73
40.52
29.95
40.74
3.35
81.43
7.74
8.45
35.97
18.15
15.45
4.04
25.38
124.20
35.26
5.90
82.82
35.45
34.97
14.87
10.30
12.73
16.86
19.63
4.30
172.01
136.45
42.35
9.62
35.28
12.78
138.52
17.22
6.35
187.64
145.06
31.51
17.17
71.47
23.04
45.15
34.19
40.46
180.50
7.43
8.35
8.64
12.68
4.61
24.33
342.94
31.75
33.23
32.16
148.63
114.91
154.32
82.92
53.83
318.16
537.84
5.35
9.67
458.27
252.50
24.82
128.37
.82
63.79
+5.16 .60
+2.06 .40
–1.54.6968
–1.97 .45
+0.03 ...
–1.31 .32
–0.14.2756
+0.20 .50
–0.31 ...
–4.08 ...
–0.06 ...
+0.22.046
–0.18 .16
+0.66 .11
+0.50 ...
–0.42 ...
–2.20 .395
+2.78 .85
–1.58 .165
–0.25 ...
+2.44 .47
–0.05 1.00
–0.61 .95
+0.68 .36
+0.03 ...
–0.87 ...
–0.37 .31
–0.17 .30
–0.51.0025
–6.86 .10
–5.99 .10
–3.00 .09
–0.66 ...
–0.94 .17
–2.48 ...
–10.37.6325
+0.55 .08
–0.17 ...
+1.201.192
+0.90.4375
–0.12.6175
+0.19 .13
–2.28 .125
+0.08 .50
–2.70.2225
–1.02 .16
+0.28 ...
–1.59 .15
+0.67 ...
–0.55 ...
–0.48 ...
–0.77 ...
–0.26 ...
–1.00 .18
–3.61 2.09
+0.84.5905
+0.53 .33
+0.05.2825
–3.35 .30
–5.00 .55
–1.30 ...
–2.63 ...
–0.29 .05
–10.77 1.22
–42.70 ...
–0.17 ...
+0.36 .125
+0.46 .885
–7.14 1.30
–0.31.2375
–2.04 .15
+0.01 ...
+1.60 .325
I
25.04 19.34 ICICI Bank
8.35 4.65 ICL Group
IBN
ICL
.5 18 24.09 +0.25.1736
3.1 7 5.05 +0.04.0531
36,600
591,200
H
304.86
95.26
71.76
62.20
11.30
43.22
33.90
42.47
6.50
95.26
10.42
9.05
43.85
18.68
16.35
8.80
39.67
148.78
51.77
6.58
83.04
38.85
40.00
43.71
10.35
15.22
22.36
28.43
7.00
191.00
150.42
72.61
11.88
51.25
21.33
162.47
18.05
9.79
276.88
167.75
33.32
18.14
79.08
31.88
53.76
35.66
51.81
183.51
7.49
12.34
20.39
14.00
8.06
25.80
354.92
36.82
38.57
47.03
154.64
123.51
162.50
89.58
54.53
340.06
593.53
6.34
12.23
541.21
261.42
33.46
133.62
3.88
64.79
37
BARRON’S
M
A
M
J
J
A
S
O
N
D
J
In generating this chart, we subtract each day's NYSE composite declines from that day's advances. The resultant total is
added to the next day's total, and so on. When all five days' numbers are added together, this produces the weekly figure we
plot. Dec. 31, 1985 =1000.
–52-Week–
High
Low
112.96
35.18
10.13
15.22
3.53
20.56
241.86
9.35
121.19
3.34
240.15
4.26
265.00
21.82
5.25
19.68
11.25
30.13
19.59
78.16
90.81
113.46
115.55
2.73
131.09
330.00
189.07
39.38
31.47
100.99
12.03
12.42
129.16
91.95
26.02
166.34
118.34
33.99
41.89
53.25
40.95
34.51
27.25
15.56
2.94
36.53
21.60
70.66
7.05
Name
Tick
Sym Yld P/E
Last
Div
Chg. Amt.
88.10
21.64
4.12
11.00
0.97
12.48
167.42
5.49
75.82
1.99
183.77
2.31
217.06
14.77
2.21
11.61
10.39
13.29
14.71
51.84
36.66
89.54
63.36
0.75
93.56
123.27
90.30
25.44
22.99
63.00
10.28
10.28
94.16
61.03
17.94
120.55
62.11
22.30
29.01
33.49
27.20
17.23
20.76
6.34
0.36
28.49
3.59
48.94
4.24
IDACORP
IDT
IHS Holding
ING Groep
INNOVATE
Invesco
IQVIA
IRSA
ITT
IamGold
IDEX
iHuman
IllinoisToolWks
Imax
IndependenceContr
IndepRealty
InFinTAcqnA
Informatica
Infosys
IngersollRand
Ingevity
Ingredion
InnovativeIndProp
Innovid
Insperity
InspireMedical
InstalledBldg
InsteelInds
Instructure
IntegerHoldings
IntegratedRailA
IntegratedWellA
ICE
InterContinentl
IntercorpFinSvcs
IBM
IntlFlavors
IntlGameTech
IntlPaper
IntlSeaways
Interpublic
IntrepidPotash
InvenTrust
InvescoMtg
Invitae
InvitatHomes
IonQ
IronMountain
ItauUnibanco
IDA 3.4
IDT
...
IHS
...
ING 5.2
VATE ...
IVZ 4.5
IQV ...
IRS 9.8
ITT 1.0
IAG ...
IEX 1.2
IH
...
ITW 2.2
IMAX ...
ICD
...
IRT 4.3
IFIN ...
INFA ...
INFY 1.3
IR
.1
NGVT ...
INGR 2.9
IIPR 7.7
CTV ...
NSP 2.0
INSP ...
IBP
.8
IIIN
.3
INST ...
ITGR ...
IRRX ...
WEL ...
ICE 1.3
IHG 1.6
IFS 5.3
IBM 4.2
IFF 4.1
IGT 3.1
IP
5.0
INSW 1.0
IPG 3.8
IPI
...
IVT 3.4
IVR 18.5
NVTA ...
INVH 3.3
IONQ ...
IRM 3.9
ITUB ...
18
23
dd
...
dd
14
37
2
22
dd
26
6
25
33
dd
59
69
dd
25
40
13
11
16
dd
23
dd
20
22
dd
40
cc
75
29
25
8
21
cc
53
17
4
14
50
cc
dd
dd
62
dd
70
11
98.92
33.50
4.39
14.53
1.08
17.90
220.52
8.04
115.72
2.36
211.18
2.72
257.96
15.19
2.39
14.88
11.25
26.52
18.10
74.80
43.30
106.46
94.80
1.54
115.16
175.65
174.26
36.19
24.79
97.43
10.94
11.25
125.79
90.50
22.15
159.16
79.97
25.66
37.27
48.84
32.44
21.38
25.16
8.67
.52
33.86
12.00
66.75
6.89
+0.60 .83
–0.59 ...
–0.21 ...
–0.49.3809
–0.15 ...
+0.06 .20
–10.86 ...
–0.56.7874
–3.60 .29
–0.17 ...
–5.93 .64
–0.35 ...
–3.98 1.40
+0.17 ...
–0.06 ...
–0.42 .16
+0.03 ...
–1.87 ...
–0.28.1827
–2.54 .02
–3.92 ...
–2.07 .78
–6.02 1.82
+0.04 ...
–2.06 .57
–27.78 ...
–8.56 .33
–2.10 2.50
–2.22 ...
–1.65 ...
–0.05 ...
+0.03 ...
–2.64 .42
–0.68 .483
+0.20 1.18
–4.39 1.66
–1.00 .81
–1.75 .20
+1.12.4625
+3.36 1.13
–0.20 .31
–2.51 ...
–0.18.2155
–0.19 .40
–0.11 ...
–0.25 .28
–0.39 ...
–3.23 .65
–0.06 ...
12.63
10.59
18.85
123.11
65.62
26.70
109.00
18.37
22.18
8.66
28.34
0.74
25.15
3.22
90.21
144.95
47.90
119.46
2.23
24.87
JBG SMITH Prop
JELD-WEN
J.Jill
JPMorganChase
Jabil
JacksonFinl
JacobsSolns
JamesHardie
JanusHenderson
JanusIntl
JefferiesFinl
JianpuTech
JinkoSolar
JobyAviation
JohnBeanTech
J&J
JohnsonControls
JonesLang
JumiaTech
JuniperNetworks
JBGS 5.3
JELD ...
JILL ...
JPM 2.4
JBL .3
JXN 5.0
J
.8
JHX ...
JHG 5.4
JBI
...
JEF 3.0
JT
...
JKS 4.5
JOBY ...
JBT .4
JNJ 3.0
JCI 2.6
JLL
...
JMIA ...
JNPR 2.9
dd
12
11
10
22
2
24
33
14
15
29
dd
3
dd
5
31
21
38
dd
27
16.87
17.61
24.34
172.27
126.77
49.39
126.58
36.56
29.05
13.70
40.15
.95
32.72
6.09
92.05
161.13
57.18
179.45
3.37
29.91
–0.14 .225
–1.27 ...
–1.44 ...
+2.17 1.05
–0.63 .08
–1.81 .62
–3.22 .26
–2.11 ...
–1.10 .39
+0.65 ...
–0.26 .30
–0.03 ...
–4.22 1.50
–0.56 ...
–7.40 .10
+4.39 1.19
–0.46 .37
–9.42 ...
–0.16 ...
+0.43 .22
Name
Tick
Sym Yld P/E
Last
Div
Chg. Amt.
K
48.28
63.53
65.87
21.08
85.66
16.44
2.56
14.93
288.24
26.51
68.19
68.15
30.60
18.90
34.40
10.90
27.80
20.30
189.32
43.48
147.87
23.27
19.10
37.17
10.60
6.34
457.73
87.52
24.26
39.47
67.43
64.35
10.69
20.25
21.35
35.77
23.65
63.96
52.22
8.42
60.22
8.55
50.36
12.01
1.40
21.26
35.20
33.53
47.70
13.71
47.01
9.94
0.12
11.04
177.97
18.06
47.63
38.32
22.08
10.68
17.64
10.21
17.82
8.54
118.57
25.99
116.32
16.34
15.89
26.32
6.25
3.40
250.90
60.14
18.77
24.35
33.67
45.73
4.28
12.78
15.05
17.68
14.96
37.10
28.45
5.93
44.45
5.28
42.10
6.16
0.42
11.36
KB Financial
KB Home
KBR
KE Holdings
KKR
KKR RealEstFin
KoreGroup
KT
Kadant
Kaman
Kellanova
Kemper
Kennametal
Kennedy-Wilson
KenonHoldings
KensingtonCapV A
Kenvue
KeyCorp
KeysightTech
KilroyRealty
KimberlyClark
KimcoRealty
KinderMorgan
Kinetik
KingswayFin
KinrossGold
KinsaleCapital
Kirby
KiteRealty
Klaviyo
KnifeRiver
Knight-Swift
KnotOffshore
Knowles
KodiakGasSvcs
Kohl's
Philips
KontoorBrands
Koppers
KoreaElecPwr
KornFerry
KosmosEnergy
Kroger
KronosWorldwide
KukeMusic
Kyndryl
KB 4.6
KBH 1.3
KBR 1.0
BEKE .0
KKR .8
KREF13.4
KORE ...
KT
...
KAI .4
KAMN 3.4
K
4.0
KMPR 2.5
KMT 3.2
KW 8.2
KEN 10.7
KCGI ...
KVUE 3.7
KEY 5.6
KEYS ...
KRC 5.4
KMB 3.9
KIM 4.6
KMI 6.3
KNTK 9.1
KFS ...
KGC 2.1
KNSL .2
KEX ...
KRG 4.4
KVYO ...
KNF ...
KNX 1.0
KNOP 1.7
KN
...
KGS 7.1
KSS 7.6
PHG .0
KTB 3.5
KOP .5
KEP ...
KFY 2.4
KOS ...
KR 2.5
KRO 8.2
KUKE ...
KD
...
4
8
dd
23
27
dd
dd
7
26
dd
23
dd
17
dd
dd
35
26
12
25
22
23
30
16
24
7
29
31
24
cc
...
14
24
dd
dd
49
dd
dd
15
11
dd
28
46
18
dd
...
dd
39.26
61.33
54.12
15.24
81.27
12.85
1.15
12.84
258.74
23.23
56.66
49.33
24.80
11.73
26.13
10.69
21.35
14.64
148.96
40.26
122.25
20.85
18.02
33.13
8.18
5.71
358.57
78.39
22.14
26.32
64.00
56.39
6.23
16.88
21.34
26.44
23.49
57.20
47.32
7.22
55.17
6.83
46.05
9.26
1.05
19.59
–2.11.3905
–1.13 .20
–1.29 .135
–0.97 .171
–1.58 .165
–0.38 .43
+0.17 ...
–0.60 ...
–21.57 .29
–0.72 .20
+0.75 .60
+0.66 .31
–0.99 .20
–0.65 .24
+1.79 2.79
... ...
–0.18 .20
+0.24 .205
–10.13 ...
+0.42 .54
+0.74 1.18
–0.46 .23
+0.38.2825
–0.27 .75
–0.22 ...
–0.34 .03
+23.66 .14
–0.09 ...
–0.72 .25
–1.46 ...
–2.18 ...
–1.26 .14
+0.47 .026
–1.03 ...
+1.26 .38
–2.24 .50
+0.16.9387
–5.22 .50
–3.90 .06
–0.03 ...
–4.18 .33
+0.12 ...
+0.34 .29
–0.68 .19
+0.03 ...
–1.19 ...
96.51
4.23
2.60
7.72
30.50
160.25
7.75
23.74
179.58
8.76
81.26
2.70
43.77
25.82
117.79
10.11
22.50
76.58
0.85
10.27
LCI Inds
LG Display
LL Flooring
LSB Inds
LTC Properties
L3HarrisTech
LXP Industrial
La-Z-Boy
LabCorp.ofAmerica
LadderCapital
LambWeston
Lanvin
LasVegasSands
Lazard
Lear
LearnCWInvtA
Leggett&Platt
Leidos
Leju
Lemonade
LCII
LPL
LL
LXU
LTC
LHX
LXP
LZB
LH
LADR
LW
LANV
LVS
LAZ
LEA
LCW
LEG
LDOS
LEJU
LMND
61
dd
dd
7
17
26
56
13
30
10
14
dd
58
dd
14
31
16
cc
dd
dd
119.13
5.03
3.28
8.92
31.77
205.21
9.61
36.17
225.42
11.30
106.02
2.89
50.81
37.96
135.90
10.80
25.60
108.74
1.63
16.55
–6.58 1.05
+0.21 ...
–0.62 ...
–0.39 ...
–0.35 .19
–5.41 1.14
–0.31 .13
–0.75 .20
–1.87 .72
–0.21 .23
–2.07 .36
–0.06 ...
+1.60 .20
+3.16 .50
–5.31 .77
–0.04 ...
–0.57 .46
+0.50 .38
+0.03 ...
+0.42 ...
L
J
20.91
19.69
32.26
173.38
141.38
53.00
141.16
39.01
31.30
13.94
40.96
2.16
61.27
11.98
125.88
180.93
70.43
191.21
5.09
34.53
–52-Week–
High
Low
137.07
6.69
6.84
14.71
38.94
219.31
11.92
38.00
234.09
12.00
117.38
8.99
65.58
43.44
157.91
11.54
38.55
111.39
9.84
24.81
3.5
...
...
...
7.2
2.2
5.4
2.2
1.3
8.1
1.4
...
1.6
5.3
2.3
...
7.2
1.4
...
...
–52-Week–
High
Low
10.92
156.01
140.08
451.35
19.36
6.58
21.25
22.41
19.92
1.88
21.71
636.41
36.50
166.33
2.85
12.09
11.33
331.96
9.80
12.38
101.74
47.22
38.78
12.50
2.63
3.71
16.90
508.10
71.49
7.95
79.56
237.21
13.28
6.09
2.46
17.83
102.05
Name
B A R R ON S .C OM / D ATA
Tick
Sym Yld P/E
Last
Div
Chg. Amt.
4.73
94.11
77.79
232.00
12.42
0.50
11.18
11.10
6.90
0.97
12.23
309.20
18.50
106.46
1.50
6.39
6.09
203.65
5.07
5.80
64.25
17.31
20.26
4.88
1.88
1.14
1.17
393.77
52.85
5.64
49.47
181.85
2.74
0.78
1.53
7.91
81.24
LendingClub
Lennar A
Lennar B
LennoxIntl
LeviStrauss
Li-Cycle
LibertyEnergy
LifeTime
LifezoneMetals
LightInTheBox
Lightspeed
EliLilly
LincolnNational
Lindsay
LionElectric
LionsGate A
LionsGate B
LithiaMotors
LithiumAmArg
LithiumAmericas
LiveNationEnt
LiveOakBcshs
LiveRamp
LiveWire
LloydsBanking
loanDepot
LocalBounti
LockheedMartin
Loews
LomaNegra
LouisianaPacific
Lowe's
LufaxHolding
LumenTech
LumentFinance
Luxfer
LyondellBasell
LC
...
LEN 1.0
LEN.B 1.1
LII 1.0
LEVI 3.0
LICY ...
LBRT 1.5
LTH ...
LZM ...
LITB ...
LSPD ...
LLY .8
LNC 6.4
LNN 1.1
LEV ...
LGF.A ...
LGF.B ...
LAD .7
LAAC ...
LAC ...
LYV ...
LOB .3
RAMP ...
LVWR ...
LYG 5.2
LDI
...
LOCL ...
LMT 2.8
L
.4
LOMA18.3
LPX 1.4
LOW 2.1
LU 2.7
LUMN ...
LFT 11.6
LXFR 6.1
LYB 5.2
17
11
10
28
24
dd
5
44
cc
dd
dd
cc
12
21
dd
dd
dd
8
dd
dd
62
32
dd
dd
...
dd
dd
17
12
7
44
16
12
dd
10
39
14
8.56
146.27
133.38
430.59
16.09
.55
18.64
14.26
8.82
1.07
18.44
618.55
28.14
133.00
1.72
10.42
9.88
297.07
5.98
6.07
89.21
42.20
34.49
11.18
2.38
3.23
2.13
456.50
71.19
6.69
68.49
212.51
2.86
1.70
2.41
8.48
96.87
–0.18 ...
–2.77 .375
–0.67 .375
–16.93 1.10
–0.45 .12
–0.04 ...
+0.50 .07
–0.82 ...
–0.22 ...
... ...
–2.55 ...
+35.63 1.30
+1.17 .45
+3.84 .35
–0.05 ...
–0.48 ...
–0.31 ...
–32.21 .50
–0.34 ...
–0.33 ...
–4.39 ...
–3.30 .03
–3.39 ...
–0.13 ...
–0.01.046
–0.29 ...
+0.06 ...
+3.26 3.15
+1.60.0625
–0.40.4648
–2.34 .24
–10.04 1.10
–0.21 .156
–0.13 ...
+0.08 .07
–0.46 .13
+1.79 1.25
108.53
5.51
33.58
18.04
8.41
12.16
34.12
49.70
11.54
1.41
33.03
14.47
8.15
122.57
451.55
76.75
8.38
2.05
8.77
14.40
10.54
27.55
164.79
46.71
6.46
18.72
10.06
36.48
17.02
9.61
67.35
17.07
20.57
104.32
26.81
13.69
0.22
9.18
25.60
1186.56
0.62
72.78
151.86
317.94
46.69
76.87
44.65
7.08
340.21
42.04
84.23
11.60
56.51
8.66
70.86
9.55
59.12
59.13
245.73
5.39
331.75
5.08
3.41
M&T Bank
MBIA
MDC Holdings
MDU Rscs
MFA Financial
MGIC Investment
MGM Resorts
M/I Homes
MinisoGroup
MOGU
MPLX
MP Materials
MRC Global
MSA Safety
MSCI
MSC Industrial
MV Oil
Mytheresa
Macerich
MachNaturalRscs
Macy's
MSG Ent
MSG Sports
MagnaIntl
Magnachip
MagnoliaOil
MagnumOpusA
MainStreetCap
ManchesterUnited
Manitowoc
Manpower
ManulifeFinl
MarathonOil
MarathonPetrol
Marcus&Millichap
Marcus
MariaDB
MarineProducts
MarineMax
Markel
Markforged
MarriottVacations
Marsh&McLen
MartinMarietta
Masco
MasoniteIntl
MasTec
MasterBrand
Mastercard
MatadorRscs
Materion
Mativ
Matson
MauiLand
Maximus
MayvilleEngg
McCormickVtg
McCormick
McDonald's
McEwenMining
McKesson
MediaAlpha
MedicalProp
MTB 3.8
MBI .0
MDC 4.1
MDU 2.6
MFA 12.6
MTG 2.4
MGM ...
MHO ...
MNSO 1.8
MOGU ...
MPLX 9.2
MP
...
MRC ...
MSA 1.2
MSCI 1.0
MSM 3.5
MVO12.0
MYTE ...
MAC 4.5
MNR ...
M
3.5
MSGE ...
MSGS ...
MGA 3.3
MX
...
MGY 2.2
OPA ...
MAIN 6.6
MANU ...
MTW ...
MAN 3.8
MFC 4.0
MRO 1.7
MPC 2.2
MMI 1.3
MCS 2.0
MRDB ...
MPX 5.0
HZO ...
MKL ...
MKFG ...
VAC 3.5
MMC 1.5
MLM .6
MAS 1.8
DOOR ...
MTZ ...
MBC ...
MA
.6
MTDR 1.4
MTRN .4
MATV 2.7
MATX 1.1
MLP ...
MMS 1.5
MEC ...
MKC.V 2.4
MKC 2.5
MCD 2.3
MUX ...
MCK .5
MAX ...
MPW16.9
8
dd
11
11
dd
8
15
7
24
dd
11
33
11
cc
45
16
7
dd
dd
...
8
dd
96
15
dd
8
17
9
dd
dd
18
11
9
6
dd
cc
dd
8
7
10
dd
12
28
28
18
12
dd
11
37
8
24
dd
13
dd
30
35
29
28
25
dd
19
dd
dd
138.19
5.69
53.44
19.52
11.13
19.29
44.83
127.82
21.38
2.09
37.11
18.34
10.68
161.09
538.05
95.90
12.15
3.30
14.95
16.31
18.82
30.34
177.54
56.03
7.56
21.03
10.83
43.73
20.09
15.70
76.67
21.83
24.39
152.50
39.71
14.18
.22
11.19
36.09
1426.43
.72
86.14
190.84
486.80
65.03
84.90
70.31
14.23
419.42
56.01
122.86
14.93
114.82
18.96
77.81
13.45
69.50
67.24
288.99
6.94
478.19
11.19
3.55
+1.11 1.30
–0.438.00
–1.81 .55
–0.28.2225
–0.14 .35
... .115
+0.15 ...
–9.92 ...
+0.98 .412
+0.18 ...
+0.39 .85
–1.51 ...
–0.33 ...
–7.74 .47
–27.60 1.38
–5.36 .83
+0.13 .38
+0.11 ...
–0.48 .17
–0.18 ...
–1.30.1654
–1.45 ...
–4.29 ...
–3.05 .46
+0.06 ...
–0.26 .115
+0.04 ...
+0.50 .24
–0.29 ...
–0.99 ...
–2.80 1.47
–0.27.2694
+0.23 .11
+4.14 .825
–3.97 .25
–0.40 .07
–0.06 ...
–0.21 .14
–2.81 ...
+6.53 ...
–0.10 ...
+1.25 .76
+1.37 .71
–12.11 .74
–1.95 .285
+0.24 ...
–5.41 ...
–0.62 ...
–7.09 .66
–0.85 .20
–7.27 .13
–0.38 .10
+5.22 .32
+3.07 ...
–6.05 .30
–0.97 ...
+1.50 .42
–1.18 .42
–7.52 1.67
–0.27 ...
+15.21 .62
+0.04 ...
–1.36 .15
M
161.99
14.37
56.37
22.55
12.38
19.64
51.35
140.73
29.92
3.44
37.22
36.67
13.90
185.57
573.32
105.77
16.10
12.54
16.54
19.20
25.12
40.81
215.79
68.92
11.68
24.29
11.23
44.19
27.34
20.20
92.43
22.33
29.85
162.31
44.24
18.05
4.08
17.81
42.88
1560.00
2.30
165.85
202.81
500.91
69.66
109.58
123.33
15.70
428.36
69.41
132.50
28.99
117.88
19.85
89.69
16.66
94.97
94.39
299.35
10.00
485.22
17.01
14.00
–52-Week–
High
Low
131.42
92.02
119.65
40.32
25.88
178.82
29.50
29.00
1.70
13.10
51.38
73.92
61.04
1615.97
176.36
43.50
73.57
10.52
10.79
8.31
9.04
9.17
3.70
2.22
43.18
61.61
19.12
58.67
130.63
386.34
70.90
66.47
55.00
396.91
147.91
100.99
57.46
329.83
37.28
48.70
16.62
2.29
48.47
382.04
26.49
Name
Tick
Sym Yld P/E
Last
Div
Chg. Amt.
61.94
68.84
99.14
26.15
13.41
96.27
11.36
17.13
0.80
8.49
20.46
48.95
13.98
928.50
115.56
26.70
48.61
6.70
4.80
4.93
5.99
4.75
2.70
0.83
20.90
19.41
10.01
33.87
76.02
256.19
48.49
7.50
21.96
275.67
87.00
69.42
31.44
251.00
23.94
29.82
10.97
0.61
32.80
231.65
15.65
Medifast
Medtronic
Merck
MercuryGeneral
MeridianLink
MeritageHomes
MesaRoyalty
MesabiTrust
MetaData
MetalsAcqn
MethodeElec
MetLife
MetropolitanBk
Mettler-Toledo
MidAmApt
MillerIndustries
MineralsTechs
MirionTech
MisterCarWash
MistrasGroup
MitsubishiUFJ
MiX Telematics
MizuhoFin
Moatable
ModelN
ModineMfg
ModivIndl
Moelis
MohawkInds
MolinaHealthcare
MolsonCoorsB
MoneyLion
MontroseEnvl
Moody's
Moog A
MorganStanley
Mosaic
MotorolaSol
Movado
MuellerIndustries
MuellerWater
MultiPlan
MurphyOil
MurphyUSA
MyersIndustries
MED 10.2
MDT 3.3
MRK 2.6
MCY 3.3
MLNK ...
MTH .6
MTR 14.5
MSB 3.6
AIU ...
MTAL ...
MEI 2.7
MET 3.0
MCB ...
MTD ...
MAA 4.5
MLR 1.8
MTX .6
MIR ...
MCW ...
MG
...
MUFG 2.3
MIXT 2.1
MFG 2.7
MTBL ...
MODN ...
MOD ...
MDV 7.7
MC 4.4
MHK ...
MOH ...
TAP 2.7
ML
...
MEG ...
MCO .8
MOG.A .8
MS 3.6
MOS 2.4
MSI 1.3
MOV 4.8
MLI 1.3
MWA 1.9
MPLN ...
MUR 2.7
MUSA .4
MYE 2.8
6
27
65
dd
dd
8
7
23
0
dd
dd
25
11
29
26
9
34
dd
31
dd
8
27
10
...
dd
15
dd
cc
dd
24
53
dd
dd
45
26
17
9
31
12
8
25
dd
9
16
14
64.50
84.57
117.22
38.42
22.60
167.91
13.37
19.69
.97
11.00
20.98
68.92
51.49
1132.29
131.78
40.36
66.88
10.04
8.10
7.80
8.85
8.41
3.56
.94
25.35
59.14
14.96
54.54
103.88
378.59
61.51
63.24
28.64
371.69
139.67
93.24
35.52
309.16
29.44
45.26
13.73
1.28
41.39
376.26
19.20
–2.72 1.65
+2.19 .69
+8.20 .77
+1.11.3175
–2.17 ...
–6.29 .27
+0.17.0674
–0.78 .35
... ...
–1.36 ...
–1.75 .14
+2.79 .52
–3.89 ...
–80.67 ...
–2.68 1.47
–1.93 .18
–4.43 .10
–0.21 ...
–0.54 ...
+0.48 ...
+0.24.1394
–0.20.0609
+0.12.0678
–0.03 ...
–1.58 ...
–0.56 ...
+0.06.0958
–1.59 .60
+0.38 ...
+17.28 ...
+0.30 .41
+0.55 ...
–3.49 ...
–18.87 .77
–5.11 .27
–0.01 .85
–0.21 .21
–3.93 .98
–0.71 .35
–1.89 .15
–0.67.064
–0.16 ...
–1.27 .275
+19.70 .41
–0.35 .135
29.37
9.26
18.00
11.99
8.25
1.29
7.00
4.46
34.38
14.05
8.83
30.25
4668.28
75.64
26.48
48.60
56.41
47.54
66.83
27.86
4.06
9.41
8.00
44.68
4.76
4.30
11.27
81.67
2.33
9.50
13.49
13.98
38.92
33.98
5.81
32.76
328.15
33.59
3.40
4.14
3.49
12.53
26.21
1.32
47.15
51.76
88.66
1.79
22.86
10.88
34.85
2.94
13.56
3.38
2.84
NACCO Inds
N-able
NCR Atleos
NCR Voyix
NetPower
NGL Energy
NIO
NL Industries
NNN REIT
NOV
NOW
NRG Energy
NVR
NaborsIndustries
NatlBankHoldings
NationalFuelGas
NationalGrid
NatlHealthInv
NatlPrestoInds
NatlStorage
Natura&Co
NaturalGasSvcs
NaturalGrocers
NaturalResPtrs
Natuzzi
NatWest
Navigator
Nelnet
NerdyA
NetLeaseOffice
Netstreit
Nevro
NewJerseyRscs
NewOrientalEduc
NY CmntyBcp
NYTimes A
NewMarket
Newmont
NewparkResources
NexaResources
NexGenEnergy
NexPointRealEst
NexPointResidentl
Nextdoor
NextEraEnergy
NicoletBankshares
Nike
NineEnergy
NiSource
NoahHoldings
Noble
Nokia
NomadFoods
Nomura
NordicAmTankers
NC 2.3
NABL ...
NATL ...
VYX ...
NPWR ...
NGL ...
NIO ...
NL 5.3
NNN 5.3
NOV 1.0
DNOW ...
NRG 2.9
NVR ...
NBR ...
NBHC 3.0
NFG 3.9
NGG 5.1
NHI 6.8
NPK 1.2
NSA 5.6
NTCO ...
NGS ...
NGVC 2.5
NRP 3.1
NTZ ...
NWG ...
NVGS 1.3
NNI 1.3
NRDY ...
NLOP 1.9
NTST 4.6
NVRO ...
NJR 3.7
EDU ...
NYCB 6.5
NYT .9
NEU 1.6
NEM 4.0
NR
...
NEXA .0
NXE ...
NREF12.7
NXRT 5.5
KIND ...
NEE 3.0
NIC 1.3
NKE 1.4
NINE ...
NI
3.7
NOAH 2.8
NE 3.3
NOK 2.7
NOMD ...
NMR 2.6
NAT 10.7
15
cc
...
dd
dd
dd
dd
dd
20
16
9
dd
15
dd
11
10
6
22
24
37
dd
87
16
8
dd
5
16
25
dd
...
cc
dd
17
46
3
40
13
dd
24
dd
dd
dd
30
dd
16
20
30
dd
18
1
15
5
14
16
8
37.11
12.89
23.31
16.58
9.56
5.55
8.06
5.25
42.91
20.59
10.70
51.73
6937.75
81.44
35.99
50.58
69.28
53.06
80.05
40.03
6.66
15.93
15.86
98.08
6.51
5.72
15.68
84.52
3.17
17.70
17.83
19.36
44.96
76.72
10.46
46.47
552.19
40.34
6.39
6.92
6.73
15.74
33.39
1.70
62.08
76.94
102.08
2.68
27.04
12.91
47.77
3.44
17.71
4.70
4.56
+0.61.2175
–0.36 ...
–0.98 ...
–0.33 ...
–0.54 ...
–0.02 ...
–1.01 ...
–0.36 .07
–0.19 .565
+0.31 .05
–0.62 ...
+0.03.3775
–62.70 ...
–0.19 ...
–1.20 .27
+0.41 .495
+1.291.1899
–2.79 .90
–0.233.00
–1.44 .56
–0.18 ...
–0.15 ...
–0.14 1.00
+5.52 .75
–0.26 ...
+0.09 ...
+1.13 .05
–3.70 .28
–0.26 ...
–0.78 .34
–0.02 .205
–2.16 ...
+0.38 .42
+3.44 ...
+0.23 .17
–2.52 .11
+6.36 2.25
–1.05 .40
–0.25 ...
–0.22.1888
–0.27 ...
–0.01 .185
–1.04.4624
–0.19 ...
+1.34.4675
–3.54 .25
–6.49 .37
... ...
+0.49 .25
–0.90 .38
–0.39 .40
+0.02.0336
+0.76 ...
+0.19.0543
+0.36 .06
N
40.28
15.44
26.00
19.01
17.62
5.69
16.18
7.64
48.21
24.83
14.86
52.16
7075.00
190.90
44.50
62.03
74.48
60.17
83.00
44.79
7.68
16.44
17.49
98.08
8.07
7.80
16.00
101.60
5.37
50.00
20.64
40.56
55.84
83.73
14.22
49.54
578.33
55.41
7.63
7.70
7.18
19.95
52.83
3.42
86.47
85.20
131.31
17.10
28.95
21.53
55.34
5.04
19.76
4.76
4.83
38
BARRON’S
D ATA
–52-Week–
High
Low
27.15
260.20
26.30
17.30
43.64
540.85
52.39
22.75
5.97
106.90
108.98
8.87
45.55
182.68
11.32
19.32
85.16
2.55
59.58
Name
NEW YORK STOCK EXCHANGE COMPOSITE LIST
Tick
Sym Yld P/E
Last
Div
Chg. Amt.
12.88
183.09
13.09
5.71
25.56
414.56
35.72
12.15
1.85
75.68
65.05
3.39
16.15
129.79
1.81
14.41
52.23
0.95
37.85
Nordstrom
NorfolkSouthern
NorthAmConstr
NoEuroOil
NorthernOil&Gas
NorthropGrum
NorthwestNat
NorwegCruise
NouveauMonde
Novartis
NovoNordisk
NuHoldings
NuSkinEnts
Nucor
NuScalePower
NuSTAREnergy
Nutrien
NuvationBio
nVentElectric
JWN 4.3
NSC 2.4
NOA 1.4
NRT 37.5
NOG 4.4
NOC 1.6
NWN 5.0
NCLH ...
NMG ...
NVS 2.1
NVO .7
NU
...
NUS 8.4
NUE 1.3
SMR ...
NS 8.6
NTR 3.8
NUVB ...
NVT 1.3
25
25
12
3
5
15
14
dd
dd
29
44
cc
16
9
dd
35
13
dd
20
17.65
229.02
20.83
6.03
36.03
469.89
39.38
17.80
2.56
106.31
105.98
8.57
18.63
170.57
2.62
18.70
56.18
1.49
56.36
–0.80 .19
–7.36 1.35
–0.02.0735
+0.20 .21
–1.04 .40
+1.75 1.87
+0.44.4875
–2.24 ...
–0.05 ...
+5.343.4694
+2.53.8836
+0.24 ...
–0.79 .39
–3.47 .54
–0.67 ...
+0.02 .40
–0.15 .53
–0.02 ...
–2.73 .19
22.34
31.25
13.56
55.50
55.91
5.73
12.19
55.12
14.99
21.15
6.00
33.99
6.25
16.50
23.31
41.71
4.25
25.61
72.20
17.72
17.55
2.61
32.79
69.72
9.58
32.82
1.70
82.04
10.21
5.90
10.84
25.59
2.33
4.41
17.85
78.72
58.73
2.48
72.09
9.63
2.48
11.24
73.32
3.21
8.18
2.92
32.07
11.79
86.34
2.52
82.33
OFGBancorp
OGE Energy
O-I Glass
ONE Gas
ONEOK
ON24
Openlane
OccidentalPetrol
OceaneeringIntl
OcwenFinancial
Offerpad
Oil-Dri
OilStatesIntl
OkeanisEcoTankers
OldRepublic
Olin
Olo
OmegaHealthcare
Omnicom
OnHolding
OneLiberty
OneConnectFin
OneMain
OntoInnovation
Ooma
Oppenheimer A
OppFi
Oracle
Orange
OrchidIsland
Organon
OriginBancorp
OrionGroup
OrionOffice
Orion
Orix
OrmatTech
OscarHealth
Oshkosh
OsirisAcqn
OsiskoDevelopment
OsiskoGold
OtisWorldwide
Ouster
OutfrontMedia
OverseasShip
Ovintiv
Owens&Minor
OwensCorning
Owlet
OxfordIndustries
OFG 2.5
OGE 4.7
OI
...
OGS 4.1
OKE 5.3
ONTF .0
KAR ...
OXY 1.2
OII
...
OCN ...
OPAD ...
ODC 1.7
OIS
...
ECO ...
ORI 3.3
OLN 1.5
OLO ...
OHI 8.8
OMC 3.3
ONON ...
OLP 8.3
OCFT ...
OMF 8.2
ONTO ...
OOMA ...
OPY 1.5
OPFI ...
ORCL 1.6
ORAN 4.9
ORC 17.3
OGN 7.8
OBK 1.8
ORN ...
ONL 7.2
OEC .3
IX
2.6
ORA .7
OSCR ...
OSK 1.6
OSI
...
ODV ...
OR 1.3
OTIS 1.6
OUST ...
OUT 8.7
OSG 4.4
OVV 2.7
OMI ...
OC 1.6
OWLT ...
OXM 2.7
9
17
6
16
13
dd
dd
13
28
dd
dd
14
43
5
10
12
dd
32
12
95
20
dd
9
43
cc
12
68
28
19
dd
6
11
dd
dd
13
11
40
dd
13
dd
dd
83
26
dd
dd
9
4
dd
11
dd
10
35.49
35.51
15.51
63.93
71.59
6.83
14.17
58.94
20.76
30.40
8.73
67.25
6.68
29.05
29.83
52.62
5.06
30.38
85.88
26.57
21.76
3.02
48.95
136.19
10.50
40.78
4.31
102.73
11.72
8.30
14.41
34.25
4.66
5.56
24.57
96.27
73.28
8.82
105.29
10.71
2.85
13.61
87.51
6.99
13.75
5.47
43.67
19.19
147.42
5.61
96.94
–1.99 .22
+0.58.4182
–0.87 ...
+0.21 .65
+1.37 .955
–1.05 1.09
–0.64 ...
–0.77 .18
–0.52 ...
–0.36 ...
–1.52 ...
+0.17 .29
–0.11 ...
+2.25 ...
+0.43 .245
–1.33 .20
–0.66 ...
–0.28 .67
–0.63 .70
–0.40 ...
–0.15 .45
–0.21 ...
–0.25 1.00
–16.71 ...
–0.23 ...
–0.54 .15
–0.81 ...
–2.70 .40
+0.29.3205
–0.13 .12
–0.01 .28
–1.32 .15
–0.28 ...
–0.16 .10
–3.16.0207
+2.881.4781
–2.51 .12
–0.33 ...
–3.12 .41
+0.31 ...
–0.06 ...
–0.67.0452
–1.96 .34
–0.68 ...
–0.21 .30
+0.20 .06
–0.25 .30
–0.08 ...
–0.81 .60
+0.33 ...
–3.06 .65
31.26
14.71
18.00
23.46
2.33
59.61
19.02
109.40
38.53
56.61
120.33
22.20
17.88
22.76
4.30
8.62
69.27
122.20
19.18
6.93
6.09
26.86
13.13
20.30
24.76
7.95
3.90
11.91
PBF Energy
PG&E
PGT Innovations
PHINIA
PHX Minerals
PJT Partners
PLDT
PNC Finl
PNM Resources
POSCO
PPG Ind
PPL
ProgHoldings
PROS
PSQ
P10
PVH
PackagingCpAm
PagerDuty
PagSeguroDig
PalantirTech
PampaEnergia
PanAmerSilver
ParPacific
ParTechnology
Paragon28
ParamountGroup
ParkAerospace
PBF 2.4
PCG .2
PGTI ...
PHIN 3.5
PHX 3.8
PJT 1.0
PHI 5.2
PNC 4.0
PNM 4.0
PKX 1.6
PPG 1.8
PPL 3.5
PRG ...
PRO ...
PSQH ...
PX 1.5
PVH .1
PKG 3.0
PD
...
PAGS ...
PLTR ...
PAM ...
PAAS 2.6
PARR ...
PAR ...
FNA ...
PGRE 2.8
PKE 3.6
2
20
22
...
6
31
25
11
22
28
24
26
9
dd
dd
dd
14
19
dd
13
cc
4
dd
4
dd
dd
dd
27
42.02
17.89
41.73
28.48
3.20
95.72
23.42
156.23
39.19
91.46
145.94
27.75
30.25
32.87
5.03
8.73
117.00
167.75
21.32
12.36
15.98
48.17
15.48
34.72
40.20
13.08
5.03
13.82
–1.94 .25
–0.14 .01
+1.03 ...
–1.81 .25
–0.02 .03
–6.15 .25
–0.01.8628
+1.38 1.55
–2.41.3875
–3.65.4803
–3.61 .65
+0.65 .24
–0.66 ...
–5.92 ...
–0.21 ...
–1.49.0325
–5.12.0375
+4.84 1.25
–1.83 ...
–0.11 ...
–1.19 ...
–1.35 ...
–0.85 .10
–1.65 ...
–3.34 ...
+0.65 ...
–0.14 .035
–0.88 .125
For personal non-commercial use only. Do not edit or alter. Reproductions not permitted.
To reprint or license content, please contact Barron's reprints department at 800-843-0008 or www.djreprints.com
O
38.47
40.36
23.57
84.26
72.52
11.20
16.49
67.93
27.46
36.97
19.35
73.50
10.47
32.46
29.99
64.70
9.12
34.77
99.23
37.08
24.73
9.64
49.89
158.50
15.66
49.32
5.34
127.54
13.08
12.66
32.43
39.84
6.07
9.75
28.48
101.56
94.49
9.89
109.90
12.12
6.25
17.96
91.33
19.20
21.65
5.50
52.47
23.66
155.19
9.69
123.37
PQ
56.38
18.32
41.97
37.00
4.09
104.16
27.98
169.07
49.60
133.09
152.89
31.74
44.81
40.99
35.57
13.41
123.91
171.61
35.33
13.19
21.85
52.17
19.85
37.50
46.63
21.49
6.74
16.92
January 8, 2024
–52-Week–
High
Low
17.37
464.00
64.63
374.04
18.79
24.25
31.22
47.00
12.51
17.38
17.30
36.80
7.16
93.50
15.89
180.84
73.27
348.67
8.38
70.76
9.59
27.77
15.49
3.16
7.89
40.28
16.79
16.01
51.60
105.62
138.06
4.14
40.00
16.34
11.37
86.03
16.00
38.24
257.76
182.87
4.85
85.91
5.18
8.68
25.55
138.49
51.58
98.84
16.24
26.05
86.94
68.54
220.00
16.47
36.19
20.06
76.86
158.38
166.28
137.52
5.06
11.37
78.76
40.47
24.58
107.31
34.37
65.46
316.48
105.13
40.50
11.08
44.77
51.18
6.41
221.94
35.03
219.17
13.86
2.54
156.94
Name
Tick
Sym Yld P/E
Last
Div
Chg. Amt.
10.70
297.12
40.61
146.15
7.02
9.25
17.71
8.00
9.29
11.39
8.18
28.15
4.70
54.00
10.52
112.31
46.42
180.93
2.20
52.32
2.79
13.75
8.58
1.43
4.10
26.81
9.56
8.52
25.76
87.23
89.74
1.10
12.05
10.52
4.91
68.55
4.60
20.60
177.27
120.97
2.80
44.13
2.04
4.53
19.03
82.00
38.01
78.85
12.98
16.41
41.56
52.90
143.28
12.27
22.48
11.87
41.80
135.83
111.41
96.64
3.20
6.33
49.60
23.01
13.43
75.37
19.90
53.71
233.18
47.41
22.14
10.36
18.91
34.74
2.68
138.67
18.71
136.77
4.99
0.95
119.59
ParkHotels
ParkerHannifin
Parsons
PaycomSoftware
Paymentus
Paysafe
PeabodyEnergy
PeakstoneRealty
Pearson
PebblebrookHotel
PediatrixMedical
PembinaPipeline
PennantPark
PennyMacFin
PennyMacMtg
PenskeAuto
Pentair
Penumbra
Perfect
PerformanceFood
PerimeterSolns
PermianBasin
PermianRscs
PermianvilleRT
PermRock
Perrigo
PetroleoBrasil
PetroleoBrasilA
Pfizer
PhilipMorris
Phillips66
PhoenixNewMedia
Phreesia
PhysiciansRealty
PiedmontOfficeA
PinnacleWest
Pinstripes
Pinterest
PioneerNatRscs
PiperSandler
PitneyBowes
PlanetFitness
PlanetLabs
PlayAGS
PlymouthIndREIT
Polaris
PortlandGenElec
PostHoldings
PostalRealty
PowerSchool
PrecisionDrilling
PrestigeCnsHlth
Primerica
PrimoWater
PrimorisSvcs
ProAssurance
ProcoreTech
Procter&Gamble
Progressive
Prologis
PropertyGuru
ProPetro
ProsperityBcshs
ProtoLabs
ProvidentFinSvcs
PrudentialFinl
Prudential
PublicServiceEnt
PublicStorage
PulteGroup
PureStorage
PyrophyteAcqn
Q2
Qiagen
QuadGraphics
QuakerHoughton
QuanexBldg
QuantaServices
QuantumScape
Qudian
QuestDiag
PK 3.7
PH 1.3
PSN ...
PAYC .8
PAY ...
PSFE ...
BTU 1.2
PKST 5.3
PSO 2.2
PEB .3
MD
...
PBA 5.9
PNNT11.8
PFSI .9
PMT 10.8
PAG 1.8
PNR 1.3
PEN ...
PERF ...
PFGC ...
PRM ...
PBT 5.9
PR 1.5
PVL 24.6
PRT 15.0
PRGO 3.2
PBR 17.2
PBR.A17.9
PFE 5.7
PM 5.5
PSX 3.1
FENG ...
PHR ...
DOC 7.1
PDM 7.1
PNW 4.7
PNST ...
PINS ...
PXD 6.1
PIPR 1.5
PBI 4.7
PLNT ...
PL
...
AGS ...
PLYM 3.8
PII 2.9
POR 4.3
POST ...
PSTL 6.7
PWSC ...
PDS ...
PBH ...
PRI 1.3
PRMW 2.2
PRIM .8
PRA 1.5
PCOR ...
PG 2.6
PGR .2
PLD 2.7
PGRU ...
PUMP ...
PB 3.4
PRLB ...
PFS 5.5
PRU 4.8
PUK ...
PEG 3.7
PSA 4.0
PHM .8
PSTG ...
PHYT ...
QTWO ...
QGEN ...
QUAD ...
KWR .9
NX 1.1
PWR .2
QS
...
QD
...
DGX 2.0
dd
25
49
34
cc
dd
3
dd
25
dd
9
21
dd
20
13
9
22
cc
dd
26
43
23
15
4
7
cc
4
4
16
19
8
dd
dd
66
16
18
dd
dd
11
39
dd
45
dd
cc
dd
9
20
20
cc
dd
8
dd
14
20
13
dd
dd
24
35
42
dd
8
13
dd
9
67
15
11
27
8
cc
35
dd
31
dd
cc
12
42
dd
6
21
16.03
453.55
61.66
197.15
16.86
12.50
25.87
17.03
12.38
15.68
9.68
34.38
7.13
84.31
14.83
150.58
68.69
231.81
2.47
70.05
4.22
14.04
13.49
1.52
4.44
33.91
16.54
15.87
29.47
95.30
135.24
1.43
22.31
12.96
7.08
74.33
5.49
35.92
230.08
163.64
4.23
72.61
2.26
8.11
23.54
89.17
44.01
91.27
14.17
23.06
54.82
58.83
207.93
14.80
31.24
13.11
65.44
147.42
162.71
130.56
3.51
8.38
66.08
36.26
17.39
104.31
21.09
61.73
298.61
101.48
35.89
11.03
40.30
44.10
5.23
198.76
30.19
199.08
8.70
2.17
141.98
+0.73 .77
–7.15 1.48
–1.05 ...
–9.57 .375
–1.01 ...
–0.29 ...
+1.55 .075
–2.90 .225
+0.09 .09
–0.30 .01
+0.38 ...
–0.04.4967
+0.22 .07
–4.06 .20
–0.12 .40
–9.93 .79
–4.02 .23
–19.73 ...
–0.63 ...
+0.90 ...
–0.38 ...
+0.08.1062
–0.11 .07
+0.08.0772
+0.02.0403
+1.73 .273
+0.57.1749
+0.59.1749
+0.68 .42
+1.22 1.30
+2.10 1.05
+0.07 ...
–0.84 ...
–0.35 .23
–0.03 .125
+2.49 .88
–5.41 ...
–1.12 ...
+5.20 1.95
–11.23 .60
–0.17 .05
–0.39 ...
–0.21 ...
–0.32 ...
–0.53 .225
–5.60 .65
+0.67 .475
+3.21 ...
–0.39.2375
–0.50 ...
+0.53 ...
–2.39 ...
+2.17 .65
–0.25 .08
–1.97 .06
–0.68 .05
–3.78 ...
+0.88.9407
+3.43 .75
–2.74 .87
+0.17 ...
... ...
–1.65 .56
–2.70 ...
–0.64 .24
+0.60 1.25
–1.36 ...
+0.58 .57
–6.393.00
–1.74 .20
+0.23 ...
+0.03 ...
–3.11 ...
+0.67 ...
–0.19 ...
–14.66 .455
–0.38 .08
–16.72 .09
+1.75 ...
+0.13 ...
+4.10 .71
195.18
51.07
10.25
27.64
8.61
9.85
207.26
123.05
9.07
1.39
6.54
78.52
68.56
16.36
18.25
1.44
103.17
22.61
9.27
RBC Bearings
RB Global
RCF Acqn A
RELX
RE/MAX
REV
RH
RLI
RLJ Lodging
RLX Tech
RPC
RPM
RTX
RXO
RadianGroup
Rafael
RalphLauren
RangeResources
RangerEnergySvcs
RBC ...
RBA 1.7
RCFA ...
RELX 1.8
RMAX 7.6
REVG 1.2
RH
...
RLI
.8
RLJ 3.4
RLX .4
RES 2.2
RPM 1.8
RTX 2.8
RXO ...
RDN 3.1
RFL ...
RL 2.1
RRC 1.0
RNGR 2.0
48
78
24
36
dd
22
29
22
37
cc
6
26
40
dd
7
dd
18
6
9
270.64
65.33
11.00
39.54
12.08
17.10
263.71
136.15
11.62
1.93
7.17
104.76
85.38
22.49
28.85
1.90
142.92
30.84
10.24
–14.25 ...
–1.56 .27
+0.02 ...
–0.12.2195
–1.25 .23
–1.07 .05
–27.77 ...
+3.032.00
–0.10 .10
–0.07.008
–0.11 .04
–6.87 .46
+1.24 .59
–0.77 ...
+0.30 .225
+0.07 ...
–1.28 .75
+0.40 .08
+0.01 .05
R
288.16
68.25
11.89
40.03
24.28
19.28
406.38
149.65
12.92
3.00
10.33
113.37
104.91
24.33
29.10
2.52
148.04
37.88
14.64
–52-Week–
High
Low
8.24
120.73
9.29
37.79
13.49
68.85
4.58
8.72
166.00
38.34
24.33
37.00
170.62
295.98
227.16
38.41
41.55
11.27
167.17
20.16
243.52
78.50
32.59
145.35
51.19
66.71
11.10
49.32
80.52
6.73
11.15
89.78
47.65
15.19
348.52
50.16
173.16
45.04
10.98
104.72
130.97
16.56
5.48
50.64
119.47
44.70
112.56
Name
Tick
Sym Yld P/E
Last
Div
Chg. Amt.
2.63
82.00
2.66
24.84
9.19
45.04
2.05
5.47
97.18
20.76
13.72
5.70
120.99
204.16
174.22
22.99
23.39
5.23
120.58
14.20
132.24
59.99
12.25
79.50
27.42
41.56
10.29
25.08
58.27
3.48
7.40
64.65
24.88
7.16
252.19
36.55
115.13
32.19
10.13
77.90
53.31
1.36
2.77
35.10
76.15
26.15
77.18
Ranpak
RaymondJames
RayonierAdvMatls
Rayonier
ReadyCapital
RealtyIncome
Redwire
RedwoodTrust
RegalRexnord
RegionalMgmt
RegionsFinl
Regis
ReinsGrp
RelianceSteel
RenaissanceRe
Renasant
RentokilInit
ReposiTrak
RepublicSvcs
ResideoTech
ResMed
RestaurantBrands
Revolve
Revvity
RexAmerRscs
RexfordIndlRealty
RigelResourceA
RingCentral
RioTinto
Riskified
RithmCapital
RobertHalf
Roblox
RocketCos.
Rockwell
RogersComm B
Rogers
Rollins
RossAcqnIIA
RoyalBkCanada
RoyalCaribbean
RubiconTech
RushStreetInt
RyanSpecialty
RyderSystem
RyersonHolding
RymanHospitality
PACK ...
RJF 1.6
RYAM ...
RYN 3.5
RC 12.1
O
5.3
RDW ...
RWT10.2
RRX 1.0
RM 4.8
RF 5.0
RGS ...
RGA 2.0
RS 1.4
RNR .8
RNST 2.7
RTO 1.7
TRAK .6
RSG 1.3
REZI ...
RMD 1.2
QSR 2.9
RVLV ...
RVTY .3
REX ...
REXR 2.7
RRAC ...
RNG ...
RIO 5.5
RSKD ...
RITM 9.6
RHI 2.3
RBLX ...
RKT ...
ROK 1.6
RCI 3.1
ROG ...
ROL 1.4
ROSS ...
RY 4.0
RCL ...
RBT ...
RSI
...
RYAN ...
R
2.5
RYI 2.3
RHP 3.4
dd
14
dd
61
4
44
dd
dd
dd
9
8
dd
12
12
6
11
36
39
32
15
27
26
34
18
17
53
41
dd
13
dd
7
19
dd
dd
25
31
23
51
37
13
38
dd
dd
89
11
12
30
5.16
112.04
4.26
32.69
9.88
57.92
2.95
6.95
139.56
25.13
19.39
8.59
167.06
277.64
201.28
32.40
26.45
10.74
163.52
17.26
166.82
76.43
14.89
107.36
47.03
55.47
11.04
31.04
72.64
4.42
10.40
82.90
41.74
12.63
305.05
46.79
122.13
42.70
10.90
100.75
122.65
1.47
3.80
42.29
112.53
32.84
111.88
–0.66 ...
+0.54 .45
+0.21 ...
–0.72 .20
–0.37 .30
+0.50.2565
+0.10 ...
–0.46 .16
–8.46 .35
+0.05 .30
+0.01 .24
–0.86 ...
+5.28 .85
–2.04 1.00
+5.28 .38
–1.28 .22
–2.16.1759
+0.73.0165
–1.39 .535
–1.56 ...
–5.20 .48
–1.70 .55
–1.69 ...
–1.95 .07
–0.27 ...
–0.63 .38
+0.08 ...
–2.91 ...
–1.82 1.77
–0.26 ...
–0.28 .25
–5.02 .48
–3.98 ...
–1.85 ...
–5.43 1.25
–0.02.3686
–9.94 ...
–0.97 .15
+0.01 ...
–0.381.0155
–6.84 ...
–0.38 ...
–0.69 ...
–0.73 ...
–2.53 .71
–1.84 .185
+1.82 1.10
105.50
321.15
10.06
7.04
1.33
8.43
10.88
56.96
18.26
19.06
24.66
3.10
61.09
31.01
55.60
2.82
15.00
135.55
7.21
10.48
4.93
12.62
4.27
22.63
8.85
32.13
10.16
42.73
21.39
45.00
95.43
40.34
43.67
3.71
34.87
9.72
31.21
28.50
40.87
21.28
5.52
0.65
63.75
7.19
10.44
30.56
52.90
12.43
1.86
7.07
52.89
353.62
39.27
SAP
S&P Global
SDCLEDGEAcqn
SeacorMarine
SES AI
SFL
SITE Centers
SJW Group
SK Telecom
SLGreenRealty
SM Energy
SOS
SPX Tech
STAG Indl
SabineRoyalty
SafeBulkers
Safehold
Salesforce
SallyBeauty
Samsara
SanJuanBasin
SandRidgeEnergy
SandstormGold
SaratogaInvt
Sasol
SaulCenters
SaversValue
Schlumberger
SchneiderNatl
SchwabC
ScienceApplicat
ScorpioTankers
ScottsMiracleGro
ScullyRoyalty
Sea
SeabridgeGold
SeaDrill
SealedAir
SeaWorldEnt
SelectMedical
SelectWater
SelectQuote
Sempra
Semrush
SendasDistrib
SensataTech
SensientTech
SentinelOne
SequansComms
SeritageGrowth
ServiceIntl
ServiceNow
ServisFirst
SAP 1.1
SPGI .8
SEDA ...
SMHI ...
SES ...
SFL 8.3
SITC 3.9
SJW 2.4
SKM 5.3
SLG 6.8
SM 1.9
SOS ...
SPXC ...
STAG 3.8
SBR 11.3
SB 4.8
SAFE 3.1
CRM ...
SBH ...
IOT
...
SJT 29.5
SD 2.9
SAND 1.2
SAR 10.7
SSL 7.4
BFS 6.0
SVV ...
SLB 1.9
SNDR 1.5
SCHW 1.5
SAIC 1.2
STNG 2.2
SMG 4.3
SRL 10.7
SE
...
SA
...
SDRL ...
SEE 2.2
SEAS ...
SEM 1.9
WTTR 2.8
SLQT ...
SRE 3.1
SEMR ...
ASAI ...
ST 1.3
SXT 2.6
S
...
SQNS ...
SRG ...
SCI 1.7
NOW ...
SFBS 1.9
64
55
cc
dd
dd
...
32
20
10
dd
6
dd
51
38
11
6
dd
95
8
dd
3
3
97
10
12
24
68
18
14
22
13
5
dd
dd
34
dd
6
17
14
15
14
dd
18
dd
23
18
21
dd
...
dd
21
87
15
149.85
427.93
10.81
11.69
1.60
12.04
13.19
63.50
20.85
44.28
38.25
4.58
96.72
38.51
65.48
4.16
22.82
251.12
12.88
30.50
5.58
13.90
4.84
26.35
9.86
39.34
16.58
51.86
24.36
67.23
124.37
64.67
61.86
7.35
37.91
11.37
46.98
36.90
51.87
26.87
7.46
1.21
76.43
12.50
13.93
36.22
63.05
23.67
2.83
9.29
67.60
676.16
63.62
–4.742.1864
–12.59 .90
+0.05 ...
–0.90 ...
–0.23 ...
+0.76 .25
–0.44 .13
–1.85 .38
–0.55.3482
–0.89 .25
–0.47 .18
–0.02 ...
–4.29 ...
–0.75.1225
–2.381.1431
+0.23 .05
–0.58 .177
–12.02 ...
–0.40 ...
–2.88 ...
+0.50.0123
+0.23 .10
–0.19.0149
+0.49 .72
–0.08.5248
+0.07 .59
–0.80 ...
–0.18 .25
–1.09 .09
–1.57 .25
+0.05 .37
+3.87 .35
–1.89 .66
+1.25 .17
–2.59 ...
–0.76 ...
–0.30 ...
+0.38 .20
–0.96 ...
+3.37 .125
–0.13 .06
–0.16 ...
+1.70 .595
–1.16 ...
+0.11 ...
–1.35 .12
–2.95 .41
–3.77 ...
... ...
–0.06 ...
–0.85 .29
–30.33 ...
–3.01 .30
S
160.35
443.72
11.54
15.24
3.69
12.10
14.71
81.86
22.61
50.11
43.73
9.50
104.16
39.61
91.10
4.30
35.53
268.36
18.42
36.91
11.34
17.80
6.31
28.87
18.70
43.95
26.88
62.12
31.74
86.63
136.05
66.93
88.61
8.90
88.84
16.18
50.72
56.43
68.19
33.51
9.56
2.94
81.82
14.09
20.98
54.34
79.19
27.97
3.42
12.79
74.66
720.68
75.12
–52-Week–
High
Low
80.58
53.40
68.74
314.14
76.51
36.64
79.99
81.23
12.44
108.73
55.41
43.95
11.32
7.95
146.91
202.14
11.93
176.16
29.80
31.29
63.99
7.65
43.40
20.40
77.75
28.38
4.12
52.81
82.77
33.09
163.07
17.90
297.26
202.83
98.66
8.48
11.33
12.55
8.86
62.26
15.99
63.74
100.94
87.77
75.80
88.40
11.66
39.53
68.03
7.69
85.25
43.93
10.88
75.83
38.55
20.99
44.65
202.88
11.45
17.14
41.96
12.40
34.38
65.99
42.42
168.81
104.21
80.44
13.10
22.29
94.74
48.00
14.54
23.66
30.52
11.36
114.49
254.00
36.30
59.91
70.43
55.85
24.83
62.56
306.93
9.57
61.34
22.33
10.58
8.81
39.56
21.40
163.83
53.21
11.21
35.51
15.40
24.56
63.96
11.38
4.18
7.38
5.00
45.24
25.84
52.47
205.43
42.91
24.99
34.97
33.80
4.00
57.10
38.11
19.13
9.95
4.58
100.17
93.51
5.96
116.81
19.31
18.29
41.56
3.05
13.85
3.96
52.12
18.86
2.15
34.78
57.45
21.53
107.33
7.86
226.68
119.27
44.86
4.01
7.15
8.07
3.69
39.02
6.00
49.98
79.10
59.51
61.56
64.66
10.18
21.91
53.79
4.57
56.69
20.69
2.80
53.77
14.65
8.68
32.22
79.85
10.25
7.60
28.04
3.27
20.51
38.70
30.15
103.21
73.12
48.24
7.52
16.06
62.78
37.50
6.39
14.98
20.24
2.33
63.60
173.21
18.20
36.01
53.48
36.54
14.18
31.68
248.29
4.22
42.98
14.42
7.53
5.31
25.43
13.00
102.74
43.53
6.71
27.59
2.97
7.62
40.81
8.60
2.68
2.49
0.65
Name
ShakeShack
SharkNinja
Shell
SherwinWilliams
Shift4Paymts
ShinhanFin
Shopify
Shutterstock
Sibanye-Stillwater
SignetJewelers
SilganHoldings
SilverBowRscs
SilverBoxIIIA
Similarweb
SimonProperty
SimpsonMfg
SiriusPoint
SiteOneLandscape
SitioRoyalties
SixFlags
SkechersUSA
SkeenaRscs
Skillsoft
Skillz
SkylineChamp
SmartFinancial
SmartRent
Smartsheet
SmithAO
Smith&Nephew
Smucker
Snap
Snap-On
Snowflake
SOQUIMICH
SohoHouse
SolarisOilfield
SolarWinds
SoloBrands
SonicAutomotive
SonidaSrLiving
SonocoProducts
Sony
SouthState
Southern
SoCopper
SouthportAcqnA
SouthwestAir
SouthwestGas
SouthwesternEner
SpectrumBrands
SphereEnt
SpireGlobal
Spire
SpiritAeroSys
SpiritAirlines
SpiritRealtyCap
Spotify
SpreeAcqn1 A
Sprinklr
Sprott
SprucePower
Squarespace
St.Joe
StandardMotor
StandexIntl
StanleyBlackDck
Stantec
Starrett A
StarwoodProp
StateStreet
SteelPartners
Steelcase
Stellantis
StellarBancorp
Stem
Stepan
Steris
Stevanato
StewartInfo
StifelFinancial
STMicroelec
Stoneridge
Stride
Stryker
StudioCity
SturmRuger
SuburbanPropane
SumitomoMits
SummitHotelProp
SummitMaterials
SummitMidstream
SunComms
SunLifeFinancial
SunCokeEnergy
SuncorEnergy
SunlandsTech
SunnovaEnergy
Sunoco
SunstoneHotel
SuperGroup
SuperiorIndsIntl
SurfAirMobility
B A R R ON S .C OM / D ATA
Tick
Sym Yld P/E
SHAK ...
SN
.0
SHEL 3.8
SHW .8
FOUR ...
SHG 5.2
SHOP ...
SSTK 2.3
SBSW 5.9
SIG
.9
SLGN 1.6
SBOW ...
SBXC ...
SMWB ...
SPG 5.4
SSD .6
SPNT ...
SITE ...
STR 8.6
SIX
...
SKX ...
SKE ...
SKIL ...
SKLZ ...
SKY ...
SMBK 1.4
SMRT ...
SMAR ...
AOS 1.6
SNN 2.8
SJM 3.3
SNAP ...
SNA 2.6
SNOW ...
SQM 6.0
SHCO ...
SOI 6.1
SWI ...
DTC ...
SAH 2.2
SNDA ...
SON 3.5
SONY .4
SSB 2.5
SO 3.9
SCCO 4.8
PORT ...
LUV 2.5
SWX 3.9
SWN ...
SPB 2.2
SPHR ...
SPIR ...
SR 4.8
SPR ...
SAVE .0
SRC 6.1
SPOT ...
SHAP ...
CXM ...
SII 3.0
SPRU ...
SQSP ...
JOE .8
SMP 3.0
SXI
.8
SWK 3.4
STN .7
SCX ...
STWD 9.2
STT 3.5
SPLP ...
SCS 3.1
STLA ...
STEL 1.9
STEM ...
SCL 1.7
STE 1.0
STVN .2
STC 3.3
SF
2.1
STM .5
SRI
...
LRN ...
SYK 1.1
MSC ...
RGR 2.8
SPH 7.6
SMFG 3.0
INN 3.6
SUM ...
SMLP ...
SUI 2.8
SLF 4.5
SXC 3.7
SU 4.8
STG ...
NOVA ...
SUN 5.7
SHO 2.2
SGHC ...
SUP ...
SRFM ...
cc
...
8
32
42
5
dd
14
5
12
17
2
77
dd
21
22
9
40
24
26
18
dd
dd
dd
17
11
dd
dd
40
52
dd
dd
15
dd
5
dd
10
dd
16
dd
dd
12
18
12
26
22
49
40
dd
1
2
2
dd
16
dd
dd
25
dd
37
cc
22
dd
dd
36
13
12
dd
35
4
16
11
6
20
3
14
dd
40
39
44
46
16
10
dd
16
44
dd
14
9
12
dd
14
dd
72
12
17
7
1
dd
11
27
...
dd
dd
Last
70.02
48.93
65.73
296.68
70.41
28.24
74.51
46.99
5.11
98.98
44.81
28.10
10.37
5.49
140.65
183.76
11.45
152.71
22.74
23.05
60.40
4.36
15.52
5.71
68.22
23.63
2.88
44.28
79.04
26.51
128.10
16.55
280.93
189.12
54.65
6.53
7.82
11.54
5.90
54.27
9.03
58.00
91.22
82.73
71.61
83.58
10.63
29.15
63.74
6.87
76.25
33.30
7.15
62.70
31.73
15.88
44.08
193.52
10.84
11.84
32.91
4.31
30.88
57.43
38.93
141.52
95.51
78.08
12.14
20.80
78.21
40.16
12.87
22.45
27.10
3.51
89.91
215.93
26.33
58.13
70.14
44.61
17.89
57.90
295.33
6.83
44.64
17.21
9.90
6.76
36.81
17.77
132.06
51.24
10.89
33.80
9.32
12.73
58.65
10.91
2.73
3.02
1.16
Div
Chg. Amt.
–4.10 ...
–2.24 1.08
–0.07 .662
–15.22 .605
–3.93 ...
–2.54.3938
–3.39 ...
–1.29 .27
–0.32.1102
–8.28 .23
–0.44 .18
–0.98 ...
+0.03 ...
+0.16 ...
–1.99 1.90
–14.22 .27
–0.15 ...
–9.79 ...
–0.77 .49
–2.03 ...
–1.94 ...
–0.52 ...
–2.06 ...
–0.53 ...
–6.04 ...
–0.86 .08
–0.31 ...
–3.54 ...
–3.40 .32
–0.77 .288
+1.72 1.06
–0.38 ...
–7.91 1.86
–9.88 ...
–5.57.5035
–0.59 ...
–0.14 .12
–0.95 ...
–0.26 ...
–1.94 .30
–0.63 ...
+2.13 .51
–3.47.2715
–1.72 .52
+1.49 .70
–2.49 1.00
... ...
+0.27 .18
+0.39 .62
+0.32 ...
–3.52 .42
–0.66 ...
–0.67 ...
+0.36 .755
–0.05 ...
–0.51 .10
+0.39.6696
+5.61 ...
+0.01 ...
–0.20 ...
–1.04 .25
–0.11 ...
–2.13 ...
–2.75 .12
–0.88 .29
–16.86 .30
–2.59 .81
–2.11 .147
+0.04 ...
–0.22 .48
+0.75 .69
+0.16 ...
–0.65 .10
–0.87 ...
–0.74 .13
–0.37 ...
–4.64 .375
–3.92 .52
–0.96.0578
–0.62 .475
+0.99 .36
–5.52 .06
–1.68 ...
–1.47 ...
–4.13 .80
+0.35 ...
–0.81 .17
–0.55 .325
+0.22 .182
+0.04 .06
–1.65 ...
–0.14 ...
–1.59 .93
–0.62.5742
+0.15 .10
+1.76.3843
–0.85 ...
–2.52 ...
–1.28.842
+0.18 .06
–0.44 ...
–0.18 ...
–0.39 ...
–52-Week–
High
Low
11.60
16.58
52.90
38.91
44.44
82.38
5.58
Name
Tick
Sym Yld P/E
7.46
6.10
37.59
26.59
24.40
62.24
1.04
Suzano
Sweetgreen
Sylvamo
SynchronyFinl
SynovusFinl
Sysco
System1
SUZ
SG
SLVM
SYF
SNV
SYY
SST
5.09
32.52
4.22
86.30
115.00
13.66
15.47
6.03
31.69
100.45
10.20
72.92
72.33
4.64
17.23
76.15
13.19
10.69
17.22
25.99
64.85
102.93
22.89
31.66
3.53
11.96
32.48
28.21
4.16
26.40
15.25
15.02
4.08
364.98
177.63
7.05
3.69
21.67
6.44
34.92
24.69
5.70
49.61
63.30
32.33
41.89
0.62
50.42
2.43
7.09
1266.21
30.22
61.27
415.60
20.29
112.84
74.50
3.50
85.35
34.64
6.05
65.71
15.59
9.23
13.77
52.57
29.07
162.47
9.84
78.35
54.69
1.21
9.98
54.94
7.08
132.35
2.05
162.04
7.22
27.23
638.78
4.62
8.11
42.09
32.10
157.33
4.35
36.11
44.49
19.76
6.53
69.86
20.04
5.48
TAL Education
TC Energy
TDCX
TD Synnex
TE Connectivity
Tegna
Telus
TelusIntl
Ternium
TFI Intl
TIM
TJX
TKO
TPG RE Fin
TXO Partners
TaiwanSemi
TakedaPharm
TalosEnergy
Tanger
Tapestry
TargaResources
Target
TaroPharm
TaylorMorrison
Team
TechnipFMC
TeckResourcesB
Tecnoglass
Teekay
TeekayTankers
TejonRanch
TeladocHealth
TelecomArgentina
TeledyneTech
Teleflex
TelefonicaBras
Telefonica
TelekmIndonesia
Telephone&Data
TempurSealy
Tenaris
TencentMusic
TenetHealthcare
Tennant
Teradata
Terex
TerranOrbital
TerrenoRealty
TetraTech
TevaPharm
TexasPacLand
Textainer
Textron
ThermoFisher
Thermon
ThomsonReuters
ThorIndustries
3D Systems
3M
Tidewater
Tilly's
Timken
TimkenSteel
TItanIntl
Toast
Toll Bros
TootsieRoll
TopBuild
TopgolfCallaway
Toro
TorontoDomBk
Torrid
TortoiseEcoIII A
TotalEnergies
TownsquareMedia
ToyotaMotor
Traeger
TraneTech
Transalta
TrancntlRlty
TransDigm
Transocean
TransportadGas
TransUnion
Travel+Leisure
Travelers
Tredegar
TreeHouseFoods
Trex
TriPointe
TriconRes
TriNet
TrinityIndustries
Trinseo
TAL ...
TRP 6.8
TDCX ...
SNX 1.3
TEL 1.8
TGNA 3.0
TU 6.1
TIXT ...
TX 7.1
TFII 1.2
TIMB 4.3
TJX 1.5
TKO .6
TRTX15.1
TXO 11.0
TSM 1.5
TAK 3.7
TALO ...
SKT 3.9
TPR 3.8
TRGP 2.3
TGT 3.1
TARO ...
TMHC ...
TISI ...
FTI 1.0
TECK .9
TGLS .8
TK
...
TNK 1.8
TRC ...
TDOC ...
TEO 17.9
TDY ...
TFX .6
VIV 5.3
TEF 5.9
TLK 3.3
TDS 3.9
TPX .9
TS
.0
TME ...
THC ...
TNC 1.3
TDC ...
TEX 1.2
LLAP ...
TRNO 2.9
TTI
...
TEVA ...
TPL .8
TGH 2.4
TXT .1
TMO .3
THR ...
TRI 1.4
THO 1.7
DDD ...
MMM 5.5
TDW ...
TLYS ...
TKR 1.7
TMST ...
TWI ...
TOST ...
TOL .8
TR
1.1
BLD ...
MODG ...
TTC 1.6
TD 4.5
CURV ...
TRTL ...
TTE ...
TSQ 7.3
TM 2.1
COOK ...
TT 1.2
TAC 2.0
TCI
...
TDG .0
RIG
...
TGS ...
TRU .6
TNL 4.5
TRV 2.1
TG
.0
THS ...
TREX ...
TPH ...
TCN 2.6
TNET ...
TRN 4.3
TSE .5
Last
Div
Chg. Amt.
12.64
39.92
6.33
104.60
132.35
15.36
17.92
8.30
40.69
131.48
17.63
91.71
78.63
6.36
18.85
99.61
14.72
13.71
26.96
37.33
85.79
140.75
41.40
50.66
6.56
19.83
40.38
43.60
7.92
56.20
16.57
21.40
6.94
435.47
239.46
10.31
4.06
25.32
18.91
48.66
33.95
8.87
75.91
86.89
42.49
57.40
1.14
61.81
4.41
11.33
1555.25
49.40
78.60
531.23
30.31
143.93
110.29
5.62
108.59
69.43
7.32
78.64
22.04
14.56
17.74
99.79
33.87
351.61
13.96
91.36
64.42
5.89
10.66
68.22
10.24
187.07
2.39
240.56
8.03
38.08
978.61
6.14
14.35
64.99
39.98
193.07
5.08
40.78
77.37
34.20
8.86
114.70
26.23
7.46
+0.01 ...
+0.83.6846
+1.48 ...
–3.01 .35
–8.15 .59
+0.06.1138
+0.13.2676
–0.28 ...
–1.78 1.10
–4.50 .40
–0.84 .276
–2.10.3325
–2.95 3.86
–0.14 .24
+0.67 .52
–4.39.5415
+0.45.3191
–0.52 ...
–0.76 .26
+0.52 .35
–1.08 .50
–1.67 1.10
–0.38 ...
–2.69 ...
–0.04 ...
–0.31 .05
–1.89.094
–2.11 .09
+0.77 ...
+6.23 .25
–0.63 ...
–0.15 ...
–0.21.208
–10.82 ...
–9.88 .34
–0.63 .104
+0.16.1592
–0.441.1296
+0.56 .185
–2.31 .11
–0.81 .40
–0.14 ...
+0.34 ...
–5.80 .28
–1.02 ...
–0.06 .17
... ...
–0.86 .45
–0.11 ...
+0.89 ...
–17.20 3.25
+0.20 .30
–1.82 .02
+0.44 .35
–2.26 ...
–2.29 .49
–7.96 .48
–0.73 ...
–0.73 1.50
–2.68 ...
–0.22 ...
–1.51 .33
–1.41 ...
–0.32 ...
–0.52 ...
–3.00 .21
+0.63 .09
–22.65 ...
–0.38 ...
–4.63 .36
–0.20.7506
+0.12 ...
+0.04 ...
+0.84 ...
–0.32.1875
+3.692.0025
–0.34 ...
–3.34 .75
–0.28.0437
+3.52 ...
–32.9935.00
–0.21 ...
–0.74 ...
–3.72 .105
+0.89 .45
+2.58 1.00
–0.33 .13
–0.67 ...
–5.42 ...
–1.20 ...
–0.24 .058
–4.23 ...
–0.36 .28
–0.91 .01
1.6 4 11.03 –0.33.3429
... dd 10.38 –0.92 ...
2.5 7 47.97 –1.14 .30
2.6 7 38.82 +0.63 .25
4.1 8 36.97 –0.68 .38
2.6 21 75.65 +2.52 .50
... dd 1.96 –0.26 ...
T
13.49
45.18
14.73
111.57
146.60
22.29
21.82
24.52
45.81
138.16
18.94
94.29
118.04
9.23
25.00
110.69
17.15
21.51
28.77
47.48
91.44
181.70
43.40
54.48
11.25
22.78
49.34
54.40
8.03
56.75
20.65
34.36
8.87
448.71
276.43
11.15
4.53
29.58
21.75
51.68
38.00
9.20
85.40
93.78
57.73
65.64
3.45
67.03
6.77
11.45
2151.16
49.60
81.59
609.85
33.62
146.71
122.00
12.67
129.90
77.53
9.50
95.08
24.30
17.29
27.00
105.91
46.11
382.95
25.96
117.66
70.67
6.86
11.21
69.63
12.65
195.65
6.70
245.27
10.40
47.35
1018.50
8.88
15.77
82.75
44.99
194.51
12.51
55.30
84.68
36.28
9.56
123.67
29.70
30.54
dd
dd
11
15
22
5
44
46
27
22
19
26
61
dd
9
18
33
14
31
10
22
18
47
6
0
dd
13
10
5
4
cc
dd
18
26
28
19
13
16
dd
22
6
21
17
16
71
8
dd
33
21
dd
31
10
17
35
25
30
20
dd
dd
52
dd
13
32
7
dd
8
27
18
30
29
16
52
38
9
dd
9
dd
28
5
5
44
dd
14
dd
9
21
dd
29
44
8
14
19
29
dd
January 8, 2024
D ATA
–52-Week–
High
Low
17.33
12.87
10.92
17.27
17.61
20.85
51.26
24.78
5.91
5.63
26.69
9.60
3.12
79.70
11.60
18.67
426.83
66.79
11.85
9.13
10.12
7.00
10.08
10.15
25.56
15.38
0.61
3.52
19.67
4.90
1.23
45.02
10.00
9.83
301.69
44.94
Name
TripleFlagPrecMtl
TriplePtVent
TristarAcqnI
TriumphGroup
Tronox
TrueBlue
TruistFinl
TsakosEnergy
Tupperware
TurkcellIletism
TurningPoint
TutorPerini
Tuya
Twilio
twoA
TwoHarbors
TylerTech
TysonFoods
NYSE
Tick
Sym Yld P/E
TFPM 1.6
TPVG14.2
TRIS ...
TGI
...
TROX 3.8
TBI
...
TFC 5.5
TNP 2.5
TUP ...
TKC 1.3
TPB 1.0
TPC ...
TUYA ...
TWLO ...
TWOA ...
TWO14.1
TYL ...
TSN 3.6
56
dd
35
dd
dd
dd
9
2
...
5
44
dd
dd
dd
87
dd
cc
dd
Last
13.05
11.28
10.82
15.66
13.04
14.37
37.60
24.06
1.97
5.13
25.71
8.90
2.24
69.03
10.62
13.81
400.82
54.92
Div
Chg. Amt.
–0.26.0525
+0.42 .40
+0.04 ...
–0.92 ...
–1.12 .125
–0.97 ...
+0.68 .52
+1.84 .30
–0.03 ...
+0.32.0953
–0.61 .065
–0.20 ...
–0.06 ...
–6.84 ...
+0.03 ...
–0.12 .45
–17.30 ...
+1.17 .48
For personal non-commercial use only. Do not edit or alter. Reproductions not permitted.
To reprint or license content, please contact Barron's reprints department at 800-843-0008 or www.djreprints.com
U
31.40
45.46
43.19
73.03
71.52
18.87
60.59
26.61
69.60
47.94
46.99
124.11
14.64
7.43
63.53
303.76
26.53
5.62
13.05
11.42
10.54
205.59
55.99
246.99
6.69
8.97
43.95
197.80
585.50
49.95
50.20
554.70
50.08
67.80
57.52
158.57
20.15
13.28
52.15
18.79
19.11
17.99
30.95
20.19
48.07
43.62
13.26
41.43
18.48
44.01
13.79
33.96
78.08
10.38
3.34
25.40
103.00
10.98
2.31
6.29
5.86
5.85
150.50
46.16
183.69
2.60
6.71
12.88
133.68
325.15
27.27
20.40
445.68
22.20
44.40
37.00
113.69
10.29
5.63
36.27
13.13
11.17
UBS Group
UDR
UGI
U-Haul
U-Haul N
UMH Prop
Unitil
USA Compression
UsanaHealth
US Cellular
US Foods
US PhysTherapy
US Silica
UWM
Uber
Ubiquiti
UiPath
UltraparPart
UnderArmour A
UnderArmour C
Unifi
Unifirst
Unilever
UnionPacific
Unisys
UnitedMicro
UnitedNatFoods
UPS B
UnitedRentals
US Bancorp
US Steel
UnitedHealth
UnitySoftware
Universal
UniversalHealth
UniversalHealthB
UnivInsurance
UnvlTechInst
UnumGroup
UrbanEdgeProp
UtzBrands
UBS 1.8
UDR 4.4
UGI 6.0
UHAL ...
UHAL.B .3
UMH 5.6
UTL 3.1
USAC 8.5
USNA ...
USM ...
USFD ...
USPH 1.9
SLCA ...
UWMC 6.0
UBER ...
UI
1.9
PATH ...
UGP 1.1
UAA ...
UA
...
UFI
...
UNF .8
UL 3.8
UNP 2.2
UIS
...
UMC 5.5
UNFI ...
UPS 4.1
URI 1.1
USB 4.5
X
.4
UNH 1.4
U
...
UVV 5.1
UHT 6.9
UHS .5
UVE 3.9
UTI
...
UNM 3.2
UE 3.6
UTZ 1.3
3
28
dd
18
17
dd
19
cc
16
cc
26
54
6
dd
cc
19
dd
14
9
8
dd
27
14
23
dd
10
dd
16
16
13
11
23
dd
13
33
16
7
cc
7
52
83
29.92
37.82
24.95
67.16
64.99
14.70
52.03
24.57
50.61
42.23
46.73
92.79
11.30
6.68
57.58
128.80
22.61
5.56
7.90
7.57
6.46
161.56
48.76
239.91
6.65
8.10
15.34
158.72
541.39
43.81
48.35
537.38
37.78
62.76
42.03
153.70
16.62
12.86
45.84
17.96
17.17
–0.98 .55
–0.47 .42
+0.35 .375
–4.64 ...
–5.45 .05
–0.62 .205
–0.54.405
+1.74 .525
–2.99 ...
+0.69 ...
+1.32 ...
–0.35 .43
–0.01 ...
–0.47 .10
–3.99 ...
–10.76 .60
–2.23 ...
+0.14.0516
–0.89 ...
–0.78 ...
–0.20 ...
–21.35 .33
+0.28.4539
–5.71 1.30
+1.03 ...
–0.36 .586
–0.89 ...
+1.49 1.62
–32.03 1.48
+0.53 .49
–0.30 .05
+10.91 1.88
–3.11 ...
–4.56 .80
–1.22 .725
+1.26 .20
+0.64 .13
+0.34 ...
+0.62 .365
–0.34 .16
+0.93 .057
12.85
0.78
26.63
4.82
6.86
3.24
36.45
3.51
204.88
54.13
12.22
1.95
104.18
10.80
188.63
29.15
9.86
157.00
0.34
7.81
39.33
65.51
13.07
30.14
10.72
0.60
11.95
13.83
17.10
0.20
13.62
1.00
13.14
1.38
3.50
208.76
20.51
27.94
14.62
VF
ViaOptronics
VICI Prop
Vizio
VOC Energy
VTEX
V2X
VaalcoEnergy
VailResorts
Valaris
Vale
ValensSemicon
ValeroEnergy
Valhi
ValmontInds
Valvoline
VectorGroup
VeevaSystems
Velo3D
VelocityFinl
Ventas
Veralto
VerisResidential
Verizon
VermilionEnergy
VerticalAerospace
Vertiv
Vestis
Viad
VicariousSurgical
Victoria'sSecret
VinceHolding
Vipshop
VirginGalactic
VirnetX
Visa
Vishay
VishayPrecision
VistaEnergy
VFC 2.1
VIAO ...
VICI 5.2
VZIO ...
VOC 11.9
VTEX ...
VVX ...
EGY 5.4
MTN 3.9
VAL ...
VALE 7.6
VLN ...
VLO 3.2
VHI 2.1
VMI 1.0
VVV ...
VGR 7.0
VEEV ...
VLD ...
VEL ...
VTR 3.7
VLTO .5
VRE 1.4
VZ 6.6
VET 2.2
EVTL ...
VRT .1
VSTS .7
VVI
...
RBOT ...
VSCO ...
VNCE ...
VIPS ...
SPCE ...
VHC .0
V
.8
VSH 1.8
VPG ...
VIST ...
dd
dd
13
70
7
...
dd
14
39
87
7
dd
4
dd
32
dd
10
53
dd
12
cc
22
dd
8
3
dd
71
...
cc
dd
21
2
9
dd
dd
32
9
14
9
16.90
.79
31.68
7.46
7.49
7.54
41.04
4.59
210.14
68.40
15.30
2.41
129.00
15.54
229.57
35.00
11.35
185.69
.34
15.43
48.68
76.90
15.05
40.20
12.19
.62
46.31
20.74
33.90
.42
24.97
3.35
16.59
2.33
6.08
259.69
22.48
31.42
29.79
–1.90 .09
+0.01 ...
–0.20 .415
–0.24 ...
+0.29 .225
+0.66 ...
–5.40 ...
+0.10.0625
–3.33 2.06
–0.17 ...
–0.56.1541
–0.04 ...
–1.00 1.02
+0.35 .08
–3.94 .60
–2.58 ...
+0.07 .20
–6.83 ...
–0.05 ...
–1.79 ...
–1.16 .45
–5.36 .09
–0.68.0525
+2.50 .665
+0.13.0734
–0.06 ...
–1.72 .025
–0.40 .035
–2.30 ...
+0.05 ...
–1.57 ...
–0.11 ...
–1.17 ...
–0.12 ...
–0.9220.00
–0.66 .52
–1.49 .10
–2.65 ...
+0.28 ...
V
32.13
4.00
35.07
10.56
13.70
8.05
56.75
5.22
266.26
80.00
19.31
5.99
152.20
26.60
341.81
39.67
14.39
225.49
3.95
18.05
53.15
89.00
18.98
42.58
16.17
3.25
50.23
21.44
37.99
3.56
47.22
8.48
19.13
6.61
53.60
263.25
30.10
45.69
33.14
39
BARRON’S
NASDAQ ISSUES
–52-Week–
High
Low
33.78
39.03
62.87
27.39
35.39
32.21
78.11
229.75
23.33
21.18
39.74
13.90
20.26
12.31
62.79
159.76
Name
Tick
Sym Yld P/E
Last
Div
Chg. Amt.
VistaOutdoor
Vistra
VitalEnergy
VitesseEnergy
Vontier
VornadoRealty
VoyaFinancial
VulcanMatls
VSTO
VST
VTLE
VTS
VNT
VNO
VOYA
VMC
...
2.2
...
9.3
.3
4.3
2.2
.8
dd
11
1
29
16
dd
12
36
28.26
38.59
45.21
21.61
33.67
27.94
74.08
221.62
–1.31 ...
+0.07 .213
–0.28 ...
–0.28 .50
–0.88 .025
–0.31 .30
+1.12 .40
–5.39 .43
2.86
75.47
160.67
9.65
51.84
50.28
41.13
20.09
91.89
61.06
1.24
136.09
9.50
31.97
125.83
148.31
0.98
231.90
255.83
262.32
144.82
29.51
4.04
31.03
58.75
35.25
65.18
121.91
64.11
225.66
7.46
23.79
10.07
102.64
26.84
8.91
27.65
38.37
0.98
98.40
1312.00
8.21
2.81
28.84
28.35
27.80
109.44
53.94
4.32
5.49
27.35
7.21
19.02
24.46
79.42
17.69
31.25
21.00
63.69
W&T Offshore
WEC Energy
WEX
WKKellogg
WNS
W.P.Carey
WPP
WabashNational
Wabtec
Walker&Dunlop
Wallbox
Walmart
WarbyParker
WarriorMetCoal
WasteConnections
WasteMgt
Waterdrop
Waters
Watsco
Watsco B
WattsWater
Wayfair
WeaveComms
WebsterFin
WeisMarkets
WellsFargo
Welltower
WescoIntl
WestFraserTimber
WestPharmSvcs
WestAllianceBcp
WesternMidstrm
WesternUnion
Westlake
WestRock
Westwood
Weyerhaeuser
WheatonPrecMet
WheelsUp
Whirlpool
WhiteMtnIns
WhitestoneREIT
WideOpenWest
Wiley A
Wiley B
Williams
Williams-Sonoma
Winnebago
Wipro
WisdomTree
Wolfspeed
WolverineWwide
WoodsideEnergy
WooriFinl
Workiva
WorldKinect
WorthingtonEnts
WorthingtonSteel
WyndhamHtls
WTI 1.3
WEC 3.9
WEX ...
KLG 4.8
WNS ...
WPC 5.3
WPP 5.1
WNC 1.3
WAB .5
WD 2.5
WBX ...
WMT 1.5
WRBY ...
HCC .4
WCN .8
WM 1.6
WDH ...
WAT ...
WSO 2.4
WSO.B 2.4
WTS .7
W
...
WEAV ...
WBS 3.1
WMK 2.1
WFC 2.8
WELL 2.8
WCC .9
WFG 1.4
WST .2
WAL 2.3
WES 8.1
WU 7.9
WLK 1.4
WRK 2.9
WHG 5.0
WY 2.3
WPM 1.3
UP
...
WHR 5.8
WTM .1
WSR 4.1
WOW ...
WLY 4.5
WLYB 4.5
WMB 5.0
WSM 1.8
WGO 1.8
WIT .2
WT 1.7
WOLF ...
WWW 5.2
WDS10.4
WF 8.8
WK
...
WKC 2.5
WOR 1.2
WS 2.6
WH 1.7
8
20
32
...
19
18
17
6
30
29
...
26
dd
8
46
31
12
28
27
28
24
dd
dd
10
16
11
cc
11
dd
46
8
11
6
15
dd
21
39
40
dd
dd
14
16
dd
dd
dd
16
14
13
21
27
dd
dd
6
3
dd
13
9
...
23
3.18
86.24
197.91
13.39
61.51
64.85
48.94
25.24
125.49
99.27
1.61
156.71
13.79
65.11
146.48
177.77
1.06
305.07
406.00
412.60
195.46
55.36
11.02
51.48
65.07
49.92
88.52
168.84
85.35
339.48
63.29
28.55
11.96
138.30
41.91
11.96
33.68
47.62
4.93
120.95
1475.00
11.67
3.64
31.09
30.93
35.55
196.13
68.04
5.42
6.87
40.82
7.73
21.16
28.72
92.26
22.54
55.30
24.93
80.03
–0.08 .01
+2.07 .835
+3.36 ...
+0.25 .16
–1.69 ...
+0.04 .86
+1.37.9108
–0.38 .08
–1.41 .17
–11.74 .63
–0.14 ...
–0.94 .57
–0.31 ...
+4.14 .07
–2.79 .285
–1.33 .70
+0.01 ...
–24.16 ...
–22.47 2.45
–9.60 2.45
–12.88 .36
–6.34 ...
–0.45 ...
+0.72 .40
+1.11 .34
+0.70 .35
–1.65 .61
–5.04 .375
–0.23 .30
–12.64 .20
–2.50 .37
–0.71 .575
+0.04 .235
–1.66 .50
+0.39.3025
–0.61 .15
–1.09 .19
–1.72 .15
+1.50 ...
–0.82 1.75
–30.01 1.00
–0.62 .04
–0.41 ...
–0.65 .35
–1.23 .35
+0.72.4475
–5.65 .90
–4.84 .31
–0.15.1225
–0.06 .03
–2.69 ...
–1.16 .10
+0.07 .80
–1.50.4096
–9.27 ...
–0.24 .14
–2.25 .32
–3.17 .16
–0.38 .35
2.65
29.02
10.90
2.00
7.51
7.91
8.30
87.59
34.70
8.73
3.41
0.60
26.53
5.29
1.80
3.38
115.53
38.99
6.39
15.00
19.70
10.07
0.96
7.24
1.66
0.65
102.00
10.27
141.52
6.19
19.29
XFinancial
XPO
XeniaHotels
XinyuanRealEst
XPeng
Xperi
XponentialFit
Xylem
Yeti
YPF
Yalla
YatsenHolding
Yelp
Yext
YirenDigital
Youdao
Yum!Brands
YumChina
ZimIntShipping
ZKH
ZTO Express
ZalatorisAcqn
ZeppHealth
ZetaGlobal
ZeviaPBC
Zhihu
ZimmerBiomet
ZipRecruiter
Zoetis
Zuora
ZurnElkayWater
XYF .0
XPO ...
XHR 3.0
XIN ...
XPEV ...
XPER ...
XPOF ...
XYL 1.2
YETI ...
YPF ...
YALA ...
YSG ...
YELP ...
YEXT ...
YRD ...
DAO ...
YUM 1.9
YUMC 1.3
ZIM 64.1
ZKH ...
ZTO .0
TCOA ...
ZEPP ...
ZETA ...
ZVIA ...
ZH
...
ZBH .8
ZIP
...
ZTS .9
ZUO ...
ZWS 1.1
1
cc
32
dd
dd
dd
dd
46
63
7
10
dd
36
dd
1
dd
24
22
dd
dd
13
63
dd
dd
dd
dd
53
24
40
dd
45
4.17
82.27
13.29
2.71
13.09
10.56
11.43
112.15
45.57
16.70
5.86
.73
44.97
5.45
3.91
3.77
128.34
40.93
14.59
15.58
19.95
10.75
1.47
8.13
1.83
.85
119.98
13.81
194.85
8.29
27.93
+0.51 .30
–5.32 ...
–0.33 .10
–0.01 ...
–1.50 ...
–0.46 ...
–1.46 ...
–2.21 .33
–6.21 ...
–0.49 ...
–0.27 ...
... ...
–2.37 ...
–0.44 ...
+0.79 ...
–0.17 ...
–2.32 .605
–1.50 .13
+4.726.40
–0.73 ...
–1.33 .37
+0.08 ...
+0.05 ...
–0.69 ...
–0.18 ...
–0.09 ...
–1.72 .24
–0.09 ...
–2.52 .432
–1.11 ...
–1.48 .08
W
6.68
99.26
204.06
21.00
94.96
84.13
64.07
30.10
127.57
113.67
6.53
169.94
17.88
67.43
149.88
181.48
3.31
350.97
433.19
422.25
213.14
90.71
12.45
56.00
89.22
50.77
93.42
185.23
91.44
415.73
81.17
30.20
14.79
143.61
43.58
14.20
36.00
52.76
15.70
160.74
1617.00
12.63
12.45
49.58
49.19
37.45
209.27
75.42
5.60
7.55
87.93
17.85
26.93
33.09
116.00
30.65
59.73
35.01
81.73
XYZ
5.00
90.84
15.30
7.55
23.62
13.62
33.58
118.58
54.16
18.82
6.44
1.82
48.99
14.35
4.35
10.00
143.25
64.70
25.12
18.00
30.05
10.86
2.19
11.28
5.24
2.11
149.25
24.05
201.92
12.12
30.87
52-Week
High
Low
Name
Tick
Sym Yld P/E
Last
Div
Chg. Amt.
72.45
30.33
7.42
29.31
4.28
16.96
13.42
4.40
7.16
.13
11.96
9.60
11.75
12.59
18.77
46.67
29.15
56.77
344.08
19.12
34.34
13.85
5.68
703.34
10.88
.09
5.01
1.11
1.64
38.09
1.47
2.50
5.84
10.74
3.62
3.84
64.38
79.25
11.14
2.77
.78
.84
1.06
14.50
4.56
4.02
2.12
.88
4.58
88.26
12.11
2.42
9.31
564.60
2.81
100.87
138.58
3.61
4.67
19.61
118.30
43.01
1.04
20.83
77.78
23.14
2.46
10.08
16.84
16.61
135.98
7.36
1.89
114.33
22.84
4.33
61.19
10.46
7.49
9.70
29.11
264.68
7.95
.71
3.89
23.07
28.56
2.82
1.10
78.99
26.81
21.65
52.03
28.17
2.92
1.59
.65
189.38
–1.42 .08
–0.98 ...
–0.04 ...
–1.29 ...
–0.72 ...
–2.58 ...
–1.73 ...
–0.12 ...
–0.18 .09
–0.02 ...
–0.07 .48
–0.21 .12
+0.26 ...
–2.30 ...
–0.02 ...
–0.11 3.50
–1.10 .20
+1.63 ...
–18.80 ...
–1.37 ...
–1.54 .25
–0.22.1875
+0.20 ...
–53.581.5337
+0.02 ...
... ...
–1.02 ...
–0.05 ...
+0.23 ...
–0.88 .24
+0.11 ...
+0.10 ...
+0.13 ...
+0.04 ...
–0.58 ...
–0.08 ...
–1.62 .09
+1.49 ...
–0.87 ...
–0.06 ...
+0.04 ...
–0.05 ...
+0.01 ...
–0.59 ...
–0.36 ...
+0.18 ...
+0.19 ...
+0.09 ...
–0.32 ...
–4.59 ...
–0.28 .05
+0.53 ...
+0.32 ...
–32.00 ...
–0.17 ...
–8.05 .10
–8.83 ...
–0.01 ...
–0.57 ...
–3.02 ...
–7.74 ...
–6.13 ...
–0.21 ...
–1.10 ...
–7.04 ...
+0.87 ...
–0.17 ...
... ...
–0.06 ...
–1.00 ...
–0.16 ...
–0.13 ...
+0.19 ...
–4.02 ...
–0.51 ...
–0.55 ...
–3.43 ...
+0.03 ...
–0.49 ...
–0.33 .05
+0.03 .05
–9.32 ...
–0.66 ...
+0.05 ...
–0.43 ...
–1.18 ...
+0.82 ...
+0.09 ...
–0.13 ...
–3.62 .60
–3.47 ...
+0.47 .70
+0.73.4525
–2.04 .03
–0.30 ...
–0.06 ...
–0.03 ...
–2.03 ...
A
75.24
33.99
29.88
30.91
5.14
21.07
18.68
4.69
20.21
18.00
16.77
12.25
12.25
15.93
27.46
57.06
42.11
65.89
364.31
21.70
46.98
19.96
9.65
771.98
12.02
0.99
7.14
2.49
2.39
50.27
1.93
6.57
11.38
11.60
5.47
4.66
69.02
86.37
17.01
4.30
2.78
1.37
18.54
24.20
25.47
11.31
2.29
2.35
10.79
114.99
12.72
9.53
19.30
633.89
3.78
126.38
151.05
4.05
8.99
28.43
143.99
52.48
11.39
22.41
91.61
31.56
4.85
10.10
28.95
28.70
154.95
9.94
13.36
120.61
58.38
12.90
67.02
11.28
9.86
10.25
31.00
413.20
13.05
2.41
4.38
24.80
31.34
8.30
3.45
130.93
53.05
24.30
56.26
44.88
8.44
3.93
7.24
242.39
46.87
16.70
5.77
19.56
1.78
8.75
8.18
2.95
4.91
0.10
9.91
6.81
10.24
3.94
9.96
45.34
23.14
36.54
230.00
4.87
30.67
10.27
2.55
564.00
10.21
0.01
2.73
0.79
1.02
27.53
0.57
1.89
3.87
8.00
1.11
3.43
42.83
66.49
6.33
2.06
0.43
0.74
0.59
8.98
3.41
1.81
1.10
0.42
2.61
77.30
7.12
1.10
7.82
318.60
1.17
81.86
60.05
1.13
1.16
9.41
81.04
8.80
0.46
9.66
62.00
19.80
2.37
10.05
15.91
14.03
85.71
3.75
1.45
70.65
11.25
3.04
44.92
10.17
3.66
5.79
22.58
176.34
4.88
0.54
1.30
10.93
20.46
1.48
0.64
54.87
24.66
17.05
45.15
25.12
2.23
1.19
0.62
148.10
AAON
AcadiaPharm
ACELYRIN
ACI Worldwide
AC Immune
ACM Research
ACV Auctions
ADMA Biologics
Adtran
AerwinsTech
AFC Gamma
AGNC Invt
AIBAcqnA
AlxOncology
AMC Networks
Amerisafe
A-MarkPrecMet
ANI Pharm
Ansys
AN2 Therap
APA
ARKRestaurants
ARS Pharm
ASML
A SPAC II
A SPAC II Rt
AST Space
ATA Creativity
ATAI Life
ATN Intl
AVROBIO
AXT
AbCelleraBio
Abivax
Absci
AcaciaResearch
AcademySports
AcadiaHealthcare
Accolade
Accuray
AcelRxPharm
AchillesTherap
AclarisTherap
AcordaTherap
AcrivonTherap
AcumenPharm
Adagene
Adaptimmune
AdaptiveBiotech
AddusHomeCare
Adeia
AdicetBio
AdlaiNortye
Adobe
AdvEmissions
AdvEnergyInds
AdvMicroDevices
AdvantageSolns
Aemetis
AerovateTherap
AeroVironment
AffirmHldgs
AfricanAgriculture
Afya
Agilysys
AgiosPharm
Agora
Agric&NatSolnsA
AirT
AirTransportSvcs
Airbnb
AirSculptTech
AirshipAI
AkamaiTech
AkeroTherap
Akoya
Alarm.com
AlchemyInv1 A
Alector
AlgomaSteel
Alico
AlignTech
AlignmentHlthcr
AligosTherap
AlimeraSciences
AlkamiTech
Alkermes
Allakos
Allbirds
AllegiantTravel
AllegroMicro
AllianceResource
AlliantEnergy
Allient
AllogeneTherap
Allot
AlloVir
AlnylamPharm
AAON .4
ACAD ...
SLRN ...
ACIW ...
ACIU ...
ACMR ...
ACVA ...
ADMA ...
ADTN 5.0
AWIN ...
AFCG16.7
AGNC15.0
AIB
...
ALXO ...
AMCX ...
AMSF 2.9
AMRK 2.7
ANIP ...
ANSS ...
ANTX ...
APA 2.9
ARKR 5.4
SPRY ...
ASML .8
ASCB ...
ASCBR ...
ASTS ...
AACG ...
ATAI ...
ATNI 2.5
AVRO ...
AXTI ...
ABCL ...
ABVX ...
ABSI ...
ACTG ...
ASO .6
ACHC ...
ACCD ...
ARAY ...
ACRX ...
ACHL ...
ACRS ...
ACOR ...
ACRV ...
ABOS ...
ADAG ...
ADAP ...
ADPT ...
ADUS ...
ADEA 1.7
ACET ...
ANL ...
ADBE ...
ADES ...
AEIS .4
AMD ...
ADV ...
AMTX ...
AVTE ...
AVAV ...
AFRM ...
AAGR ...
AFYA ...
AGYS ...
AGIO ...
API
...
ANSC ...
AIRT ...
ATSG ...
ABNB ...
AIRS ...
AISP ...
AKAM ...
AKRO ...
AKYA ...
ALRM ...
ALCY ...
ALEC ...
ASTL 2.1
ALCO .7
ALGN ...
ALHC ...
ALGS ...
ALIM ...
ALKT ...
ALKS ...
ALLK ...
BIRD ...
ALGT 3.0
ALGM ...
ARLP12.9
LNT 3.5
ALNT .4
ALLO ...
ALLT ...
ALVR ...
ALNY ...
35
dd
dd
37
dd
16
dd
dd
dd
0
7
26
dd
dd
dd
14
6
94
62
dd
7
dd
dd
34
36
...
dd
dd
dd
dd
dd
dd
dd
dd
dd
dd
10
dd
dd
dd
dd
dd
dd
dd
dd
dd
dd
dd
dd
25
10
dd
...
48
dd
28
cc
dd
dd
dd
dd
dd
dd
27
cc
dd
dd
...
dd
11
16
dd
dd
34
dd
dd
48
81
dd
50
cc
56
dd
...
dd
dd
23
dd
dd
8
21
4
19
19
dd
dd
dd
dd
Nasdaq Issues includes stocks traded on the Nasdaq
Global Select and Nasdaq Global Market tiers. They are
eligible for inclusion on the basis of SEC-approved
market value of publicly-held shares, trading volume,
price and number of market-makers.
B A R R ON S.C OM / DATA
Five-Day Nasdaq Composite
Wait Time: Rate cuts may be longer in coming. Strong deliveries of
electric cars were greeted with disappointment. The Nasdaq Composite
Index ended Friday at 14,524—down 3.2% for the four-day week.
Monday
Tuesday
Wednesday
Thursday
Friday
15,030
(Previous Friday Close)
H
O
L
I
D
A
Y
10 12 2
52-Week
High
Low
38.87
11.66
0.14
6.48
142.68
143.95
19.14
11.48
0.25
20.94
0.44
84.92
11.86
11.36
17.17
8.48
14.60
27.77
2.23
155.63
99.86
16.86
99.75
106.02
19.08
98.32
50.76
11.25
13.74
15.88
17.37
94.75
127.96
53.84
4.12
305.09
14.57
34.44
6.30
67.66
11.98
41.93
202.77
29.25
11.93
58.84
3.49
4.18
15.96
32.33
7.65
94.75
55.13
33.08
49.00
211.41
54.26
199.62
11.62
165.01
24.08
4.42
45.11
11.20
7.97
2.69
2.46
3.15
125.48
59.10
90.65
6.14
37.75
17.57
20.03
10.25
0.01
1.62
84.86
85.57
8.66
10.05
0.06
6.40
0.06
45.05
10.16
1.23
2.09
2.85
6.70
14.05
0.65
81.43
43.59
1.28
78.38
69.36
10.86
69.38
25.26
6.97
3.76
9.38
3.54
47.98
58.12
28.33
2.41
211.71
9.70
17.58
1.24
27.99
3.59
11.82
154.99
13.36
4.90
33.92
0.63
1.55
5.72
16.54
1.57
19.83
36.62
14.19
0.55
102.85
29.80
124.89
1.61
98.58
1.60
0.76
9.22
9.86
1.41
0.72
0.11
1.69
70.57
26.32
60.70
0.52
14.21
1.76
Name
14,885
14,740
14,595
-245.41
4
10 12 2
Alpha&Omega
AlphaStarAcqn
AlphaStarRt
AlphaTeknova
Alphabet A
Alphabet C
Alphatec
AlphaTimeAcqn
AlphaTimeRt
AlpineImmune
AlsetCapAcqnRt
AltairEngg
AltEnergyA
AlternusCleanEner
Altimmune
AltisourcePortf
Alvotech
AmalgamFin
Amarin
Amazon.com
Ambarella
AmbrxBio
Amdocs
Amedisys
AmerAirlines
AEP
AmerNatlBkshrs
AmOutdoorBrands
AmerPubEduc
AmerSoftware
AmerSupercond
AmericanWoodmark
AmerCarMart
AmerisBancorp
AmeriServFin
Amgen
AmicusTherap
AmkorTech
AmnealPharm
AmphastarPharm
AmtechSystems
AmylyxPharm
AnalogDevices
AnaptysBio
AnavexLifeSci
Andersons
Anghami
Angi
AngioDynamics
AnikaTherap
Annexon
ApellisPharm
ApogeeEnt
ApogeeTherap
ApollomicsA
AppFolio
Appian
Apple
AppliedDigital
ApplMaterials
AppliedOptoelec
AppliedTherap
Applovin
APxAcqnI A
ApyxMedical
AquestiveTherap
Aravive
ArbutusBiopharma
ArcBest
Arcellx
ArchCapital
Arcimoto
ArcturusTherap
ArcutisBiotherap
-173.73
4
Tick
Sym Yld P/E
AOSL ...
ALSA ...
ALSAR ...
TKNO ...
GOOGL ...
GOOG ...
ATEC ...
ATMC ...
ATMCR ...
ALPN ...
ACAXR ...
ALTR ...
AEAE ...
ALCE ...
ALT ...
ASPS ...
ALVO ...
AMAL 1.5
AMRN ...
AMZN ...
AMBA ...
AMAM ...
DOX 2.0
AMED ...
AAL ...
AEP 4.2
AMNB 2.5
AOUT ...
APEI ...
AMSWA 4.0
AMSC ...
AMWD ...
CRMT ...
ABCB 1.2
ASRV 3.7
AMGN 3.0
FOLD ...
AMKR 1.0
AMRX ...
AMPH ...
ASYS ...
AMLX ...
ADI 1.8
ANAB ...
AVXL ...
ANDE 1.4
ANGH ...
ANGI ...
ANGO ...
ANIK ...
ANNX ...
APLS ...
APOG 1.8
APGE ...
APLM ...
APPF ...
APPN ...
AAPL .5
APLD ...
AMAT .9
AAOI ...
APLT ...
APP ...
APXI ...
APYX ...
AQST ...
ARAV ...
ABUS ...
ARCB .4
ACLX ...
ACGL ...
FUV ...
ARCT ...
ARQT ...
dd
34
...
dd
26
26
dd
46
...
dd
...
dd
70
9
dd
dd
dd
9
dd
76
dd
...
20
cc
6
19
17
dd
dd
41
dd
13
dd
12
19
22
dd
18
95
24
dd
dd
29
dd
dd
32
dd
dd
dd
dd
dd
dd
11
...
...
dd
dd
30
dd
18
dd
dd
cc
84
dd
dd
dd
dd
25
dd
10
dd
9
dd
10 12 2
Last
26.31
11.18
.07
3.58
135.73
137.39
13.74
10.80
.11
17.75
.26
80.00
10.89
1.27
11.19
2.93
12.26
26.10
.86
145.24
55.07
13.63
87.77
94.20
13.60
84.07
48.24
8.42
10.37
11.02
11.43
88.74
62.70
50.57
3.22
303.00
13.52
30.28
5.99
62.74
4.21
16.83
186.55
21.43
6.01
54.93
1.06
2.23
6.21
22.07
4.63
59.61
52.00
27.56
.91
164.35
33.38
181.18
7.37
149.00
20.15
2.25
38.11
11.18
2.60
2.34
.12
2.49
115.56
51.85
76.81
.82
31.23
3.71
Div
Chg. Amt.
+0.25 ...
+0.02 ...
–0.03 ...
–0.15 ...
–3.96 ...
–3.54 ...
–1.37 ...
+0.07 ...
+0.01 ...
–1.31 ...
+0.05 ...
–4.15 ...
... ...
–0.23 ...
–0.06 ...
–0.63 ...
+0.78 ...
–0.84 .10
–0.01 ...
–6.70 ...
–6.22 ...
–0.61 ...
–0.12 .435
–0.86 ...
–0.14 ...
+2.85 .83
–0.51 .30
+0.02 ...
+0.72 ...
–0.28 .11
+0.29 ...
–4.11 ...
–13.07 ...
–2.48 .15
–0.01 .03
+14.98 2.25
–0.67 ...
–2.99.0787
–0.08 ...
+0.89 ...
+0.01 ...
+2.11 ...
–12.01 .86
+0.01 ...
–3.30 ...
–2.61 .19
+0.02 ...
–0.26 ...
–1.63 ...
–0.59 ...
+0.09 ...
–0.25 ...
–1.41 .24
–0.38 ...
–0.05 ...
–8.89 ...
–4.28 ...
–11.35 .24
+0.63 ...
–13.07 .32
+0.83 ...
–1.10 ...
–1.74 ...
... ...
–0.02 ...
+0.32 ...
... ...
–0.01 ...
–4.65 .12
–3.65 ...
+2.54 ...
–0.04 ...
–0.30 ...
+0.48 ...
-81.91
4
+13.77
10 12 2
52-Week
High
Low
6.75
20.62
550.76
4.45
15.27
11.53
0.32
78.66
12.20
11.67
26.64
47.00
32.99
42.48
8.08
63.00
42.84
130.47
11.56
247.96
1.78
56.33
76.56
16.28
22.44
17.30
5.64
5.19
4.41
50.15
54.94
2.63
11.12
29.81
43.70
248.00
29.40
2.05
59.61
705.74
24.60
20.60
13.50
11.64
12.43
4.81
13.90
0.25
245.88
7.00
256.84
16.85
3.00
8.61
39.80
25.74
12.75
251.26
51.65
1.94
201.00
260.69
68.22
91.29
66.98
2.67
16.95
327.73
0.92
6.75
10.11
0.05
46.50
8.56
10.15
13.34
0.91
16.38
20.67
3.57
38.04
13.57
64.33
7.20
161.32
0.64
28.97
61.73
4.26
9.92
11.63
0.20
2.77
1.33
33.95
36.78
1.49
9.79
16.35
21.65
116.40
14.80
0.11
32.17
274.98
18.80
7.14
5.99
10.22
6.94
1.14
3.60
0.10
179.61
1.61
201.46
6.35
0.75
3.89
21.15
4.83
6.88
157.55
39.64
1.05
82.81
166.14
47.59
53.71
36.01
4
10 12 2
Name
14,450
4
Tick
Sym Yld P/E
dd
9
dd
dd
11
65
...
...
dd
19
39
...
14
dd
dd
24
dd
dd
dd
dd
dd
45
36
dd
dd
38
dd
dd
dd
dd
dd
20
76
50
9
dd
39
dd
dd
31
8
29
dd
48
dd
dd
47
...
54
dd
28
dd
dd
dd
20
dd
dd
4
6
dd
17
cc
dd
dd
dd
Last
6.16
20.41
396.22
3.50
11.35
10.89
.30
67.05
10.84
10.84
15.09
1.13
27.38
35.60
5.39
38.28
40.57
129.72
9.98
208.23
.81
34.90
68.38
7.72
15.72
17.06
.44
3.09
2.87
39.06
42.01
2.50
10.60
20.96
35.51
226.10
16.88
.12
33.03
369.52
21.50
11.63
8.85
10.92
8.40
3.29
4.06
.20
229.52
6.28
235.21
14.90
2.56
7.77
30.71
9.65
11.31
166.04
47.49
1.58
117.83
244.21
57.57
82.31
64.30
Div
Chg. Amt.
Ardelyx
AresCapital
argenx
ArgoBlockchain
Arhaus
AriszAcqnA
AriszAcqnRt
Arm
ArmadaAcqnI
ArogoCapA
ArrayTech
Arrival
ArrowFinancial
ArrowheadPharm
Arteris
ArtesianRscs A
Arvinas
AscendisPharma
AscentIndustries
AspenTech
AssemblyBiosci
AstecIndustries
AstraZeneca
AstriaTherap
Astronics
AstroNova
AtaraBiotherap
AteaPharm
AthiraPharma
AtlantaBravesC
AtlantaBravesA
AtlanticAmerican
AtlCoastal II A
AtlanticaSust
Atlanticus
Atlassian
AtourLifestyle
Atreca
AtriCure
Atrion
AuburnNatlBncp
AudioCodes
AuraBiosciences
AuraFatProjectsA
AuriniaPharm
AuroraInnov
AuroraTechA
AuroraTechRt
Autodesk
AutolusTherap
ADP
AvadelPharm
AveannaHealth
AvePoint
AviatNetworks
AvidityBio
AvidXchange
AvisBudget
Avnet
Aware
AxcelisTechs
AxonEnterprise
Axonics
AxsomeTherap
Azenta
ARDX ...
ARCC 9.4
ARGX ...
ARBK ...
ARHS ...
ARIZ ...
ARIZR ...
ARM ...
AACI ...
AOGO ...
ARRY ...
ARVL ...
AROW 3.9
ARWR ...
AIP
...
ARTNA 3.0
ARVN ...
ASND ...
ACNT ...
AZPN ...
ASMB ...
ASTE 1.5
AZN 2.1
ATXS ...
ATRO ...
ALOT ...
ATRA ...
AVIR ...
ATHA ...
BATRK ...
BATRA ...
AAME .8
ACAB ...
AY 8.5
ATLC ...
TEAM ...
ATAT .8
BCEL ...
ATRC ...
ATRI 2.4
AUBN 5.0
AUDC 3.1
AURA ...
AFAR ...
AUPH ...
AUR ...
ATAK ...
ATAKR ...
ADSK ...
AUTL ...
ADP 2.4
AVDL ...
AVAH ...
AVPT ...
AVNW ...
RNA ...
AVDX ...
CAR .0
AVT 2.6
AWRE ...
ACLS ...
AXON ...
AXNX ...
AXSM ...
AZTA ...
–0.04 ...
+0.38 .48
+15.79 ...
–0.24 ...
–0.50 ...
–0.02 ...
+0.09 ...
–8.10 ...
+0.07 ...
+0.08 ...
–1.71 ...
–0.01 ...
–0.56 .27
+5.00 ...
–0.50 ...
–3.17.2897
–0.59 ...
+3.77 ...
+0.42 ...
–11.92 ...
–0.01 ...
–2.30 .13
+1.03 .465
+0.04 ...
–1.70 ...
+0.80 ...
–0.07 ...
+0.04 ...
+0.44 ...
–0.52 ...
–0.77 ...
+0.05 .02
+0.02 ...
–0.54.445
–3.16 ...
–11.76 ...
–0.48 .15
–0.02 ...
–2.66 ...
–9.27 2.20
+0.22 .27
–0.44 .18
–0.01 ...
+0.05 ...
–0.59 ...
–1.08 ...
–0.42 ...
+0.01 ...
–13.96 ...
–0.16 ...
+2.24 1.40
+0.78 ...
–0.12 ...
–0.44 ...
–1.95 ...
+0.60 ...
–1.08 ...
–11.2210.00
–2.91 .31
–0.08 ...
–11.86 ...
–14.12 ...
–4.66 ...
+2.72 ...
–0.84 ...
BCB Bancorp
BGC
BJsRestaurants
BOK Fin
BRP Group
BRP
B RileyFin
BCBP 4.9 6 12.94 +0.09 .16
BGC .6 cc 6.67 –0.55 .01
BJRI ... 50 32.45 –3.56 ...
BOKF 2.6 9 85.23 –0.42 .55
BRP ... dd 23.34 –0.68 ...
DOOO .8 8 70.39 –1.30.1334
RILY 18.0 dd 22.26 +1.27 1.00
B
18.43
7.32
37.83
106.47
32.12
92.74
60.72
9.40
3.86
21.64
62.42
17.33
57.15
16.65
40
BARRON’S
D ATA
For personal non-commercial use only. Do not edit or alter. Reproductions not permitted.
To reprint or license content, please contact Barron's reprints department at 800-843-0008 or www.djreprints.com
52-Week
High
Low
8.49
160.88
10.38
37.58
150.82
7.10
104.00
29.07
52.36
30.86
10.76
31.61
67.30
16.57
8.62
5.10
119.39
19.99
24.31
10.06
0.15
89.40
50.74
1.39
280.62
69.21
69.57
16.50
55.37
10.74
62.91
22.87
31.78
10.83
13.39
28.98
89.91
8.61
14.20
12.08
2.53
319.76
117.77
43.69
7.71
156.28
7.68
8.22
5.54
3.56
6.85
88.56
77.90
4.00
13.47
0.11
12.80
28.75
28.80
12.98
11.42
8.52
94.00
2.03
3580.62
10.40
0.22
36.74
5.85
7.55
58.67
44.32
25.90
14.51
7.39
60.54
5.96
11.75
0.33
1151.82
14.11
84.84
27.92
2.06
3.80
11.47
25.57
Name
NASDAQ ISSUES
Tick
Sym Yld P/E
Last
Div
Chg. Amt.
3.50
103.32
1.31
26.12
110.74
3.13
68.44
9.34
30.72
19.53
7.17
21.22
39.31
1.46
2.40
1.64
76.22
13.30
15.02
10.01
0.10
50.42
16.95
0.60
156.56
30.21
30.11
0.36
33.75
6.23
0.34
5.58
12.54
5.00
6.81
10.41
51.79
1.24
9.76
4.83
1.03
220.86
76.02
6.63
0.93
88.00
1.05
3.09
0.80
0.50
1.22
53.39
47.27
3.03
9.60
0.01
10.17
20.70
12.45
7.08
10.27
1.26
37.82
0.84
2151.16
10.10
0.11
20.31
2.92
1.38
23.67
7.14
3.26
10.03
2.10
39.24
2.04
10.28
0.10
549.99
7.00
53.79
12.29
0.75
0.69
10.10
13.05
Backblaze
Baidu
Baijiayun
BakerHughes
Balchem
BallardPower
BancFirst
Bandwidth
BankOZK
Bank7
BankFinancial
BankwellFinl
Banner
BanzaiIntl
Baozun
BarinthusBio
BarrettBus
BassettFurniture
BayCom
BayviewAcqnA
BayviewAcqnRt
BeaconRoofing
BeamTherap
BeasleyBroadcast
BeiGene
BelFuse A
BelFuse B
Beneficient
BentleySystems
Berry(bry)
BetterHome&Fin
BeyondMeat
BicycleTherap
Big5SportingGds
BigCommerce
Bilibili
Bio-Techne
BioAtla
BioceresCrop
BioCryst
Biodesix
Biogen
BioMarinPharm
BiomeaFusion
Bionomics
BioNTech
BioraTherap
Biote
Bioventus
Bitfarms
BlackDiamond
Blackbaud
BlackLine
BlackRockCapInvt
BlkRkTCPCap
bleuacaciaRt
BlockchainCoinIA
Bloomin'Brands
BlueBird
BlueFoundryBncp
BlueOceanA
bluebirdbio
BlueprintMed
BoltBiotherap
Booking
BowenAcqn
BowenAcqnRt
BowmanConsult
BraggGaming
Brainsway
Braze
BridgeBioPharma
BridgerAerospace
BridgfordFoods
Brightcove
BrighthouseFin
BrilliantEarthA
BroadCapital
BroadCapitalRt
Broadcom
BrooklineBcp
Bruker
Bumble
BurgerFiIntl
BurningRockBio
BurTechAcqnA
BusFirstBcshs
BLZE ...
BIDU ...
RTC ...
BKR 2.4
BCPC .6
BLDP ...
BANF 1.9
BAND ...
OZK 3.1
BSVN 3.2
BFIN 3.9
BWFG 2.7
BANR 3.8
BNZI ...
BZUN ...
BRNS ...
BBSI 1.1
BSET 4.7
BCML 1.8
BAYA ...
BAYAR ...
BECN ...
BEAM ...
BBGI ...
BGNE ...
BELFA .4
BELFB .5
BENF ...
BSY .4
BRY 7.0
BETR ...
BYND ...
BCYC ...
BGFV 8.7
BIGC ...
BILI ...
TECH .5
BCAB ...
BIOX ...
BCRX ...
BDSX ...
BIIB ...
BMRN ...
BMEA ...
BNOX ...
BNTX ...
BIOR ...
BTMD ...
BVS ...
BITF ...
BDTX ...
BLKB ...
BL
...
BKCC10.1
TCPC11.4
BLEUR ...
BCSA ...
BLMN 3.6
BLBD ...
BLFY ...
BOCN ...
BLUE ...
BPMC ...
BOLT ...
BKNG ...
BOWN ...
BOWNR ...
BWMN ...
BRAG ...
BWAY ...
BRZE ...
BBIO ...
BAER ...
BRID ...
BCOV ...
BHF ...
BRLT ...
BRAC ...
BRACR ...
AVGO 2.0
BRKL 5.1
BRKR .3
BMBL ...
BFI
...
BNR ...
BRKH ...
BFST 2.4
dd
13
...
20
44
dd
14
dd
9
7
12
6
9
dd
dd
dd
16
21
10
...
...
dd
dd
dd
dd
12
10
dd
87
13
dd
dd
dd
36
dd
dd
47
dd
62
dd
dd
26
cc
dd
dd
10
dd
dd
dd
dd
dd
dd
cc
18
cc
...
cc
10
34
dd
46
dd
dd
dd
24
...
...
cc
dd
dd
dd
dd
dd
24
dd
dd
cc
dd
...
32
11
32
dd
dd
dd
cc
9
6.99
118.15
2.00
33.42
140.17
3.50
92.68
14.40
48.73
26.65
10.15
29.22
51.09
2.57
2.40
3.52
112.99
15.34
22.45
10.06
.13
86.28
26.07
.92
165.38
61.25
61.53
.37
46.73
6.89
.67
8.44
17.08
5.76
8.36
11.12
71.09
2.38
13.32
6.09
1.97
257.88
96.47
14.71
1.29
111.66
1.35
4.62
4.94
2.72
2.73
81.73
55.71
3.95
11.88
.05
10.90
26.56
24.88
9.97
10.86
1.42
82.97
1.19
3408.14
10.35
.15
31.79
5.07
7.46
47.49
37.69
6.41
11.67
2.32
52.89
3.24
11.20
.16
1049.28
10.64
69.43
14.01
.80
.92
10.73
23.66
–0.60 ...
–0.94 ...
... ...
–0.76 .20
–8.58 .79
–0.20 ...
–4.65 .43
–0.07 ...
–1.10 .38
–0.70 .21
–0.11 .10
–0.96 .20
–2.47 .48
+0.69 ...
–0.34 ...
–0.17 ...
–2.81 .30
–1.26 .18
–1.14 .10
+0.05 ...
+0.01 ...
–0.74 ...
–1.15 ...
+0.04 ...
–14.98 ...
–3.39 .06
–5.24 .07
–0.12 ...
–5.45 .05
–0.14 .09
–0.14 ...
–0.46 ...
–1.00 ...
–0.58 .125
–1.37 ...
–1.05 ...
–6.07 .08
–0.08 ...
–0.41 ...
+0.10 ...
+0.13 ...
–0.89 ...
+0.05 ...
+0.19 ...
–0.19 ...
+6.12 ...
... ...
–0.32 ...
–0.33 ...
–0.19 ...
–0.08 ...
–4.97 ...
–6.73 ...
+0.08 .10
+0.34 .25
... ...
+0.03 ...
–1.59 .24
–2.08 ...
+0.30 ...
+0.08 ...
+0.04 ...
–9.27 ...
+0.07 ...
–139.08 ...
+0.03 ...
+0.04 ...
–3.73 ...
+0.02 ...
+0.98 ...
–5.64 ...
–2.68 ...
–0.50 ...
+0.67 ...
–0.27 ...
–0.03 ...
–0.48 ...
+0.09 ...
+0.04 ...
–66.97 5.25
–0.27 .135
–4.05 .05
–0.73 ...
–0.06 ...
–0.01 ...
... ...
–0.99 .14
2.54
13.14
48.01
17.20
8.30
160.66
16.38
10.15
1.06
78.69
0.88
169.23
16.43
5.01
12.65
81.29
37.55
Cadiz
CARGOTherapeutics
C&F Fin
CB FinSvcs
CCC Intelligent
CDW
CEVA
CFAcqnVII A
C4 Therap
CH Robinson
CLPS
CME Group
CNB FinPA
CompassPath
CPI Card
CRA Intl
CrisprTherap
CDZI ...
CRGX ...
CFFI 2.7
CBFV 4.2
CCCS ...
CDW 1.2
CEVA ...
CFFS ...
CCCC ...
CHRW 2.8
CLPS .0
CME 2.2
CCNE 3.2
CMPS ...
PMTS ...
CRAI 1.7
CRSP ...
dd
...
8
9
dd
27
dd
cc
dd
27
cc
24
8
dd
7
20
dd
2.87
22.08
65.28
23.92
10.73
214.04
21.09
10.89
6.40
88.59
1.01
199.19
22.00
8.94
19.07
98.30
60.67
+0.07 ...
–1.07 ...
–2.91 .44
+0.11 .25
–0.66 ...
–13.28 .62
–1.62 ...
+0.04 ...
+0.75 ...
+2.20 .61
–0.03 .10
–11.41 5.25
–0.59 .175
+0.19 ...
–0.12 ...
–0.55 .42
–1.93 ...
C
5.80
29.01
72.00
24.98
13.41
229.42
36.29
11.52
9.41
108.05
1.77
223.80
25.07
11.15
45.95
128.10
76.97
January 8, 2024
52-Week
High
Low
69.35
27.98
211.56
35.09
25.94
23.77
279.33
60.27
6.55
61.91
5.36
38.97
26.17
29.30
20.25
23.26
42.95
71.59
3.98
45.29
3.06
32.20
8.29
30.00
25.00
36.86
16.16
25.07
11.77
8.93
19.47
12.00
12.49
197.99
19.57
4.51
18.04
4.89
24.64
8.59
13.00
42.49
15.89
7.44
8.38
17.70
11.92
1.99
12.67
3.97
95.78
286.62
51.48
29.59
45.72
365.63
21.43
8.85
4.04
8.65
2.52
51.71
45.93
13.17
5.34
2.38
36.79
24.96
3.82
38.37
1.70
458.30
154.17
41.28
39.49
53.43
11.56
11.76
93.12
17.65
6.89
13.02
48.88
2.13
27.97
175.20
150.45
43.17
83.36
130.66
607.79
5.60
111.15
58.19
34.94
13.04
115.89
10.72
6.10
100.00
1.85
12.02
0.15
58.99
1.63
48.50
46.19
9.57
116.80
27.60
10.66
5.88
155.20
38.33
3.50
42.25
0.16
21.59
12.78
15.25
11.91
3.53
26.52
22.49
1.13
17.82
0.66
3.46
4.22
14.27
15.00
26.12
11.93
16.34
10.09
4.22
11.22
1.15
0.57
6.30
2.57
0.68
4.80
0.39
14.45
3.44
2.18
25.20
13.08
2.50
1.49
10.43
10.25
0.60
10.34
0.36
72.33
202.13
35.05
9.26
27.24
232.15
10.68
4.26
0.96
3.00
0.61
35.60
33.77
5.70
1.28
1.55
14.47
11.81
1.21
23.66
0.09
315.02
117.18
28.58
17.29
33.72
10.32
10.28
69.68
12.91
0.19
0.60
14.27
0.88
21.34
117.05
106.45
29.84
24.68
95.01
423.06
0.75
65.02
45.56
14.21
7.61
82.53
4.77
3.03
22.91
0.65
10.10
0.05
31.66
0.71
29.91
Name
CSG Systems
CSP
CSW Industrials
CSX
CVB Fin
CabalettaBio
CadenceDesign
CaesarsEnt
Caesarstone
Cal-MaineFoods
CalAmp
CalavoGrowers
CaliforniaBncp
CalliditasTherap
CalumetSpecialty
CambiumNtwks
CamdenNational
Camtek
Canaan
CanadianSolar
CandelTherap
CanopyGrowth
Cantaloupe
CanterburyPark
CapitalBancorp
CapitalCityBank
CapitalProduct
CapitalSouthwest
CapitalworksEMA
CapitolFedFin
CapStarFin
Captivision
CaraTherap
CarbonRevolution
Cardlytics
Carecloud
CareDx
CareMax
CarGurus
CaribouBio
CarismaTherap
Carlyle
CarlyleSecured
CarParts.com
CarrolsRestr
CarterBkshrs
CartesianGrwIIA
CartesianTherap
CarticaAcqnA
CasaSystems
CasellaWaste
CaseysGenStores
CassInfoSys
CastleBiosci
CathayGenBncp
CavcoIndustries
CECO Env
CellebriteDI
Cellectis
CentessaPharm
Centogene
CentralGarden
CentralGardenA
CenturyAluminum
CenturyTherap
Ceragon
Cerence
Certara
Cerus
ChampionX
ChargeEnt
CharterComms
CheckPoint
Cheesecake
ChefsWarehouse
ChemungFinl
ChengheAcqnA
ChengheAcqnIA
ChesapeakeEner
ChicagoAtlRealEst
ChickenSoupA
ChijetMotor
Children'sPlace
Chimerix
ChipMOSTechs
ChordEnergy
ChurchillDowns
Chuy's
Cimpress
CincinnatiFinl
Cintas
CipherMining
CirrusLogic
CiscoSystems
CitiTrends
CtznCmntyBcp
CityHolding
Clarus
CleanEnerFuels
Clearfield
ClearsideBiomed
ClimateRockA
ClimateRockRt
ClimbGlbl
CloverHealth
CoastalFinl
B A R R ON S .C OM / D ATA
Tick
Sym Yld P/E
CSGS 2.2
CSPI .9
CSWI .4
CSX 1.3
CVBF 4.1
CABA ...
CDNS ...
CZR ...
CSTE ...
CALM .8
CAMP ...
CVGW 1.4
CALB ...
CALT ...
CLMT ...
CMBM ...
CAC 4.6
CAMT ...
CAN ...
CSIQ ...
CADL ...
CGC ...
CTLP ...
CPHC 1.5
CBNK 1.2
CCBG 2.8
CPLP 3.7
CSWC 8.8
CMCA ...
CFFN 5.5
CSTR 2.4
CAPT ...
CARA ...
CREV ...
CDLX ...
CCLD ...
CDNA ...
CMAX ...
CARG ...
CRBU ...
CARM ...
CG 3.6
CGBD 9.5
PRTS ...
TAST 1.0
CARE ...
RENE ...
RNAC ...
CITE ...
CASA ...
CWST ...
CASY .6
CASS 2.7
CSTL ...
CATY 3.1
CVCO ...
CECO ...
CLBT ...
CLLS ...
CNTA ...
CNTG ...
CENT ...
CENTA ...
CENX ...
IPSC ...
CRNT ...
CRNC ...
CERT ...
CERS ...
CHX 1.2
CRGE ...
CHTR ...
CHKP ...
CAKE 3.2
CHEF ...
CHMG 2.5
CHEA ...
LATG ...
CHK 2.8
REFI 11.8
CSSE ...
CJET ...
PLCE ...
CMRX ...
IMOS 4.3
CHRD 3.1
CHDN .3
CHUY ...
CMPR ...
CINF 2.8
CTAS .9
CIFR ...
CRUS ...
CSCO 3.1
CTRN ...
CZWI 2.5
CHCO 2.7
CLAR 1.6
CLNE ...
CLFD ...
CLSD ...
CLRC ...
CLRCR ...
CLMB 1.3
CLOV ...
CCB ...
21
17
30
18
11
dd
72
14
dd
6
dd
dd
9
dd
34
dd
11
42
dd
5
dd
dd
47
9
10
9
6
14
42
dd
12
20
dd
cc
dd
dd
dd
dd
12
dd
dd
69
12
dd
dd
8
36
dd
31
dd
cc
22
20
dd
9
14
39
dd
dd
dd
...
21
18
dd
dd
41
dd
dd
dd
18
dd
12
21
19
74
8
65
37
2
8
dd
11
dd
dd
19
6
27
23
dd
10
42
dd
31
15
dd
9
14
dd
dd
13
dd
cc
...
20
dd
12
Last
50.88
18.20
202.06
34.62
19.35
22.30
252.71
44.91
4.19
55.31
.26
28.11
24.51
23.74
17.42
5.19
36.84
67.93
2.11
23.81
1.41
4.75
6.89
19.02
24.34
28.45
16.10
25.06
10.90
6.16
18.46
3.61
.61
27.85
7.03
1.45
11.30
.40
22.49
4.82
2.63
39.33
15.65
2.96
8.21
14.32
10.98
.62
10.92
.44
81.03
284.34
44.40
21.00
43.53
315.99
19.40
8.23
3.00
6.73
1.20
48.90
43.15
10.95
3.19
2.27
19.11
17.09
1.96
27.89
.09
372.20
151.05
33.43
30.00
49.47
11.01
11.03
79.20
15.93
.22
.60
21.02
.94
26.64
162.82
127.13
35.43
72.24
107.36
577.26
3.91
77.78
50.09
28.37
11.52
106.59
6.18
3.61
28.12
1.34
11.14
.09
51.59
.95
42.82
Div
Chg. Amt.
–2.33 .28
–1.29 .04
–5.35 .19
–0.05 .11
–0.84 .20
–0.40 ...
–19.66 ...
–1.97 ...
+0.45 ...
–2.08 .116
+0.01 ...
–1.30 .10
–0.25 ...
–2.00 ...
–0.46 ...
–0.81 ...
–0.79 .42
–1.45 ...
–0.20 ...
–2.42 ...
–0.06 ...
–0.36 ...
–0.52 ...
–1.41 .07
+0.14 .08
–0.98 .20
+1.90 .15
+1.36 .06
+0.03 ...
–0.29 .085
–0.28 .11
–0.11 ...
–0.13 ...
+4.82 ...
–2.18 ...
–0.07 ...
–0.70 ...
–0.10 ...
–1.67 ...
–0.91 ...
–0.30 ...
–1.36 .35
+0.69 .07
–0.20 ...
+0.33 .02
–0.65 ...
+0.04 ...
–0.07 ...
+0.01 ...
–0.09 ...
–4.43 ...
+9.60 .43
–0.65 .30
–0.58 ...
–1.04 .34
–30.63 ...
–0.88 ...
–0.43 ...
–0.08 ...
–1.23 ...
... ...
–1.21 ...
–0.89 ...
–1.19 ...
–0.13 ...
+0.11 ...
–0.55 ...
–0.50 ...
–0.20 ...
–1.32 .085
–0.02 ...
–16.48 ...
–1.74 ...
–1.58 .27
+0.57 ...
–0.33 .31
+0.01 ...
... ...
+2.26 .575
–0.25 .29
... ...
–0.10 ...
–2.20 ...
–0.02 ...
–0.571.5007
–3.41 1.25
–7.80 .382
–2.80 ...
–7.81 ...
+3.90 .75
–25.40 1.35
–0.22 ...
–5.41 ...
–0.43 .39
+0.09 ...
–0.19 .29
–3.67 .715
–0.72 .025
–0.22 ...
–0.96 ...
+0.17 ...
+0.13 ...
–0.02 ...
–3.24 .17
... ...
–1.59 ...
52-Week
High
Low
961.91
67.00
6.98
25.95
15.68
77.00
59.51
3.49
76.85
6.94
10.99
43.99
187.39
38.40
34.96
131.01
13.97
13.98
33.24
22.23
98.32
42.87
47.46
66.86
11.96
9.34
47.24
17.66
81.00
12.00
16.00
7.90
31.62
29.50
16.87
151.82
4.95
25.00
41.22
2.08
2.84
26.12
11.69
62.08
4.79
38.29
127.24
45.22
13.75
32.10
399.62
51.53
6.09
20.72
255.60
4.19
92.36
681.91
24.61
57.57
121.17
5.80
576.05
20.77
18.00
10.09
17.89
37.88
36.76
151.32
2.64
31.82
14.66
261.81
13.74
2.91
7.30
12.79
41.57
33.14
222.51
25.33
3.14
13.77
95.61
3.02
Name
Tick
Sym Yld P/E
Last
Div
Chg. Amt.
474.28
53.53
1.45
16.00
3.67
57.35
34.28
0.90
56.45
2.95
1.43
29.07
31.55
1.15
20.83
83.38
4.70
8.59
17.54
14.11
66.01
30.29
34.63
40.91
5.48
1.34
32.68
10.38
53.20
10.01
0.90
4.64
9.78
9.60
7.26
70.58
2.40
0.95
14.69
0.65
0.53
13.11
2.55
18.33
2.10
13.66
71.16
24.12
7.82
3.55
303.74
30.32
2.57
11.45
139.76
0.61
65.12
462.22
12.65
29.34
62.69
3.28
369.13
7.20
13.11
5.44
6.24
15.23
22.10
74.00
1.64
15.65
9.29
92.25
7.64
1.43
2.57
3.41
1.38
6.57
113.19
5.75
1.37
3.80
25.98
1.04
CocaColaCon
Coca-ColaEuro
Codexis
CodorusValleyBncp
CogentBio
CogentComm
Cognex
CognitionTherap
CognizantTech
CognyteSoftware
CoherusBioSci
Cohu
CoinbaseGlbl
CollectiveAudience
CollegiumPharm
ColliersIntl
Collplant
ColonyBankcorp
ColumbiaBanking
ColumbiaFinl
ColumbiaSportswr
ColumbusMcKinn
Comcast A
CommerceBcshrs
CommVehicle
CommScope
CmntyTrBcp
CommWestBcshs
CommvaultSystems
CompassDigitalAcqn
CompleteSolaria
CompoSecure
ComputerPrograms
comScore
ComtechTel
Concentrix
Conduent
ConduitPharm
Confluent
Conifer
ConnectBiopharma
ConnectOneBncp
Conn's
ConsensusCloud
ConsldComm
ConsldWater
ConstellationEner
ConstructionPtrs
ConsumerPtfo
ContextLogic
Cooper
Copart
CorMedix
CorsairGaming
Corvel
CorvusPharm
CoStar
Costco
Couchbase
CovenantLogist
CrackerBarrel
CreativeMedia
CreditAcceptance
CredoTech
CrescentCapBDC
Cresud
Cricut
CrineticsPharm
Criteo
Crocs
Cronos
CrossCtyHlthcr
CrossFirstBkshs
CrowdStrike
CullinanOncology
CumberlandPharm
CumulusMedia
CureVac
Cutera
CVRx
CyberArkSoftware
CymaBayTherap
CyteirTherap
CytekBiosci
Cytokinetics
CytomXTherap
COKE .2
CCEP 3.0
CDXS ...
CVLY 2.7
COGT ...
CCOI 5.0
CGNX .8
CGTX ...
CTSH 1.6
CGNT ...
CHRS ...
COHU ...
COIN ...
CAUD ...
COLL ...
CIGI .3
CLGN ...
CBAN 3.3
COLB 5.6
CLBK ...
COLM 1.6
CMCO .8
CMCSA 2.7
CBSH 1.9
CVGI ...
COMM ...
CTBI 4.3
CWBC 1.9
CVLT ...
CDAQ ...
CSLR ...
CMPO ...
CPSI ...
SCOR ...
CMTL 4.9
CNXC 1.2
CNDT ...
CDT ...
CFLT ...
CNFR ...
CNTB ...
CNOB 2.9
CONN ...
CCSI ...
CNSL ...
CWCO 1.2
CEG 1.0
ROAD ...
CPSS ...
WISH ...
COO .0
CPRT ...
CRMD ...
CRSR ...
CRVL ...
CRVS ...
CSGP ...
COST .6
BASE ...
CVLG 1.0
CBRL 7.0
CMCT 9.2
CACC ...
CRDO ...
CCAP 9.5
CRESY 3.4
CRCT .0
CRNX ...
CRTO ...
CROX ...
CRON ...
CCRN ...
CFB ...
CRWD ...
CGEM ...
CPIX ...
CMLS ...
CVAC ...
CUTR ...
CVRX ...
CYBR ...
CBAY ...
CYT ...
CTKB ...
CYTK ...
CTMX ...
19
17
dd
9
dd
3
42
dd
18
dd
dd
31
dd
dd
cc
cc
dd
11
12
39
16
21
12
14
dd
dd
9
15
dd
41
dd
7
dd
dd
dd
15
dd
cc
dd
dd
dd
10
dd
6
dd
24
22
43
4
dd
62
34
dd
cc
54
dd
82
45
dd
11
19
dd
22
dd
11
3
27
dd
cc
8
dd
8
11
dd
dd
dd
dd
dd
dd
dd
dd
dd
dd
dd
dd
dd
907.12
64.61
2.79
25.23
5.17
74.49
37.85
1.93
72.84
5.99
2.87
32.95
153.98
1.36
32.30
114.67
6.15
13.15
25.94
18.98
75.37
36.93
43.04
53.66
6.92
2.74
42.55
17.01
73.97
10.57
1.47
5.34
10.02
17.24
8.21
97.05
3.46
5.19
22.25
1.36
1.18
23.13
4.71
22.48
4.43
32.70
116.24
40.50
8.57
5.17
365.93
46.55
3.39
13.59
231.66
2.06
81.34
656.01
20.98
43.90
74.19
3.70
534.27
17.53
17.20
9.01
6.47
34.76
24.16
86.46
2.18
22.73
13.73
247.46
10.17
2.24
5.02
4.34
3.03
29.61
211.72
23.02
3.03
8.07
93.73
1.51
–21.2816.00
–2.13 1.23
–0.26 ...
–0.47 .17
–0.71 ...
–1.57 .955
–3.89 .075
+0.08 ...
–2.69 .29
–0.44 ...
–0.46 ...
–2.44 ...
–19.94 ...
+0.01 ...
+1.52 ...
–11.85 .15
–0.24 ...
–0.15 .11
–0.74 .36
–0.30 ...
–4.17 .30
–2.09 .07
–0.81 .29
+0.25.2571
–0.09 ...
–0.08 ...
–1.31 .46
–0.38 .08
–5.88 ...
–0.08 ...
–0.14 ...
–0.06 ...
–1.18 ...
+0.54 ...
–0.22 .10
–1.16.3025
–0.19 ...
+0.64 ...
–1.15 ...
+0.26 ...
... ...
+0.22 .17
+0.27 ...
–3.73 ...
+0.08 ...
–2.90 .095
–0.65 .282
–3.02 ...
–0.80 ...
–0.78 ...
–12.51 .03
–2.45 ...
–0.37 ...
–0.51 ...
–15.55 ...
+0.30 ...
–6.05 ...
–4.0715.00
–1.54 ...
–2.14 .11
–2.89 1.30
+0.01 .085
+1.54 ...
–1.94 ...
–0.18 .41
–0.47 .305
–0.12 1.00
–0.82 ...
–1.16 ...
–6.96 ...
+0.09 ...
+0.09 ...
+0.15 ...
–7.86 ...
–0.02 ...
+0.45 ...
–0.30 ...
+0.13 ...
–0.50 ...
–1.83 ...
–7.33 ...
–0.60 ...
–0.01 ...
–1.05 ...
+10.24 ...
–0.04 ...
0.65
14.89
0.74
10.28
22.06
2.88
2.76
3.72
61.34
31.65
4.47
1.28
9.67
9.90
5.53
10.00
15.45
26.27
DBV Tech
DMC Global
D-MarketElec
DPCapAcqnIA
DXP Ents
DadaNexus
Daktronics
DallasNews
Datadog
Dave&Buster's
Dave
DawsonGeophys
DayOneBiopharm
DecipheraPharm
DefinitiveHlthcr
DenaliCapAcqnA
DenaliTherap
DentsplySirona
DBVT ...
BOOM ...
HEPS ...
DPCS ...
DXPE ...
DADA ...
DAKT ...
DALN14.6
DDOG ...
PLAY ...
DAVE ...
DWSN ...
DAWN ...
DCPH ...
DH
...
DECA ...
DNLI ...
XRAY 1.6
dd
11
dd
49
10
dd
8
dd
dd
19
dd
dd
dd
dd
dd
dd
dd
dd
.87
18.02
1.68
10.91
32.22
3.15
7.93
4.39
115.99
50.67
8.29
1.62
14.44
15.29
9.00
12.01
19.34
35.38
–0.09 ...
–0.80 ...
–0.12 ...
+0.02 ...
–1.48 ...
–0.17 ...
–0.55 ...
+0.14 .16
–5.39 ...
–3.18 ...
–0.10 ...
–0.21 ...
–0.16 ...
–0.84 ...
–0.94 ...
+1.84 ...
–2.12 ...
–0.21 .14
D
2.37
28.01
1.89
11.30
39.89
15.59
12.42
5.70
124.69
55.98
10.10
2.65
25.77
22.76
14.03
14.10
33.31
43.24
52-Week
High
Low
86.18
9.81
7.57
3.21
139.55
193.20
171.40
42.95
38.95
25.85
33.51
97.45
66.61
12.35
0.49
33.18
3.96
1.36
24.22
52.88
69.45
161.10
19.09
15.76
16.75
103.98
33.18
102.25
10.95
2.12
39.35
11.44
31.47
30.50
7.88
245.87
15.15
19.87
Name
Tick
Sym Yld P/E
Last
Div
Chg. Amt.
66.73
1.94
3.64
2.12
74.75
145.86
119.01
21.25
16.13
12.34
15.57
60.00
17.39
10.15
0.10
18.20
0.64
0.46
9.04
29.40
38.11
102.77
7.78
13.82
12.50
45.93
26.50
60.01
6.95
0.70
11.14
0.50
10.61
18.71
4.65
71.07
9.42
6.40
DescartesSystems
DesignTherap
DestinationXL
Deswell
DexCom
DiamondHillInvt
DiamondbkEner
DigiIntl
Digimarc
DigitalWorldA
DimeCommBcshs
Diodes
DiscMedicine
DistokenAcqn
DistokenAcqnRt
DistributionSoln
DiversifiedHlthcr
DixieGroup
dLocal
Docebo
DocuSign
DollarTree
Domo
DonegalGroup A
DonegalGroup B
DoorDash
DorchesterMnls
DormanProducts
DoubleDown
DouYuIntl
DraftKings
DragonflyEnergy
DrivenBrands
Dropbox
DuluthHoldings
Duolingo
DynavaxTechs
DyneTherap
DSGX ...
DSGN ...
DXLG ...
DSWL 7.8
DXCM ...
DHIL 3.7
FANG 2.2
DGII ...
DMRC ...
DWAC ...
DCOM 3.8
DIOD ...
IRON ...
DIST ...
DISTR ...
DSGR ...
DHC 1.2
DXYN ...
DLO ...
DCBO ...
DOCU ...
DLTR ...
DOMO ...
DGICA 4.9
DGICB 3.9
DASH ...
DMLP11.8
DORM ...
DDI
...
DOYU ...
DKNG ...
DFLI ...
DRVN ...
DBX ...
DLTH ...
DUOL ...
DVAX ...
DYN ...
61
dd
8
7
cc
11
9
37
dd
dd
9
12
dd
87
...
cc
dd
dd
37
cc
cc
26
dd
46
57
dd
12
26
dd
15
dd
dd
dd
18
dd
dd
38
dd
79.50
2.52
4.00
2.58
123.98
160.11
155.95
24.55
33.73
17.23
26.04
73.55
57.92
10.60
.17
30.02
3.29
.67
17.67
43.77
54.64
136.29
9.56
13.96
15.66
94.81
31.20
79.62
8.37
.91
33.18
.52
13.42
29.16
5.24
204.14
14.74
17.96
–4.56 ...
–0.13 ...
–0.40 ...
–0.07 .10
–0.11 ...
–5.48 1.50
+0.87 2.53
–1.45 ...
–2.39 ...
–0.27 ...
–0.89 .25
–6.97 ...
+0.16 ...
... ...
+0.06 ...
–1.54 ...
–0.45 .01
–0.08 ...
–0.02 ...
–4.61 ...
–4.81 ...
–5.76 ...
–0.73 ...
–0.03 .17
+1.13.1525
–4.08 ...
–0.63.8451
–3.79 ...
+1.02 ...
–0.04 ...
–2.07 ...
–0.02 ...
–0.84 ...
–0.32 ...
–0.14 ...
–22.72 ...
+0.76 ...
+4.66 ...
2.00
0.95
3.60
10.26
0.40
10.05
0.11
12.79
11.26
4.62
1.47
33.86
9.93
15.30
3.59
37.17
9.53
5.12
6.08
0.80
8.63
4.81
0.20
2.15
6.58
8.11
162.01
108.53
0.36
4.60
2.21
12.72
10.24
0.09
20.84
8.08
34.74
136.12
10.30
14.04
12.11
9.80
7.44
73.49
85.50
217.52
67.01
25.00
32.97
9.32
41.71
4.76
650.61
1.51
199.49
10.83
0.70
2.42
58.20
73.84
11.97
18.50
7.50
10.00
10.23
46.92
ECARX
ECDAutoDesign
EDAP TMS
EsgenAcqnA
ESGL
ESH Acqn A
ESH Acqn Rt
ESSA Bancorp
EagleBncpMT
EaglePharm
Eargo
EastWestBncp
EasternBankshares
Eastern
EbangIntl
eBay
EchoStar
EdgewiseTherap
EditasMedicine
EducDev
EHang
eHealth
EigerBioPharma
8x8
89bio
ElPolloLoco
ElbitSystems
ElectronicArts
ElevationOnc
ElicioTherap
EliemTherap
Embecta
EmbraceChange
EmbraceChangeRt
Enact
EnantaPharma
EncoreCapital
EncoreWire
EnergemA
EnergyRecovery
EnlightRenewableEn
EnlivenTherap
Enovix
EnphaseEnergy
EnsignGroup
Enstar
Entegris
EnterpriseBncp
EnterpriseFinSvcs
EntradaTherap
ePlus
EpsilonEnergy
Equinix
Erasca
ErieIndemnity
Escalade
EsperionTherap
EtonPharm
Etsy
EuronetWorldwide
EuropeanWax
Everbridge
EverCommerce
Evergreen
EvergreenA
Evergy
ECX ...
ECDA ...
EDAP ...
ESAC ...
ESGL ...
ESHA ...
ESHAR ...
ESSA 3.0
EBMT 3.6
EGRX ...
EAR ...
EWBC 2.6
EBC 3.1
EML 2.0
EBON ...
EBAY 2.3
SATS ...
EWTX ...
EDIT ...
EDUC ...
EH
...
EHTH ...
EIGR ...
EGHT ...
ETNB ...
LOCO ...
ESLT 1.0
EA
.6
ELEV ...
ELTX ...
ELYM ...
EMBC 4.1
EMCG ...
EMCGR ...
ACT 2.3
ENTA ...
ECPG ...
WIRE .0
ENCP ...
ERII ...
ENLT ...
ELVN ...
ENVX ...
ENPH ...
ENSG .2
ESGR ...
ENTG .4
EBTC 3.0
EFSC 2.2
TRDA ...
PLUS ...
EPSN 5.1
EQIX 2.2
ERAS ...
ERIE 1.5
ESCA 3.1
ESPR ...
ETON ...
ETSY ...
EEFT ...
EWCZ ...
EVBG ...
EVCM ...
EVGRU ...
EVGR ...
EVRG 4.8
dd
dd
...
dd
dd
cc
...
10
11
6
dd
8
dd
27
dd
8
11
dd
dd
dd
dd
dd
dd
dd
dd
11
34
37
dd
dd
dd
15
55
...
7
dd
dd
8
cc
68
28
58
dd
29
26
6
83
9
8
dd
15
8
85
dd
43
27
dd
51
32
18
90
dd
dd
...
41
18
2.67
1.11
5.10
11.27
.55
10.24
.12
19.97
15.60
5.13
2.61
72.46
14.06
22.20
13.31
42.79
12.64
10.11
9.09
1.22
15.21
7.74
.22
3.56
11.53
8.76
208.54
135.61
.87
7.10
2.89
18.24
10.96
.16
28.43
12.11
49.62
214.87
11.36
17.85
18.27
13.22
12.19
115.39
114.01
286.15
109.93
31.12
44.48
15.25
75.40
4.91
788.39
2.04
329.81
19.16
2.55
4.34
75.64
98.23
13.00
21.55
9.99
11.17
11.20
53.70
–0.49 ...
–0.12 ...
–0.18 ...
+0.01 ...
–0.15 ...
–0.01 ...
+0.01 ...
–0.05 .15
–0.19 .14
–0.10 ...
+0.02 ...
+0.51 .48
–0.14 .11
+0.20 .11
–1.99 ...
–0.83 .25
–3.93 ...
–0.83 ...
–1.04 ...
+0.06 ...
–1.59 ...
–0.98 ...
–0.01 ...
–0.22 ...
+0.36 ...
–0.06 ...
–4.71 .50
–1.20 .19
+0.34 ...
–1.24 ...
+0.19 ...
–0.69 .15
+0.01 ...
+0.01 ...
–0.46 .71
+2.70 ...
–1.13 ...
+1.27 .02
+0.05 ...
–0.99 ...
–0.87 ...
–0.62 ...
–0.33 ...
–16.75 ...
+1.80 .06
–8.20 ...
–9.89 .10
–1.14 .23
–0.17 .25
+0.16 ...
–4.44 ...
–0.17.0625
–17.00 4.26
–0.09 ...
–5.111.275
–0.93 .15
–0.44 ...
–0.04 ...
–5.41 ...
–3.26 ...
–0.59 ...
–2.76 ...
–1.04 ...
–0.03 ...
+0.01 ...
+1.50.6425
E
9.34
17.00
12.65
12.34
24.72
10.25
1.35
21.13
18.37
34.56
16.80
80.98
18.10
26.04
18.94
52.23
24.80
12.46
11.93
4.00
25.78
10.57
2.98
6.49
22.93
13.00
225.22
143.47
5.89
24.39
4.75
33.88
11.69
1.73
29.74
62.06
58.46
221.53
11.50
30.76
20.44
25.34
23.90
260.98
115.42
300.98
122.58
36.67
56.35
18.44
81.45
6.57
824.86
4.57
338.00
22.01
7.41
5.81
149.91
121.55
20.70
35.55
13.47
12.55
11.47
65.39
52-Week
High
Low
18.86
10.50
8.16
11.49
13.49
3.92
11.10
24.34
44.37
35.94
25.39
155.84
11.65
112.75
11.52
32.73
24.62
9.73
Name
Tick
Sym Yld P/E
Last
Div
Chg. Amt.
5.36
5.53
1.88
7.07
7.94
1.33
10.19
16.15
34.05
25.17
10.45
87.94
1.52
64.61
4.17
14.63
2.21
7.70
EverQuote
EverspinTech
EVgo
Evolus
Evotec
Exagen
ExcelFinAcqnA
Exelixis
Exelon
ExlService
eXpWorld
Expedia
Expensify
Exponent
Exscientia
ExtremeNetworks
EyePointPharm
Ezcorp
EVER ...
MRAM ...
EVGO ...
EOLS ...
EVO ...
XGN ...
XFIN ...
EXEL ...
EXC 4.0
EXLS ...
EXPI 1.4
EXPE ...
EXFY ...
EXPO 1.2
EXAI ...
EXTR ...
EYPT ...
EZPW ...
dd
25
dd
dd
dd
dd
dd
83
17
28
cc
26
dd
44
dd
24
dd
20
11.41
9.11
3.09
10.45
9.74
1.91
10.75
23.24
36.31
29.63
14.48
146.32
2.05
86.33
6.06
17.13
20.40
8.58
–0.83 ...
+0.07 ...
–0.49 ...
–0.08 ...
–1.99 ...
–0.08 ...
+0.04 ...
–0.75 ...
+0.41 .36
–1.22 ...
–1.04 .05
–5.47 ...
–0.42 ...
–1.71 .26
–0.35 ...
–0.51 ...
–2.71 ...
–0.16 ...
10.30
127.05
1.00
1.04
52.45
10.06
19.19
2.35
0.28
7.17
0.48
5.19
1.75
45.70
1.63
10.23
0.01
0.33
35.51
22.11
13.84
2.96
10.28
10.27
0.07
7.61
11.90
26.00
22.33
22.82
8.59
16.26
24.57
505.84
22.55
17.23
22.84
31.00
9.70
9.24
15.08
9.68
20.81
24.52
21.77
9.94
129.22
38.77
12.56
13.40
12.85
85.30
122.68
144.57
1.27
51.01
17.74
14.14
15.45
14.70
9.28
18.65
10.05
1.35
2.84
23.15
55.97
22.27
44.12
24.93
60.09
1.07
10.13
9.44
28.67
26.20
49.12
79.40
2.25
5.40
45.13
12.22
21.45
11.65
3.19
0.98
FARO Tech
F5
FGFinancial
FLJ
FRP Holdings
FTACEmeraldA
FTAI Aviation
FTAI Infra
FTC Solar
Falcon'sBeyondGlbl
FangddNetwork
Fanhua
FarmerBros
Fastenal
FateTherap
FeutuneLightA
FeutuneLightRt
FibroGen
FidelityD&D
FifthThirdBncp
FinInstitutions
FinchTherap
FinnovateAcqnA
FintechEcoA
FintechEcoRt
FinWiseBancorp
FirstAdvantage
FirstBancorpNC
FirstBancorp
FirstBancshares
FirstBank
FirstBusey
FirstBusFinSvcs
FirstCitizBcshA
FirstCommBkshs
FirstFinBncpOH
FirstFinBkshs
FirstFinIN
FirstFinNW
FirstGuarBcshs
FirstHawaiian
FirstInternetBncp
FirstInterBanc
FirstMerchants
FirstMidBcshs
FirstNWBncp
FirstSolar
1stSource
FirstUnited
FirstWatchRest
FirstWesternFin
FirstCash
FirstService
FiveBelow
5EAdvMatls
Five9
FiveStarBncp
Flex
Flexsteel
FluenceEnergy
FlushingFinl
Flywire
FocusImpactBH3A
FocusUniversal
FoghornTherap
FormFactor
FormulaSys
ForresterRes
Fortinet
Fortrea
ForwardAir
Fossil
FosterLB
4D Molecular
FoxA
FoxB
FoxFactory
FranklinElec
FreightCarAmer
FrequencyElec
Freshpet
Freshworks
Frontdoor
FrontierComms
Frontier
FuelCell
FARO ...
FFIV ...
FGF ...
FLJ
...
FRPH ...
EMLD ...
FTAI ...
FIP 3.3
FTCI ...
FBYD ...
DUO ...
FANH ...
FARM ...
FAST 2.3
FATE ...
FLFV ...
FLFVR ...
FGEN ...
FDBC 2.8
FITB 4.0
FISI 5.5
FNCH ...
FNVT ...
FEXD ...
FEXDR ...
FINW ...
FA
.0
FBNC 2.4
FNLC 5.0
FBMS 3.4
FRBA 1.7
BUSE 3.9
FBIZ 2.4
FCNCA .5
FCBC 3.2
FFBC 4.0
FFIN 2.5
THFF 4.3
FFNW 3.8
FGBI 5.2
FHB 4.7
INBK 1.0
FIBK 6.2
FRME 3.8
FMBH 2.7
FNWB 1.8
FSLR ...
SRCE 2.6
FUNC 3.4
FWRG ...
MYFW ...
FCFS 1.3
FSV .6
FIVE ...
FEAM ...
FIVN ...
FSBC 2.9
FLEX ...
FLXS 3.3
FLNC ...
FFIC 5.3
FLYW ...
BHAC ...
FCUV ...
FHTX ...
FORM ...
FORTY 1.4
FORR ...
FTNT ...
FTRE ...
FWRD 1.5
FOSL ...
FSTR ...
FDMT ...
FOXA 1.7
FOX 1.9
FOXF ...
FELE 1.0
RAIL ...
FEIM .0
FRPT ...
FRSH ...
FTDR ...
FYBR ...
ULCC ...
FCEL ...
dd
26
7
...
cc
...
38
dd
dd
dd
...
7
dd
31
dd
93
...
dd
12
10
7
dd
67
cc
...
10
54
13
10
10
12
10
9
2
13
8
19
8
15
12
11
21
11
9
10
10
38
10
8
51
13
21
54
41
dd
dd
9
13
6
dd
15
dd
48
dd
dd
dd
16
cc
40
31
15
dd
dd
dd
15
14
17
22
dd
35
dd
dd
16
36
17
dd
20.60
171.45
1.46
1.15
59.12
10.58
46.00
3.64
.62
12.00
.66
6.54
3.12
61.98
3.77
10.85
.09
.75
53.87
35.40
21.74
3.45
11.08
10.75
.09
14.48
15.66
36.28
27.99
28.17
13.84
24.40
38.20
1384.23
36.15
23.03
28.68
41.94
13.82
12.26
22.10
24.75
30.19
36.18
33.76
15.50
166.87
52.68
23.30
18.65
18.62
106.28
159.12
200.84
1.40
72.28
25.48
23.29
18.33
21.50
16.51
21.85
10.43
1.48
5.64
37.66
65.03
25.09
58.34
32.90
62.45
1.45
22.29
19.59
30.14
28.10
66.36
92.71
2.65
10.28
84.47
21.91
33.03
24.67
5.06
1.40
–1.93 ...
–7.53 ...
–0.14 ...
–0.85 ...
–3.76 ...
+0.03 ...
–0.40 ...
–0.25 .03
–0.07 ...
–0.30 ...
–0.01 ...
–0.11 ...
+0.06 ...
–2.79 .38
+0.03 ...
+0.04 ...
+0.01 ...
–0.14 ...
–4.16 .38
+0.91 .35
+0.44 .30
–0.16 ...
+0.01 ...
–0.04 ...
–0.01 ...
+0.17 ...
–0.91 1.50
–0.73 .22
–0.23 .35
–1.16 .24
–0.86 .06
–0.42 .24
–1.90.2275
–34.74 1.64
–0.95 .29
–0.72 .23
–1.62 .18
–1.09 .45
+0.34 .13
+1.14 .16
–0.76 .26
+0.56 .06
–0.56 .47
–0.90 .34
–0.90 .23
–0.44 .07
–5.41 ...
–2.27 .34
–0.21 .20
–1.45 ...
–1.21 ...
–2.11 .35
–2.97 .225
–12.32 ...
–0.01 ...
–6.41 ...
–0.70 .20
+1.13 ...
–0.52 .15
–2.35 ...
+0.03 .22
–1.30 ...
–0.03 ...
+0.02 ...
–0.81 ...
–4.05 ...
–0.28.6215
–1.72 ...
–0.19 ...
–2.00 ...
–0.42 .24
–0.01 ...
+0.30 ...
–0.67 ...
+0.47 .26
+0.45 .26
–1.12 ...
–3.94 .225
–0.05 ...
–0.67 1.00
–2.29 ...
–1.58 ...
–2.19 ...
–0.67 ...
–0.40 ...
–0.20 ...
F
36.74
180.70
3.18
136.00
65.00
10.67
47.93
4.43
3.87
44.00
26.55
9.54
5.39
65.66
7.08
11.99
0.53
25.69
60.85
38.06
25.85
18.30
11.50
11.00
0.98
14.70
16.77
43.47
30.84
32.19
15.17
25.80
41.03
1528.12
39.23
26.53
38.24
46.15
15.40
24.08
28.28
28.18
39.76
43.97
35.83
16.12
232.00
56.59
24.29
20.95
28.00
116.83
166.27
220.19
12.04
92.40
29.00
23.98
24.96
31.32
20.46
35.80
12.09
5.14
9.97
42.38
82.55
39.09
81.24
37.30
121.38
6.08
23.05
24.10
37.26
34.42
127.54
107.36
3.94
11.41
89.06
24.98
38.97
30.83
14.10
4.36
January 8, 2024
NASDAQ ISSUES
D ATA
52-Week
High
Low
15.00
44.09
17.50
13.42
4.95
10.43
67.49
12.12
Name
Tick
Sym Yld P/E
Last
Div
Chg. Amt.
2.25
23.09
9.64
5.27
0.50
2.31
35.91
10.26
FulcrumTherap
FulgentGenetics
FultonFin
Funko
FusionFuelGreen
FusionPharm
Futu
FutureTechIIA
FULC
FLGT
FULT
FNKO
HTOO
FUSN
FUTU
FTII
...
...
4.3
...
...
...
...
...
dd
dd
9
dd
...
dd
13
54
7.53
28.18
15.96
7.19
1.13
8.35
51.51
10.90
+0.78 ...
–0.73 ...
–0.50 .17
–0.54 ...
+0.01 ...
–1.26 ...
–3.12 ...
+0.04 ...
6.56
1.90
7.67
57.73
6.60
5.05
13.59
1.08
39.25
1.45
2.11
2.00
31.86
0.50
0.09
8.50
0.22
43.54
6.43
15.45
1.16
0.86
2.08
2.89
27.74
25.77
38.21
4.07
24.85
1.68
44.98
4.79
10.29
4.51
72.87
26.24
8.87
10.84
12.11
13.35
10.08
0.05
19.59
10.04
0.15
10.09
0.02
10.27
9.34
48.12
10.21
1.11
9.33
2.33
19.62
30.38
6.89
10.14
0.14
12.27
4.14
9.86
31.49
2.41
9.90
0.45
2.65
1.40
99.65
1.59
7.51
1.59
4.75
45.39
22.85
11.72
1.55
0.45
8.41
6.50
6.80
1.14
25.71
2.89
50.23
20.67
2.95
1.15
GCM Grosvenor
GDEV
GDS Holdings
GE HealthCare
GEN Restaurant
GH Research
G-IIIApparel
G1Therapeutics
GRAVITY
GSI Tech
Gaia
GainTherap
Galapagos
Galecto
GaleraTherap
Gambling.com
GamidaCell
Gaming&Leisure
GarrettMotion
GenDigital
GeneDx
GenerationBio
Genetron
Genfit
Genmab
Gentex
Gentherm
GeospaceTech
GermanAmBncp
Geron
GibraltarInds
GigaCloudTech
GigCapital5
GilatSatellite
GileadSciences
GitLab
GladstoneCap
GladstoneComm
GladstoneInvt
GladstoneLand
GlblBlockchain
GlbBlockchainRt
Global-EOnline
GlobalLightsAcqn
GlobalLightsAcqnRt
GlobalStarA
GlobalStarRt
GlblTechAcqnI
GlobalWaterRscs
GlobalFoundries
GlobalinkInvt
GlycoMimetics
Gogo
Gogoro
GolarLNG
GoldenEnt
GoldenOcean
GoldenStarAcqn
GoldenStarAcqnRt
GolubCapital
GoodRx
Goodyear
GooseheadIns
GoPro
GoresIX A
GossamerBio
Grab
GracellBiotech
GrandCanyonEduc
GraphiteBio
GreatElmCap
GreatElm
GreatLakesDredge
GreatSouthernBncp
GreenPlains
GreenPlainsPtrs
GreenidgeGen
Greenlane
GreenlightCapRe
Grifols
GrindrodShipping
Gritstone
GroceryOutlet
Groupon
GrAeroportuario
GuardantHealth
GulfIslandFab
GulfResources
GCMG 5.2
GDEV ...
GDS ...
GEHC .2
GENK ...
GHRS ...
GIII
...
GTHX ...
GRVY ...
GSIT ...
GAIA ...
GANX ...
GLPG ...
GLTO ...
GRTX ...
GAMB ...
GMDA ...
GLPI 6.1
GTX ...
GEN 2.2
WGS ...
GBIO ...
GTH ...
GNFT ...
GMAB ...
GNTX 1.5
THRM ...
GEOS ...
GABC 3.1
GERN ...
ROCK ...
GCT ...
GIA ...
GILT ...
GILD 3.6
GTLB ...
GLAD 9.1
GOOD 9.2
GAIN 6.5
LAND 4.0
GBBK ...
GBBKR ...
GLBE ...
GLAC ...
GLACR ...
GLST ...
GLSTR ...
GTAC ...
GWRS 2.4
GFS ...
GLLI ...
GLYC ...
GOGO ...
GGR ...
GLNG 4.3
GDEN .0
GOGL 4.9
GODN ...
GODNR ...
GBDC 9.7
GDRX ...
GT
...
GSHD ...
GPRO ...
GHIX ...
GOSS ...
GRAB ...
GRCL ...
LOPE ...
GRPH ...
GECC12.7
GEG ...
GLDD ...
GSBC 2.8
GPRE ...
GPP 14.7
GREE ...
GNLN ...
GLRE ...
GRFS ...
GRIN 1.3
GRTS ...
GO
...
GRPN ...
OMAB ...
GH
...
GIFI ...
GURE ...
dd
dd
dd
23
31
dd
dd
dd
4
dd
dd
dd
dd
dd
dd
49
dd
18
dd
10
dd
dd
...
dd
34
19
91
15
11
dd
25
11
dd
24
18
dd
10
dd
7
dd
53
...
dd
...
...
85
...
28
39
22
72
dd
8
dd
42
4
17
...
...
10
cc
dd
cc
dd
cc
dd
dd
dd
19
dd
6
2
dd
10
dd
8
dd
dd
4
cc
dd
dd
33
dd
14
dd
dd
dd
8.53
2.21
7.75
76.62
8.00
5.37
31.63
2.91
68.44
2.47
2.75
3.75
41.30
.71
.15
9.26
.32
48.17
9.20
22.40
2.75
1.94
3.69
3.86
31.61
31.77
49.14
14.03
32.34
2.01
78.00
20.15
11.19
5.98
83.31
57.00
10.93
13.08
14.82
13.81
10.58
.12
37.35
10.13
.16
10.59
.12
10.91
12.67
56.04
10.98
2.80
9.35
2.40
23.09
39.09
10.18
10.43
.22
15.29
5.49
13.49
69.63
3.23
10.52
.85
3.27
10.03
122.82
2.76
11.00
1.88
7.77
58.00
24.53
12.38
6.33
.49
11.20
11.07
8.99
1.96
26.50
13.52
80.53
25.78
4.65
1.67
–0.43 .11
... ...
–1.37 ...
–0.70 .03
+0.17 ...
–0.43 ...
–2.35 ...
–0.14 ...
–1.12 ...
–0.17 ...
+0.05 ...
+0.49 ...
+0.65 ...
–0.01 ...
... ...
–0.49 ...
–0.09 ...
–1.18 .73
–0.47 ...
–0.42 .125
... ...
+0.29 ...
+0.01 ...
+0.01 ...
–0.23 ...
–0.89 .12
–3.22 ...
+1.07 ...
–0.07 .25
–0.10 ...
–0.98 ...
+1.86 ...
+0.20 ...
–0.13 ...
+2.30 .75
–5.96 ...
+0.23.0825
–0.16 .10
+0.67 .08
–0.64.0464
+0.03 ...
... ...
–2.28 ...
+0.05 ...
... ...
–0.01 ...
+0.01 ...
–0.44 ...
–0.41.0251
–4.56 ...
+0.14 ...
+0.44 ...
–0.78 ...
–0.18 ...
+0.10 .25
–0.842.00
+0.42 .10
+0.01 ...
+0.06 ...
+0.19 .37
–1.21 ...
–0.83 ...
–6.17 ...
–0.24 ...
+0.02 ...
–0.06 ...
–0.10 ...
–0.01 ...
–9.22 ...
+0.14 ...
+0.36 .10
–0.06 ...
+0.09 ...
–1.35 .40
–0.69 ...
–0.36 .455
–0.38 ...
–0.02 ...
–0.22 ...
–0.49 ...
–0.021.016
–0.08 ...
–0.46 ...
+0.68 ...
–4.10 ...
–1.27 ...
+0.32 ...
+0.02 ...
32.33
16.33
10.26
0.91
17.31
0.41
H&E Equipment
HBT Finl
HCM Acqn A
HCW Biologics
HMN Fin
Hookipa
HEES
HBT
HCMA
HCWB
HMNF
HOOK
11
10
cc
dd
15
dd
49.05
20.60
11.18
1.20
23.20
.75
–3.27 .275
–0.51 .17
... ...
–0.03 ...
+0.20 .08
–0.06 ...
For personal non-commercial use only. Do not edit or alter. Reproductions not permitted.
To reprint or license content, please contact Barron's reprints department at 800-843-0008 or www.djreprints.com
G
9.48
8.50
26.83
87.83
20.50
14.64
35.68
8.40
82.48
9.80
4.03
6.19
48.07
3.70
3.59
14.83
2.51
55.13
9.75
23.74
17.91
7.35
3.81
4.75
43.66
34.33
76.13
14.59
40.70
3.74
81.15
21.29
12.04
7.16
88.29
67.55
11.28
19.48
14.92
20.55
11.52
0.55
45.72
10.32
0.26
10.91
0.38
12.90
14.95
72.50
11.67
4.16
17.94
5.09
25.06
47.50
10.58
10.45
1.00
15.38
9.37
16.51
79.80
6.57
11.10
3.06
4.03
10.20
144.94
3.43
11.82
2.49
9.67
61.94
37.49
16.25
13.90
5.84
11.72
12.15
17.33
3.86
36.54
16.25
100.21
41.06
5.06
3.60
H
56.47
23.49
11.19
2.32
24.95
2.05
41
BARRON’S
2.2
3.3
...
...
1.3
...
52-Week
High
Low
21.28
53.52
24.82
22.14
56.49
116.98
54.38
25.51
20.61
14.48
18.43
55.59
28.25
14.24
6.29
73.58
37.31
14.71
73.47
25.78
60.85
15.87
15.97
76.62
27.69
18.17
51.00
35.15
143.68
11.54
10.15
11.47
89.72
13.31
30.51
20.48
30.36
75.38
30.15
19.09
10.28
8.70
311.18
27.26
87.88
44.00
30.15
30.79
1.76
3.75
217.22
27.15
13.81
16.43
10.84
1.03
13.73
20.22
31.00
104.67
10.71
1.07
27.10
2.08
5.60
209.21
15.62
30.41
113.31
22.75
2.27
3.28
7.50
2.35
Name
B A R R ON S .C OM / D ATA
Tick
Sym Yld P/E
Last
Div
Chg. Amt.
10.68
32.07
17.10
9.36
29.85
62.47
31.02
13.35
17.22
7.51
8.80
18.61
7.60
5.00
2.42
42.66
18.91
3.70
36.77
15.02
41.15
6.60
8.75
48.86
20.47
11.44
26.10
22.52
81.14
6.23
6.33
9.92
60.01
6.69
14.85
8.10
7.35
34.86
10.44
9.94
6.02
5.22
147.01
15.13
64.02
27.75
4.20
18.02
0.46
1.06
174.88
14.73
7.42
7.69
10.10
0.04
10.14
14.51
1.81
63.45
10.03
0.10
14.66
0.79
1.96
163.66
9.13
19.29
66.51
4.35
0.67
0.78
1.44
0.45
Hutchmed
H World
HackettGroup
HainCelestial
HalozymeTherap
HamiltonLane
HancockWhitney
HanmiFinancial
HanoverBancorp
HarborOneBncp
Harmonic
HarmonyBio
Harrow
Harte-Hanks
HarvardBioSci
Hasbro
HashiCorp
HawaiianHoldings
Hawkins
HawthornBcsh
HaynesIntl
HealthCatalyst
HealthcareSvcs
HealthEquity
HealthStream
HeartlandExp
HeartlandFinUSA
Heidrick&Strug
HelenofTroy
HelloGroup
HennessyAdvsrs
HennessyCapVI
HenrySchein
HeritageCommerce
HeritageFin
HertzGlobal
Hesai
Hibbett
HighPeakEner
HilleVax
HillmanSolns
HimaxTechs
HinghamSvg
HollysysAuto
Hologic
HomeBancorp
HomeStreet
HomeTrustBcshs
HomologyMed
Honest
Honeywell
HookerFurnishings
HopeBancorp
HorizonBancorp
HorizonSpaceI
HorizonSpaceI Rt
HorizonTechFin
HostHotels
HubCyberSecurity
HubGroup
HudsonAcqnI
HudsonAcqnIRt
HudsonGlobal
HuizeHolding
Humacyte
JBHunt
HuntingtonBcshs
Hurco
HuronConsulting
Hut8
Hydrofarm
Hyperfine
Hywin
HyzonMotors
HCM ...
HTHT 1.8
HCKT 2.0
HAIN ...
HALO ...
HLNE 1.7
HWC 2.6
HAFC 5.3
HNVR 2.3
HONE 2.5
HLIT ...
HRMY ...
HROW ...
HHS ...
HBIO ...
HAS 5.8
HCP ...
HA
...
HWKN 1.0
HWBK 2.7
HAYN 1.6
HCAT ...
HCSG ...
HQY ...
HSTM .4
HTLD .6
HTLF 3.2
HSII 2.2
HELE ...
MOMO .0
HNNA 7.6
HCVI ...
HSIC ...
HTBK 5.3
HFWA 4.3
HTZ ...
HSAI ...
HIBB 1.5
HPK .7
HLVX ...
HLMN ...
HIMX 7.8
HIFS 1.3
HOLI ...
HOLX ...
HBCP 2.4
HMST 3.9
HTBI 1.7
FIXX ...
HNST ...
HON 2.1
HOFT 3.8
HOPE 4.8
HBNC 4.5
HSPO ...
HSPOR ...
HRZN 9.7
HST 4.0
HUBC ...
HUBG ...
HUDA ...
HUDAR ...
HSON ...
HUIZ ...
HUMA ...
JBHT .9
HBAN 4.8
HURC 2.8
HURN ...
HUT ...
HYFM ...
HYPR ...
HYW ...
HYZN ...
dd
25
17
dd
19
35
8
6
9
16
cc
13
dd
2
dd
dd
dd
dd
20
13
17
dd
23
cc
62
43
8
10
20
5
12
79
22
8
9
3
dd
8
10
dd
dd
15
14
...
40
8
dd
9
dd
dd
25
dd
9
8
44
...
dd
19
...
13
dd
...
33
5
dd
26
9
35
25
dd
dd
dd
2
dd
16.46
33.67
21.99
10.79
35.12
107.81
46.60
18.90
17.51
12.03
12.52
31.98
10.54
7.11
4.86
48.38
21.85
13.85
66.23
24.87
55.07
9.54
10.06
67.95
26.16
13.63
37.64
27.31
115.98
6.60
7.28
10.48
73.90
9.74
20.63
9.54
8.09
67.77
14.19
15.19
8.73
6.05
199.99
26.45
72.95
41.30
10.19
26.35
.62
2.87
203.53
24.12
11.78
14.07
10.73
.11
13.62
19.83
2.13
88.41
10.55
.16
16.15
.80
2.61
189.97
13.00
22.75
99.42
11.90
.91
1.06
1.50
.76
–1.65 ...
+0.23 .31
–0.78 .11
–0.16 ...
–1.84 ...
–5.63.445
–1.99 .30
–0.50 .25
–0.13 .10
+0.05 .075
–0.52 ...
–0.32 ...
–0.66 ...
+0.32 ...
–0.49 ...
–2.68 .70
–1.79 ...
–0.35 ...
–4.19 .16
–0.50 .17
–1.98 .22
+0.28 ...
–0.31 ...
+1.65 ...
–0.87 .025
–0.63 .02
+0.03 .30
–2.22 .15
–4.83 ...
–0.35 .70
+0.57.1375
+0.03 ...
–1.81 ...
–0.18 .13
–0.76 .22
–0.85 ...
–0.82 ...
–4.25 .25
–0.05 .025
–0.86 ...
–0.48 ...
–0.02 .48
+5.59 .63
+0.10 ...
+1.50 ...
–0.71 .25
–0.11 .10
–0.57 .11
+0.01 ...
–0.43 ...
–6.18 1.08
–1.96 .23
–0.30 .14
–0.24 .16
... ...
... ...
+0.45 .11
+0.36 .25
–0.04 ...
–3.53 ...
–0.05 ...
... ...
+0.66 ...
–0.10 ...
–0.23 ...
–9.77 .42
+0.28 .155
+1.22 .16
–3.38 ...
–1.44 ...
–0.01 ...
–0.06 ...
–0.35 ...
–0.14 ...
41.39
11.45
94.53
78.28
13.29
372.50
35.82
3.81
1.16
0.65
0.82
83.00
17.87
10.00
15.00
22.26
1.36
181.92
4.75
1.78
1.02
89.00
5.94
3.70
0.95
1.21
42.21
3.61
0.94
14.05
IAC
IBEX
ICF Intl
ICU Medical
IDEAYA Bio
IdexxLab
IES Holdings
IGM Biosci
I-Mab
IN8bio
IO Biotech
IPG Photonics
i3Verticals
IXAcqnA
IcahnEnterprises
Ichor
iClickInteract
Icon
Icosavax
iHeartMedia
IkenaOncology
Illumina
Immersion
Immuneering
Immunic
ImmunityBio
Immunocore
Immunogen
ImmunoPrecise
Immunovant
IAC
...
IBEX ...
ICFI .4
ICUI ...
IDYA ...
IDXX ...
IESC ...
IGMS ...
IMAB ...
INAB ...
IOBT ...
IPGP ...
IIIV
...
IXAQ ...
IEP 33.8
ICHR ...
ICLK ...
ICLR ...
ICVX ...
IHRT ...
IKNA ...
ILMN ...
IMMR 2.0
IMRX ...
IMUX ...
IBRX ...
IMCR ...
IMGN ...
IPA
...
IMVT ...
dd
13
35
dd
dd
55
17
dd
...
dd
dd
56
dd
25
dd
dd
...
44
dd
dd
dd
dd
6
dd
dd
dd
dd
dd
dd
dd
52.00
17.25
128.95
97.62
34.30
537.36
76.84
10.11
2.13
1.39
1.96
101.82
20.28
11.00
17.74
32.29
3.90
270.72
15.61
2.44
1.82
130.48
6.89
6.52
1.39
4.41
66.55
29.65
1.47
42.78
–0.38 ...
–1.76 ...
–5.14 .14
–2.12 ...
–1.28 ...
–17.69 ...
–2.38 ...
+1.80 ...
+0.23 ...
+0.01 ...
+0.08 ...
–6.72 ...
–0.89 ...
–0.05 ...
+0.55 1.00
–1.34 ...
+0.07 ...
–12.35 ...
–0.15 ...
–0.23 ...
–0.15 ...
–8.76 ...
–0.17.045
–0.83 ...
–0.11 ...
–0.61 ...
–1.77 ...
... ...
–0.24 ...
+0.65 ...
I
69.85
31.40
145.40
212.43
36.51
568.30
86.44
27.92
7.67
3.95
3.30
141.85
30.84
12.15
54.48
39.73
5.40
288.50
16.11
9.01
7.64
238.55
9.25
14.29
3.17
6.93
72.99
29.96
5.47
44.85
52-Week
High
Low
3.90
144.90
71.85
12.68
10.73
86.29
83.16
26.99
65.22
26.50
4.98
7.80
7.25
10.40
5.87
14.00
99.65
39.50
48.25
3.97
15.36
125.87
8.15
9.00
16.86
26.11
7.33
1.30
10.79
186.16
32.00
39.20
335.91
50.46
60.69
20.88
51.28
47.48
3.00
5.95
161.17
95.59
8.50
4.00
111.79
13.00
54.72
7.54
74.17
631.07
136.00
358.07
6.82
22.20
4.50
11.39
11.31
167.84
4.71
54.18
9.36
7.99
140.23
3.48
68.34
9.69
51.49
12.66
11.51
23.00
79.99
31.01
Name
Tick
Sym Yld P/E
Last
Div
Chg. Amt.
1.50
48.39
47.81
0.80
10.14
50.27
43.28
14.90
28.81
14.38
1.65
2.82
1.14
10.07
3.97
2.45
73.38
14.31
18.57
1.81
2.99
91.74
5.04
6.11
10.64
4.13
1.58
0.17
10.10
103.21
16.04
3.15
125.82
25.56
33.44
8.71
24.73
22.67
1.56
1.37
102.15
70.83
0.75
0.99
57.48
6.51
39.10
3.07
42.01
370.62
2.09
222.65
2.22
9.07
3.02
10.30
10.34
127.71
0.98
32.69
3.21
3.94
70.24
1.31
34.21
1.23
28.23
8.07
10.13
8.20
50.35
20.35
Immutep
Impinj
InariMedical
IncannexHealthcare
InceptionGrowth
Incyte
IndependentBank
IndepBankMI
IndependentBank
Indivior
IndlLogistics
Infinera
InflaRx
InflectionPtIIA
InfoSvcs
InfraredCameras
InglesMarkets
Inhibrx
InMode
InnatePharma
Innodata
Innospec
InnovAge
InnovSolSuprt
Innoviva
Inogen
InozymePharma
Inseego
InsightAcqnA
InsightEnt
Insmed
Inspirato
Insulet
Intapp
IntegraLifeSci
IntegralAd
Intel
IntelliaTherap
Intellicheck
Inter
InterParfums
InteractiveBrkrs
InteractStrength
Intercure
InterDigital
Interface
IntlBcshs
Intevac
Intra-Cellular
Intuit
IntuitiveMachinesA
IntuitiveSurgical
Inventiva
Investar
InvestcpCredit
InvestcorpEur I A
InvestcorpIndiaA
InvestorsTitle
Invivyd
IonisPharm
IovanceBiotherap
iQIYI
iRhythmTechs
Iridex
IridiumComm
IrisEnergy
iRobot
IronwoodPharm
IsraelAcqns
iTeosTherap
Itron
IturanLocation
IMMP ...
PI
...
NARI ...
IXHL ...
IGTA ...
INCY ...
INDB 3.5
IBCP 3.6
IBTX 3.0
INDV ...
ILPT .9
INFN ...
IFRX ...
IPXX ...
III
3.9
MSAI ...
IMKTA .7
INBX ...
INMD ...
IPHA ...
INOD ...
IOSP 1.2
INNV ...
ISSC ...
INVA ...
INGN ...
INZY ...
INSG ...
INAQ ...
NSIT ...
INSM ...
ISPO ...
PODD ...
INTA ...
IART ...
IAS
...
INTC 1.1
NTLA ...
IDN ...
INTR ...
IPAR 1.9
IBKR .5
TRNR ...
INCR ...
IDCC 1.5
TILE .3
IBOC 2.4
IVAC ...
ITCI ...
INTU .6
LUNR ...
ISRG ...
IVA ...
ISTR 2.5
ICMB13.1
IVCB ...
IVCA ...
ITIC 1.2
IVVD ...
IONS ...
IOVA ...
IQ
...
IRTC ...
IRIX ...
IRDM 1.3
IREN ...
IRBT ...
IRWD ...
ISRL ...
ITOS ...
ITRI ...
ITRN 2.6
dd
dd
dd
dd
88
35
11
9
30
dd
dd
dd
dd
...
17
dd
8
dd
10
dd
dd
23
dd
24
38
dd
dd
dd
cc
24
dd
dd
cc
dd
34
cc
dd
dd
dd
60
27
16
dd
10
15
...
8
dd
dd
64
1
76
dd
7
dd
dd
34
13
dd
dd
dd
18
dd
dd
dd
...
dd
dd
50
dd
43
12
2.40
80.51
64.05
4.10
10.70
65.26
63.68
25.41
50.31
15.24
4.70
4.38
1.79
10.38
4.58
3.10
88.28
35.48
20.96
2.92
7.58
118.95
5.60
8.10
16.58
6.07
4.25
.20
10.74
173.82
29.35
3.85
197.87
35.07
42.06
14.17
46.89
28.63
1.67
5.48
133.89
87.92
.75
1.34
104.33
12.11
51.67
4.12
68.50
589.02
2.30
322.50
4.56
15.96
3.67
11.04
11.02
157.21
3.77
50.70
8.47
4.69
105.25
2.93
38.55
6.19
37.52
12.45
10.69
10.70
70.88
26.42
... ...
–9.52 ...
–0.87 ...
–0.54 ...
+0.04 ...
+2.47 ...
–2.13 .55
–0.61 .23
–0.57 .38
–0.03 ...
... .01
–0.37 ...
+0.16 ...
+0.05 ...
–0.13.045
–0.25 ...
+1.91 .165
–2.52 ...
–1.28 ...
+0.12 ...
–0.56 ...
–4.29 .72
–0.40 ...
–0.43 ...
+0.54 ...
+0.58 ...
–0.01 ...
–0.02 ...
–0.05 ...
–3.37 ...
–1.64 ...
+0.17 ...
–19.11 ...
–2.95 ...
–1.49 ...
–0.22 ...
–3.36 .125
–1.86 ...
–0.23 ...
–0.08 ...
–10.12 .625
+5.02 .10
–0.11 ...
+0.05 ...
–4.21 .40
–0.51 .01
–2.65 .63
–0.20 ...
–3.12 ...
–36.01 .90
–0.26 ...
–14.86 ...
+0.04 ...
+1.05 .10
+0.12 .03
+0.02 ...
+0.03 ...
–4.934.00
–0.17 ...
+0.11 ...
+0.34 ...
–0.19 ...
–1.79 ...
+0.12 ...
–2.61 .13
–0.96 ...
–1.18 ...
+1.01 ...
–0.05 ...
–0.25 ...
–4.63 ...
–0.82 .24
13.67
133.27
24.01
24.12
136.57
60.43
8.15
14.83
5.65
111.25
1.02
3.42
17.11
0.51
2.41
44.36
JakksPacific
J&JSnackFoods
JD.com
Joyy
JackHenry
JackintheBox
JamesRiver
JamfHolding
JanuxTherap
JazzPharm
Jet.AI
JetBlue
JFrog
JianzhiEduc
Jiayin
JohnsonOutdoors
JAKK
JJSF
JD
YY
JKHY
JACK
JRVR
JAMF
JANX
JAZZ
JTAI
JBLU
FROG
JZ
JFIN
JOUT
...
1.8
2.2
5.2
1.2
2.1
2.1
...
...
...
...
...
...
...
6.9
2.7
4
39
13
dd
34
13
6
dd
dd
cc
13
dd
dd
...
1
25
35.02
160.21
26.68
33.26
166.72
83.68
9.34
17.42
10.31
127.60
1.49
5.58
31.30
.68
5.48
48.50
–0.53 ...
–6.93 .735
–2.21 .62
–6.44 .20
+3.31 .52
+2.05 .44
+0.10 .05
–0.64 ...
–0.42 ...
+4.60 ...
+0.05 ...
+0.03 ...
–3.31 ...
–0.13 ...
+0.30 .38
–4.92 .33
355.88
7.70
4.30
10.34
0.02
53.67
1.53
6.26
4.08
2.22
13.13
12.54
158.38
0.62
KLA
KLX Energy
KVH Inds
KairousAcqn
KairousAcqnRt
KaiserAlum
Kaltura
KalVistaPharm
Kamada
KandiTech
Kanzhun
KaratPkg
KarunaTherap
KaryopharmTherap
KLAC 1.1
KLXE ...
KVHI ...
KACL ...
KACLR ...
KALU 4.8
KLTR ...
KALV ...
KMDA ...
KNDI ...
BZ
.0
KRT 2.5
KRTX ...
KPTI ...
24
4
dd
cc
...
80
dd
dd
47
dd
85
14
dd
dd
544.31
11.28
4.94
11.55
.09
64.66
1.68
11.37
5.95
2.89
15.23
23.74
316.25
.82
–36.99 1.45
+0.02 ...
–0.32 ...
+0.10 ...
+0.02 ...
–6.53 .77
–0.27 ...
–0.88 ...
–0.17 ...
+0.09 ...
–1.38 .18
–1.11 .20
–0.26 ...
–0.04 ...
J
36.84
177.71
65.41
43.20
184.19
99.56
24.92
22.89
23.64
160.83
17.50
9.45
35.35
2.35
8.19
71.88
K
597.43
17.19
12.10
11.92
0.55
94.55
2.27
13.00
6.35
4.27
26.26
26.69
318.75
4.87
52-Week
High
Low
28.75
10.51
10.99
22.43
21.70
7.24
59.96
36.56
30.30
7.53
7.44
71.16
31.43
10.13
20.65
8.17
4.06
2.24
9.80
31.94
42.80
21.42
16.22
2.84
60.20
15.86
110.00
39.85
Name
Tick
Sym Yld P/E
Last
Div
Chg. Amt.
8.26
6.45
10.14
15.23
14.86
3.76
27.02
27.66
14.56
3.72
0.67
50.89
19.52
3.10
10.29
1.04
1.40
0.36
1.37
13.29
30.68
10.24
10.74
0.73
40.20
7.41
37.97
9.60
Katapult
KearnyFinancial
KeenVisionAcqn
KellyServices A
KellyServicesB
KY FirstFedBncp
KerosTherap
KeurigDrPepper
KewauneeSci
KeyTronic
KezarLifeSci
Kforce
KimballElec
KingsoftCloud
KiniksaPharm
KinnateBio
Kirkland's
Knightscope
KodiakSciences
KornitDigital
KraftHeinz
KratosDefense
KrispyKreme
KronosBio
Kulicke&Soffa
KuraOncology
KuraSushiUSA
KymeraTherap
KPLT ...
KRNY 5.1
KVAC ...
KELYA 1.5
KELYB 1.4
KFFB 9.9
KROS ...
KDP 2.7
KEQU ...
KTCC ...
KZR ...
KFRC 2.3
KE
...
KC
...
KNSA ...
KNTE ...
KIRK ...
KSCP ...
KOD ...
KRNT ...
KHC 4.2
KTOS ...
DNUT 1.0
KRON ...
KLIC 1.6
KURA ...
KRUS ...
KYMR ...
dd
16
dd
32
34
86
dd
23
12
11
dd
24
11
dd
dd
dd
dd
dd
dd
dd
16
dd
dd
dd
51
dd
cc
dd
10.10
8.68
10.35
20.43
21.70
4.06
48.19
31.97
29.43
4.20
.92
63.06
25.16
3.18
18.31
2.41
3.00
.64
3.01
16.68
37.94
18.30
14.18
1.16
50.81
15.00
87.77
27.18
–0.79 ...
–0.29 .11
+0.02 ...
–1.19 .075
+0.05 .075
–0.37 .10
+8.43 ...
–1.35 .215
+0.36 ...
–0.12 ...
–0.03 ...
–4.50 .36
–1.79 ...
–0.60 ...
+0.77 ...
+0.04 ...
–0.02 ...
+0.04 ...
–0.03 ...
–2.48 ...
+0.96 .40
–1.99 ...
–0.91 .035
–0.09 ...
–3.91 .20
+0.62 ...
+11.77 ...
+1.72 ...
1.13
84.16
41.49
179.00
11.44
9.51
10.65
43.05
10.60
10.17
420.36
77.21
158.88
15.70
161.13
47.46
2.63
1.86
2.18
2.04
51.96
9.58
4.72
4.52
1.76
7.56
17.67
6.89
42.91
44.02
10.12
10.80
3.10
4.39
9.00
0.92
1.62
19.81
1.33
70.01
70.36
15.01
16.27
6.36
6.41
55.08
29.48
60.95
29.63
22.01
22.19
22.24
10.23
1.52
1.14
4.44
4.31
5.26
49.24
53.77
0.37
12.35
5.05
149.85
307.57
11.97
212.80
40.26
2.33
0.40
18.53
50.26
3.60
1.85
1.22
14.18
LavaTherap
LGI Homes
LKQ
LPL Financial
LSI Inds
LakeShoreBancorp
LakelandBcp
LakelandFin
LakelandInds
LakeshoreAcqnII
LamResearch
LamarAdv
LancasterColony
LandmarkBncp
LandstarSystem
Lantheus
LanzaTechGlobal
Largo
LarimarTherap
Latham
LatticeSemi
LaureateEduc
Lavoro
LeadRealEstate
LeddarTech
LeeEnterprises
LegacyHousing
LegalZoom
LegendBiotech
LeMaitreVascular
LendingTree
LeonardoDRS
LesakaTech
Leslie's
LexeoTherap
LexiconPharm
LexinFintech
LiAuto
LianBio
LibertyBroadbandA
LibertyBroadbandC
LibertyGlobalA
LibertyGlobalC
LibertyLatAmA
LibertyLatAmC
LibertyFormOne A
LibertyLiveA
LibertyFormOne C
LibertyLiveC
LibertySirius A
LibertySirius B
LibertySirius C
LibertyRscsA
LifecoreBiomed
LifeMD
LifeStanceHealth
LifetimeBrands
LifewayFoods
LigandPharm
Light&Wonder
Lilium
Limoneira
LincolnEduc
LincolnElectric
Linde
LiquiditySvcs
Littelfuse
LivaNova
LivePerson
LixiangEduc
LoganRidgeFin
LogitechIntl
LongboardPharm
LoopIndustries
Lottery.com
Lovesac
LVTX ...
LGIH ...
LKQ 2.5
LPLA .5
LYTS 1.5
LSBK ...
LBAI 4.1
LKFN 2.9
LAKE .7
LBBB ...
LRCX 1.1
LAMR 4.9
LANC 2.2
LARK 4.0
LSTR .7
LNTH ...
LNZA ...
LGO ...
LRMR ...
SWIM ...
LSCC ...
LAUR .0
LVRO ...
LRE ...
LDTC ...
LEE ...
LEGH ...
LZ
...
LEGN ...
LMAT 1.0
TREE ...
DRS ...
LSAK ...
LESL ...
LXEO ...
LXRX ...
LX 5.5
LI
...
LIAN ...
LBRDA ...
LBRDK ...
LBTYA ...
LBTYK ...
LILA ...
LILAK ...
FWONA ...
LLYVA ...
FWONK ...
LLYVK ...
LSXMA ...
LSXMB ...
LSXMK ...
LIBY ...
LFCR ...
LFMD ...
LFST ...
LCUT 2.6
LWAY ...
LGND ...
LNW ...
LILM ...
LMNR 1.6
LINC ...
LECO 1.3
LIN 1.2
LQDT ...
LFUS 1.0
LIVN ...
LPSN ...
LXEH ...
LRFC 4.2
LOGI 1.3
LBPH ...
LOOP ...
LTRY ...
LOVE ...
dd
16
13
16
14
13
10
18
20
48
25
25
38
10
22
45
dd
dd
dd
dd
43
20
dd
19
dd
dd
9
cc
dd
44
dd
30
dd
47
...
dd
2
41
dd
17
17
dd
dd
8
8
30
...
33
...
16
16
16
cc
dd
dd
dd
dd
27
85
56
...
42
10
25
34
25
20
cc
dd
dd
dd
39
dd
dd
dd
20
1.80
125.43
47.12
234.55
13.44
12.16
14.24
63.23
17.30
11.10
732.40
102.42
163.11
19.83
184.50
64.49
4.56
2.34
4.68
2.43
64.59
13.01
8.31
5.49
2.83
8.00
24.13
10.40
56.44
54.00
28.55
18.88
3.54
6.85
14.48
1.48
1.84
34.16
4.17
76.90
77.01
17.81
18.82
6.99
7.03
56.44
35.11
62.24
35.50
30.27
30.33
30.20
11.00
7.11
5.45
7.50
6.48
14.33
70.83
77.60
1.02
19.13
9.09
211.23
409.12
16.65
252.26
48.80
3.67
2.65
23.08
92.56
25.20
3.50
3.13
25.16
+0.22 ...
–7.73 ...
–0.67 .30
+6.93 .30
–0.64 .05
+0.45 ...
–0.55 .145
–1.93 .46
–1.24 .03
+0.10 ...
–50.862.00
–3.86 1.25
–3.28 .90
+0.03 .20
–9.152.00
+2.49 ...
–0.47 ...
+0.03 ...
+0.13 ...
–0.20 ...
–4.40 ...
–0.70 .70
–0.31 ...
–0.25 ...
+0.27 ...
+0.13 ...
–1.09 ...
–0.90 ...
–3.73 ...
–2.76 .14
–1.77 ...
–1.16 ...
+0.30 ...
–0.06 ...
+1.06 ...
–0.05 ...
... .116
–3.27 ...
–0.30 ...
–3.74 ...
–3.58 ...
+0.04 ...
+0.18 ...
–0.32 ...
–0.31 ...
–1.54 ...
–1.44 ...
–0.89 ...
–1.89 ...
+1.53 ...
+1.55 ...
+1.42 ...
+0.04 ...
+0.92 ...
–2.84 ...
–0.33 ...
–0.23.0425
+0.92 ...
–0.59 ...
–4.51 ...
–0.16 ...
–1.50 .075
–0.95 ...
–6.23 .71
–1.591.275
–0.56 ...
–15.30 .65
–2.94 ...
–0.12 ...
+0.45 ...
+0.47 .30
–2.501.1805
+19.17 ...
–0.28 ...
+0.42 ...
–0.39 ...
L
4.00
141.91
59.38
257.65
16.97
13.15
20.02
77.07
19.66
11.76
801.29
112.34
220.65
23.98
208.62
100.85
10.80
7.06
6.85
4.77
98.30
14.81
15.82
7.35
9.99
23.51
25.73
15.68
77.32
68.67
47.82
20.95
4.89
17.13
17.72
3.79
3.86
47.33
4.78
97.05
96.88
22.09
22.78
10.01
9.98
69.48
37.03
78.58
39.00
30.68
30.33
30.66
11.06
11.46
9.11
9.59
8.63
17.33
85.70
89.02
1.90
21.62
10.35
221.14
434.21
21.10
309.94
59.86
18.17
8.04
25.00
95.49
26.50
4.70
16.60
30.94
52-Week
High
Low
Name
17.81 3.62 Lucid
4.04 1.44 Lulu'sFashion
516.39 286.58 lululemon
65.16 35.35 Lumentum
10.55 2.30 LuminarTech
1.33 0.03 LumiraDx
4.55 2.63 LumosPharma
12.27 7.73 LutherBurbank
3.97 1.32 LyellImmuno
18.36 7.85 Lyft
5.75 1.86 LyraTherap
Tick
Sym Yld P/E
LCID
LVLU
LULU
LITE
LAZR
LMDX
LUMO
LBC
LYEL
LYFT
LYRA
Last
Div
Chg. Amt.
...
...
...
...
...
...
...
...
...
...
...
dd
dd
62
dd
dd
dd
dd
14
dd
dd
dd
3.78
1.97
491.10
50.47
3.27
.03
3.20
10.15
2.04
12.81
5.26
–0.43
+0.11
–20.19
–1.95
–0.10
–0.03
+0.02
–0.56
+0.10
–2.18
+0.02
...
...
...
...
...
...
...
...
...
...
...
MTSI ...
MGEE 2.4
MGPI .5
MKSI .9
LIFW ...
MYRG ...
MCBC 3.3
MGNX ...
MDGL ...
MGIC 6.7
MGNI ...
MGYR 1.1
MMYT ...
MBUU ...
TUSK ...
MANH ...
MTEX .0
MNKD ...
CART ...
MRVI ...
MCHX ...
MRNS ...
MKTX 1.0
MKTW 1.6
MQ
...
MAR .9
MARX ...
MARXR ...
MRTN 1.2
MMLP .8
MRVL .4
MASI ...
MCFT ...
MTCH ...
MTLS ...
MTRX ...
MAT ...
MTTR ...
MATW 2.7
MXCT ...
MAXN ...
MXL ...
MGRC 1.7
MFIN 4.0
MNOV ...
MDWD ...
MEDP ...
MHUA ...
MGTX ...
MLCO ...
MELI ...
MBWM 3.4
MERC 3.3
MRCY ...
MRBK 3.7
MMSI ...
MACK ...
MRSN ...
MRUS ...
MESA ...
MLAB .6
MESO ...
META ...
MSSAR ...
MEOH 1.6
MCBS 3.1
MCHP 2.1
MU
.6
MSFT .8
MSTR ...
MVST ...
MVIS ...
MPB 3.3
MFIC11.0
MIDD ...
MSEX 2.1
MSBI 4.4
MOFG 3.7
MIST ...
MLKN 2.9
TIGO ...
MNDO12.0
MNMD ...
MLYS ...
MRTX ...
MIRM ...
AVO ...
MBLY ...
MOBX ...
MRNA ...
MODV ...
MOLN ...
MNTS ...
64
22
21
dd
dd
26
8
12
dd
13
dd
10
cc
12
28
75
dd
dd
dd
36
dd
dd
42
12
dd
24
55
...
19
dd
dd
68
6
21
cc
dd
79
dd
28
dd
dd
dd
23
4
dd
dd
35
4
dd
dd
79
8
dd
dd
9
44
dd
dd
dd
dd
dd
dd
31
...
18
11
18
dd
36
cc
dd
dd
9
10
16
33
7
12
dd
39
86
8
dd
dd
dd
dd
dd
dd
dd
dd
dd
dd
dd
81.83
71.60
93.21
97.96
2.05
139.23
10.94
9.77
220.28
9.83
8.90
11.60
44.88
52.33
4.39
199.37
8.78
3.64
22.43
6.54
1.29
10.84
276.17
2.51
6.25
222.42
10.65
.20
19.90
2.47
59.92
111.62
22.19
36.68
6.07
9.88
18.18
2.35
35.04
4.60
5.93
21.69
112.66
9.93
1.54
11.47
294.97
1.17
6.30
9.03
1538.83
39.65
9.00
33.42
13.60
75.36
13.25
2.27
28.52
.96
98.93
1.05
351.95
.17
46.58
23.55
83.99
83.45
367.75
631.08
1.29
2.66
23.97
13.83
137.97
60.92
27.27
26.03
1.72
25.98
18.94
2.00
4.09
8.65
59.10
28.85
10.02
30.49
3.98
111.12
41.69
4.25
1.42
–11.12 ...
–0.71.4275
–5.31 .12
–4.91 .22
–0.22 ...
–5.40 ...
–0.34 .09
+0.15 ...
–11.10 ...
+0.14 .327
–0.44 ...
+0.38 .07
–2.10 ...
–2.49 ...
–0.07 ...
–15.95 ...
+0.68 .20
... ...
–1.04 ...
–0.01 ...
–0.07 ...
–0.03 ...
–16.68 .72
–0.22 .01
–0.73 ...
–3.09 .52
+0.02 ...
–0.02 ...
–1.08 .06
+0.07.005
–0.39 .06
–5.59 ...
–0.45 ...
+0.18 ...
–0.50 ...
+0.10 ...
–0.70 ...
–0.34 ...
–1.61 .24
–0.10 ...
–1.24 ...
–2.08 ...
–6.96 .465
+0.08 .10
+0.04 ...
+1.30 ...
–11.56 ...
–0.31 ...
–0.72 ...
+0.16 ...
–32.71 ...
–0.73 .34
–0.48 .075
–3.15 ...
–0.30 .125
–0.60 ...
–0.16 ...
–0.05 ...
+1.02 ...
–0.05 ...
–5.84 .16
–0.05 ...
–2.01 ...
+0.08 ...
–0.78 .185
–0.47 .18
–6.19 .439
–1.89 .115
–8.29 .75
–0.54 ...
–0.11 ...
... ...
–0.31 .20
+0.15 .38
–9.20 ...
–4.70 .325
–0.29 .30
–0.88.2425
+0.05 ...
–0.70.1875
+0.94 ...
+0.04 .24
+0.43 ...
+0.05 ...
+0.35 ...
–0.67 ...
–0.07 ...
–12.83 ...
–0.04 ...
+11.67 ...
–2.30 ...
+0.07 ...
–0.31 ...
M
96.09
83.27
124.96
114.15
40.00
156.63
11.91
10.74
322.67
17.50
15.73
13.25
48.50
65.45
8.27
230.61
21.23
5.75
42.95
16.90
2.21
11.25
399.78
3.62
7.51
227.18
11.00
0.34
23.38
3.35
67.99
198.00
35.29
54.60
11.42
12.99
22.64
4.07
48.86
6.02
38.91
43.66
122.83
10.49
2.66
14.58
317.57
45.49
8.77
14.46
1660.00
41.93
13.25
59.13
16.68
85.62
13.52
9.62
29.64
3.82
206.36
5.12
361.90
0.22
54.83
26.23
94.30
87.87
384.30
727.77
2.91
8.20
32.61
14.03
162.02
90.56
28.47
34.16
4.49
31.33
21.15
2.50
5.01
21.98
64.41
35.56
13.99
48.11
12.50
207.51
113.53
7.36
79.50
48.53
65.10
82.60
63.44
1.05
94.40
6.96
4.29
119.76
8.15
6.28
9.00
22.50
42.07
3.41
113.43
7.50
3.30
22.13
4.52
1.22
4.31
200.01
1.24
3.46
150.03
10.15
0.14
17.34
1.95
33.75
75.22
19.25
27.85
4.93
4.58
15.36
1.84
33.75
2.45
3.91
13.43
85.63
5.64
1.38
7.10
167.00
1.12
3.49
6.80
847.01
23.89
7.37
28.90
7.80
62.58
11.09
0.80
14.08
0.40
82.86
0.97
126.04
0.07
38.18
13.10
68.75
52.76
219.35
147.10
0.84
1.82
18.25
10.39
109.59
60.19
17.98
17.80
1.59
13.20
13.31
1.82
2.41
5.85
27.30
18.46
8.19
28.19
2.68
62.55
26.05
3.53
1.03
Macom Tech
MGE Energy
MGP Ingredients
MKS Instrum
MSP Recovery
MYR Group
Macatawa
Macrogenics
MadrigalPharm
MagicSoftware
Magnite
MagyarBancorp
MakeMyTrip
MalibuBoats
MammothEnergy
ManhattanAssoc
Mannatech
MannKind
Maplebear
MaravaiLifeSci
Marchex
MarinusPharm
MarketAxess
MarketWise
Marqeta
Marriott
MarsAcqn
MarsAcqnRt
MartenTransport
MartinMidstream
MarvellTech
Masimo
MasterCraftBoat
MatchGroup
Materialise
MatrixService
Mattel
Matterport
MatthewsIntl
MaxCyte
MaxeonSolar
MaxLinear
McGrathRent
MedallionFinl
MediciNova
MediWound
Medpace
MeihuaIntlMed
MeiraGTx
MelcoResorts
MercadoLibre
MercantileBank
MercerIntl
MercurySystems
Meridian
MeritMedical
MerrimackPharm
MersanaTherap
Merus
MesaAir
MesaLabs
Mesoblast
MetaPlatforms
MetalSkyStarRt
Methanex
MetroCityBkshs
MicrochipTech
MicronTech
Microsoft
MicroStrategy
Microvast
MicroVision
MidPennBancorp
MidCapFin
Middleby
MiddlesexWater
MidlandStBncp
MidWestOneFin
MilestonePharm
MillerKnoll
MillicomIntl
Mind CTI
MindMed
MineralysTherap
MiratiTherap
MirumPharm
MissionProduce
Mobileye
MobixLabs
Moderna
ModivCare
MolecularPtrs
Momentus
42
BARRON’S
NASDAQ ISSUES
D ATA
52-Week
High
Low
83.42
199.68
14.25
78.59
10.43
442.84
647.12
55.70
60.47
8.83
10.89
0.30
289.17
63.08
10.51
15.87
11.32
10.76
17.00
7.60
24.21
Name
Tick
Sym Yld P/E
Last
Div
Chg. Amt.
56.25
94.76
2.04
60.75
0.74
164.59
345.70
22.72
47.13
2.44
10.05
0.02
163.28
19.35
3.52
4.26
10.39
0.32
3.23
3.01
13.82
MonarchCasino
monday.com
Mondee
Mondelez
MoneyHero
MongoDB
MonolithicPower
Monro
MonsterBev
MonteRosaTherap
MontereyCapA
MontereyCapRt
Morningstar
Morphic
MorphoSys
MotorcarParts
MountainI A
Movella
MuralOncology
Mynaric
MyriadGenetics
MCRI
MNDY
MOND
MDLZ
MNY
MDB
MPWR
MNRO
MNST
GLUE
MCAC
MCACR
MORN
MORF
MOR
MPAA
MCAA
MVLA
MURA
MYNA
MYGN
1.8
...
...
2.3
...
...
.7
4.1
...
...
...
...
.6
...
...
...
...
...
...
...
...
15
dd
dd
22
dd
dd
62
26
39
dd
dd
...
cc
dd
17
dd
50
dd
...
dd
dd
65.12
176.79
2.19
73.09
1.41
365.39
573.99
27.65
57.54
5.53
10.89
.10
272.88
27.30
9.65
9.84
11.32
.62
5.74
5.61
17.59
–4.03 .30
–11.02 ...
–0.56 ...
+0.66 .425
–0.31 ...
–43.46 ...
–56.79 1.00
–1.69 .28
–0.07 ...
–0.13 ...
+0.03 ...
–0.02 ...
–13.36.405
–1.58 ...
–0.25 ...
+0.50 ...
+0.02 ...
+0.02 ...
–0.18 ...
–0.23 ...
–1.55 ...
17.76
27.53
0.60
149.54
19.20
0.97
0.22
89.30
153.89
10.12
0.97
4.89
1.75
0.47
46.88
35.02
61.35
42.09
1.01
38.06
13.71
225.02
5.06
1.60
14.10
3.53
16.38
19.58
10.85
14.44
6.38
59.73
76.85
285.33
10.40
19.74
9.35
89.04
9.80
1.03
1.56
25.06
11.27
10.21
7.23
5.63
8.20
6.50
5.07
15.58
15.73
10.75
132.30
0.36
0.98
28.24
4.37
0.52
1.49
4.85
10.08
0.14
1.94
1.28
2.71
8.13
0.16
1.96
202.57
33.15
10.08
62.44
8.39
33.29
0.06
9.80
25.58
45.97
23.00
83.04
111.20
4.77
10.87
Napco Security
NBT Bancorp
NGM Biopharm
NICE
NMI Holdings
NN
NRX Pharm
NV5Global
NXP Semicon
NaborsEnerIIA
NanoLabs
NanoXImaging
Nanobiotix
NanoStringTech
Nasdaq
Natera
Nathan's
NationalBeverage
NatlCineMedia
NatlResearch
NationalVision
NatlWesternLife
NaturalAlt
NautilusBiotech
Navient
NavitasSemi
Nayax
nCino
NeoGames
Neogen
NerdWallet
NetApp
NetEase
Netflix
Netgear
NetScout
NeumoraTherap
Neurocrine
Neurogene
Neuronetics
NeuroPace
NewFortressEner
NewMtnFin
NewProvidenceII A
NY Mortgage
NewAmstPharma
NewcourtAcqnA
NewellBrands
Newmark
NewsCorp A
NewsCorp B
NewtekOne
NexstarMedia
Next.e.GO
NextCure
Nextracker
NicholasFin
Nikola
9F
908Devices
99Acqn
99AcqnRt
NiuTech
Nkarta
NKGenBiotech
nLIGHT
noco-noco
Noodles
Nordson
NortheastBank
NorthernTechsIntl
NorthernTrust
NorthfieldBanc
NorthrimBanCorp
NorthViewRt
NorthwestBcshs
NorthwestPipe
NorthWesternEner
NorwoodFin
Nova
Novanta
Novavax
Novocure
NSSC 1.0
NBTB 3.2
NGM ...
NICE ...
NMIH ...
NNBR ...
NRXP ...
NVEE ...
NXPI 2.0
NETD ...
NA
...
NNOX ...
NBTX ...
NSTG ...
NDAQ 1.6
NTRA ...
NATH 2.7
FIZZ ...
NCMI ...
NRC 1.3
EYE ...
NWLI .1
NAII ...
NAUT ...
NAVI 3.5
NVTS ...
NYAX ...
NCNO ...
NGMS ...
NEOG ...
NRDS ...
NTAP 2.4
NTES 1.9
NFLX ...
NTGR ...
NTCT ...
NMRA ...
NBIX ...
NGNE ...
STIM ...
NPCE ...
NFE 1.1
NMFC 9.9
NPAB ...
NYMT 9.7
NAMS ...
NCAC ...
NWL 3.3
NMRK 1.2
NWSA .8
NWS .8
NEWT 5.5
NXST 3.4
EGOX ...
NXTC ...
NXT ...
NICK ...
NKLA ...
JFU ...
MASS ...
NNAG ...
NNAGR ...
NIU ...
NKTX ...
NKGN ...
LASR ...
NCNC ...
NDLS ...
NDSN 1.1
NBN .1
NTIC 2.4
NTRS 3.6
NFBK 4.2
NRIM 4.4
NVACR ...
NWBI 6.4
NWPX ...
NWE 5.0
NWFL 3.8
NVMI ...
NOVT ...
NVAX ...
NVCR ...
35
14
dd
39
8
dd
dd
37
19
...
...
dd
dd
dd
25
dd
16
29
1
33
dd
14
47
dd
6
dd
dd
dd
dd
dd
dd
26
16
47
dd
23
...
71
dd
dd
dd
19
11
65
dd
...
dd
dd
cc
cc
cc
13
14
dd
dd
22
dd
dd
...
dd
cc
...
dd
dd
dd
dd
3
dd
30
8
39
16
13
11
...
11
12
17
11
31
73
dd
dd
32.94
40.50
1.34
194.60
29.51
4.14
.42
102.09
205.72
10.42
1.68
6.19
7.65
.54
55.67
62.23
74.80
51.42
4.13
38.13
20.14
482.80
6.07
3.05
18.23
6.93
20.25
33.62
28.07
19.45
13.33
85.07
91.19
474.06
14.09
20.88
15.94
132.48
22.95
2.99
10.94
36.39
12.88
10.62
8.25
12.63
10.49
8.41
10.13
24.43
25.58
13.14
160.12
.43
1.20
41.99
7.00
.77
3.27
8.58
10.20
.17
2.08
6.06
2.75
12.71
.16
2.91
249.73
54.04
11.88
83.47
12.29
54.35
.11
12.42
28.54
50.77
31.50
129.32
153.88
5.00
13.31
–1.31 .08
–1.41 .32
+0.48 ...
–4.91 ...
–0.17 ...
+0.14 ...
–0.04 ...
–9.03 ...
–23.961.014
+0.02 ...
–0.13 ...
–0.18 ...
+0.37 ...
–0.21 ...
–2.47 .22
–0.41 ...
–3.22 .50
+1.70 ...
–0.01 ...
–1.43 .12
–0.79 ...
–0.22 .36
–0.46 ...
+0.06 ...
–0.39 .16
–1.14 ...
+1.20 ...
–0.01 ...
–0.56 ...
–0.66 ...
–1.39 ...
–3.09 .50
–1.97 .495
–12.82 ...
–0.49 ...
–1.07 ...
–1.11 ...
+0.72 ...
+3.57 ...
+0.09 ...
+0.63 ...
–1.34 .10
+0.16 .10
–0.01 ...
–0.28 .20
+1.46 ...
+1.25 ...
–0.27 .07
–0.83 .03
–0.12 .10
–0.14 .10
–0.66 .18
+3.37 1.35
–0.04 ...
+0.06 ...
–4.86 ...
+0.10 ...
–0.10 ...
–0.16 ...
–2.64 ...
+0.01 ...
+0.02 ...
–0.11 ...
–0.54 ...
... ...
–0.79 ...
–0.02 ...
–0.24 ...
–14.43 .68
–1.15 .01
+0.09 .07
–0.91 .75
–0.29 .13
–2.86 .60
+0.02 ...
–0.06 .20
–1.72 ...
–0.12 .64
–1.41 .30
–8.07 ...
–14.53 ...
+0.20 ...
–1.62 ...
For personal non-commercial use only. Do not edit or alter. Reproductions not permitted.
To reprint or license content, please contact Barron's reprints department at 800-843-0008 or www.djreprints.com
N
41.25
45.02
5.68
231.54
30.39
4.45
1.41
142.23
238.27
11.00
2.97
22.69
11.00
13.20
63.90
63.94
83.00
55.12
6.49
47.60
43.82
488.90
10.12
4.65
19.69
11.17
25.38
34.80
28.64
24.10
21.74
91.78
118.90
500.89
20.90
36.24
19.30
134.28
23.02
6.95
11.25
42.17
13.23
11.67
12.96
18.70
14.55
16.76
11.23
24.81
26.00
20.83
217.76
2.24
1.92
49.82
8.57
3.71
5.51
12.51
10.53
0.25
5.99
7.05
12.88
15.91
11.42
6.55
265.99
59.00
13.91
100.25
16.02
59.90
0.18
14.64
40.60
61.24
34.72
138.50
187.61
13.70
116.22
January 8, 2024
52-Week
High
Low
5.72
13.85
10.99
13.99
47.83
80.94
43.81
505.48
10.34
Name
B A R R ON S .C OM / D ATA
Tick
Sym Yld P/E
Last
Div
Chg. Amt.
1.57
5.49
2.00
4.22
23.35
23.10
13.32
140.34
4.10
Novonix
NubiaBrandA
Nukkleus
NurixTherap
Nutanix
Nuvalent
Nuvei
NVIDIA
Nyxoah
NVX
NUBI
NUKK
NRIX
NTNX
NUVL
NVEI
NVDA
NYXH
...
...
...
...
...
...
1.6
.0
...
dd
82
dd
dd
dd
dd
dd
65
dd
1.86
6.10
2.05
9.87
45.86
72.35
24.67
490.97
4.67
–0.08 ...
–1.60 ...
–0.82 ...
–0.45 ...
–1.83 ...
–1.24 ...
–1.59 .10
–4.25 .04
+0.03 ...
24.12
39.36
59.75
7.50
0.85
767.27
78.94
17.70
0.44
12.01
2.00
6.26
3.75
21.67
62.40
1.35
284.81
11.66
10.79
2.73
14.10
49.24
32.89
63.43
1.30
0.92
3.07
28.72
5.98
3.72
1.19
3.45
0.68
21.78
10.05
4.89
29.40
1.03
5.99
2.13
1.60
2.26
0.90
24.23
4.38
4.26
0.97
4.09
9.57
23.10
58.98
3.34
2.90
1.80
4.41
2.60
OddityTech
ODP
ON Semi
OP Bancorp
OPKO Health
OReillyAuto
OSI Systems
OaktreeSpec
Oatly
OceanFirstFin
OcularTherapeutix
Oculis
OfficePropIncm
OhioValleyBanc
Okta
Olaplex
OldDomFreight
OldNatlBncp
Old2ndBcp
OlemaPharm
OlinkHolding
Ollie'sBargain
OlympicSteel
OmegaFlex
OmegaTherap
Omeros
OmniAb
Omnicell
1-800-FLOWERS
180DegreeCap
111
1stdibs.com
OneMedNet
OneWaterMarine
OnyxAcqnIA
OpenLending
OpenText
OpendoorTech
Opera
OportunFin
Opthea
OpticalCable
Optinose
OptionCare
OraSureTechs
OrchestraBioMed
OrganiGram
OricPharm
OrthofixMed
OrthoPediatrics
OtterTail
Outbrain
OutsetMedical
OvidTherap
OxfordLane
OxfordSquare
ODD ...
ODP ...
ON
...
OPBK 4.5
OPK ...
ORLY ...
OSIS ...
OCSL10.5
OTLY ...
OCFC 4.6
OCUL ...
OCS ...
OPI 14.8
OVBC 4.1
OKTA ...
OLPX ...
ODFL .4
ONB 3.4
OSBC 1.3
OLMA ...
OLK ...
OLLI ...
ZEUS .8
OFLX 1.9
OMGA ...
OMER ...
OABI ...
OMCL ...
FLWS ...
TURN ...
YI
...
DIBS ...
ONMD ...
ONEW ...
ONYX ...
LPRO ...
OTEX 2.5
OPEN ...
OPRA 6.5
OPRT ...
OPT ...
OCC ...
OPTN ...
OPCH ...
OSUR ...
OBIO ...
OGI ...
ORIC ...
OFIX ...
KIDS ...
OTTR 2.1
OB
...
OM
...
OVID ...
OXLC19.0
OXSQ14.2
66
11
15
6
dd
25
23
13
dd
8
dd
...
dd
8
dd
18
34
8
7
dd
dd
28
18
33
dd
10
dd
dd
dd
dd
dd
dd
dd
dd
cc
41
31
dd
17
dd
dd
11
dd
23
12
dd
dd
dd
dd
dd
13
dd
dd
dd
8
cc
42.70
51.99
75.70
10.77
.89
925.40
123.40
20.91
1.18
17.23
4.40
11.27
6.77
21.67
82.46
2.12
383.77
16.68
15.50
11.29
24.99
70.17
64.94
71.07
4.39
3.06
6.45
33.87
9.98
4.22
1.65
4.97
.75
31.08
11.04
7.71
40.13
3.63
12.02
3.96
3.11
2.72
1.17
32.60
8.12
7.46
1.38
8.42
12.67
30.31
83.94
4.25
5.57
3.05
5.06
2.96
–3.83 ...
–4.31 ...
–7.83 ...
–0.18 .12
–0.62 ...
–24.68 ...
–5.65 ...
+0.49 .07
... ...
–0.13 .20
–0.06 ...
+0.04 ...
–0.55 .25
–1.33 .22
–8.07 ...
–0.42 ...
–21.56 .40
–0.21 .14
+0.06 .05
–2.75 ...
–0.16 ...
–5.72 ...
–1.76 .125
+0.56 .33
+1.38 ...
–0.21 ...
+0.28 ...
–3.76 ...
–0.80 ...
+0.12 ...
+0.10 ...
+0.29 ...
–0.06 ...
–2.71 ...
+0.04 ...
–0.80 ...
–1.89 .25
–0.86 ...
–1.21 .40
+0.05 ...
+0.16 ...
+0.02 ...
–0.12 ...
–1.09 ...
–0.08 ...
–1.67 ...
+0.07 ...
–0.78 ...
–0.81 ...
–2.20 ...
–1.03.4375
–0.13 ...
+0.16 ...
–0.17 ...
+0.12 .08
+0.10 .035
15.66
12.86
37.76
59.67
26.12
18.35
0.43
1.18
11.85
24.83
115.45
17.53
64.78
5.74
17.53
25.93
6.85
132.22
45.85
60.66
9.35
13.40
10.51
10.90
0.58
39.75
12.81
10.36
62.24
3.54
25.00
9.70
104.09
17.13
139.40
4.02
50.25
PAM Transport
PCB Bancorp
PCConnection
PDD
PDF Solutions
PENN Entmt
PLBY Group
PMV Pharm
PRA Group
ProceptBio
PTC
PTC Therap
Paccar
PacBiosciCA
PacificPremBncp
PaciraBioSci
PactivEvergreen
PaloAltoNtwks
Palomar
PapaJohn's
PapayaGrowthI A
ParamountA
ParamountB
Park-Ohio
PassageBio
PathwardFinl
PatriaInvts
PatriaLatAm
PatrickIndustries
PatriotNatBncp
Patterson
PattersonUTIEn
Paychex
PaycorHCM
Paylocity
Payoneer
PayPal
PTSI
PCB
CNXN
PDD
PDFS
PENN
PLBY
PMVP
PRAA
PRCT
PTC
PTCT
PCAR
PACB
PPBI
PCRX
PTVE
PANW
PLMR
PZZA
PPYA
PARAA
PARA
PKOH
PASG
CASH
PAX
PLAO
PATK
PNBK
PDCO
PTEN
PAYX
PYCR
PCTY
PAYO
PYPL
12
8
21
33
cc
dd
dd
dd
dd
dd
81
dd
12
dd
11
cc
dd
cc
20
30
24
dd
dd
dd
dd
8
19
26
14
dd
14
8
26
dd
62
35
18
20.29
18.32
63.57
146.53
29.62
24.55
1.14
2.69
24.34
40.84
165.85
27.90
93.59
9.40
27.83
34.27
14.50
282.93
57.88
69.42
10.83
19.58
14.65
25.78
.93
50.59
14.81
11.13
95.22
4.10
28.60
10.73
117.98
19.45
159.48
4.96
60.12
–0.49 ...
–0.11 .18
–3.64 .08
+0.22 ...
–2.52 ...
–1.47 ...
+0.14 ...
–0.41 ...
–1.86 ...
–1.07 ...
–9.11 ...
+0.34 ...
–4.06 .27
–0.41 ...
–1.28 .33
+0.53 ...
+0.79 .10
–11.95 ...
+2.38 ...
–6.82 .46
+0.05 ...
–0.08 .05
–0.14 .05
–1.18 .125
–0.08 ...
–2.34 .05
–0.70 .199
+0.03 ...
–5.13 .55
+0.27 ...
+0.15 .26
–0.07 .08
–1.13 .89
–2.14 ...
–5.37 ...
–0.25 ...
–1.29 ...
O
56.00
58.98
111.35
11.87
2.24
1005.96
139.90
21.48
3.16
24.93
7.96
14.50
18.10
27.99
92.38
7.10
438.05
18.81
17.70
17.79
26.01
83.19
68.91
128.51
11.98
7.80
6.58
77.14
13.29
5.69
3.44
6.63
13.51
39.15
12.00
11.99
43.25
5.41
28.58
8.06
6.09
4.74
2.07
35.74
8.45
23.39
4.12
9.79
22.62
53.50
92.74
5.95
30.55
4.14
6.27
3.70
PQR
31.36
19.41
70.45
150.66
48.02
36.26
3.80
9.72
43.34
43.90
176.25
59.84
98.47
14.55
35.66
48.60
14.72
318.00
64.41
97.78
11.63
29.51
25.93
28.79
1.91
60.49
17.46
11.97
103.36
12.00
34.53
17.86
129.70
27.51
235.00
7.05
88.63
...
3.9
.5
...
...
...
...
...
...
...
...
...
1.2
...
4.7
...
2.8
...
...
2.7
...
1.0
1.4
1.9
...
.4
6.6
...
2.3
...
3.6
3.0
3.0
...
...
...
...
52-Week
High
Low
38.99
11.00
59.23
17.83
16.39
28.00
34.85
34.88
54.39
20.00
196.88
19.62
12.92
96.93
3.77
42.75
11.49
4.31
12.58
22.98
22.64
17.81
29.80
17.02
42.50
16.52
37.92
11.83
32.60
28.48
90.32
1.45
2.32
16.05
16.70
9.77
5.01
12.90
115.36
36.64
6.59
10.19
12.14
11.56
423.97
82.99
24.41
23.72
8.82
11.14
54.44
97.63
11.24
99.60
3.49
11.80
78.75
2.29
77.65
184.82
8.57
27.99
35.22
46.05
5.74
82.63
21.48
12.99
38.20
93.87
30.15
6.70
25.43
62.34
44.95
10.90
6.05
7.70
30.10
4.18
79.65
14.98
20.08
14.28
4.89
38.49
6.76
9.63
6.92
61.03
25.49
114.97
146.89
206.35
28.99
28.78
2.00
3.90
10.14
2.20
5.40
98.67
1.93
18.18
9.50
2.84
21.58
10.24
33.31
4.28
10.00
20.00
23.05
16.35
30.60
3.72
155.83
11.50
6.80
51.23
2.00
24.16
6.17
0.89
2.63
9.08
5.50
9.65
6.02
5.84
32.00
9.40
27.85
10.29
13.86
19.96
43.31
0.35
1.01
11.28
11.79
6.23
2.38
7.58
83.84
12.61
1.98
6.51
6.71
10.15
299.35
49.34
13.89
16.27
1.54
5.41
41.31
35.50
10.10
66.90
1.64
10.07
11.85
0.81
42.42
78.86
1.66
13.60
18.89
3.84
0.40
61.20
5.54
7.01
23.49
65.17
19.68
1.95
7.58
49.02
28.03
10.02
0.35
5.03
11.00
1.04
28.51
10.16
10.92
7.58
2.13
17.08
0.55
1.96
1.35
35.14
13.12
80.62
101.47
101.10
1.41
10.02
0.24
1.12
10.07
1.00
1.06
57.54
0.66
6.79
3.69
0.40
Name
PeapackGladFin
PearlHldgsAcqnA
Pegasystems
Peloton
Pennant
PennsWoodsBncp
PeoplesBncpOH
PeoplesBncpNC
PeoplesFinSvcs
PepGen
PepsiCo
PerdoceoEduc
PerellaWeinberg
Perficient
PerformantFin
PerionNetwork
Perma-PipeIntl
Personalis
PetcoHealth
PetIQ
PetMedExpress
Pharming
Pharvaris
PhathomPharm
Phenixfin
PhibroAnimal
PhillipsEdison
PhoenixBiotech
Photronics
Pilgrim'sPride
PinnacleFinPtrs
PintecTech
Pixelworks
PlainsAllAmPipe
PlainsGP
PlayaHotels
Playstudios
Playtika
Plexus
PliantTherap
PolestarAuto
PonceFinl
PonoCapitalThree
PonoCapTwoA
Pool
Popular
Portillo's
PortmanRidge
PoseidaTherap
Potbelly
PotlatchDelt
PowellIndustries
Pwr&Digital II A
PowerIntegrations
PowerFleet
PowerUpAcqn
PraxisPrecision
Precigen
PreferredBankLA
PreformedLine
PreludeTherap
PremierFinl
Premier
Prenetics
PrestoAutomation
PriceSmart
PrimeMedicine
PrimisFinl
PrincetonBncp
PrincipalFinl
PriviaHealth
Procaps
ProFrac
ProgressSoftware
Progyny
ProjectEnReimag
ProSomnus
ProspectCapital
ProtagonistTherap
ProtaraTherap
Prothena
ProvidentFin
PubMatic
Pulmonx
PumaBiotech
PureTechHealth
PurpleInnovation
Puyi
PyxisOncology
QCR Holdings
QifuTechnology
Qorvo
Qualcomm
Qualys
QuantaSing
Quanterix
Quantum
Quantum-Si
QuettaAcqn
QuettaAcqnRt
Quhuo
QuidelOrtho
QuinceTherap
QuinStreet
QurateRetailB
QurateRetailA
Tick
Sym Yld P/E
PGC .7
PRLH ...
PEGA .3
PTON ...
PNTG ...
PWOD 5.9
PEBO 4.8
PEBK 2.5
PFIS 3.4
PEPG ...
PEP 3.0
PRDO 2.6
PWP 2.4
PRFT ...
PFMT ...
PERI ...
PPIH ...
PSNL ...
WOOF ...
PETQ ...
PETS16.8
PHAR ...
PHVS ...
PHAT ...
PFX ...
PAHC 4.2
PECO 3.1
PBAX ...
PLAB ...
PPC ...
PNFP 1.0
PT
...
PXLW ...
PAA 7.0
PAGP 6.6
PLYA ...
MYPS ...
PLTK ...
PLXS ...
PLRX ...
PSNY ...
PDLB ...
PTHR ...
PTWO ...
POOL 1.2
BPOP 3.1
PTLO ...
PTMN15.0
PSTX ...
PBPB ...
PCH 3.7
POWL 1.3
XPDB ...
POWI 1.0
PWFL ...
PWUP ...
PRAX ...
PGEN ...
PFBC 3.9
PLPC .6
PRLD ...
PFC 5.3
PINC 3.7
PRE ...
PRST ...
PSMT 1.3
PRME ...
FRST 3.1
BPRN 3.4
PFG 3.3
PRVA ...
PROC ...
ACDC ...
PRGS 1.3
PGNY ...
PEGR ...
OSA ...
PSEC11.7
PTGX ...
TARA ...
PRTA ...
PROV 4.4
PUBM ...
LUNG ...
PBYI ...
PRTC ...
PRPL ...
PUYI ...
PYXS ...
QCRH .4
QFIN 5.2
QRVO ...
QCOM 2.3
QLYS ...
QSG ...
QTRX ...
QMCO ...
QSI
...
QETA ...
QETAR ...
QH
...
QDEL ...
QNCX ...
QNST ...
QRTEB ...
QRTEA ...
9
32
dd
dd
37
10
9
10
10
dd
28
8
dd
21
dd
12
14
dd
dd
44
dd
dd
dd
dd
3
22
74
dd
14
cc
11
dd
dd
11
20
34
dd
10
21
dd
dd
dd
64
cc
27
8
57
dd
dd
64
59
18
cc
68
dd
57
dd
dd
7
9
dd
7
15
dd
dd
21
dd
62
8
13
70
9
9
29
70
66
dd
...
dd
dd
dd
11
cc
dd
64
dd
dd
dd
dd
9
4
dd
21
49
23
dd
dd
dd
...
...
25
cc
dd
dd
32
4
Last
29.25
10.75
45.24
6.72
15.35
21.66
32.25
29.89
47.54
7.71
168.94
17.19
11.68
60.87
2.82
28.76
8.59
2.14
2.97
18.74
7.15
12.22
25.00
8.78
42.05
11.30
35.73
11.25
28.78
28.31
85.99
1.07
1.27
15.39
16.16
8.30
2.41
7.87
104.65
17.86
2.09
9.03
10.20
10.75
377.73
81.09
14.87
18.45
3.17
10.83
48.67
80.71
10.75
76.38
3.07
10.88
25.19
1.29
71.37
126.09
3.78
23.44
22.63
5.31
.44
72.85
8.98
12.75
35.39
80.82
21.29
4.30
8.00
52.07
36.30
10.58
.77
6.13
21.79
2.08
40.66
12.76
14.86
11.98
4.69
26.59
.92
5.98
2.11
56.76
15.25
103.12
136.73
180.30
1.69
25.57
.32
1.87
10.14
1.21
1.31
73.75
1.15
12.26
6.25
.84
Div
Chg. Amt.
–0.57 .05
+0.04 ...
–3.62 .03
+0.63 ...
+1.43 ...
–0.85 .32
–1.51 .39
–1.05 .19
–1.16 .41
+0.91 ...
–0.901.265
–0.37 .11
–0.55 .07
–4.95 ...
–0.31 ...
–2.11 ...
+0.65 ...
+0.04 ...
–0.19 ...
–1.01 ...
–0.41 .30
+0.79 ...
–3.05 ...
–0.35 ...
–0.20 ...
–0.28 .12
–0.75.0975
+0.25 ...
–2.59 ...
+0.65 ...
–1.23 .22
–0.04 ...
–0.04 ...
+0.24.2675
+0.21.2675
–0.35 ...
–0.30 ...
–0.85 ...
–3.48 ...
–0.25 ...
–0.17 ...
–0.73 ...
+1.88 ...
–0.02 ...
–20.98 1.10
–0.98 .62
–1.06 ...
+0.26 .69
–0.19 ...
+0.41 ...
–0.43 .45
–7.69.2625
+0.01 ...
–5.73 .20
–0.35 ...
–0.01 ...
+2.91 ...
–0.05 ...
–1.68 .70
–7.77 .20
–0.49 ...
–0.66 .31
+0.27 .21
–0.60 ...
–0.09 ...
–2.93 .46
+0.12 ...
+0.09 .10
–0.51 .30
+2.15 .67
–1.74 ...
+0.23 ...
–0.48 ...
–2.23 .175
–0.88 ...
+0.01 ...
–0.21 ...
+0.14 .06
–1.14 ...
+0.20 ...
+4.32 ...
+0.15 .14
–1.45 ...
–0.77 ...
+0.36 ...
–1.59 ...
–0.11 ...
–0.19 ...
+0.31 ...
–1.63 .06
–0.58 .50
–9.49 ...
–7.90 .80
–15.98 ...
+0.13 ...
–1.77 ...
–0.03 ...
–0.14 ...
+0.03 ...
–0.04 ...
–0.16 ...
+0.05 ...
+0.10 ...
–0.56 ...
–0.29 ...
–0.03 ...
52-Week
High
Low
31.45
21.50
97.45
32.00
25.54
0.28
5.93
24.50
18.70
3.57
37.97
23.35
14.48
9.88
20.86
19.80
71.90
6.98
1.55
60.15
62.26
6.90
2.94
16.75
58.00
16.50
54.63
17.68
0.20
68.56
924.89
23.18
4.85
27.95
4.04
11.30
7.79
15.10
200.98
29.52
57.54
7.77
18.48
16.37
37.98
11.81
35.60
30.65
50.28
4.84
24.97
2.04
5.32
7.95
28.06
17.00
13.51
32.53
33.09
5.99
13.24
108.84
14.80
551.91
139.32
11.42
11.36
11.10
147.82
39.49
50.50
53.11
41.43
136.14
Name
Tick
Sym Yld P/E
Last
Div
Chg. Amt.
10.47
8.62
50.43
10.11
12.82
0.07
2.51
15.36
9.55
1.05
17.82
13.53
0.82
1.72
5.94
8.50
35.23
1.82
0.74
30.54
17.95
1.37
1.00
4.54
43.50
6.24
37.82
4.26
0.03
54.72
668.00
5.95
2.00
10.89
0.30
0.98
4.04
3.08
110.45
5.89
37.23
5.19
12.96
10.99
5.72
4.50
15.44
24.80
15.50
1.78
10.25
0.71
2.01
4.17
11.68
2.70
7.91
14.89
11.78
3.72
6.59
41.30
3.31
416.78
99.00
10.32
10.14
3.39
101.82
25.92
33.37
35.43
12.06
83.88
RaptTherap
RBB Bancorp
RCI Hospitality
RCM Tech
REGENXBIO
RF Acqn Rt
RF Industries
RGC Resources
R1 RCM
RackspaceTech
RadNet
Radware
RainOncology
Rallybio
RamacoRscsA
RamacoRscsB
Rambus
RaniTherap
RapidMicro
Rapid7
RayzeBio
RealGoodFood
RealReal
RecursionPharm
RedRiverBcshs
RedRobin
RedRockResorts
Redfin
RedwoodsAcqnRt
RegencyCtrs
RegenPharm
RelayTherap
RelmadaTherap
RemitlyGlobal
Renalytix
ReneoPharm
ReNewEnergy
RepareTherap
Repligen
Replimune
RepublicBcpKYA
ReservoirMedia
ResourcesConnect
RetailOppor
RevanceTherap
RevelstoneCapA
RevolutionMed
ReynoldsCnsmr
RhythmPharm
RibbonComms
RichardsonElec
RigelPharm
RiminiStreet
RiverviewBncp
Rivian
Roadzen
Robinhood
RocketPharm
RockyBrands
RockyMtnChoc
RoivantSciences
Roku
Root
RoperTech
RossStores
RothCHAcqnA
RothCHAcqnV
Rover
RoyalGold
RoyaltyPharma
RushEnt A
RushEnt B
RxSight
Ryanair
RAPT ...
RBB 3.5
RICK .4
RCMT ...
RGNX ...
RFACR ...
RFIL ...
RGCO 4.2
RCM ...
RXT ...
RDNT ...
RDWR ...
RAIN ...
RLYB ...
METC 2.7
METCB 7.7
RMBS ...
RANI ...
RPID ...
RPD ...
RYZB ...
RGF ...
REAL ...
RXRX ...
RRBI .6
RRGB ...
RRR 2.0
RDFN ...
RWODR ...
REG 4.1
REGN ...
RLAY ...
RLMD ...
RELY ...
RNLX ...
RPHM ...
RNW ...
RPTX ...
RGEN ...
REPL ...
RBCAA 2.9
RSVR ...
RGP 4.3
ROIC 4.4
RVNC ...
RCAC ...
RVMD ...
REYN 3.5
RYTM ...
RBBN ...
RELL 1.9
RIGL ...
RMNI ...
RVSB 3.9
RIVN ...
RDZN ...
HOOD ...
RCKT ...
RCKY 2.3
RMCF ...
ROIV ...
ROKU ...
ROOT ...
ROP .6
ROST 1.0
USCT ...
ROCL ...
ROVR ...
RGLD 1.4
RPRX 2.9
RUSHA 1.5
RUSHB 1.4
RXST ...
RYAAY 1.1
dd
7
20
17
dd
...
dd
17
dd
dd
cc
dd
dd
dd
14
10
24
dd
dd
dd
...
dd
dd
dd
11
dd
14
dd
...
31
26
dd
dd
dd
dd
dd
74
dd
85
dd
11
dd
17
47
dd
cc
dd
21
dd
dd
11
dd
26
10
dd
94
dd
dd
19
dd
dd
dd
dd
44
27
79
dd
cc
33
69
8
8
dd
12
23.45
18.54
61.76
31.55
16.45
.10
3.07
19.02
10.14
1.79
34.83
15.71
1.20
2.12
20.40
12.94
63.40
2.98
.94
51.46
61.98
1.57
1.98
11.93
53.73
11.36
50.45
9.21
.13
65.00
913.17
11.50
3.32
18.60
.44
1.65
7.51
6.73
171.63
8.51
52.34
7.01
13.13
13.76
8.35
10.80
28.38
26.66
39.75
2.92
12.67
1.38
3.30
6.16
19.08
5.07
11.89
28.26
26.65
4.65
11.27
89.29
10.65
523.07
134.50
10.95
10.67
10.89
118.38
27.46
46.15
48.66
36.89
125.87
–1.40 ...
–0.50 .16
–4.50 .06
+2.51 ...
–1.50 ...
... ...
+0.03 ...
–1.32 .20
–0.43 ...
–0.21 ...
+0.06 ...
–0.97 ...
... ...
–0.27 ...
+3.22 .125
–0.37.2487
–4.85 ...
–0.34 ...
+0.20 ...
–5.64 ...
–0.19 ...
+0.05 ...
–0.03 ...
+2.07 ...
–2.38 .08
–1.11 ...
–2.88 .25
–1.11 ...
+0.05 ...
–2.00 .67
+34.88 ...
+0.49 ...
–0.82 ...
–0.82 ...
+0.05 ...
+0.05 ...
–0.15 ...
–0.57 ...
–8.17 ...
+0.08 ...
–2.82 .374
–0.12 ...
–1.04 .14
–0.27 .15
–0.44 ...
+5.30 ...
–0.30 ...
–0.18 .23
–6.22 ...
+0.02 ...
–0.68 .06
–0.07 ...
+0.03 ...
–0.24 .06
–4.38 ...
–0.02 ...
–0.85 ...
–1.71 ...
–3.53 .155
+0.05 ...
+0.04 ...
–2.37 ...
+0.17 ...
–22.10 .75
–3.89 .335
... ...
+0.04 ...
+0.01 ...
–2.58 .40
–0.63 .20
–4.15 .17
–4.32 .17
–3.43 ...
–7.49.9653
24.51
185.23
1.15
52.20
12.44
4.22
10.14
10.81
13.48
12.66
0.50
0.49
31.52
120.66
0.24
46.61
10.34
15.26
10.08
2.99
65.78
18.89
0.05
16.52
2.13
211.55
0.30
2.75
19.27
76.49
S&T Bancorp
SBA Comm
SCYNEXIS
SEI Investments
SI-BONE
SIGA Tech
SKGrowthOppsA
SLM
SLR Invt
SMART Global
SMXSecurityMatters
SPI Energy
SP Plus
SPS Commerce
Srivaru
SS&C Tech
SSR Mining
SWK Holdings
SabraHealthcare
Sabre
SafetyInsurance
SagaComm
SagaliamAcqnRt
SageTherap
Sagimet
Saia
SalemMedia
SanaBiotech
SandySpringBncp
Sanfilippo
STBA 4.0
SBAC 1.4
SCYX ...
SEIC 1.4
SIBN ...
SIGA .0
SKGR ...
SLM 2.4
SLRC10.8
SGH ...
SMX ...
SPI
...
SP
...
SPSC ...
SVMH ...
SSNC 1.6
SSRM 2.7
SWKH ...
SBRA 8.8
SABR ...
SAFT 4.8
SGA 4.3
SAGAR ...
SAGE ...
SGMT ...
SAIA ...
SALM ...
SANA ...
SASR 5.1
JBSS .8
9
54
1
19
dd
dd
36
14
12
...
...
dd
30
cc
74
25
10
14
dd
dd
36
13
...
dd
...
33
dd
dd
9
18
32.96
246.59
1.89
62.90
20.82
5.76
10.85
18.64
15.23
17.79
.51
.76
51.59
173.11
.26
59.82
10.54
17.51
13.64
4.35
75.35
23.42
.06
21.47
4.79
419.14
.32
5.10
26.56
99.94
–0.46 .33
–7.10 .85
–0.34 ...
–0.65 .46
–0.17 ...
+0.16 .45
+0.03 ...
–0.48 .11
+0.20 .41
–1.14 ...
–0.20 ...
–0.02 ...
+0.34 ...
–20.73 ...
–0.10 ...
–1.29 .24
–0.22 .07
–0.02 ...
–0.63 .30
–0.05 ...
–0.64 .90
+1.162.00
–0.03 ...
–0.20 ...
–0.63 ...
–19.08 ...
–0.07 ...
+1.02 ...
–0.68 .34
–3.10 1.20
S
38.43
312.34
3.87
64.94
29.51
8.49
11.61
19.36
16.09
29.99
104.72
1.86
52.40
198.35
2.57
64.52
17.74
19.49
14.82
7.92
88.66
27.27
0.28
59.99
18.33
461.92
1.45
8.01
35.90
127.26
52-Week
High
Low
3.76
5.95
65.58
57.82
30.81
5.17
159.89
4.97
40.48
36.64
21.17
47.25
59.24
12.75
11.50
16.13
34.03
87.93
10.06
9.75
6.18
108.18
4.00
4.96
12.03
35.18
65.65
64.87
1.93
1.79
2.11
9.86
6.87
11.57
11.35
6.22
2.71
8.43
25.51
7.05
30.10
315.95
30.94
18.15
34.10
4.94
23.21
15.30
19.98
50.00
194.68
95.33
58.04
10.47
23.20
23.68
52.69
22.41
3.00
7.95
142.88
11.03
34.53
53.76
123.69
41.61
2.65
14.86
12.38
3.07
10.58
11.70
17.25
5.71
345.80
8.20
3.86
3.79
35.00
21.98
5.77
19.40
2.50
5.11
30.22
44.74
55.45
31.00
40.38
22.73
10.17
32.36
15.40
2.04
152.77
18.05
15.57
10.26
10.85
0.29
40.18
49.66
3.57
81.81
9.23
0.29
2.18
43.41
42.63
18.35
0.40
55.25
1.63
26.14
22.34
5.56
30.50
17.37
4.63
9.59
4.85
17.93
53.16
5.40
5.35
1.46
87.66
0.14
0.67
10.20
13.13
32.50
31.51
0.51
1.09
0.27
1.15
0.91
6.84
1.41
1.93
0.77
1.33
16.47
5.81
12.11
157.00
19.24
9.66
10.39
0.56
15.01
1.04
4.55
13.75
74.56
49.50
6.08
7.52
14.94
13.36
32.69
9.39
0.31
3.32
81.09
10.28
17.50
16.59
85.06
9.00
1.44
8.88
6.70
0.83
9.89
4.45
7.80
0.92
63.25
1.81
1.20
1.73
2.39
9.78
1.98
8.03
1.34
0.97
18.75
20.75
30.28
19.61
25.38
12.74
10.07
20.51
1.29
0.99
81.50
8.05
8.08
2.98
10.13
0.02
18.00
30.10
1.01
27.82
3.83
Name
SangamoTherap
SangomaTechs
Sanmina
Sanofi
SapiensIntl
SarcosTech&Robotic
SareptaTherap
Savara
ScanSource
SchnitzerSteel
ScholarRock
Scholastic
Schrodinger
scPharm
ScreamingEagleA
ScrippsEW
SeacoastBkgFL
Seagate
SecureWorks
SecurityNatFin
Seer
SelectiveIns
SelinaHosp
Semantix
SemperParatusA
Semtech
SenecaFoods A
SenecaFoods B
SenseiBiotherap
SenstarTech
SentiBiosciences
SeraPrognostics
SeresTherap
ServiceProperties
17Educ&Tech
Shapeways
Sharecare
ShattuckLabs
ShenandoahTel
Shimmick
ShoalsTech
ShockwaveMed
ShoeCarnival
ShoreBancshares
Shyft
Sientra
SierraBancorp
SightSciences
SilenceTherap
Silicom
SiliconLabs
SiliconMotion
SilkRoadMed
SilverSpikeInvt
SilvercrestAsset
SimmonsFirstNat
SimulationsPlus
Sinclair
SingularGenomics
SiriusXM
SiTime
SizzleAcqn
SkywardSpecIns
SkyWest
Skyworks
SleepNumber
SmartSand
Smith&Wesson
SnapOne
SoYoungIntl
SocialLvgI A
SoFiTech
Sohu.com
SolGelTech
SolarEdgeTech
SolidBiosci
SolidPower
SomaLogic
Sonder
Sonos
SophiaGenetics
SoteraHealth
SotherlyHotels
SoundHoundAI
SouthPlainsFin
SouthernFirstBcsh
SoMO Bancorp
SouthernStBcsh
SouthsideBcshs
SovosBrands
SparkIAcqnA
SpartanNash
Spectaire
SperoTherap
Splunk
SpokHoldings
Sportradar
SportsmansWrhs
SpringValleyII A
SpringValleyII Rt
SpringWorks
SproutsFarmers
SpruceBio
StaarSurgical
Stagwell
Tick
Sym Yld P/E
SGMO ...
SANG ...
SANM ...
SNY ...
SPNS 1.9
STRC ...
SRPT ...
SVRA ...
SCSC ...
RDUS 2.7
SRRK ...
SCHL 2.2
SDGR ...
SCPH ...
SCRM ...
SSP ...
SBCF 2.7
STX 3.5
SCWX ...
SNFCA ...
SEER ...
SIGI 1.4
SLNA ...
STIX ...
LGST ...
SMTC ...
SENEA ...
SENEB ...
SNSE ...
SNT ...
SNTI ...
SERA ...
MCRB ...
SVC 9.6
YQ
...
SHPW ...
SHCR ...
STTK ...
SHEN .4
SHIM ...
SHLS ...
SWAV ...
SCVL 1.7
SHBI 3.5
SHYF 1.7
SIEN ...
BSRR 4.2
SGHT ...
SLN ...
SILC ...
SLAB ...
SIMO .8
SILK ...
SSIC 11.3
SAMG 4.4
SFNC 4.2
SLP .6
SBGI 7.3
OMIC ...
SIRI 1.9
SITM ...
SZZL ...
SKWD ...
SKYW ...
SWKS 2.6
SNBR ...
SND ...
SWBI 3.6
SNPO ...
SY
...
SLAC ...
SOFI ...
SOHU ...
SLGL ...
SEDG ...
SLDB ...
SLDP ...
SLGC ...
SOND ...
SONO ...
SOPH ...
SHC ...
SOHO ...
SOUN ...
SPFI 1.8
SFST ...
SMBC 1.6
SSBK 1.3
SBSI 4.5
SOVO ...
SPKL ...
SPTN 3.7
SPEC ...
SPRO ...
SPLK ...
SPOK 8.2
SRAD ...
SPWH ...
SVII ...
SVIIR ...
SWTX ...
SFM ...
SPRB ...
STAA ...
STGW ...
dd
dd
10
14
25
dd
dd
dd
12
dd
dd
20
56
dd
31
dd
22
dd
dd
6
dd
19
...
dd
cc
dd
11
11
dd
23
dd
dd
dd
dd
dd
dd
dd
dd
cc
...
17
31
9
18
14
dd
9
dd
dd
8
66
39
dd
...
14
10
76
10
dd
17
dd
dd
19
dd
17
71
6
21
dd
25
61
dd
dd
dd
22
dd
dd
dd
dd
dd
dd
dd
16
dd
8
21
13
7
10
dd
dd
26
dd
cc
cc
8
dd
dd
35
...
dd
20
dd
72
dd
Last
.45
3.01
50.10
51.21
26.72
.68
97.34
4.35
37.76
27.84
16.14
36.69
31.46
6.35
10.61
8.00
27.04
80.28
6.41
8.61
1.83
100.81
.17
.70
11.10
20.47
52.73
53.77
.77
1.20
.61
5.30
1.40
8.31
2.35
2.06
1.00
8.27
20.88
6.65
13.98
200.25
27.45
13.64
11.46
.65
22.03
5.15
17.92
17.06
120.59
65.00
11.38
8.50
17.33
19.08
40.00
13.77
.43
5.46
113.23
11.02
33.70
51.21
103.27
13.83
1.96
13.40
8.56
1.13
10.46
8.22
9.83
1.15
79.58
5.53
1.33
2.10
2.91
16.10
5.14
15.75
1.47
1.99
28.68
37.54
51.00
27.92
31.24
22.01
10.17
23.30
1.68
1.43
152.22
15.19
11.08
4.48
10.83
.13
37.96
49.20
2.94
28.46
6.27
Div
Chg. Amt.
–0.09 ...
–0.19 ...
–1.27 ...
+1.48 ...
–2.22 .26
–0.04 ...
+0.91 ...
–0.35 ...
–1.85 ...
–2.32.1875
–2.66 ...
–1.01 .20
–4.34 ...
+0.08 ...
+0.01 ...
+0.01 ...
–1.42 .18
–5.09 .70
–0.97 ...
–0.39 ...
–0.11 ...
+1.33 .35
... ...
+0.02 ...
–0.03 ...
–1.44 ...
+0.29 ...
+2.11 ...
+0.08 ...
–0.09 ...
–0.05 ...
–0.68 ...
... ...
–0.23 .20
+0.28 ...
–0.44 ...
–0.08 ...
+1.14 ...
–0.74 .09
+0.05 ...
–1.56 ...
+9.69 ...
–2.76 .12
–0.61 .12
–0.76 .05
+0.04 ...
–0.52 .23
–0.01 ...
+0.55 ...
–1.04 ...
–11.68 ...
+3.73 .50
–0.89 ...
+0.06 .45
+0.33 .19
–0.76 .20
–4.75 .06
+0.74 .25
–0.03 ...
–0.01.0266
–8.85 ...
+0.01 ...
–0.18 ...
–0.99 ...
–9.15 .68
–1.00 ...
+0.03 ...
–0.16 .12
–0.35 ...
–0.16 ...
+0.01 ...
–1.73 ...
–0.10 ...
+0.04 ...
–14.02 ...
–0.61 ...
–0.12 ...
–0.43 ...
–0.48 ...
–1.04 ...
+0.43 ...
–1.10 ...
–0.02 ...
–0.13 ...
–0.28 .13
+0.44 ...
–2.39 .21
–1.36 .09
–0.08 .02
–0.02 ...
+0.03 ...
+0.35 .215
+0.03 ...
–0.04 ...
–0.13 ...
–0.29.3125
+0.03 ...
+0.22 ...
+0.02 ...
–0.02 ...
+1.46 ...
+1.09 ...
+0.01 ...
–2.75 ...
–0.36 ...
January 8, 2024
D ATA
52-Week
High
Low
3.16
25.03
1.59
20.79
115.48
7.54
136.46
32.39
56.12
15.94
89.80
44.23
6.03
64.00
14.00
18.61
74.01
21.72
98.22
30.34
29.99
12.50
75.02
31.49
18.67
5.10
23.80
9.73
19.32
29.72
357.00
14.63
42.09
45.79
39.41
8.72
64.14
142.14
29.86
573.77
2.30
8.17
1.44
16.57
0.65
10.76
89.21
2.51
90.55
19.83
37.78
10.00
30.60
29.92
2.78
36.93
3.35
8.09
49.62
9.95
64.53
16.06
18.55
3.46
20.80
17.06
11.79
1.25
12.39
2.79
3.62
8.43
69.02
7.14
21.99
22.05
16.00
2.01
12.28
67.73
11.22
312.27
1.73
2.09
Name
StdBioTools
StarBulkCarriers
StarEquity
Star
Starbucks
StealthGas
SteelDynamics
StepStone
Stericycle
SterlingCheck
SterlingInfr
StevenMadden
StitchFix
StockYardsBncp
StokeTherap
StoneCo
StoneX
Stratasys
StrategicEd
Strattec
StratusProp
StrongholdDig
StructureTherap
SummitFin
SummitStateBk
SummitTherap
SunCountryAir
SunOpta
SunPower
SunRun
SuperMicroComp
SuperiorGroup
SupernusPharm
SurgeryPartners
Surmodics
SutroBioph
Symbotic
Synaptics
SyndaxPharm
Synopsys
SyprisSolutions
SyrosPharm
NASDAQ ISSUES
Tick
Sym Yld P/E
LAB ...
SBLK 7.2
STRR ...
STHO ...
SBUX 2.5
GASS ...
STLD 1.5
STEP 2.7
SRCL ...
STER ...
STRL ...
SHOO 2.1
SFIX ...
SYBT 2.4
STOK ...
STNE ...
SNEX ...
SSYS ...
STRA 2.7
STRT ...
STRS ...
SDIG ...
GPCR ...
SMMF 3.0
SSBI 3.9
SMMT ...
SNCY ...
STKL ...
SPWR ...
RUN ...
SMCI ...
SGC 4.2
SUPN ...
SGRY ...
SRDX ...
STRO ...
SYM ...
SYNA ...
SNDX ...
SNPS ...
SYPR ...
SYRS ...
dd
10
1
dd
26
6
7
29
dd
dd
21
18
dd
13
dd
28
10
dd
44
dd
dd
dd
dd
7
6
dd
12
dd
dd
dd
27
29
71
dd
dd
dd
dd
dd
dd
61
dd
dd
Last
1.87
21.71
.99
14.14
92.99
7.47
116.22
31.50
47.70
13.28
77.09
40.94
3.26
49.93
5.26
17.10
71.02
13.94
90.14
23.00
27.23
7.19
42.36
28.89
12.22
2.55
15.08
5.39
3.97
16.16
292.13
13.45
27.43
31.06
33.12
3.49
43.39
103.68
21.49
484.81
2.06
6.86
Div
Chg. Amt.
–0.34 ...
+0.45 .22
–0.06 ...
–0.84 ...
–3.02 .57
+1.01 ...
–1.88 .425
–0.33 .21
–1.86 ...
–0.64 ...
–10.84 ...
–1.06 .21
–0.31 ...
–1.56 .30
... ...
–0.93 ...
–2.81 ...
–0.34 ...
–2.23 .60
–2.34 ...
–1.63 ...
–0.11 ...
+1.60 ...
–1.80 .22
–0.08 .12
–0.06 ...
–0.65 ...
–0.08 ...
–0.87 ...
–3.47 ...
+7.87 ...
–0.05 .14
–1.51 ...
–0.93 ...
–3.23 ...
–0.80 ...
–7.94 ...
–10.40 ...
–0.12 ...
–30.10 ...
+0.03 ...
–0.93 ...
For personal non-commercial use only. Do not edit or alter. Reproductions not permitted.
To reprint or license content, please contact Barron's reprints department at 800-843-0008 or www.djreprints.com
T
13.18
15.25
11.00
3.20
10.78
1.88
164.50
44.46
14.80
132.76
54.20
17.46
4.45
26.11
164.85
47.00
13.03
12.19
25.25
22.00
11.20
3.89
12.25
52.95
6.43
22.75
3.32
5.36
63.57
49.77
8.09
10.97
8.83
119.20
14.04
25.50
299.29
173.27
69.27
188.12
124.02
42.46
5.89
12.03
14.77
21.50
11.60
1.48
11.81
4.39
10.99
3.59
35.50
47.87
36.60
45.87
31.76
251.17
91.85
97.18
0.44
10.47
4.23
10.97
10.15
0.65
10.10
0.19
124.92
24.74
1.63
87.43
15.27
11.13
2.16
9.70
101.53
13.82
2.47
10.25
11.33
7.95
5.01
0.50
10.29
23.43
4.33
6.13
0.30
1.53
33.79
33.85
1.66
10.16
0.13
81.08
3.26
6.85
101.81
131.19
42.79
139.48
91.06
25.13
1.95
8.25
2.05
12.31
3.75
0.52
3.18
1.31
9.97
1.50
22.11
21.44
22.31
21.43
21.22
185.00
41.20
63.08
0.09
10.08
TelaBio
TFS Finl
TGVentureAcqn
TMCthemetals
TMT Acqn
TMT Acqn Rt
T-MobileUS
TPG
TPIComposites
T.RowePrice
TTEC
TTM Tech
Taboola
TactileSystems
TakeTwoSoftware
TandemDiabetes
TangoTherap
TargetGlbl I A
TarsusPharm
TaskUs
TatTechnologies
TayshaGene
Tech&TelecomA
TechTarget
Ericsson
Telesat
TelesisBio
Telos
10xGenomics
Tenable
TenayaTherap
TenXKeaneAcqn
TenXKeaneAcqnRt
Teradyne
TernsPharm
TerritorialBncp
Tesla
TetraTech
TexasCapBcshs
TexasInstruments
TexasRoadhouse
TheBancorp
TherapeuticsMD
TheravanceBio
TheseusPharm
ThirdCoastBcshs
ThirdHarmonic
36Kr
Thoughtworks
ThredUp
ThunderBridgeIV A
TilrayBrands
TimberlandBncp
TitanMachinery
Torm
TowerSemi
TowneBank
TractorSupply
TradeDesk
Tradeweb
TrailblazerI Rt
TrailblazerI A
43
BARRON’S
TELA ...
TFSL 7.9
TGVC ...
TMC ...
TMTC ...
TMTCR ...
TMUS 1.6
TPG 3.5
TPIC ...
TROW 4.6
TTEC 5.3
TTMI ...
TBLA ...
TCMD ...
TTWO ...
TNDM ...
TNGX ...
TGAA ...
TARS ...
TASK ...
TATT ...
TSHA ...
TETE ...
TTGT ...
ERIC 2.8
TSAT ...
TBIO ...
TLS ...
TXG ...
TENB ...
TNYA ...
TENK ...
TENKR ...
TER .4
TERN ...
TBNK 1.8
TSLA ...
TTEK .6
TCBI ...
TXN 3.1
TXRH 1.9
TBBK ...
TXMD ...
TBPH ...
THRX ...
TCBX ...
THRD ...
KRKR ...
TWKS ...
TDUP ...
THCP ...
TLRY ...
TSBK 3.1
TITN ...
TRMD20.8
TSEM ...
TOWN 3.4
TSCO 1.9
TTD ...
TW .4
TBMCR ...
TBMC ...
dd
54
dd
dd
81
...
25
dd
dd
15
23
dd
dd
13
dd
dd
dd
47
dd
26
21
dd
85
78
dd
1
dd
dd
dd
dd
dd
56
...
34
dd
12
76
32
8
21
27
11
dd
dd
dd
11
dd
dd
dd
dd
73
dd
9
6
4
6
13
21
cc
54
...
cc
6.88
14.27
10.95
1.31
10.56
.19
163.37
39.69
3.51
106.17
19.65
14.72
4.31
13.71
158.21
27.80
9.18
11.10
19.61
12.01
11.12
1.78
11.49
33.95
6.05
9.90
.36
4.22
51.64
42.88
2.97
10.95
.18
102.77
6.78
11.00
237.49
161.58
62.86
165.10
118.30
37.62
2.28
10.37
3.97
19.38
10.89
.59
4.47
2.04
10.21
2.28
30.05
27.92
33.78
29.47
29.33
218.91
67.64
93.00
.15
10.45
+0.26 ...
–0.42.2825
+0.11 ...
+0.21 ...
–0.04 ...
–0.03 ...
+3.04 .65
–3.48 .48
–0.63 ...
–1.52 1.22
–2.02 .52
–1.09 ...
–0.02 ...
–0.59 ...
–2.74 ...
–1.78 ...
–0.72 ...
+0.06 ...
–0.64 ...
–1.06 ...
+0.97 ...
+0.01 ...
–0.02 ...
–0.91 ...
–0.25.0873
–0.53 ...
–0.04 ...
+0.57 ...
–4.32 ...
–3.18 ...
–0.27 ...
+0.01 ...
+0.04 ...
–5.75 .11
+0.29 ...
–0.15 .05
–10.99 ...
–5.35 .26
–1.77 ...
–5.36 1.30
–3.93 .55
–0.94 ...
+0.03 ...
–0.87 ...
–0.08 ...
–0.49 ...
–0.08 ...
+0.03 ...
–0.34 ...
–0.21 ...
–0.01 ...
–0.02 ...
–1.41 .23
–0.96 ...
+3.37 1.46
–1.05 ...
–0.43 .25
+3.88 1.03
–4.32 ...
+2.12 .09
+0.05 ...
–0.01 ...
52-Week
High
Low
9.44
115.41
99.63
10.86
23.18
27.97
8.59
3.50
52.66
31.89
62.01
1.24
15.44
43.59
27.30
16.24
2.20
81.64
10.15
3.77
69.15
38.81
35.42
7.15
2.90
13.20
13.26
2.89
2.99
16.36
39.74
15.25
13.15
19.74
Name
FOREIGN MARKETS
Tick
Sym Yld P/E
Last
Div
Chg. Amt.
4.92
73.41
36.42
4.51
5.25
5.27
3.16
0.97
28.66
22.59
39.57
0.37
10.87
30.70
14.15
3.32
0.16
46.37
2.26
1.76
18.45
23.78
18.96
1.62
0.62
1.63
6.17
0.72
0.61
8.60
11.46
1.54
0.88
6.55
TransActTechs
Transcat
TransMedics
Travelzoo
TravereTherap
TreaceMed
TremorIntl
TreviTherap
TriCoBancshares
TriMas
Trimble
TrinityBiotech
TrinityCapital
Trip.com
Tripadvisor
TriSalusLifeSci
TritiumDCFC
TriumphFinl
trivago
TrueCar
Trupanion
TrustcoBank
Trustmark
TScanTherap
Tuniu
TurnstoneBiologics
TurtleBeach
TuSimple
23andMe
TwinDisc
TwistBiosci
2seventybio
2U
TyraBiosciences
TACT ...
TRNS ...
TMDX ...
TZOO ...
TVTX ...
TMCI ...
TRMR ...
TRVI ...
TCBK 2.9
TRS .6
TRMB ...
TRIB ...
TRIN13.0
TCOM ...
TRIP ...
TLSI ...
DCFC ...
TFIN ...
TRVG .0
TRUE ...
TRUP ...
TRST 4.8
TRMK 3.4
TCRX ...
TOUR ...
TSBX ...
HEAR ...
TSP ...
ME
...
TWIN 1.0
TWST ...
TSVT ...
TWOU ...
TYRA ...
15
89
dd
13
dd
dd
dd
dd
11
20
38
dd
10
17
dd
dd
dd
39
dd
dd
dd
8
18
dd
21
dd
dd
dd
dd
19
dd
dd
dd
dd
7.50
99.41
73.89
9.78
8.64
11.89
4.77
1.32
40.79
24.96
50.77
.53
14.98
38.25
20.98
8.79
.19
74.54
2.43
3.19
28.14
30.24
27.38
5.85
.67
2.37
10.12
.75
.80
15.85
33.98
3.79
1.07
11.61
+0.52 ...
–9.92 ...
–5.04 ...
+0.25 ...
–0.35 ...
–0.86 ...
–0.29 ...
–0.02 ...
–2.18 .30
–0.37 .04
–2.43 ...
+0.10 ...
+0.45 .50
+2.24 ...
–0.55 ...
+0.34 ...
–0.03 ...
–5.64 ...
–0.01.5628
–0.27 ...
–2.37 ...
–0.81 .36
–0.50 .23
+0.02 ...
–0.01 ...
–0.18 ...
–0.83 ...
–0.13 ...
–0.12 ...
–0.31 .04
–2.88 ...
–0.48 ...
–0.16 ...
–2.24 ...
75.01
50.68
2.31
8.56
140.10
1.17
8.17
368.02
22.15
31.52
3.81
20.07
5.49
33.68
25.35
20.37
18.41
5.79
5.50
204.44
2.94
20.01
1.46
107.19
7.02
20.85
7.23
0.75
16.10
22.42
2.42
11.93
6.56
24.73
7.60
1.45
75.00
3.10
0.52
UFP Inds
UMB Fin
UPFintech
USCB Financial
US Lime&Min
uCloudlink
Udemy
UltaBeauty
UltraClean
UltragenyxPharm
Ultralife
UnionBankshares
uniQure
UnitedAirlines
UnitedBkshrsWV
UtdCmtyBks
UnitedFire
UnitedGuardian
UnitedSecBcshrs
UnitedTherap
Uniti
UnityBancorp
UnityBiotech
UnivDisplay
UnvlElectronics
UnivLogistics
UnvlStainless
UniversePharm
UnivestFin
Upbound
UplandSoftware
Upstart
Upwork
UrbanOutfitters
UroGenPharma
Usio
UtahMedProducts
UTStarcom
Uxin
UFPI 1.0
UMBF 1.9
TIGR ...
USCB ...
USLM .4
UCL ...
UDMY ...
ULTA ...
UCTT ...
RARE ...
ULBI ...
UNB 4.6
QURE ...
UAL ...
UBSI 4.0
UCBI 3.2
UFCS 3.0
UG 2.5
UBFO 6.3
UTHR ...
UNIT10.3
UNTY 1.7
UBX ...
OLED .8
UEIC ...
ULH 1.5
USAP ...
UPC ...
UVSP 4.0
UPBD 4.5
UPLD ...
UPST ...
UPWK ...
URBN ...
URGN ...
USIO ...
UTMD 1.5
UTSI ...
UXIN ...
14
10
19
14
18
20
dd
19
...
dd
26
12
dd
5
13
13
dd
14
7
13
dd
7
dd
41
dd
7
dd
dd
8
cc
dd
dd
dd
12
dd
dd
17
dd
dd
118.18
81.30
4.22
12.44
217.22
1.89
13.10
471.12
31.35
47.60
6.48
31.41
6.56
41.76
37.12
28.83
21.33
7.89
7.56
229.40
5.84
28.57
1.88
176.59
8.77
27.92
19.72
1.67
20.99
32.78
4.10
33.24
14.05
34.38
13.81
1.73
80.87
3.29
.65
–7.37 .30
–2.25 .39
–0.20 ...
+0.19 ...
–13.13 .20
+0.14 ...
–1.63 ...
–18.87 ...
–2.79 ...
–0.22 ...
–0.35 ...
+0.76 .36
–0.21 ...
+0.50 ...
–0.43 .37
–0.43 .23
+1.21 .16
+0.69 .10
–0.85 .12
+9.51 ...
+0.06 .15
–1.02 .12
–0.05 ...
–14.67 .35
–0.62 ...
–0.10 .105
–0.36 ...
–0.34 ...
–1.04 .21
–1.19 .37
–0.13 ...
–7.62 ...
–0.82 ...
–1.31 ...
–1.19 ...
+0.01 ...
–3.35 .30
–0.15 ...
–0.05 ...
U
128.65
92.68
5.80
13.10
240.69
6.60
16.01
556.60
40.80
54.98
11.85
32.00
23.46
58.23
42.45
35.25
32.54
12.51
8.74
279.14
6.86
29.88
5.72
194.84
25.91
45.00
20.53
12.48
29.05
36.17
9.71
72.58
15.95
38.13
24.13
2.36
100.99
5.03
3.92
V
6.83
14.75
66.44
39.80
12.61
17.05
8.15
23.90
45.81
14.00
4.60
65.97
4.47
31.95
47.25
8.35
20.23
30.52
19.77
39.90
40.71
229.72
249.26
29.75
10.99
26.32
8.70
11.50
30.00
2.53
7.25
39.89
6.75
6.39
9.07
3.30
17.05
22.18
3.37
3.05
34.11
0.69
17.70
2.06
4.60
5.20
19.52
9.34
23.39
18.41
188.44
169.74
14.88
1.54
11.83
2.86
6.37
11.92
VNET
VOXX Intl
VSE
Vacasa
ValleyNatlBncp
Valneva
VandaPharm
VarexImaging
VaronisSystems
VastRenewables
VastaPlatform
Vaxcyte
Vaxxinity
VeecoInstr
VentyxBiosciences
VeraBradley
VeraTherap
Veracyte
Veradigm
Vericel
VerintSystems
VeriSign
VeriskAnalytics
Veritex
Veritone
VeronaPharma
VerricaPharm
VersaBank
Vertex
VNET ...
VOXX ...
VSEC .7
VCSA ...
VLY 4.2
VALN ...
VNDA ...
VREX ...
VRNS ...
VSTE ...
VSTA ...
PCVX ...
VAXX ...
VECO ...
VTYX ...
VRA ...
VERA ...
VCYT ...
MDRX ...
VCEL ...
VRNT ...
VRSN ...
VRSK .6
VBTX 3.5
VERI ...
VRNA ...
VRCA ...
VBNK .7
VERX ...
dd
dd
25
dd
9
dd
20
20
dd
cc
dd
dd
dd
29
dd
dd
dd
dd
...
dd
cc
28
69
9
dd
dd
dd
10
dd
2.58
9.51
59.50
7.53
10.48
10.42
4.19
19.58
42.52
3.66
4.26
59.79
.77
28.55
2.33
7.09
15.53
25.73
10.48
32.52
25.58
196.91
233.70
22.57
1.66
19.55
6.72
11.05
25.26
–0.29 ...
–1.17 ...
–5.11 .10
–0.67 ...
–0.38 .11
+0.05 ...
–0.03 ...
–0.92 ...
–2.76 ...
–1.53 ...
–0.20 ...
–3.01 ...
–0.08 ...
–2.48 ...
–0.14 ...
–0.61 ...
+0.15 ...
–1.78 ...
–0.01 ...
–3.09 ...
–1.45 ...
–9.05 ...
–5.16 .34
–0.70 .20
–0.15 ...
–0.33 ...
–0.60 ...
+0.10.0187
–1.68 ...
52-Week
High
Low
418.71 282.21
24.69 8.22
36.00 5.22
7.61 3.66
47.35 15.02
12.40 8.74
12.19 7.26
98.38 35.48
35.21 27.27
62.40 0.62
12.96 2.85
25.72 8.05
26.99 20.25
5.19 3.02
11.47 7.70
93.00 4.59
3.38 0.47
1.60 0.77
31.55 7.72
2.47 0.43
12.89 3.54
21.66 16.26
248.23 165.00
11.85 10.33
171.66 108.66
33.29 12.50
18.18 10.00
23.99 9.80
9.89 5.59
12.53 8.11
6.74 1.62
14.34 6.06
2.82 0.50
WXYZ
Name
VertexPharm
VerveTherap
ViaRenewables
ViantTech
ViaSat
Viatris
ViaviSolutions
Vicor
VictoryCapital
View
VigilNeurosci
VikingTherap
VillageSuper A
Vimeo
VinciPartners
VinFastAuto
VintageWineEstates
ViomiTech
VirBiotech
ViractaTherap
VircoMfg
VirtuFinancial
VirtusInvtPtrs
VisionSensingA
Visteon
VitaCoco
VitalFarms
Vitru
VividSeats
Vodafone
VorBiopharma
VoyagerTherap
Vroom
Tick
Sym Yld P/E
VRTX ...
VERV ...
VIA ...
DSP ...
VSAT ...
VTRS 4.0
VIAV ...
VICR ...
VCTR 3.9
VIEW ...
VIGL ...
VKTX ...
VLGEA 3.9
VMEO ...
VINP 6.5
VFS ...
VWE ...
VIOT ...
VIR
...
VIRX ...
VIRC .6
VIRT 4.6
VRTS 3.2
VSAC ...
VC
...
COCO ...
VITL ...
VTRU ...
SEAT ...
VOD 10.5
VOR ...
VYGR ...
VRM ...
31
dd
dd
dd
dd
8
cc
33
11
dd
dd
dd
7
76
15
dd
dd
dd
dd
dd
7
13
13
cc
21
39
33
17
15
2
dd
7
dd
Last
416.50
13.32
10.70
6.82
25.83
11.98
9.61
38.36
33.23
2.33
3.31
18.19
25.64
3.72
10.70
7.02
.48
.91
10.03
.60
12.44
20.73
234.20
11.05
115.53
24.64
15.35
14.77
6.12
8.98
2.21
8.85
.51
Div
Chg. Amt.
+9.61 ...
–0.62 ...
+1.30 ...
–0.07 ...
–2.12 ...
+1.15 .12
–0.46 ...
–6.58 ...
–1.21 .32
–1.31 ...
–0.07 ...
–0.42 ...
–0.59 .25
–0.20 ...
–0.25 .17
–1.35 ...
–0.02 ...
–0.09 ...
–0.03 ...
+0.03 ...
+0.41 .02
+0.47 .24
–7.56 1.90
... ...
–9.37 ...
–1.01 ...
–0.34 ...
–0.99 ...
–0.20 ...
+0.28.4815
–0.04 ...
+0.41 ...
–0.09 ...
6.94 3.15 WaveLifeSci
WVE ... dd 4.94 –0.11 ...
245.76 158.60 WD-40
WDFC 1.5 48 232.48 –6.59 .88
51.77 29.59 WSFS Financial WSFS 1.3 9 44.47 –1.46 .15
52-Week
High
Low
13.31
37.29
3.39
37.96
11.90
16.34
38.76
48.78
17.70
102.65
25.57
11.68
0.27
23.90
5.59
50.31
38.56
25.00
58.92
53.21
10.20
13.40
13.90
33.03
25.38
65.19
258.93
1.85
261.97
451.30
98.23
8.00
127.42
140.73
279.83
160.07
117.86
Name
3.46
23.36
1.58
19.68
7.82
9.27
23.62
21.69
9.62
49.55
9.09
10.21
0.04
18.19
1.57
35.02
19.84
15.04
35.52
31.97
5.58
4.90
6.88
21.45
13.86
37.01
195.29
0.56
131.56
241.00
57.48
1.35
70.28
88.30
157.96
66.70
81.65
WW Intl
WaFd
Wag!
WalgreensBoots
WalkMe
WarnerBrosA
WarnerMusic
WashTrBcp
WaterstoneFinl
WeatherfordIntl
Weibo
WelsbachTech
WelsbachTechRt
Wendy's
WerewolfTherap
WernerEnterprises
WesBanco
WestBancorp
WestamericaBncp
WesternDigital
WestNewEngBncp
WestportFuelSys
WestrockCoffee
WeycoGroup
Willdan
WillisLease
WillisTowers
WiMiHologram
Wingstop
Winmark
WintrustFinl
WISeKey
Wix.com
Woodward
Workday
WorldAcceptance
WynnResorts
Tick
Sym Yld P/E
WW ...
WAFD 3.2
PET ...
WBA 4.0
WKME ...
WBD ...
WMG 2.0
WASH 7.3
WSBF 4.3
WFRD ...
WB .0
WTMA ...
WTMAR ...
WEN 5.3
HOWL ...
WERN 1.4
WSBC 4.7
WTBA 4.9
WABC 3.2
WDC ...
WNEB 3.1
WPRT ...
WEST ...
WEYS 3.3
WLDN ...
WLFC ...
WTW 1.4
WIMI ...
WING .4
WINA .9
WTFC 1.7
WKEY ...
WIX ...
WWD .7
WDAY ...
WRLD ...
WYNN 1.0
dd
8
dd
38
dd
dd
42
10
27
20
6
dd
...
20
dd
17
11
12
9
dd
9
dd
dd
9
cc
7
25
dd
cc
33
9
dd
dd
35
cc
14
cc
Last
6.45
31.09
1.70
25.01
10.48
11.20
34.10
30.68
13.84
94.89
10.11
10.79
.05
18.99
5.36
40.76
30.42
20.59
54.94
50.05
9.10
6.30
9.75
30.40
19.68
47.26
238.87
.80
245.23
373.52
91.75
1.82
118.10
133.18
265.80
127.78
95.65
Div
Chg. Amt.
52-Week
High
Low
–2.31 ...
–1.87 .25
–0.05 ...
–1.10 .25
–0.19 ...
–0.18 ...
–1.69 .17
–1.70 .56
–0.36 .15
–2.94 ...
–0.84 .85
+0.04 ...
... ...
–0.49 .25
+1.50 ...
–1.61 .14
–0.95 .36
–0.61 .25
–1.47 .44
–2.32 ...
+0.10 .07
–0.32 ...
–0.46 ...
–0.96 .25
–1.82 ...
–1.62 ...
–2.33 .84
–0.01 ...
–11.35 .22
–44.039.40
–1.00 .40
+0.07 ...
–4.92 ...
–2.95 .22
–10.26 ...
–2.75 ...
+4.54 .25
47.40
10.39
23.51
27.71
6.69
72.97
38.20
47.00
3.07
19.00
4.92
41.07
2.23
10.95
46.88
11.73
0.30
7.69
49.24
10.91
351.74
31.46
5.15
7.15
94.06
58.82
59.86
18.69
55.20
85.13
14.75
30.98
227.29
28.97
10.99
17.25
153.30
4.92
1.40
13.48
10.30
3.05
53.73
16.49
27.99
1.02
12.06
0.49
12.45
1.28
2.70
35.24
10.07
0.04
0.56
22.35
0.19
194.59
9.56
0.41
3.89
57.97
33.23
33.80
5.05
18.26
58.87
2.45
12.36
84.93
13.19
6.02
6.88
0.68
Name
XBPEurope
XIAO-I
XOMA
XP
XBiotech
XcelEnergy
Xencor
XenonPharm
XerisBiopharma
Xerox
XilioTherap
Xometry
Xunlei
Y-mAbsTherap
YorkWater
YottaAcqn
YottaAcqnRt
Yunji
ZaiLab
ZappEV
ZebraTech
ZentalisPharm
ZeroFox
ZevraTherap
ZiffDavis
Zillow A
Zillow C
ZimVie
ZionsBancorp
ZoomVideo
Zoomcar
ZoomInfoTech
Zscaler
Zumiez
Zymeworks
Zynex
ZyVersaTherap
Tick
Sym Yld P/E
XBP ...
AIXI ...
XOMA ...
XP 10.4
XBIT ...
XEL 3.3
XNCR ...
XENE ...
XERS ...
XRX 6.1
XLO ...
XMTR ...
XNET ...
YMAB ...
YORW 2.3
YOTA ...
YOTAR ...
YJ
...
ZLAB ...
ZAPP ...
ZBRA ...
ZNTL ...
ZFOX ...
ZVRA ...
ZD
...
ZG
...
Z
...
ZIMV ...
ZION 3.7
ZM
...
ZCAR ...
ZI
...
ZS
...
ZUMZ ...
ZYME ...
ZYXI ...
ZVSA ...
dd
...
dd
20
dd
20
dd
dd
dd
15
dd
dd
8
dd
23
70
...
dd
dd
dd
28
dd
dd
dd
80
dd
dd
dd
8
90
dd
50
dd
dd
3
25
dd
5.21
1.93
20.91
25.17
4.03
63.73
20.59
45.50
2.45
16.32
.86
32.51
1.53
7.18
37.02
10.45
.13
.68
26.53
.30
252.69
15.39
.73
5.94
65.16
52.43
53.71
16.89
44.05
66.96
4.22
17.06
209.81
18.29
10.56
10.79
.88
Europe
Asia
Good News, Bad News: Good U.S. employment stats were
bad for European hopes of an imminent rate cut by the Fed.
Drive Sober: China will probe imported European brandy,
after the EU probed imports of Chinese electric vehicles.
-0.65%
Denmark
Greece
Finland
Norway
Spain
Belgium
Switzerland
Italy
-0.74
-1.31
-1.56
-2.85
-3.00
S&P Europe BMI
1.91
1.66
0.97
0.95
0.45
0.09
-1.06
0.08
-1.32
U.K.
Germany
France
Sweden
Netherlands
-1.74
-2.50
-2.52
-2.61
-3.75
–0.09 ...
–0.34 ...
+2.41 ...
–0.90 .73
+0.03 ...
+1.82 .52
–0.64 ...
–0.56 ...
+0.10 ...
–2.01 .25
+0.31 ...
–3.40 ...
–0.09 ...
+0.36 ...
–1.60.2108
+0.10 ...
+0.01 ...
–0.03 ...
–0.80 ...
+0.03 ...
–20.64 ...
+0.24 ...
–0.14 ...
–0.61 ...
–2.03 ...
–4.29 ...
–4.15 ...
–0.86 ...
+0.18 .41
–4.95 ...
+0.53 ...
–1.43 ...
–11.75 ...
–2.05 ...
+0.17 ...
–0.10 ...
–0.02 ...
S&P Pan Asia BMI
-0.59%
Philippines
Malaysia
Indonesia
Japan
India
Thailand
2.67
Div
Chg. Amt.
Last
2.72
2.43
1.39
1.11
1.01
0.48
New Zealand
Australia
Singapore
Taiwan
South Korea
China
Hong Kong
Indexes based on S&P Global Broad Market Indices
Source: S&P DJ Indices
Key Foreign Stock Market Indexes
Most Recent
Close
Week’s
%Chg.
Year-to-Date
Chg.
% Chg.
Amsterdam AEX
778.70
–1.03
–8.12
–1.03
Milan FTSE All Share
Athens General
1311.67
+1.43
+18.53
+1.43
Bangkok SET
1427.96
+0.86
+12.11
Bombay Sensex
72026
–0.30
Brussels Bel-20
3717.81
+0.27
1055381
+13.52
Copenhagen OMX 20
2348.56
Dublin ISEQ
8666.29
Year-to-Date
Chg.
% Chg.
Most Recent
Close
Week’s
%Chg.
32512
+0.10
+33.05
Oslo Composite
1538.67
+1.27
+19.35
+1.27
+0.86
Paris CAC
7420.69
–1.62
–122.49
–1.62
–214.12
–0.30
Santiago Selective
3379.28
–2.55
–88.26
–2.55
+10.04
+0.27
Sao Paulo Bovespa
132022
–1.61
–2162.32
–1.61
+125676
+13.52
2578.08
–2.91
–77.20
–2.91
+2.85
+65.03
+2.85
Shanghai Composite
2929.18
–1.54
–45.75
–1.54
–1.07
–94.07
–1.07
Shenzhen B Share Idx
1066.29
–1.36
–14.71
–1.36
469.11
–1.07
–5.06
–1.07
Singapore FTSE STI
3184.30
–1.73
–55.97
–1.73
4463.51
–1.29
–58.14
–1.29
Stockholm OMXS
877.02
–2.86
–25.86
–2.86
Frankfurt DAX
16594
–0.94
–157.43
–0.94
STOXX Europe 50 SXSP
4097.42
+0.10
+4.05
+0.10
Helsinki OMHX
10271
+1.72
+173.52
+1.72
STOXX Europe 600 SXXP
476.38
–0.55
–2.64
–0.55
7489.10
–1.34
–101.72
–1.34
17519
–2.30
–411.67
–2.30
Buenos Aires Merval
EURO STOXX SXXE
EURO STOXX 50 SXSE
Hong Kong Hang Seng
Seoul Composite
16535
–3.00
–512.06
–3.00
Sydney S&P/ASX 200
Istanbul IMKB
7628.73
+2.12
+158.55
+2.12
Taipel Weighted
Jakarta Composite
+0.10
7372.87
+1.38
+100.07
+1.38
Tel Aviv 125 Index
1912.13
+1.94
+25.05
+1.33
Johannesburg All Share
74488
–3.13
–2404.95
–3.13
Tokyo Nikkei-225
33377
–0.26
–86.75
–0.26
Kuala Lumpur Composite
1487.61
+2.27
+32.95
+2.27
Toronto S&P/TSX
LISBON PSI
4733.17
+0.02
+0.89
+0.02
Vienna ATX
London FTSE - 100
7689.61
–0.56
–43.63
–0.56
10164
+0.62
+62.40
+0.62
Madrid IBEX 35
Manila Composite
Mexico City IPC
6629.64
+2.78
+179.60
+2.78
56192
–2.08
–1193.47
–2.08
20937
–0.10
–20.89
–0.10
3430.08
–0.14
–4.89
–0.14
Wellington S&P/NZX 50
11748
–0.19
–22.01
–0.19
Zurich Swiss
11185
+0.43
+48.11
+0.43
Indexes are based on local currencies. Because of various holidays and other market closings, the most
recent close is not necessarily that of the week of publication.
44
BARRON’S
TOP 500 EXCHANGE-TRADED PORTFOLIOS
D ATA
NOTICE TO READERS: Listed are
the top 500 ETF’s based on weekly
volume.
Name
Tick
Sym
Yld
Last
Div
Chg. Amt.
For personal non-commercial use only. Do not edit or alter. Reproductions not permitted.
To reprint or license content, please contact Barron's reprints department at 800-843-0008 or www.djreprints.com
Bats
ARKGenomicRev
BlkRkUltShBd
DimenIntlCore2
FTVestFdBf
FTS&P500Div
FTUSBuffDec
FTUSBuffJun
GlbXUSInfrDevt
GS PhysGold
InnovDefWealth
InnovNasd100Jan
InnovRuss2000Jan
InnovS&P500Jan
InnovS&P500PwrJ
InnovS&P500PwrA
InnovS&P500PwrJ
InvscRuss1000Dyn
iPathS&P500VIX
iShBrdUSDHYCpBd
iShConvBond
iShCoreMSCIEAFE
iShCurrMSCIEAFE
iShIntlSelDiv
iShUSAero&Def
iShUSHomeConstrn
iShEdgeMSCIMinEAFE
iShEdgeMSCIMinEM
iShEdgeMSCIMinUSA
iShEdgeMSCIUSAMom
iShEdgeMSCIUSAQual
iShExpTechSftwr
iShFRBd
iShIntlAggBd
iShMSCIEurozone
iShMSCIEAFEGrw
iShMSCIIndia
iShMSCIEAFEValue
iSh20+YTrBdBuy
iShUSTelecom
iShUSTreasuryBd
JPMBetaEurope
JPMBetaJapan
-1xShVIXFutures
PacerIntCashCow
PacerGlCashCows
PacerUSCashCows
PacerUSSCCash100
ProShS&P500Arist
ProShShtVIXST
ProShUltVIXST
ProShVIXSTFut
2xBitcoinStrategy
2xLongVIXFut
VanEckAMTFrLgMun
VanEckHYMuni
VanEckMstrWd
VanEckVietnam
VangdUltShrtBd
ARKG ...
ICSH 4.8
DFIC 2.6
BUFR ...
KNG 10.8
FDEC ...
FJUN ...
PAVE .7
AAAU ...
BALT ...
NJAN ...
KJAN ...
BJAN ...
PJUL ...
PAUG ...
PJAN ...
OMFL 1.4
VXX ...
USHY 6.7
ICVT 1.9
IEFA 3.3
HEFA 3.0
IDV 6.5
ITA .9
ITB .5
EFAV 3.1
EEMV 2.8
USMV 1.8
MTUM 1.4
QUAL 1.2
IGV .0
FLOT 5.7
IAGG 3.6
EZU 2.6
EFG 1.7
INDA .2
EFV 4.4
TLTW 19.9
IYZ 2.3
GOVT 2.7
BBEU 3.0
BBJP 3.1
SVIX ...
ICOW 3.6
GCOW 5.2
COWZ 1.9
CALF 1.2
NOBL 2.1
SVXY ...
UVXY ...
VIXY ...
BITX ...
UVIX ...
MLN 3.2
HYD 4.2
MOAT .9
VNM 5.1
VUSB 4.5
31.61
50.39
25.16
26.36
51.24
38.61
43.62
33.39
20.24
28.48
41.04
33.60
40.42
35.86
33.06
36.92
50.28
15.55
36.05
76.72
69.20
31.43
27.89
123.84
98.55
69.18
55.23
77.86
152.64
144.75
386.56
50.69
49.43
46.32
94.06
49.09
52.02
27.10
22.63
22.83
55.73
52.09
37.49
31.35
34.60
51.81
46.73
94.23
103.38
8.42
15.50
24.57
13.68
18.17
51.10
83.02
13.12
49.41
–1.20
+0.02
–0.38
–0.21
–0.44
–0.38
–0.53
–1.07
–0.20
–0.09
–0.65
–0.71
–0.43
–0.33
–0.31
–0.32
–1.13
+0.03
–0.30
–1.87
–1.15
–0.08
–0.10
–2.76
–3.18
–0.16
–0.36
–0.17
–4.25
–2.39
–19.08
+0.07
–0.37
–1.12
–2.79
+0.28
–0.08
–0.37
–0.13
–0.21
–0.86
–0.43
–0.24
+0.11
+0.33
–0.18
–1.30
–0.97
–0.02
–0.02
–0.01
+1.81
–0.05
–0.08
–0.53
–1.85
+0.20
–0.03
...
.2231
.1601
...
.3797
...
...
.156
...
...
...
...
...
...
...
...
.1179
...
.2014
.3723
.9678
.3963
.3728
.4328
.1006
.8214
1.058
.4299
.3593
.4489
.0051
.2528
1.7697
.3513
.6555
.0801
.9574
.746
.1225
.0607
.2563
1.6015
...
.2571
.2821
.2977
.1638
.6558
...
...
...
...
...
.0515
.1811
.7285
.6552
.215
NASDAQ
AXS1.25XNVDABr
AXSShInnovDly
AXS TSLA BrDly
DefNasdaq100Enh
DirexAAPLBear1X
DirexTSLABr1x
DirexTSLABl1.5x
FidNasdaq
FT CapStrength
FT EnhShtMat
FT GlTactCommod
FT LowDurOpp
FT NasdCybersec
FT RisingDivAch
FT SMID CapRising
FT SrLoanFd
FT TCW Opp
GlbXCloudComp
GlbXNasd100Cv
GlbX Robotics&AI
GrShr1.5xLgCoin
InvscActMgdETC
InvscBS28CpBd
InvscBS25CpBd
InvscBS25HYCpBd
InvscBS24CpBd
InvscBS24HYCpBd
InvscBS27CpBd
InvscBS26CpBd
InvscBS26HYCpBd
InvscHYEquDivAch
InvscKBWBank
InvscNasd100
InvscQQQI
iShBiotech
iShBrdUSDInvCpBd
iShCoreMSCITotInt
iShCore1-5YUSDBd
January 8, 2024
NVDS 14.5
SARK 11.7
TSLQ 12.7
QQQY 63.5
AAPD 4.1
TSLS 4.3
TSLL 2.7
ONEQ .7
FTCS 1.5
FTSM 4.6
FTGC 3.3
LMBS 4.0
CIBR .4
RDVY 2.1
SDVY 2.0
FTSL 7.6
FIXD 4.0
CLOU ...
QYLD 11.9
BOTZ .2
CONL ...
PDBC 4.2
BSCS 3.9
BSCP 3.4
BSJP 7.1
BSCO 2.9
BSJO 6.1
BSCR 3.8
BSCQ 3.5
BSJQ 6.6
PEY 4.6
KBWB 3.2
QQQM .7
QQQ .6
IBB .3
USIG 3.9
IXUS 2.3
ISTB 2.9
29.42
27.79
29.28
17.24
21.46
19.68
13.37
57.20
79.51
59.70
22.43
48.23
51.38
51.34
31.92
46.04
44.04
21.32
17.13
26.84
28.14
13.38
20.12
20.43
22.71
20.89
22.68
19.34
19.23
23.05
21.08
49.78
163.32
396.75
136.12
50.55
63.86
47.39
+0.34
+1.83
+1.32
–0.44
+1.27
+0.87
–0.99
–2.04
–0.53
+0.04
–0.01
–0.09
–2.46
–0.33
–0.85
–0.03
–0.56
–1.34
–0.21
–1.66
–5.80
+0.08
–0.16
–0.03
–0.02
...
–0.04
–0.12
–0.07
–0.08
–0.06
+0.59
–5.22
–12.77
+0.27
–0.71
–1.07
–0.17
4.2717
3.2644
3.7319
.62
.264
.2292
.1253
.112
.4313
.253
.2115
.20
.1658
.3421
.1844
.3025
.165
...
.1659
.0041
...
.5601
.0729
.0667
.2186
.053
.1112
.0683
.0632
.1381
.1206
.3877
.3807
.8083
.124
.1816
1.0484
.1459
Name
iShCoreS&PUSGrw
iShCoreS&PUSVal
iShCoreTotUSDBd
iShESGAwareEM
iShESGAwareUSA
iShESGUSDCorpBd
iShFallAngelUSDBd
iSh5-10YIGCpBd
iShGlbCleanEner
iShGlbInfr
iShiBdsDec25Trea
iShiBdsDec24Trea
iShJPMUSDEmBd
iShMBS
iShMSCIACWI
iShMSCIACWIxUS
iShMSCIACxJpn
iShMSCIBrazilSC
iShMSCIChina
iShMSCIEAFESC
iShMSCIEMxChina
iShMSCIEurFinls
iSh1-5YIGCpBd
iSh1-3YTreaBd
iShPfd&Incm
iShSelectDiv
iShSemiconductor
iSh7-10YTreaBd
iShShortTreaBd
iSh3-7YTreaBd
iSh20+YTreaBd
iSh0-5YIGCpBd
JPMNasdEqPrem
ProShUltPrQQQ
ProShUltShQQQ
T-Rex2XLgTesla
USTrea3mBill
ValkyrieBitcoin
VanEckDigTrans
VanEckGlFallAngHY
VanEckSemicon
VangdIntrCorpBd
VangdIntermTrea
VangdIntlHiDiv
VangdLTCorpBd
VangdLongTrea
VangdMBS
VangdRuss1000Grw
VangdRuss1000Val
VangdRuss2000
VangdSTCpBd
VangdShtTmInfltn
VangdShortTrea
VangdTotalBd
VangdTotIntlBd
VangdTotIntlStk
WT CloudComp
WT USQltyDiv
Tick
Sym
Yld
IUSG 1.2
IUSV 1.8
IUSB 3.4
ESGE 2.4
ESGU 1.5
SUSC 3.8
FALN 5.3
IGIB 3.8
ICLN 1.1
IGF 2.5
IBTF 4.0
IBTE 4.2
EMB 4.8
MBB 3.4
ACWI 1.6
ACWX 2.4
AAXJ 1.5
EWZS 3.4
MCHI 2.0
SCZ 1.7
EMXC 2.2
EUFN 3.8
IGSB 3.2
SHY 2.9
PFF 7.3
DVY 3.8
SOXX .8
IEF 2.9
SHV 4.6
IEI 2.3
TLT 3.4
SLQD 3.0
JEPQ 10.2
TQQQ 1.4
SQQQ 7.3
TSLT ...
TBIL 5.0
WGMI .3
DAPP ...
ANGL 5.3
SMH ...
VCIT 3.8
VGIT 2.7
VYMI 4.6
VCLT 4.8
VGLT 3.4
VMBS 3.3
VONG .7
VONV 2.1
VTWO 1.5
VCSH 3.1
VTIP 2.9
VGSH 3.3
BND 3.1
BNDX 4.5
VXUS 3.3
WCLD ...
DGRW 1.8
Last
101.09
84.19
45.58
31.33
103.04
22.91
26.20
51.29
14.80
47.15
23.25
23.87
87.17
92.97
100.08
50.21
64.82
14.51
39.43
60.51
54.54
20.84
51.03
81.89
31.12
118.05
541.84
95.33
110.19
116.38
96.29
49.02
49.15
45.98
14.80
22.34
49.90
16.85
9.54
28.54
166.08
80.16
58.89
66.28
78.10
60.07
45.77
75.87
72.24
78.09
77.01
47.38
58.21
72.75
48.91
57.01
32.53
69.60
Div
Chg. Amt.
–3.01
–0.14
–0.49
–0.73
–1.88
–0.36
–0.20
–0.71
–0.77
+0.10
–0.03
+0.01
–1.89
–1.11
–1.69
–0.83
–1.75
–0.55
–1.31
–1.39
–0.87
–0.12
–0.24
–0.15
–0.07
+0.83
–34.26
–1.06
+0.06
–0.75
–2.59
–0.18
–0.78
–4.72
+1.35
–2.23
+0.04
–1.15
–0.74
–0.24
–8.79
–1.12
–0.43
–0.21
–2.05
–1.46
–0.59
–2.15
–0.30
–3.01
–0.37
–0.11
–0.12
–0.80
–0.46
–0.95
–2.42
–0.68
.3268
.4104
.1454
.6208
.3371
.0799
.1316
.1769
.1228
.9069
.0841
.0915
.3643
.2804
.9624
.7141
1.1081
.2451
.9941
.8304
.6371
.3201
.1628
.2597
.1752
1.1893
.3744
.2816
.4853
.2917
.3105
.1367
.3925
.2234
.2829
...
.2189
.055
...
.1413
...
.2754
.1674
.8644
.3286
.1898
.1419
.1653
.4619
.4012
.2312
.6375
.1949
.2105
1.3568
.8471
...
.215
BOND 4.1 91.51 –0.94
.34
NYSE
PimcoActiveBd
NYSE ARCA
AGF USMktNeut
ARK Innovation
ARK NextGen
abrdnBbgAllCmdK1
abrdnPhysGold
abrdnPhysSilver
AdvShMSOS2xDly
AdvShPureUSCan
AlerianMLPETF
AllianzUSLCBf20J
ArkFinInnov
AvantisUSSCValue
CapGrpCore
CapGrpCorePlus
CapGrpDivVal
CapGrpGlbGrw
CapitalGrpGrw
CapGrpIntlFocus
CommSvsSPDR
CnsmrDiscSel
ConsStaplesSPDR
DefR2000EnhOpt
DimenCoreFxIncm
DimenEmgCore
DimenEMCore2
DimenIntlCore
DimenIntlValue
DimenShDurFix
DimenUSCore
DimenUSCoreEq2
DimenUSEquity
DimenUSHiProf
DimenWorldexUS
DirexCSIChinaInt
DirexDJBear3X
DirexDJBull3X
DirexEnerBull2x
DirexChinaBr3
DirexChinaBl3
DirexFinlBear3
DirexFinlBull3
DirexGoldMinBr2
BTAL 1.2
ARKK ...
ARKW ...
BCI 3.9
SGOL ...
SIVR ...
MSOX ...
MSOS ...
AMLP 7.8
JANW ...
ARKF ...
AVUV 1.7
CGUS 1.2
CGCP 5.0
CGDV 1.7
CGGO .8
CGGR .4
CGXU 1.0
XLC .8
XLY .8
XLP 2.6
IWMY 69.8
DFCF 4.6
DFAE 2.5
DFEM 2.4
DFAI 2.7
DFIV 3.9
DFSD 3.9
DFAU 1.3
DFAC 1.2
DFUS 1.3
DUHP 1.5
DFAX 3.1
CWEB 2.9
WEBS 7.6
WEBL .0
ERX 3.1
YANG 3.3
YINN 4.6
FAZ 4.9
FAS 1.8
DUST 3.5
17.71
48.90
71.02
19.38
19.53
22.18
4.60
7.91
42.99
30.05
25.63
87.47
27.84
22.46
29.48
25.20
27.62
23.43
72.04
172.62
72.01
19.35
41.95
23.71
24.59
28.22
34.31
46.78
32.66
28.66
50.89
28.19
24.07
30.53
9.50
13.53
57.66
14.07
18.83
13.58
83.08
11.10
+0.76
–3.47
–4.88
+0.02
–0.21
–0.59
+0.98
+0.90
+0.47
–0.25
–1.95
–2.33
–0.46
–0.23
–0.36
–0.53
–0.61
–0.44
–0.62
–6.19
–0.02
–0.50
–0.45
–0.40
–0.37
–0.42
–0.05
–0.23
–0.59
–0.57
–0.94
–0.43
–0.35
–2.79
+0.98
–1.63
+1.09
+1.27
–2.11
–0.09
+0.43
+0.91
1.0409
...
...
.7614
...
...
...
...
.88
...
...
.4379
.1017
.1291
.1668
.1126
.0612
.0963
.1737
.3204
.5364
1.00
.2733
.0932
.1223
.1718
.3344
.3023
.1342
.1033
.2338
.1376
.1767
.4686
.1701
.0001
.3736
.1403
.3926
.0801
.3829
.0638
Name
DirexGoldMinBl2
DirexJrGoldMinBr2
DirexJrGoldMnBl2
DirexRealEstBr3
DirexRealEstBl3
DirexRegBksBl3x
DirexRetailBull3
DirexS&P500Br3
DirexS&PBiotBr3
DirexS&PBiotBl3
DirexS&P500Br1
DirexS&P500Bl3
DirexHiBetaBear3X
DirexS&POilBr2
DirexS&POilBl2
DirexSemiBr3x
DirexSemiBl3
DirexScBear3
DirexSCBull3
DirexKRBull3
DirexTechBear3
DirexTechBull3
Direx20+TreaBr3
Direx20+YrTrBull
ETFMGAltHarvest
ETFMGPrmJrSilv
EnSelSectorSPDR
FidMSCIEn
FidTotalBd
FinSelSectorSPDR
FT DJ Internet
FT EnergyAlpDx
FT InstPfdSecs
FT MstarDiv
FT PfdSecs
FT TCWUnPlBd
FT ValLineDiv
FlexGlbUpNatRsc
FrankFTSEJapan
GlbXLithium
GlbXRuss2000Cvr
GlbXS&P500Cv
GlbXSilverMiners
GlbX US Pfd
GlbX Uranium
GSTreasury0-1Y
GSActBetaIntlEq
GSActiveBetaUSLC
GrShrGold
HealthCrSelSect
iMGPDBiMgdFut
IndSelSectorSPDR
InvscDBComm
InvscDBAgriFd
InvscDBOilFund
InvscDBUSDBull
Tick
Sym
Yld
NUGT 1.5
JDST 3.9
JNUG 1.8
DRV 5.1
DRN 3.0
DPST 1.9
RETL 1.5
SPXS 5.4
LABD 6.1
LABU .3
SPDN 5.7
SPXL 1.0
HIBS 5.8
DRIP 5.1
GUSH 3.0
SOXS 7.7
SOXL .6
TZA 4.9
TNA 1.4
KORU 2.9
TECS 6.6
TECL .3
TMV 3.6
TMF 3.1
MJ 3.4
SILJ .0
XLE 3.5
FENY 3.3
FBND 4.3
XLF ...
FDN ...
FXN 3.1
FPEI 5.8
FDL 4.5
FPE 6.1
UCON 4.8
FVD 2.3
GUNR 3.6
FLJP 3.0
LIT 1.2
RYLD 12.8
XYLD 10.5
SIL .6
PFFD 6.5
URA 6.2
GBIL 4.8
GSIE 2.9
GSLC 1.4
BAR ...
XLV 1.6
DBMF 11.6
XLI 1.7
DBC 4.9
DBA 4.7
DBO 4.5
UUP 6.4
Last
31.99
6.09
30.50
36.34
9.98
92.93
8.03
12.14
9.67
121.56
13.52
98.93
30.57
11.35
32.50
6.92
25.93
22.32
35.01
8.26
11.27
58.15
32.11
59.41
3.44
9.51
84.68
23.23
45.50
37.75
179.96
16.74
17.70
36.50
16.77
24.58
40.38
40.55
27.76
48.42
16.48
39.35
26.99
19.39
26.96
99.83
32.29
92.37
20.20
139.12
25.87
111.43
22.13
20.58
14.22
27.41
Div
Chg. Amt.
–2.79
+0.59
–3.39
+1.97
–0.64
–4.30
–1.09
+0.59
–0.02
–0.41
+0.23
–5.06
+3.45
+0.06
–0.20
+1.10
–5.47
+2.37
–4.44
–1.12
+1.38
–8.56
+2.50
–5.17
+0.21
–0.49
+0.84
+0.19
–0.54
+0.15
–6.59
+0.05
–0.13
+0.62
–0.09
–0.16
–0.18
–0.40
–0.23
–2.52
–0.26
–0.09
–1.38
–0.01
–0.73
+0.09
–0.37
–1.44
–0.19
+2.74
+0.11
–2.56
+0.09
–0.16
+0.31
+0.32
.3292
.0243
.1207
.4217
.0701
.4438
.0293
.1042
.0846
.2097
.2117
.3038
.3332
.0891
.207
.0697
.0632
.1106
.2184
.1505
.1227
.0709
.2699
.4973
.0558
.0009
.8021
.20
.185
...
...
.1083
.0871
.5172
.0857
.11
.2928
.4594
.4778
.3575
.1667
.2896
.1374
.105
1.6816
.4685
.1495
.4061
...
.5977
.7496
.6146
1.0893
.9604
.6385
1.7455
Name
InvscEMSovDebt
InvscFTSEUS1000
InvscFundHYCpBd
InvscNatAMTFrMuni
InvscPreferred
InvscS&P500EW
InvscS&P500EWTech
InvscS&P500GARP
InvscS&P500HiBeta
InvscS&P500HiDiv
InvscS&P500LowVol
InvscS&P500Qual
InvscS&P500Top50
InvscSrLoan
InvscSolar
InvscUltShDur
InvscVarRtPfd
iShChinaLC
iShCoreDivGrowth
iShGrwthAlloc
iShCoreHiDiv
iShCoreMSCIEM
iShCoreMSCIEur
iShMSCIIntlDev
iShModAllocation
iShCoreS&P500
iShCoreS&P MC
iShCoreS&P SC
iShCoreS&PTotUS
iShCoreUSAggBd
iShUSMedDevices
iShESGUSAggBd
iShGlobalEnergy
iShGlobalREIT
iShGoldTr
iShGoldTrMicro
iShiBdsDec28Cp
iShiBdsDec25Cp
iShiBdsDec24Cp
iShiBdsDec29Cp
iShiBdsDec27Cp
iShiBdsDec26Cp
iShiBoxx$HYCpBd
iShiBoxx$IGCpBd
iShLatinAmer40
iShMSCIAustralia
iShMSCIBrazil
iShMSCICda
iShMSCI EAFE
iSh MSCI EM
iShMSCIFrance
iShMSCIGermany
iShMSCIHongKong
iShMSCIIndonesia
iShMSCIIntlQual
iShMSCIJapan
Tick
Sym
PCY
PRF
PHB
PZA
PGX
RSP
RSPT
SPGP
SPHB
SPHD
SPLV
SPHQ
XLG
BKLN
TAN
GSY
VRP
FXI
DGRO
AOR
HDV
IEMG
IEUR
IDEV
AOM
IVV
IJH
IJR
ITOT
AGG
IHI
EAGG
IXC
REET
IAU
IAUM
IBDT
IBDQ
IBDP
IBDU
IBDS
IBDR
HYG
LQD
ILF
EWA
EWZ
EWC
EFA
EEM
EWQ
EWG
EWH
EIDO
IQLT
EWJ
Yld
6.7
1.9
4.7
2.9
7.2
1.7
.6
1.3
.8
4.4
2.4
1.4
1.0
8.6
...
5.0
6.6
2.6
2.5
2.5
3.8
2.9
3.2
3.1
2.8
1.5
1.5
1.4
1.5
3.2
.5
3.3
3.4
3.3
...
...
4.1
3.3
3.0
4.3
3.8
3.4
5.8
4.1
4.7
3.8
5.7
2.3
3.0
2.7
2.8
2.6
4.5
2.9
2.3
2.1
Last
19.98
34.97
17.98
24.13
11.45
155.71
31.13
96.22
79.09
43.05
62.91
53.21
37.09
21.14
48.29
49.88
23.01
23.23
53.68
52.44
103.79
49.68
54.05
62.66
40.98
470.12
270.50
104.39
103.32
98.20
53.25
47.23
39.55
23.82
38.66
20.39
24.89
24.72
24.91
22.83
23.78
23.80
76.68
108.66
28.69
23.80
34.46
36.37
74.17
39.44
38.08
29.03
16.67
22.59
36.73
63.53
B A R R ON S .C OM / D ATA
Div
Chg. Amt.
–0.64
–0.23
–0.15
–0.05
–0.02
–2.09
–1.51
–1.82
–3.31
+0.64
+0.25
–0.87
–0.63
–0.04
–5.06
...
–0.07
–0.80
–0.14
–0.75
+1.80
–0.90
–0.97
–1.00
–0.53
–7.51
–6.65
–3.86
–1.91
–1.05
–0.72
–0.51
+0.44
–0.36
–0.37
–0.21
–0.20
–0.04
...
–0.24
–0.15
–0.10
–0.71
–2.00
–0.37
–0.54
–0.50
–0.31
–1.18
–0.77
–1.10
–0.66
–0.70
+0.27
–0.83
–0.61
.1156
.1809
.0927
.064
.0689
.6091
.0472
.4031
.1693
.1693
.1405
.197
.088
.1473
...
.3925
.1667
.6074
.3701
.5244
.9768
.977
.5676
.8684
.4484
1.9253
.2412
.2827
.473
.2823
.097
.1446
.6362
.2395
...
...
.0938
.0746
.0687
.084
.0763
.0755
.3785
.3927
.8603
.4883
1.221
.4859
.9307
.748
.2515
.0015
.4295
.1758
.3689
.8746
Selected ETF Leaders
-0.94%
-1.48
-1.54
-1.59
-1.61
-1.73
-3.11
-3.57
SPDR Gold Shares
(GLD)
-1.09
Vanguard Total Bond
Market (BND)
-1.13
Vanguard Dividend
Appreciation (VIG)
Vanguard FTSE
Emerging Markets
(VWO)
SPDR S&P 500 ETF
Trust (SPY)
Vanguard FTSE
Developed Markets
(VEA)
iShares Core MSCI
EAFE (IEFA)
Vanguard Total Stock
Market (VTI)
Invesco QQQ Trust
(QQQ)
iShares Core S&P
Small Cap (IJR)
Source: Barron’s Statistics
Name
iShMSCIMalaysia
iShMSCIMexico
iShMSCIPacxJpn
iShMSCISaudiArabia
iShMSCISthKorea
iShMSCISpain
iShMSCISwitz
iShMSCITaiwan
iShMSCIUK
iShMSCIWorldETF
iShNatlMuniBd
iShRuss2000Val
iShRuss3000
iShRussMC
iShRussMCGrw
iShRussMCVal
iShRuss1000
iShRuss1000Grw
iShRuss1000Val
iShRussTop200Gr
iShRuss2000
iShRuss2000Gw
iShS&PMC400Growth
iShS&P500Grw
iShS&P500Value
iShS&PGSCIComm
iShS&PMC400Value
iShS&PSC600Value
iShShtNatlMuniBd
iShSilver
iShTIPSBond
iSh10-20YTreasBd
iSh10+YIGCpBd
iShTreaFRBd
iShUS Energy
iShUSRealEst
iShUSTech
iSh0-5YHYCpBd
iSh0-5YTIPSBd
iSh0-3MTreaBd
JPM AlerianMLP
JanusHendersonAAA
JanusHendMtg
JanusHenShrtDur
JPM EqPrem
JPM IntlResearch
JPM USQualFactor
JPM UltShIncm
KraneCSICnInt
MAXS&P5004X
MatlsSelSector
MicroFang-3xInv
MicroFANG-3XInvr
MicroFang+3x
MicroGold3XInvr
MicroGold3xLvgd
MicroUSBigBk3X
MicroUSBigBk3X
PGIMUltraShBd
PimcoEnhShMat
Pimco15+USTips
PrincipalSpectPfd
ProShBitcoin
ProShShBitcoin
ProShShtDow30
ProShShrtQQQ
ProShShRuss2000
ProShShrtS&P500
ProShSh20+Tr
ProShUltBlmCrude
ProshUltBbgNtGas
ProShUltraQQQ
ProShUltRus2000
ProShUltraS&P
ProShUltSilver
ProShUltDow30
ProShUltRus2000
ProShUltS&P500
ProShUltShDow30
ProShShtRus2000
ProShUltSh&P500
ProShUltBloomCrd
ProShUltShBlmGas
ProShUltDow30
ProShUltShQQQ
ProShUltShRus2000
ProShUltShS&P500
ProShUltShSilver
ProShUltraSh20+
PutnamSustLdrs
RealEstSectorSPDR
RoundBallMeta
SPDRBlackSrLoan
SPDRBlmCvSecs
SPDR Blm HY Bd
SPDRBbgIntTrBd
SPDRBlmInvGrdFR
SPDRBbg1-3MTB
SPDRBlmSTHYBd
SPDR DJIA Tr
SPDREuroStx50
SPDRGoldMini
SPDR Gold
SPDR MSCI exUS
SPDRNuvBBHYMuni
Tick
Sym
Yld
EWM 3.4
EWW 2.2
EPP 4.2
KSA 2.4
EWY 2.6
EWP 2.7
EWL 2.1
EWT 4.0
EWU 4.2
URTH 1.7
MUB 2.7
IWN 2.1
IWV 1.3
IWR 1.5
IWP .6
IWS 1.8
IWB 1.3
IWF .6
IWD 2.0
IWY .7
IWM 1.4
IWO .8
IJK 1.2
IVW 1.1
IVE 1.7
GSG ...
IJJ 1.7
IJS 1.5
SUB 1.7
SLV ...
TIP 2.7
TLH 3.9
IGLB 4.7
TFLO 4.9
IYE 3.0
IYR 2.8
IYW .3
SHYG 6.6
STIP 2.8
SGOV 4.1
AMJ 6.5
JAAA 6.1
JMBS 4.4
VNLA 4.0
JEPI 8.4
JIRE 2.8
JQUA 1.2
JPST 2.2
KWEB 1.8
XXXX ...
XLB 2.0
BERZ ...
FNGD ...
FNGU ...
GDXD ...
GDXU ...
BNKD ...
BNKU ...
PULS 5.5
MINT 4.8
LTPZ 4.3
PREF 4.7
BITO 14.5
BITI 3.5
DOG 4.5
PSQ .5
RWM .4
SH 5.3
TBF 4.9
UCO ...
BOIL ...
QLD .1
UWM .4
SSO .2
AGQ ...
UDOW 1.0
URTY .3
UPRO .8
SDOW .5
SRTY 4.4
SPXU 6.7
SCO ...
KOLD ...
DXD 2.0
QID .3
TWM 4.4
SDS 5.6
ZSL ...
TBT 4.7
PLDR .6
XLRE 3.4
METV .1
SRLN 8.2
CWB 2.0
JNK 6.5
BWX 1.7
FLRN 5.5
BIL 4.9
SJNK 7.3
DIA 1.8
FEZ 2.8
GLDM ...
GLD ...
CWI 2.8
HYMB 4.1
Last
21.46
66.88
42.26
42.99
62.88
30.57
47.70
44.39
32.82
130.86
108.07
150.20
268.93
76.06
100.82
114.37
257.93
294.77
164.57
170.47
193.25
241.56
76.95
72.98
173.78
20.33
111.65
99.49
105.31
21.21
106.77
105.80
51.36
50.52
44.45
89.66
117.62
42.00
98.38
100.36
25.62
50.37
45.39
48.30
54.75
57.53
47.13
50.25
25.88
27.06
84.34
4.42
6.47
208.59
4.59
29.16
5.95
25.06
49.43
99.91
55.62
17.51
21.41
12.50
29.92
9.79
21.91
13.21
22.71
27.47
35.39
71.26
35.21
62.95
25.67
72.85
41.26
52.10
18.77
33.82
9.04
19.77
76.30
34.40
11.31
12.56
30.93
19.22
31.94
26.58
39.29
10.98
41.84
70.73
93.88
22.74
30.62
91.47
24.99
374.64
46.61
40.52
189.35
26.66
25.15
Div
Chg. Amt.
+0.21
–0.97
–1.15
+0.66
–2.65
–0.05
–0.57
–1.64
–0.23
–2.16
–0.34
–5.13
–4.81
–1.67
–3.64
–1.92
–4.33
–8.40
–0.68
–4.75
–7.46
–10.66
–2.27
–2.12
–0.11
+0.27
–2.39
–3.58
–0.12
–0.57
–0.72
–2.46
–1.33
+0.05
+0.33
–1.75
–5.13
–0.22
–0.21
+0.09
+0.26
+0.07
–0.55
–0.02
–0.23
–0.91
–0.73
+0.02
–1.12
–1.90
–1.20
+0.49
+0.64
–24.30
+0.53
–4.23
–0.23
+0.76
+0.04
+0.12
–1.06
...
+0.92
–0.65
+0.22
+0.31
+0.83
+0.22
+0.60
+1.37
+6.95
–4.74
–2.84
–2.12
–1.50
–1.51
–5.11
–2.64
+0.38
+3.60
+0.44
–1.12
–20.11
+0.46
+0.70
+0.91
+1.01
+0.98
+1.74
–0.51
–0.77
–0.53
–0.09
–1.42
–0.85
–0.44
+0.03
+0.08
–0.15
–2.23
–1.20
–0.39
–1.82
–0.38
–0.15
.3715
1.0273
.966
.5432
1.651
.4748
1.0215
5.527
.7471
1.0894
.2544
.8976
1.0611
.3389
.1533
.5866
.9764
.6037
.9625
.3874
.7339
.583
.2687
.2126
.7939
...
.5422
.2183
.1649
...
.2557
.3542
.212
.2315
.3579
.7666
.231
.2326
.2237
.4545
.4354
.2962
.19
.167
.4278
1.5991
.1928
.2367
.4193
...
.5912
...
...
...
...
...
...
...
.2397
.465
.17
.0667
.1472
.0379
.4085
.1904
.3502
.2355
.3983
...
...
.0782
.1141
.1181
...
.1447
.0847
.1194
.2532
.4869
.1817
...
...
.384
.2055
.2335
.5841
...
.5226
.1516
.4208
.0191
.33
.2107
.527
.028
.157
.4213
.1423
.7069
.119
...
...
.3462
.0859
Name
SPDRNuveenMuniBd
SPDRNuveenSTMuni
SPDRPtfAggBd
SPDRPtfDevxUS
SPDRPtfEM
SPDR PtfHYBd
SPDRPtfIntermCpBd
SPDR PtfIntTrea
SPDRPtfLTCorpBd
SPDRPtfLtTrea
SPDRPtfMtgBkdBd
SPDRS&P500Value
SPDRPtfS&P1500
SPDRPtfS&P500
SPDRS&P500Growth
SPDRS&P500HiDiv
SPDRPtfS&P400MC
SPDRPtfS&P600SC
SPDRPtfSTCpBd
SPDRShtTermTrea
SPDR PtfTIPS
SPDRS&PBank
SPDR S&P 500
SPDR S&P400 MCV
SPDR S&P Home
SPDRS&PInsurance
SPDR S&P Metals
SPDRS&PRegBkg
SPDRSSgAMultAsst
SchwabEM Equity
Schwab5-10YCpBd
SchwabFundEmgLrg
SchwabFundIntLrg
SchwabFundUSLrg
SchwabFundUSSmCo
SchwabIntmUSTrsr
SchwabIntEquity
SchwabIntlSC
SchwabSrtTRmUST
SchwabUS AggrBd
SchwabUS BrdMkt
SchwabUS Div
SchwabUS LC
SchwabUS LC Grw
SchwabUS LC Val
SchwabUS MC
SchwabUS REIT
SchwabUS SC
Schwab US TIPs
SimplifySTTrea
SimplifyTailRisk
SimplifyVolPrem
SPDR S&PMdCpTr
SPDR S&P Biotch
SPDR S&P Div
SPDRS&POil&Gas
SPDR S&P Retail
SprottUranium
TechSelectSector
TeucriumWheatFd
TortoiseNAPipeln
USGlobalJets
UtilitiesSelect
VanEckBDCIncm
VanEckGoldMin
VanEckJPMEMLCBd
VanEckJrGoldMin
VanEckMerkGoldTr
VanEckPfdxFin
VangdExtMkt
VangdInfoTech
VangdSC Val
VangdDivApp
VangdEnergy
VangdExtDuratn
VangdFTSEAWxUS
VangdFTSEDevMk
VangdFTSE EM
VangdFTSE Europe
VangdFTSE Pac
VangdFinls
VangdGrowth
VangdHiDiv
VangdIntermBd
VangdLongTermBd
VangdMC
VangdMC Val
VangdRealEst
VangdS&P500ETF
VangdST Bond
VangdSC
VangdTaxExemptBd
VangdTotalStk
VangdTotWrldStk
VangdValue
VirtusInfrUSPfd
WT FRTrea
WT IndiaEarn
WT JapanHdg
XtrkEMCarbonRed
XtrkHarvCSI300
XtrkMSCIEAFE
XtrkUSDHYCpBd
YieldMaxCoinOpt
YieldMaxTSLAOpt
Tick
Sym
Yld
TFI 2.4
SHM 1.1
SPAB 3.3
SPDW 2.8
SPEM 2.8
SPHY 7.3
SPIB 3.9
SPTI 3.0
SPLB 4.7
SPTL 3.3
SPMB 3.2
SPYV 1.7
SPTM 1.5
SPLG 1.5
SPYG 1.2
SPYD 4.6
SPMD 1.5
SPSM 1.7
SPSB 4.1
SPTS 3.6
SPIP 3.9
KBE 2.8
SPY 1.4
MDYV 1.6
XHB .8
KIE 1.4
XME 1.0
KRE 3.0
RLY 3.7
SCHE 3.9
SCHI 4.3
FNDE 4.8
FNDF 3.4
FNDX 1.8
FNDA 1.4
SCHR 3.2
SCHF 3.0
SCHC 3.0
SCHO 3.8
SCHZ 3.3
SCHB 1.4
SCHD 3.5
SCHX 1.4
SCHG .5
SCHV 2.4
SCHM 1.5
SCHH 3.3
SCHA 1.5
SCHP 3.0
TUA 4.9
CYA 132.1
SVOL 16.4
MDY 1.2
XBI .0
SDY 2.7
XOP 2.6
XRT 1.5
URNM 3.7
XLK .8
WEAT ...
TPYP 4.8
JETS ...
XLU 3.3
BIZD 10.7
GDX 1.7
EMLC 6.0
GDXJ .8
OUNZ ...
PFXF 7.9
VXF 1.3
VGT .7
VBR 2.2
VIG 1.9
VDE 3.3
EDV 3.7
VEU 3.4
VEA 3.2
VWO 3.6
VGK 3.2
VPL 3.2
VFH 2.1
VUG .6
VYM 3.1
BIV 3.1
BLV 4.2
VO 1.5
VOE 2.3
VNQ 4.0
VOO 1.5
BSV 2.5
VB 1.6
VTEB 2.8
VTI 1.5
VT 2.1
VTV 2.5
PFFA 9.6
USFR 5.1
EPI .1
DXJ 3.4
EMCR 2.0
ASHR 2.6
DBEF 4.5
HYLB 5.9
CONY 95.2
TSLY 79.2
Last
46.93
47.77
25.37
33.46
34.93
23.16
32.56
28.35
23.19
28.32
21.80
46.64
57.48
55.06
63.18
39.46
47.53
40.62
29.71
29.00
25.58
45.67
467.92
71.87
92.42
45.77
58.17
51.73
27.12
24.41
44.39
26.70
33.43
61.49
53.36
49.37
36.39
34.00
48.36
46.13
54.67
76.37
55.48
80.68
69.83
73.47
20.38
45.55
51.77
22.81
.19
22.78
495.11
89.30
124.10
136.60
69.40
47.38
184.12
5.88
26.19
18.77
64.53
16.40
29.77
25.09
35.98
19.77
17.19
158.65
462.29
175.89
168.47
118.23
77.91
55.28
47.13
40.49
63.37
70.76
92.12
301.39
111.87
75.52
72.71
228.12
143.95
86.61
429.98
76.70
206.87
50.84
233.12
101.13
149.62
20.64
50.30
41.45
90.35
27.01
23.04
36.91
35.23
23.46
10.96
Div
Chg. Amt.
–0.07
–0.02
–0.27
–0.55
–0.48
–0.22
–0.27
–0.21
–0.60
–0.70
–0.27
+0.01
–0.97
–0.84
–1.88
+0.27
–1.19
–1.56
–0.07
–0.05
+0.01
–0.35
–7.39
–1.51
–3.24
+0.55
–1.66
–0.70
–0.10
–0.38
–0.55
–0.44
–0.30
–0.45
–1.99
–0.35
–0.57
–0.89
–0.09
–0.49
–1.00
+0.24
–0.92
–2.28
–0.27
–1.85
–0.33
–1.69
–0.43
–0.34
–0.01
...
–12.27
+0.01
–0.87
–0.31
–2.92
–0.89
–8.36
–0.09
+0.25
–0.26
+1.20
+0.36
–1.24
–0.26
–1.93
–0.19
+0.01
–5.77
–21.71
–4.08
–1.93
+0.95
–3.12
–0.86
–0.77
–0.61
–1.11
–1.27
–0.14
–9.49
+0.24
–0.86
–1.87
–4.52
–1.06
–1.75
–6.82
–0.32
–6.46
–0.21
–4.10
–1.75
+0.12
–0.07
+0.06
+0.45
+2.37
–0.69
–0.87
–0.07
–0.32
–5.43
–0.97
.1079
.0583
.0796
.3504
.5469
.156
.1235
.0848
.0909
.0822
.0613
.2311
.2313
.2212
.2048
.534
.1881
.2986
.1267
.1067
.0663
.3432
1.9061
.3023
.1877
.2191
.0962
.4313
.5469
.8224
.1683
1.0175
.7692
.3186
.2536
.1338
.7038
.8612
.1566
.1334
.2243
.7423
.2236
.1037
.4816
.3406
.2245
.2331
.1369
.1182
.0115
.3078
1.8908
.0139
.9782
1.0364
.326
1.751
.422
...
.298
...
.5972
.4679
.5001
.1314
.2736
...
.1874
.6768
.7946
1.1538
.9156
1.06
.737
.843
.6097
.8649
.4571
1.2995
.5402
.5847
1.0995
.2249
.2617
1.1834
1.1142
1.0683
1.8011
.195
1.0769
.1283
1.0017
.8008
1.0308
.165
.2361
.06
1.61
.2859
.5925
.0342
.1715
2.6932
.5565
January 8, 2024
45
BARRON’S
MARKET LABORATORY
D ATA
B A R R ON S .C OM / D ATA
DJ Half-Hourly Averages
The Dow Jones Averages
Daily
For personal non-commercial use only. Do not edit or alter. Reproductions not permitted.
To reprint or license content, please contact Barron's reprints department at 800-843-0008 or www.djreprints.com
Industrials
37950
Components
Week's
Change
3M
American Express
Amgen
Apple
Boeing
Caterpillar
Chevron
Cisco Systems
Coca-Cola
Disney
Dow
Goldman Sachs
Home Depot
Honeywell International
IBM
Intel
Johnson & Johnson
JPMorgan Chase
McDonald's
Merck
Microsoft
Nike Cl B
Procter & Gamble
Salesforce
Travelers
UnitedHealth Group
Verizon Communications
Visa Cl A
Walgreens Boots Alliance
Walmart
-0.73
1.72
14.98
-11.35
-11.66
-6.74
1.24
-0.43
0.74
0.61
-0.02
0.67
-3.61
-6.18
-4.39
-3.36
4.39
2.17
-7.52
8.20
-8.29
-6.49
0.88
-12.02
2.58
10.91
2.50
-0.66
-1.10
-0.94
37100
36250
35400
Components
Alaska Air Group
American Airlines Group
Avis Budget Group
CH Robinson Worldwide
CSX
Delta Air Lines
Expeditors Intl of Wash
FedEx
JB Hunt Transport
JetBlue Airways
Kirby Corp
Landstar System
Matson
Norfolk Southern
Old Dominion Freight Line
Ryder System
Southwest Airlines
Union Pacific
United Airlines
United Parcel Service B
-1.12
-0.14
-11.22
2.20
-0.05
0.31
1.32
-6.16
-9.77
0.03
-0.09
-9.15
5.22
-7.36
-21.56
-2.53
0.27
-5.71
0.50
1.49
34550
33700
32850
32000
July
August
September
October
November
December January
16855
16460
15670
15275
14880
14485
14090
13695
13300
August
September
October
November
December January
Utilities
AES
American Elec Power
American Water Works
Atmos Energy
Consolidated Edison
Dominion Energy
Duke Energy
Edison International
Exelon
FirstEnergy
NextEra Energy
Public Svc Enterprise
Sempra
Southern
Xcel Energy
…
…
…
…
…
…
…
…
…
…
…
…
…
…
…
…
…
…
…
…
Market Advance/Decline Volumes
2
3
4
5
37505.65
37566.22
37663.93
37656.75
37695.43
37684.76
37745.24
37749.65
37762.42
37733.99
37702.23
37672.74
37607.27
37616.47
37715.04
38015.22
37255.17
37790.08
37495.91
+25.50
37604.05
37629.23
37523.77
37497.54
37446.97
37478.74
37471.35
37487.74
37552.44
37573.99
37537.25
37603.27
37557.07
37477.63
37430.19
37809.88
37228.48
37629.23
37401.85
–284.85
37477.18
37425.28
37558.44
37599.60
37630.71
37696.92
37637.50
37575.13
37542.21
37571.33
37553.22
37533.53
37553.56
37504.53
37440.34
37804.97
37266.38
37716.41
37425.28
+10.15
37434.60
37455.46
37482.72
37536.45
37556.68
37503.86
37446.24
37349.29
37366.16
37432.68
37476.97
37474.24
37386.06
37413.01
37466.11
37748.29
37165.34
37623.62
37323.82
+25.77
1015
Week's
Change
-0.45
2.85
-0.10
2.08
2.55
2.04
1.50
1.08
0.41
1.47
1.34
0.58
1.70
1.49
1.82
960
905
850
795
740
July
August
September
October
November
December January
Note: Theoretical highs and lows are shown. A red chart indicates a lower price than the starting period. Green means it's higher than the starting period.
15474.28
15477.35
15501.86
15584.72
15602.68
15625.72
15552.24
15512.56
15516.17
15485.94
15542.12
15561.85
15524.02
15506.88
15508.67
15668.41
15378.42
15633.05
15461.75
+10.50
Theoretical (t): High 15996.82 Low 15376.39
Actual (a): High 15944.25 Low 15436.74
899.11
898.84
900.69
899.95
900.88
901.19
900.67
900.57
898.77
897.94
896.69
897.15
896.77
897.99
895.51
904.09
892.45
902.31
894.58
–2.13
893.74
893.86
895.03
899.09
900.44
902.12
896.71
894.13
894.42
891.69
894.09
895.99
896.08
895.76
898.67
902.97
888.80
902.51
890.36
+3.16
Dow Jones 65 Composite (divisor: 0.76432218033595)
Open (t)
… 12193.46 12201.41 12142.29
Open (a)
… 12210.61 12215.83 12133.86
10:00
… 12260.63 12165.90 12165.93
10:30
… 12253.89 12164.70 12181.09
11:00
… 12235.52 12143.95 12189.92
11:30
… 12242.14 12158.19 12211.64
12:00
… 12260.11 12156.57 12191.38
12:30
… 12259.53 12164.11 12181.03
1:00
… 12265.87 12186.69 12171.39
1:30
… 12261.91 12193.13 12170.70
2:00
… 12249.35 12185.35 12164.60
2:30
… 12238.15 12205.43 12165.36
3:00
… 12222.84 12180.12 12169.57
3:30
… 12216.07 12146.78 12161.10
Close
… 12248.33 12139.53 12136.85
High (t)
… 12360.42 12274.39 12250.72
Low (t)
… 12104.13 12066.73 12071.58
High (a)
… 12272.98 12215.83 12217.34
Low (a)
… 12189.86 12128.24 12129.95
Change
…
–1.64 –108.80
–2.68
12127.84
12132.96
12154.93
12178.47
12194.38
12167.40
12149.90
12116.46
12122.29
12137.12
12154.34
12156.61
12118.84
12130.42
12149.14
12245.93
12046.23
12208.94
12103.55
+12.29
Theoretical (t): High 904.09 Low 876.63
Actual (a): High 902.51 Low 876.58
Theoretical (t): High 12360.42 Low 12046.23
Actual (a): High 12272.98 Low 12103.55
NY Up
NY Off
NY Up - Comp.
NY Off - Comp.
NYSE Amer UP
NYSE Amer Off
NASD Up
NASD Off
NYSE Arca UP
NYSE Arca Off
% (QCHA)
% (QACH)
% (QCHAQ)
Jan 1
2
3
4
5
... 437,922 224,804 473,175 615,640
... 468,157 726,847 474,837 335,710
... 1,675,770 978,538 1,812,554 2,354,692
... 2,041,778 2,899,004 1,852,249 1,449,056
...
4,371
3,821
6,647
6,397
...
8,395
9,372
3,561
5,870
... 2,606,200 1,194,638 2,331,503 1,961,391
... 3,142,693 4,237,650 2,916,456 3,227,025
... 118,042 138,036 124,391 179,791
... 237,491 246,475 182,124 144,831
–.28
–1.15
–.01
+.10
+.96
–.71
+.38
–.06
+.48
–1.06
+.72
–.04
Market Advance/Decline Totals
Weekly Comp.
Total Issues
Advances
Declines
Unchanged
New Highs
New Lows
NYSE
Amer
NYSE
2,969
1,080
1,854
35
137
32
NYSE
Arca
Nasdaq
328
149
171
8
8
13
Week ended last Friday compared to previous Friday
Daily
Dow Jones 20 Transport (divisor: 0.16279857124321)
Open (t)
… 15831.53 15654.19 15462.91
Open (a)
… 15844.23 15695.54 15473.72
10:00
… 15884.45 15583.21 15529.72
10:30
… 15886.75 15571.02 15544.01
11:00
… 15810.04 15506.91 15546.84
11:30
… 15800.86 15571.54 15541.66
12:00
… 15830.09 15574.34 15565.76
12:30
… 15856.15 15563.83 15522.80
1:00
… 15806.19 15613.36 15544.19
1:30
… 15814.71 15659.69 15552.97
2:00
… 15821.50 15647.99 15530.16
2:30
… 15776.12 15602.65 15514.05
3:00
… 15755.79 15635.95 15516.35
3:30
… 15737.94 15546.70 15541.05
Close
… 15774.77 15504.56 15498.17
High (t)
… 15996.82 15758.95 15629.87
Low (t)
… 15656.13 15422.59 15376.39
High (a)
… 15944.25 15695.54 15574.82
Low (a)
… 15714.25 15493.80 15436.74
Change
… –124.08 –270.21
–6.39
Dow Jones 15 Utilities (divisor: 1.19780346554510)
Open (t)
…
878.06
894.77
Open (a)
…
879.61
895.18
10:00
…
884.97
890.11
10:30
…
889.08
896.45
11:00
…
891.72
895.34
11:30
…
891.10 894.48
12:00
…
890.01
894.73
12:30
…
891.38
894.21
1:00
…
893.75
893.64
1:30
…
894.98
894.75
2:00
…
894.55
895.17
2:30
…
894.19
896.44
3:00
…
894.18
897.65
3:30
…
893.37
893.29
Close
… 894.26
897.64
High (t)
…
897.58
901.03
Low (t)
…
876.63
887.88
High (a)
…
895.87
899.40
Low (a)
…
876.58
889.01
Change
…
+12.59
+3.38
Daily
4,721
1,539
3,096
86
213
207
2,102
375
1,716
11
90
49
NYSE Composite Daily Breadth
16065
July
Components
Open (t)
Open (a)
10:00
10:30
11:00
11:30
12:00
12:30
1:00
1:30
2:00
2:30
3:00
3:30
Close
High (t)
Low (t)
High (a)
Low (a)
Change
Jan 1
Theoretical (t): High 38015.22 Low 37165.34
Actual (a): High 37790.08 Low 37323.82
Transportation
Week's
Change
Trading Diary
Dow Jones 30 Industrial (divisor: 0.15172752595384)
Jan 1
Issues Traded
Advances
Declines
Unchanged
New Highs
New Lows
Blocks - primary
Total (000) - primary
Total (000)
2
3
4
5
...
2,909
2,879
2,911
2,903
...
1,347
782
1,386
1,527
...
1,496
2,028
1,427
1,285
...
66
69
98
91
...
27
23
63
55
...
5
6
14
17
...
4,294
4,162
3,685
4,259
... 910,061 969,456 960,094 961,805
... 3,743,058 3,950,767 3,715,489 3,844,375
NYSE American Composite
Daily
Issues Traded
Advances
Declines
Unchanged
New Highs
New Lows
Blocks - primary
Total (000) - primary
Total (000)
Jan 1
2
3
4
5
...
297
298
310
310
...
141
108
156
129
...
149
179
136
164
...
7
11
18
17
...
...
2
3
3
...
3
4
5
5
...
155
173
124
138
... 12,939 13,490 10,369 12,368
... 219,870 230,006 158,813 146,997
Nasdaq
Daily
Issues Traded
Advances
Declines
Unchanged
New Highs
New Lows
Blocks - primary
Total (000)
Jan 1
2
3
4
5
...
4,340
4,306
4,428
4,389
...
1,806
1,107
2,069
1,811
...
2,427
3,088
2,206
2,387
...
107
111
153
191
...
62
26
83
56
...
39
38
83
95
... 53,185 44,524 41,676 41,983
... 5,791,171 5,449,950 5,289,224 5,232,826
NYSE Arca Composite
Daily
Issues Traded
Advances
Declines
Unchanged
New Highs
New Lows
Blocks - primary
Total (000) - primary
Total (000)
Jan 1
2
3
Other Market Indexes
Daily
NYSE Amer Comp
AmMajorMkt
BNY ADR Idx
Europe
Latin Am
Asia
Emerg M
DJ US TSM Float
Nasdaq Cmp
100 Index
Indus.
Insur.
Banks
Computer
Telecom
NYSE Comp.-z
Financial-z
Health Care-z
Energy-z
Russell 1000
2000
3000
Value-v
Growth-v
MidCap
S&P 100 Index
500
Ind.
MidCap
SmallCap
Value Line(A)
Value Line(G)
DJ US Small TSM
4
5
...
1,861
1,826
1,923
1,905
...
431
417
600
1,110
...
1,409
1,390
1,291
742
...
21
19
32
53
...
39
6
22
21
...
14
7
24
21
...
1,661
1,761
1,574
1,723
... 356,966 385,433 308,032 336,437
... 1,854,159 1,942,668 1,613,766 1,724,140
1/01
...
...
...
...
...
...
...
...
...
...
...
...
...
...
...
...
...
...
...
...
...
...
...
...
...
...
...
...
...
...
...
...
...
1/04
1/05
4598.21 4643.47 4618.00
3388.76 3372.74 3369.68
163.59
163.53
163.77
159.26 159.43 160.41
222.34 222.51 220.45
186.38 185.95 185.29
306.43 306.15 303.98
47479.36 46989.65 46849.48
14765.94 14592.21 14510.30
16543.94 16368.49 16282.01
9395.58 9242.04 9173.12
12679.69 12660.56 12731.13
3783.07 3668.01 3686.21
12665.58 12561.60 12471.35
417.53 415.06 411.60
16841.62 16718.65 16715.71
9885.29 9777.97 9799.23
24501.26 24559.23 24725.74
13351.34 13544.26 13385.44
2605.71 2581.61 2573.83
2012.80 1959.20 1957.73
2730.88 2703.05 2695.24
1635.31 1620.68 1618.01
3006.87 2978.26 2965.76
3093.34 3037.56 3035.24
2221.46 2209.02 2199.62
4742.83 4704.81 4688.68
6773.73 6720.86 6691.05
2772.13 2708.80 2704.04
1310.84 1275.62 1274.52
9969.97 9758.67 9737.78
590.87 578.20
576.71
13950.82 13571.37 13562.42
1/02
1/03
4600.53
3374.20
164.19
160.61
222.42
185.93
303.51
46929.95
14524.07
16305.98
9175.92
12716.49
3710.90
12491.37
413.04
16758.24
9852.93
24708.51
13411.11
2579.06
1951.14
2699.94
1623.18
2968.79
3044.26
2204.56
4697.24
6699.73
2712.50
1270.66
9746.36
577.15
13548.42
(A)-Arithmetic Index. (G)-Geometric Index.
(v)-Value 1000 and Growth 1000. (y)-Dec. 31,1965=50. (z)-Dec. 31,2002=5000.
46
BARRON’S
MARKET LABORATORY
D ATA
B A R R ON S .C OM / D ATA
The Week In Stocks For the Major Indexes
12-Month
High
Low
Weekly
Dow Jones Indexes
37715.04 31819.14
30 Indus
16695.32 13444.01
20 Transp
1002.11
783.08
15 Utilities
12277.41 10596.53
65 Comp
Dow Jones Indexes
47987.24 38697.55
US TSM Float
1171.93
942.79
US Market
859.79
563.11
Internet
New York Stock Exchange
16898.34 14599.05
Comp-z
9925.03
8121.52
Financial-z
24725.74 21487.16
Health Care-z
14159.04 11549.36
Energy-z
NYSE American Stock Exchange
4685.93
3871.21
NYSE Amer Comp
3388.76
2895.39
Major Mkt
Standard & Poor's Indexes
2242.44
1726.18
100 Index
4783.35
3855.76
500 Index
6849.48
5367.58
Indus
2809.23
2326.82
MidCap
1339.63
1068.80
SmallCap
Nasdaq Stock Market
15099.18 10569.29
Comp
16906.80 11040.35
100 Index
9649.15
7480.47
Indus
12790.24 10885.14
Insur
4373.48
2658.90
Banks
13050.01 7779.13
Computer
427.98
375.79
Telecom
Russell Indexes
2631.33
2115.51
1000
2066.21
1636.94
2000
2759.62
2225.42
3000
1635.31
1415.59
Value-v
3063.12
2165.04
Growth-v
3132.19
2594.10
MidCap
Others
10099.26 8310.43
Value Line-a
606.49
498.09
Value Line-g
14277.68 11320.09
DJ US Small TSM
1033.47
829.11
Barron's Future Focus
1084.21
881.58
Barron's 400
Friday
Indexes’ P/Es & Yields
12-Month
Chg.
% Chg.
Change From
12/29
% Chg.
High
Low
Close
Chg.
Weekly
% Chg.
37715.04
15774.77
898.67
12248.33
37430.19
15498.17
894.26
12136.85
37466.11
15508.67
898.67
12149.14
–223.43
–390.18
17.00
–100.83
–0.59
–2.45
1.93
–0.82
3835.50
1632.48
–82.60
965.59
11.40
11.76
–8.42
8.63
–223.43
–390.18
17.00
–100.83
–0.59
–2.45
1.93
–0.82
47479.36
1160.23
831.96
46849.48
1145.69
816.62
46929.95
1147.93
821.01
–857.52
–19.79
–30.48
–1.79
–1.69
–3.58
7843.91
196.61
257.90
20.07
20.67
45.80
–857.52
–19.79
–30.48
–1.79
–1.69
–3.58
16841.62
9885.29
24725.74
13544.26
16715.71
9777.97
24501.26
13351.34
16758.24
9852.93
24708.51
13411.11
–94.65
–28.84
541.37
151.57
–0.56
–0.29
2.24
1.14
1218.50
882.96
1336.60
441.10
7.84
9.84
5.72
3.40
–94.65
–28.84
541.37
151.57
–0.56
–0.29
2.24
1.14
4643.47
3388.76
4598.21
3369.68
4600.53
3374.20
6.21
-13.89
0.14
–0.41
508.31
356.86
12.42
11.83
6.21
–13.89
0.14
–0.41
2221.46
4742.83
6773.73
2772.13
1310.84
2199.62
4688.68
6691.05
2704.04
1270.66
2204.56
4697.24
6699.73
2712.50
1270.66
–31.63
–72.59
–129.23
–69.04
–47.60
–1.41
–1.52
–1.89
–2.48
–3.61
476.91
802.16
1328.29
222.55
84.83
27.60
20.59
24.73
8.94
7.15
–31.63
–72.59
–129.23
–69.04
–47.60
–1.41
–1.52
–1.89
–2.48
–3.61
14765.94
16543.94
9395.58
12731.13
3783.07
12665.58
417.53
14510.30
16282.01
9173.12
12660.56
3668.01
12471.35
411.60
14524.07
16305.98
9175.92
12716.49
3710.90
12491.37
413.04
–487.28
–519.95
–297.78
113.98
–64.21
–504.86
–4.06
–3.25
–3.09
–3.14
0.90
–1.70
–3.88
–0.97
3954.78
5265.63
1695.44
668.84
–398.71
4712.24
21.09
37.42
47.69
22.66
5.55
–9.70
60.58
5.38
–487.28
–519.95
–297.78
113.98
–64.21
–504.86
–4.06
–3.25
–3.09
–3.14
0.90
–1.70
–3.88
–0.97
2605.71
2012.80
2730.88
1635.31
3006.87
3093.34
2573.83
1951.14
2695.24
1618.01
2965.76
3035.24
2579.06
1951.14
2699.94
1623.18
2968.79
3044.26
–43.07
–75.93
–48.27
–6.25
–82.88
–67.62
–1.64
–3.75
–1.76
–0.38
–2.72
–2.17
443.11
158.34
450.67
89.20
803.75
284.93
20.75
8.83
20.04
5.81
37.12
10.33
–43.07
–75.93
–48.27
–6.25
–82.88
–67.62
–1.64
–3.75
–1.76
–0.38
–2.72
–2.17
10018.16
593.87
13950.82
1021.41
1069.25
9737.78
576.71
13548.42
1006.81
1049.93
9746.36
577.15
13548.42
1009.87
1050.36
–271.80
–16.72
–504.05
–18.49
–22.04
–2.71
–2.81
–3.59
–1.80
–2.05
949.04
24.62
1243.50
173.20
110.32
10.79
4.46
10.11
20.70
11.74
–271.80
–16.72
–504.05
–18.49
–22.04
–2.71
–2.81
–3.59
–1.80
–2.05
High/Low's are based upon the daily closing index. a-Arithmetic Index. G-Geometric Index. V-Value 1000 and Growth 1000 y-Dec. 31,1965=50 z-Dec. 31,2002=5000
Not So Fast: Although the minutes from the Fed’s last policy meeting show that rate cuts are planned for
2024, the timing of those cuts seemed less certain than traders had assumed. So the ICE U.S. Dollar Index
rose 1.1% on the week, to 102.4, as it measured the dollar against a basket of six other currencies.
10
EURO in $
DXY (102.44)
-5
YEN in $
-10
-15
A
M
Last Week
Prev. Week
Last Year
37466.11
25.83
3.87
1450.36
1.96
733.74
4.89
7664.40
15508.67
14.58
6.86
1063.89
1.41
218.98
4.41
3514.52
898.67
21.01
4.76
42.78
3.45
31.03
2.00
450.45
4697.24
25.49
3.92
184.25
1.53
71.87
4.58
1024.56
6699.73
28.64
3.49
233.96
1.36
91.12
6.11
1095.83
37689.54
26.49
3.77
1422.55
1.94
732.81
4.92
7664.40
15898.85
14.94
6.69
1063.89
1.38
219.29
4.52
3514.52
881.67
20.61
4.85
42.78
3.52
31.05
1.96
450.45
4769.83
26.35
3.79
181.01
1.51
72.02
4.66
1024.56
6828.96
30.01
3.33
227.55
1.33
90.83
6.23
1095.83
33630.61
22.32
4.48
1506.52
2.05
688.06
4.52
7439.45
13876.19
11.12
9.00
1248.17
1.40
194.81
4.32
3214.72
981.27
23.28
4.29
42.14
3.01
29.52
2.25
435.47
3895.08
20.26
4.94
192.26
1.75
68.16
3.86
1008.02
5371.44
21.24
4.71
252.89
1.59
85.41
5.15
1042.07
J
J
A
S
O
N
D
J
Source: Tullett Prebon
144 Filings
Yields (%)
Monday
$75.0 bil
$68.0 bil
3-month
6-month
When Issued*
Last Auction
5.377
5.242
5.404
5.264
Tuesday
52
3-year
4.160
4.375
10-year
4.036
4.500
Wednesday
$37.0 bil
Thursday
$21.0 bil
29-year 10-ms
* As of Friday afternoon.
4.191
4.750
Last Week
Prev. Week
Year Ago
YOY % Chg
NYSE(a)
30 Dow Inds (b)
20 Dow Trans (b)
15 Dow Utils (b)
65 Dow Stks (b)
NYSE American (a)
Nasdaq(d)
3,801,416
1,359,143
421,280
226,370
2,006,793
49,167
21,763,171
2,729,965
896,926
266,709
151,414
1,315,048
55,199
24,132,413
3,553,004
1,445,376
367,268
188,773
2,001,417
39,676
19,830,099
6.99
-5.97
14.71
19.92
0.27
23.92
9.75
NYSE 15 Most Active
Average Price
% Tot Vol
Stock Offerings $(z,v)
22.14
14.82
1,573,200
29.05
15.73
61,000
19.79
12.89
303,100
11.87
14.97
419.04
Daily Stock Volume
1/1
1/2
1/3
1/4
1/5
NYSE(a)
30 Inds (b)
20 Trans (b)
15 Utils (b)
65 Stks (b)
NYSE Amer(a)
Nasd(d)
...
...
...
...
...
...
....
910,061
350,287.3
97,721.4
56,204.3
504,212.9
12,939
5,791,171
969,456
329,145.2
123,980.5
62,863.9
515,989.5
13,490
5,449,950
960,094
380,222.3
94,419.6
49,851.6
524,493.6
10,369
5,289,224
961,805
299,488.6
105,158.0
57,450.3
462,096.9
12,368
5,232,826
NYSE 15 Most Active
Avg. Price
% Tot Vol
....
....
29.03
15.79
21.15
14.89
20.67
18.45
14.64
18.74
Numbers in thousands save price and percentages. (a) Primary volume. (b) Composite volume. (d) as of 4:10 pm.
(r) Revised. (v) W/E Thursday. (z) Source: LSEG.
NYSE HALF-HOURLY VOLUME
Daily
1/01
1/02
1/03
1/04
1/05
9:30-10:00
...
97,682
104,334
81,125
85,851
10:00-10:30
...
43,105
45,231
34,693
45,675
10:30-11:00
...
37,761
38,797
31,044
33,882
11:00-11:30
...
-178,547
30,536
28,568
30,061
11:30-12:00
...
226,224
12,787
25,568
22,834
12:00-12:30
...
24,223
36,070
22,837
25,151
12:30-1:00
...
22,601
22,903
20,525
20,267
1:00-1:30
...
22,976
23,382
18,769
22,203
1:30-2:00
...
23,436
22,960
19,313
20,361
2:00-2:30
...
24,158
30,423
22,213
23,313
2:30-3:00
...
24,798
26,285
23,786
26,300
3:00-3:30
...
35,509
37,549
30,420
33,237
3:30-4:00
...
506,136
538,199
601,233
572,670
None
This is a list of the Dow Jones trailing 52-week diluted share
earnings, dividends and book values as reported by the company.
Bolded numbers indicate new values. Sources Barron's Stats and
FactSet.
Industrial Stocks
Year
High
2024
2067.55
Earns
Book
Divs. Value
Book
Divs. Value
Earns
10.66
14.07
6.12
(4.70)
17.65
13.47
3.31
2.49
1.28
1.82
20.66
15.58
8.07
12.75
0.07
2.40 33.26
8.52 6.86
0.95 3.18
Nil (26.58)
5.00 30.73
6.04 83.17
1.55 9.68
1.84 5.57
Nil 52.09
2.80 29.39
10.50 317.90
8.36 1.54
4.17 24.99
6.63 24.22
0.74 24.52
Johnson&John 5.79 4.70 29.39
JPMorgChase 16.75
4.10 90.29
McDonalds 11.36
6.23 (8.06)
Merck Co
1.80
2.96 18.12
Microsoft 10.33
2.79 27.75
Nike Inc
3.42
1.39 9.14
Proc Gam
6.16 3.7354 19.46
3M Co
(13.35) 6.00 26.80
Salesforce.com 2.63 0.00 57.84
Travelers Cos 9.24
3.93 92.89
UnitedHealthGrp 23.04
7.29 83.27
Verizon
4.96 2.6225 21.70
Visa
8.35
1.87 16.08
Walgreens 0.66
1.92 29.23
Wal-mart
6.03 2.28 28.48
SEC Form 144 must be filed by holders of restricted securities (also called letter stock) who intend to
sell shares. Shares Indicated: the number to be sold. Sales Date: the approximate date of the sale.
(Sometimes shares aren't sold, even though their owner has filed a Form144.) Source: Thomson
Reuters
Company
Sym
Shares
Indicated
$ Value
Sale
Date
Roivant Sciences Ltd
ROIV 3,000,000 33,150,000
1/2/24
Ramaswamy, Vivek
Samsara
IOT
1,056,000 33,580,800
1/1/24
Biswas, Sanjit
OD
Samsara
IOT
1,056,000 33,580,800
1/2/24
Bicket, John
OD
Royalty Pharma Plc
RPRX 470,000 13,174,100
1/2/24
Riggs, Rory
D
Cymabay Therapeutics
CBAY
337,583
8,186,388
1/3/24
Stuart, Lewis
O
Equitable
EQH
120,000 3,996,000
1/2/24
Pearson, Mark
OD
Mr Cooper
COOP 100,000
Bray, Jesse
OD
Cadence Design Systems
CDNS
99,886 26,290,475
1/2/24
Devgan, Anirudh
OD
Glaukos
GKOS
95,000
7,334,433
1/2/24
Burns, Thomas
OD
Gitlab
GTLB
93,609
6,049,014 12/29/23
6,616,000 12/29/23
Seller
Schulman, Robin
Title
AlaskaAirGroup 2.00
AmericanAirlines 2.21
AvisBudgetGrp 45.61
C.H. Robinson 3.25
CSX Corp
1.88
Delta Air Lines 5.28
Expeditors Int'l 5.29
FedEx
16.88
Hunt (JB)
7.42
JetBlue Air (0.56)
Nil 29.92
Nil (8.91)
Nil (18.03)
2.44 11.64
0.44 6.11
0.20 10.26
1.38 20.15
4.93 103.86
1.68 35.34
Nil 10.90
Kirby Corp 3.00
Landstar Sys 8.33
Matson Inc 8.70
Norf Southern 9.12
Old Dominion 11.24
Ryder Sys 10.17
Southwest Air 0.75
Un Pacific 10.42
UPS
9.88
United Airlines 8.62
Nil 50.79
1.26 24.70
1.26 63.28
5.40 55.83
1.60 33.14
2.71 63.45
0.72 17.99
5.20 19.86
6.48 23.04
Nil 21.09
B
O
Ticker
Initial Offer Price
IPO Date
Utility Stocks
AES Corp. (0.35) 0.664 2.39
Am Elec
4.36
3.37 46.50
AmericanWaterWorks 1.66 2.7775 42.30
Atmos Energy 6.13 3.025 66.85
Con Ed
6.77
3.24 58.27
DominionEnergy 1.96
2.67 31.26
Duke Energy 1.57 4.06 61.51
Edison Int'l 3.22 2.9925 35.70
Exelon
FirstEnergy
NextEra Energy
Xcel Energy
Pub Sv Ent
Sempra Energy
Southn Co.
2.14
0.95
3.78
3.16
5.61
4.34
2.78
1.44 24.89
1.56 17.77
1.87 19.74
2.08 30.34
2.28 27.62
2.38 83.43
2.78 27.67
Recent Price
%Chg
Yearly High/Lows Gold Prices
Jan.
Date
Low
02
2039.55
High bullish readings in the Consensus stock index or in the Market
Vane stock index usually are signs of Market tops; low ones, market
bottoms.
Last Week
2 Weeks Ago
3 Weeks Ago
76%
76%
75%
48.6%
46.3%
52.9%
Consensus Bullish Sentiment
None
NYSE American
Nasdaq
enCore Energy (EU)
AAII Index
Bullish
Bearish
23.5
25.1
20.9
Neutral
27.9
28.6
26.2
59%
61%
61%
46.0%
44.7%
42.1%
Bullish Consensus
TIM Group Market Sentiment
Indicator
Sources: Consensus Inc.; American Association of
Individual Investors; Market Vane; TIM Group
Arms Index
The Arms index, also known as the short term trading index,
is a number derived by dividing one quotient into another
quotient. The numerator in the index is the number of
advancing stocks divided by the number of declining stocks.
As of 3/14/11, the denominator in the index is now the
composite volume of advancing stocks divided by the
composite volume of declining stocks.
NYSE
NYSE American
Nasdaq
NYSE
None
Consensus Index
Daily
Date
Jan
New Listings
Investor Sentiment Readings
Market Vane
Transportation Stocks
Coming U.S. Auctions
Stock Volume
Per Share Values of Stocks
In the Dow Jones Averages
Am Exp
Amgen
Apple
Boeing
Caterpillar
Chevron Corp
Cisco Sys
Coca Cola
Disney Walt
Dow
Goldman Sachs
Home Depot
Honeywell
IBM
Intel
0
s
M
DJ Ind Avg
P/E Ratio
Earns Yield %
Earns $
Divs Yield %
Divs $
Mkt to Book
Book Value $
DJ Trans Avg
P/E Ratio
Earns Yield %
Earns $
Divs Yield %
Divs $
Mkt to Book
Book Value $
DJ Utility Avg
P/E Ratio
Earns Yield %
Earns $
Divs Yield %
Divs $
Mkt to Book
Book Value $
S&P 500 Index
P/E Ratio
Earns Yield %
Earns $
Divs Yield %
Divs $
Mkt to Book
Book Value $
S&P Ind Index
P/E Ratio
Earns Yield %
Earns $
Divs Yield %
Divs $
Mkt to Book
Book Value $
5
s
F
DJ latest 52-week earnings and dividends adjusted by Dow Divisors
at Friday's close. S&P Dec. 4-quarter's GAAP earnings as reported
and indicated dividends based on Friday close.S&P 500 P/E ratios
based on GAAP earnings as reported. For additional earnings
series, please refer to www.spglobal.com. DJ latest available book
values for FY 2022 and 2021, and S&P latest for 2022 and 2021. rRevised data
Selected IPOs
U.S. Dollar Index vs Euro and Yen
s
For personal non-commercial use only. Do not edit or alter. Reproductions not permitted.
To reprint or license content, please contact Barron's reprints department at 800-843-0008 or www.djreprints.com
January 8, 2024
1/1
1/2
1/3
1/4
1/5
...
...
...
1.10
1.72
.90
1.14
.95
1.27
.99
.60
1.17
.69
1.25
.73
Trading
Suspended
NYSE
Chico's Fas (CHS)
Livent (LTHM)
RPT Realty (RPT)
Startek (SRT)
NYSE American
None
Nasdaq
DISH Network (DISH)
Hallmark Financial (HALL)
Nemaura Medical (NMRD)
Name
Changes
NYSE
Pinstripes (PNST), formerly
Banyan Acquisition (BYN)
NYSE American
None
Nasdaq
None
04
January 8, 2024
D ATA
47
BARRON’S
MARKET LABORATORY
B A R R ON S .C OM / D ATA
Dow Jones U.S. Total Market Industry Groups
Net Change
Top 20 Weekly Ranked
IG-Sym
Mobile Telecom
Pharmaceuticals
Fixed Line Telecom
Reinsurance
Pharmaceuticals & Biotech
Specialty Finance
Multiutilities
Food Retailers & Whlslrs
Property & Casualty
Food & Drug Retailers
Health Care Providers
Hotel & Lodging REITs
Drug Retailers
Tobacco
Integrated Oil & Gas
Life Insurance
Conventional Electricity
Electricity
Full Line Insurance
Banks
DJUSWC
DJUSPR
DJUSFC
DJUSIU
DJUSPN
DJUSSP
DJUSMU
DJUSFD
DJUSIP
DJUSDR
DJUSHP
DJUSHL
DJUSRD
DJUSTB
DJUSOL
DJUSIL
DJUSVE
DJUSEU
DJUSIF
DJUSBK
Close
343.49
855.14
103.68
481.16
1110.36
545.43
230.80
917.81
1438.88
1187.27
3237.20
105.51
959.10
675.83
707.16
1077.62
303.93
303.32
67.41
497.12
Wkly
% Change and Ranking
YTD
+ 16.43
+ 35.54
+ 3.81
+ 14.95
+ 29.27
+ 13.02
+ 5.18
+ 19.31
+ 29.21
+ 23.47
+ 61.32
+ 1.92
+ 17.20
+ 11.99
+ 12.16
+ 17.74
+ 4.93
+ 4.87
+ 1.02
+ 7.33
16.43
35.54
3.81
14.95
29.27
13.02
5.18
19.31
29.21
23.47
61.32
1.92
17.20
11.99
12.16
17.74
4.93
4.87
1.02
7.33
For personal non-commercial use only. Do not edit or alter. Reproductions not permitted.
To reprint or license content, please contact Barron's reprints department at 800-843-0008 or www.djreprints.com
Top 20 Yr Ago Ranked
IG-Sym
Semiconductor
Automobiles
Internet
Travel & Tourism
Home Construction
Automobiles & Parts
Software & Computer Svcs
Software
Technology Hardware & Equip
Broadline Retailers
Recreational Svcs
Computer Hardware
Industrial Suppliers
Mortgage Finance
Hotels
Publishing
General Retailers
Bldg Materials & Fixtures
Retail
Construction & Materials
DJUSSC
DJUSAU
DJUSNS
DJUSTT
DJUSHB
DJUSAP
DJUSSV
DJUSSW
DJUSTQ
DJUSRB
DJUSRQ
DJUSCR
DJUSDS
DJUSMF
DJUSLG
DJUSPB
DJUSGT
DJUSBD
DJUSRT
DJUSCN
Close
10905.46
840.50
3415.52
936.51
2327.71
961.61
5399.12
6001.25
4934.28
3106.66
100.07
9038.33
698.95
9.67
3284.76
677.73
2312.27
1829.20
2089.44
1435.12
Wkly
Rank
Yr Ago
Rank
YTD
Rank
3 Yr
High
Low
+5.02
+4.34
+3.81
+3.21
+2.71
+2.44
+2.29
+2.15
+2.07
+2.02
+1.93
+1.85
+1.83
+1.81
+1.75
+1.67
+1.65
+1.63
+1.53
+1.50
[1]
[2]
[3]
[4]
[5]
[6]
[7]
[8]
[9]
[10]
[11]
[12]
[13]
[14]
[15]
[16]
[17]
[18]
[19]
[20]
+1.91
+1.78
–8.97
+22.00
+2.61
+26.65
–5.04
+23.70
+12.93
+24.11
+4.01
+27.16
+11.19
–6.51
–9.15
+5.17
–7.97
–8.01
+8.93
+6.50
[106]
[108]
[128]
[35]
[103]
[26]
[118]
[30]
[60]
[28]
[98]
[24]
[66]
[120]
[130]
[89]
[125]
[126]
[73]
[81]
+5.02
+4.34
+3.81
+3.21
+2.71
+2.44
+2.29
+2.15
+2.07
+2.02
+1.93
+1.85
+1.83
+1.81
+1.75
+1.67
+1.65
+1.63
+1.53
+1.50
[1]
[2]
[3]
[4]
[5]
[6]
[7]
[8]
[9]
[10]
[11]
[12]
[13]
[14]
[15]
[16]
[17]
[18]
[19]
[20]
–6.41
+9.31
–8.02
+18.73
+6.33
+10.23
+3.24
+14.10
+16.35
+14.24
+9.20
+13.39
+10.13
+3.42
+28.26
+14.96
+1.41
+1.38
+21.46
+4.64
343.49
859.44
121.21
509.12
1,110.36
557.47
254.11
917.81
1,438.88
1,187.27
3,254.83
105.99
959.10
756.29
837.28
1,077.62
340.76
340.26
67.41
510.26
273.15
741.14
78.61
370.05
969.22
440.24
202.13
764.49
1,165.80
966.99
2,863.86
78.09
790.27
626.89
673.04
835.41
263.37
262.66
48.38
375.25
% Change and Ranking
YTD
– 477.30
– 38.39
– 81.27
– 43.80
– 52.01
– 43.78
– 166.73
– 207.30
– 242.79
– 105.28
– 5.66
– 543.69
– 27.61
– .12
– 33.56
– 16.20
– 72.01
– 58.58
– 59.03
– 52.11
52 Week
Week
Net Change
–477.30
–38.39
–81.27
–43.80
–52.01
–43.78
–166.73
–207.30
–242.79
–105.28
–5.66
–543.69
–27.61
–.12
–33.56
–16.20
–72.01
–58.58
–59.03
–52.11
52 Week
Week
Rank
Yr Ago
Rank
YTD
Rank
3 Yr
High
Low
–4.19
–4.37
–2.32
–4.47
–2.19
–4.35
–3.00
–3.34
–4.69
–3.28
–5.35
–5.67
–3.80
–1.24
–1.01
–2.33
–3.02
–3.10
–2.75
–3.50
[119]
[123]
[82]
[125]
[80]
[122]
[101]
[108]
[128]
[107]
[130]
[135]
[117]
[59]
[54]
[83]
[102]
[105]
[97]
[111]
+88.29
+82.44
+77.86
+71.30
+69.05
+67.07
+64.42
+61.99
+60.51
+59.47
+56.52
+43.95
+40.96
+37.94
+35.64
+34.24
+33.79
+33.65
+32.07
+30.80
[1]
[2]
[3]
[4]
[5]
[6]
[7]
[8]
[9]
[10]
[11]
[12]
[13]
[14]
[15]
[16]
[17]
[18]
[19]
[20]
–4.19
–4.37
–2.32
–4.47
–2.19
–4.35
–3.00
–3.34
–4.69
–3.28
–5.35
–5.67
–3.80
–1.24
–1.01
–2.33
–3.02
–3.10
–2.75
–3.50
[119]
[123]
[82]
[125]
[80]
[122]
[101]
[108]
[128]
[107]
[130]
[134]
[117]
[59]
[54]
[83]
[102]
[105]
[97]
[111]
+19.85
–1.93
+8.12
+4.38
+28.12
–2.63
+9.84
+11.31
+15.06
–1.82
+3.92
+11.51
+17.08
+8.31
+15.46
+9.59
+.89
+12.71
+2.17
+14.16
11,439.92
1,028.71
3,529.83
992.85
2,414.97
1,175.55
5,586.98
6,217.01
5,208.91
3,236.44
106.66
9,840.88
730.65
9.93
3,318.32
693.93
2,398.63
1,896.89
2,160.59
1,493.67
6,058.79
471.96
1,951.76
557.50
1,397.67
589.51
3,332.23
3,755.70
3,197.72
2,013.68
65.02
6,510.73
504.62
6.54
2,474.40
465.35
1,734.09
1,340.93
1,589.05
1,085.19
Groups are weighted by capitalization. 52-week highs and lows are based on daily closes. Dec. 31, 1991=100. In the U.S. listings, % vol chg column shows the change from previous 65-day moving
average. Volume figures do not reflect extended trading hours.
Delta Market
Sentiment
Indicator
The Delta MSI measures the
position of a representative set
of stocks relative to an
intermediate-term moving
average crossover (MAC) point.
When greater than 50% of the
stocks followed are above this
MAC point, the market is
bullish. When the indicator is
below 50%, risk is elevated and
stock exposures should be
reduced. Manager uses
discretion on asset allocation
when MSI is at 50% +/- 3%.
Bullish
Current Sentiment
89.3%
Last Week
Pulse of the Economy
Only includes new reports.
Economic Growth and Investment
No Activity for this Week
Latest
Date
Latest Preceding
Data
Period
Year YroYr
Ago % Chg
Consumption and Distribution
Factory shipments, (bil. $)
Instinet Research Redbook Avg. (monthly %)
Baltic Dry Index
Logistics Managers Index
Inventories
Domestic crude oil, (thous. bbls) Comm. (Excl. Lease Stck)
Factory inventories, (bil. $)
Gasoline, (thous. bbls)
Orders
Factory orders, backlog (bil. $)
New factory orders, (bil. $)
Nondurable goods orders, (bil. $)
Purchasing management index
Dec 30 73,371
Dec 29
93.5
Jan 5
746
Dec 30 1,680
Dec 30
73.1
Nov 580.72
Dec 30
Jan 5
Dec
78,483 79,495 –7.70
93.3
79.6 17.46
708
961 –22.37
1,693 1,602 4.87
73.7
71.8 1.81
r578.04 547.32 6.10
2.11
2,110
50.6
–3.29 –0.42
….
2,094 1,130 86.73
49.4
54.6 –7.33
Dec 29 431,065 436,568 420,646 2.48
Nov 857.08 r856.47 804.82 6.49
Dec 29 236,954 226,054 222,662 6.42
Nov 1,374.85 r1,357.73 1,143.57 20.22
Nov 592.87 r577.95 542.46 9.29
Nov 297.64 r297.73 271.06 9.81
Dec
47.4
46.7 48.4 –2.07
Trade
No Activity for this Week
87.1%
2 Weeks ago
86.7%
3 Weeks ago
Current Market Exposure: 75%
Equities, 25% Bonds, 0% Cash
Source: Delta Investment
Management
www.deltaim.com, (415)
249-6337
Latest Preceding
Data
Period
Year YroYr
Ago % Chg
Inflation
Production
Electric power, (mil. kw hrs) (EEI)
Petroleum, related capacity, %
Rotary rigs running, U.S. & Can., (Hughes)
Steel, (thous. tons)
Steel, rated capacity, % (AISI)
Latest
Date
ECRI Industrial Price Index f
Jan 5 114.90
Initial jobless claims (thous.)
Continuing claims (mil.)
Job openings, (thous.)
Hires, (thous.)
Total separations, (thous.)
Service payrolls, (thous.)
Unemployment rate, %
Unemployed, (thous.)
Avg. wks duration unemploy
U–6 unemployment
Civilian Employment Population Ratio
Construction
Construction spending, (bil. $)
Non–residential spending, SA (bil. $)
Public spending, (bil. $)
Residential spending, (bil. $)
Other Indicators
Citi Research Panic–Euphoria Reading
Dec 167,451 r168,127 164,998 1.49
Dec 161,183 r161,866 159,300 1.18
Dec 157,232 r157,016 154,535 1.75
Dec 23,003 r22,951 22,331 3.01
Dec 21,683 r21,661 21,461 1.03
Dec 30
202
r220
206 –1.94
Dec 23 1.855
r1.886 1.650 12.42
Nov 8,790
r8,852 10,746 –18.20
Nov 5,465
r5,828 6,253 –12.60
Nov 5,340
r5,632 5,945 –10.18
Dec 135,549 r135,355 133,074 1.86
Dec
3.7
3.7
3.5 5.71
Dec 6,268
r6,262 5,698 10.00
Dec
22.3
r19.5
19.5 14.36
Dec
7.1
7.0
6.5 9.23
Dec
60.1
r60.4
60.1 0.00
Nov 2,050.1 r2,042.5 1,842.2 11.29
Nov 698.2
r697.1 585.3 19.29
Nov 455.1
r458.1 391.7 16.19
Nov 907.4
r898.2 874.8 3.73
Jan 5
0.18
0.16
–0.15
….
a-1997 equals 100. b-1982-84 equals 100. c-1982 equals 100. f-1996 equals 100. hbenchmark revision, 2016 equals 100. r-Revised.
American Debt and Deficits
Preceding
Report
Federal Budget Deficit (bil. $)-a
1,330FY'25
Budget Surplus/Deficit (bil. $)-b, November
–314.01
Trade Deficit (bil. $, sa)-c, October
–64.26
Treasury Gross Public Debt. (bil. $)-d
33,994.2
Treasury Statutory Debt Limit (bil. $)-d
*
Consumer Installment Debt (bil. $)-e, October
4,989.9
1,201FY'24
–66.56
r-61.15
33,896.1
31,381.5
r4,984.7
Year Ago Yr over Yr
Report
% Chg
1,154FY'23
–248.54
–78.33
31,375.5
….
4,729.3
….
26.34
-17.96
8.35
….
5.51
Sources: a-Office of Management and Budget, b-Monthly Treasury Statement, c-Monthly Commerce Dept.
Report, d-Daily Treasury Statement, e-Monthly Federal Reserve Release. *Statutory debt limit temporarily
suspended through January 1, 2025.
1 Year Treas Bills
2 Year Treas Notes
3 Year Treas Notes
5 Year Treas Notes
10 Year Treas Notes
20 Year Treas Bds
FHFA PMMS+ Dec
S&P 100
CBOE
13.25
1.65
10.65
1.40
8.05
1.15
5.45
0.90
2.85
0.65
0.25
0.40
J F M A M J
J A S O N D
Source: CBOE
Coming Earnings
Consensus Estimate
Year ago
$1.45
$2.24
3.21
1.03
1.04
3.29
0.77
1.02
1.69
2.47
0.60
8.70
0.10
1.16
3.48
0.87
5.99
0.98
0.85
8.93
1.16
1.48
3.57
0.62
5.34
0.67
M
Commercial Metals (Q1)
T
Acuity Brands (Q1)
Saratoga Investment (Q3)
WD-40 (Q1)
W
KB Home (Q4)
F
Bank of America (Q4)
BlackRock (Q4)
Citigroup (Q4)
Delta Air Lines (Q4)
JPMorgan Chase & Co. (Q4)
Bank of NY Mellon (Q4)
UnitedHealth (Q4)
Wells Fargo & Co. (Q4)
Day
Consensus Est Last Period
M
November Consumer Credit
T
November Trade Balance
W
November Wholesale Inventories
TH
December CPI
December Treasury Budget
F
$9.0 bil
$5.2 bil
-$63.5 bil
-$64.3 bil
-0.20%
-0.20%
0.20%
0.10%
-$38.7 bil
-$314.0 bil
0.10%
0.0%
December PPI
Unless otherwise indicated, times are Eastern. a-Advanced;
f-Final; p-Preliminary; r-Revised
Source: FactSet
For more information about coming economic reports
- and what they mean - go to Barron’s free Economic
Calendar at www.barrons.com
Dec 29
Yr. Ago
YOY % Chg
4.81
4.24
4.01
3.84
3.85
4.16
7.56
4.88
4.36
4.09
3.90
3.91
4.21
7.56
4.73
4.35
4.18
3.96
3.86
4.12
6.91
1.69
-2.53
-4.07
-3.03
-0.26
0.97
9.41
Date
Time
EarningsRelated
Period
January 12
January 12
January 12
7:30AM
12:00PM
10:00AM
Q4
Q4
Q4
Yearly High/Lows Silver Prices
The yearly Handy & Harman Silver price; with a high/low range based
on the daily close.
Year
High
2024
2023
23.83
25.92
Jan
May
U.S. $ in
Foreign
Currency
Fri.
U.S. $ in
Foreign
Currency
Last Fri.
Special Drawing Rights (SDR) are based on exchange rates for the U.S.,
British, and Japanese currencies. Source: International Monetary Fund.
a-Russian Central Bank rate. b-government rate. d-rebased as of Jan. 1,
2005. y-floating rate.
Money Rates
Latest Week
Prev. Week
Yr Ago
5.50
8.50
5.50
8.50
4.50
7.50
5.33
5.33
5.33
5.33
4.33
4.33
5.404
5.245
5.264
5.045
5.24
7.25
5.420
5.260
5.301
5.080
5.23
7.25
4.522
4.410
4.812
4.635
4.34
6.25
5.35
5.38
5.35
5.38
5.35
5.40
5.50
5.53
4.25
4.35
4.58
4.93
Canada
Germany
Japan
Switzerland
Britain
7.20
4.50
1.475
2.25
5.25
7.20
4.50
1.475
2.25
5.25
6.45
2.50
1.475
1.50
3.50
Other Money Rates
Fannie Mae Home Loan:
30-Year Fixed Conv
Bank money market-z
Interest Checking-z
6-Month Certif-z
12-Month Certif-z
30 Month Accounts-z
5-Year Certificates-z
6.16
0.60
0.10
1.78
1.93
1.47
1.40
5.97
0.60
0.10
1.78
1.93
1.47
1.40
6.01
0.26
0.06
0.94
1.39
1.19
1.16
2.70
2.70
2.10
Discount Rate (NY)
Prime Rate (base)
Fed Funds Rate
13 weeks, Coupon Yield
13 weeks, Auction Rate
26 weeks, Coupon Yield
26 weeks, Auction Rate
Avg weekly auction-c
Broker Call Rate
Bankers Acceptances
1 month
2 months
3 months
6 months
Foreign Prime Rates
Conference Call Calendar
Company
Foreign
Currency
in U.S.$
Last Fri.
T-Bills Rate
Source: CCBN, www.ccbn.com
Jan 5
Fed annualized yields adjusted for constant maturity.
Consensus Estimate
Foreign
Currency
in U.S.$
Fri.
Argentina (Peso)-y
.0012
.0012 812.3243 808.4017
Australia (Dollar)
.6706
.6815
1.4912
1.4674
Bahrain (Dinar)
2.6529
2.6529
.3769
.3769
Brazil (Real)
.2051
.2061
4.8750
4.8525
Bulgaria (Lev)
.5596
.5643
1.7871
1.7720
Canada (Dollar)
.7481
.7549
1.3367
1.3247
Chile (Peso)
.001124 .001143
889.95
875.06
China (Renminbi)
.1403
.1406
7.1299
7.1132
Colombia (Peso)
.0002568 .0002580 3893.45 3875.34
Czech. Rep. (Koruna)
…… ..
…… ..
…… ..
…… ..
Commercial rate
.04445
.04468
22.497
22.379
Denmark (Krone)
.1467
.1476
6.8161
6.7759
EcuadorUS Dollar
1.0000
1.0000
1.0000
1.0000
Egypt (Pound)-y
.0325
.0323 30.8020 30.9292
Hong Kong (Dollar)
.1280
.1280
7.8133
7.8099
Hungary (Forint)
.002895 .002881
345.43
347.11
Iceland (Krona)
.007258 .007353
137.77
136.00
India (Rupee)
.01203
.01202
83.136
83.186
.0000645 .0000650
15515
15389
Indonesia (Rupiah)
Israel (Shekel)
.2719
.2775
3.6779
3.6033
Japan (Yen)
.006915 .007091
144.62
141.03
Kazakhstan (Tenge) .002204 .002196
453.78
455.36
Kuwait (Dinar)
3.2519
3.2549
.3075
.3072
Macau (Pataca)
.1242
.1242
8.0500
8.0540
Malaysia (Ringgit)-b
.2148
.2176
4.6545
4.5950
Mexico (Peso)
…… ..
…… ..
…… ..
…… ..
Floating rate
.0592
.0589 16.8788 16.9712
New Zealand (Dollar)
.6245
.6319
1.6013
1.5825
Norway (Krone)
.0971
.0983 10.3014 10.1740
Oman (Rial)
2.5976
2.5975
.3850
.3850
Pakistan (Rupee)
.00355
.00356 281.500 281.125
Philippines (Peso)
.01798
.01805
55.625
55.398
Poland (Zloty)
.2515
.2540
3.9762
3.9364
Qatar (Rial)
.2746
.2745
3.6413
3.6435
Russia (Ruble)-a
.01100
.01120
90.930
89.250
Saudi Arabia (Riyal)
.2666
.2667
3.7504
3.7501
Singapore (Dollar)
.7520
.7578
1.3297
1.3196
South Africa (Rand)
.0535
.0546 18.6861 18.2987
.0007609 .0007725
1314.21 1294.53
South Korea (Won)
Sri Lanka (Rupee)
.0031
.0031 323.8800 323.9200
Sweden (Krona)
.0975
.0990 10.2613 10.1029
Switzerland (Franc)
1.1763
1.1881
.8501
.8417
Taiwan (Dollar)
.03229
.03258
30.967
30.697
Thailand (Baht)
.02882
.02909
34.700
34.380
Turkey (New Lira)-d
.0335
.0339 29.8218 29.4768
Ukraine (Hryvnia)
.0261
.0262 38.2500 38.1500
U.K. (Pound)
1.2718
1.2733
.7863
.7854
Uruguay (Peso)
…… ..
…… ..
…… ..
…… ..
Financial
.02548
.02560
39.240
39.060
Euro
1.0940
1.1037
.9141
.9060
Avg effective offer
Avg weekly auction-c
BlackRock
Citigroup
Delta Air Lines
Adjustable Mortgage Rates
Latest
Report
Country
Readings in the CBOE equity put-call ratio of 60:100 and in the
S&P 100 of 125:100 are considered bullish, for instance. Bearish
signals flash when the equity put-call level reaches the vicinity of
30:100 and the index ratio hits 75:100.
114.69 117.32 –2.06
Employment
Civil labor force, (thous.)
Employed, (thous.)
All non–farm payrolls, (thous.)
Government payrolls, (thous.)
Goods prod payrolls, (thous.)
Foreign Exchange
CBOE Put / Call Ratio
vs. S&P 100
Date
Low
02
04
22.96
20.07
Date
Jan
Mar
03
08
U.S. Savings EE Bonds:
Long-Term (5yrs+)
c-Annualized yields, adjusted for constant maturity, reported by the Federal
Reserve on a weekly average basis. Sources: Tullett Prebon information, Ltd.
Factset. z-Bankrate.com.
48
BARRON’S
MARKET LABORATORY
D ATA
Barron’s Gold Mining Index
12-Month
High
Low
983.45 744.74 Gold mining
1/4
12/28
Year
Ago
Week %
Chg.
868.04
894.24
892.22
–2.93
Gold & Silver Prices
Handy & Harman
Gold, troy ounce
Silver, troy ounce
Krugerrand
Maple Leaf
Mexican Peso
Austria Crown
Austria Phil
U.S. Eagles
1/5
12/29
Year Ago
2056.35
23.25
N/A
N/A
1797.40
23.79
Price
Premium $
Premium %
2125.03
2145.47
2471.61
2005.84
2145.47
2145.47
81.73
102.17
8.00
3.00
102.17
102.17
4.00
5.00
0.32
0.15
5.00
5.00
Premium is the amount over the value of the gold content in the coin.
Source Manfra, Tordella & Brookes, Inc. Bullion spot gold price 2043.3
Dividend Payment Boosts
Weekly Bond Statistics
New Offerings, (mil $) (v)
Corporate (z)
Municipal (z)
Last Week
Prev. Week
Yr Ago
63,735
188
r968
r223
69,374
767
(Barron's index of 10 high-grade corporate bonds.)
3.77
3.63
4.19
Interm-Grade Bonds-y
(Barron's index of 10 medium-grade corporate bonds.)
4.77
4.78
5.29
Confidence Index
(High-grade index divided by intermediate-grade index; decline in
latter vs. former generally indicates rising confidence, pointing to
higher stocks.)
79.0
75.9
79.1
Other Confidence Indicators:
Bloomberg Barclays US Long Treasury*
(This index measures the performance of fixed-rate, nominal US
Treasuries with at least 10 years to maturity. Jan. 1, 1973=100.)
3162.67
3254.28 3300.41
Gold Performance
No Goldbricks: Strong jobs growth threw
gold for its first weekly loss in a month.
20
Handy & Harman Gold Price
5
0
-5
-10
Barron's Gold Mining Index (868.04)
-15
F M A M J J A S O N D
Bloomberg Barclays US Credit
(This index includes all publicly issued, fixed-rate, non-convertible,
investment-grade, dollar-denominated, SEC-registered corporate
debt.)
3023.89
3063.94 2845.52
Ryan Labs Treasury Index
15
10
For personal non-commercial use only. Do not edit or alter. Reproductions not permitted.
To reprint or license content, please contact Barron's reprints department at 800-843-0008 or www.djreprints.com
B A R R ON S .C OM / D ATA
Best Grade Bonds-y
Base for pricing gold and silver contents of shipments and for making
refining settlement.
Coins
(Index of total return from active Treasury notes and bonds. Dec.
31, 1996=100.)
274.41
277.07 266.62
Bond Buyer 20 Bond Index
(Index of yields of 20 general obligation municipal bonds.)
3.31
3.26
3.66
(Index of 40 actively-traded tax-exempt bonds; component issues
are changed regularly to keep the index a current picture of the
market. Source: The Bond Buyer
4.49
4.48
4.61
Stock/Bond Yield Gap-s
(Difference between yield on highest-grade corporate bonds and
yield on stocks on the DJIA.)
-1.81
-1.69
-2.14
Yield on DJ Equal Weight US Corp Bond Idx:
Corp Bonds, (y)
5.32
5.17
5.50
Federal Reserve Data Bank
One week ended Jan 3:
Member Bank
Reserve Chgs. (Mil. $)
Company Name-Ticker Symbol (Exchange)
Latest
Week
Prev. Week
Change
Year Ago
Change
7,210,177
-23,481
-921,023
U.S. Gov't securities:
Federal agency secur:
Bought outright
Reserve bank credit:
Primary Credit
Secondary Credit
Seasonal Credit
Float
Other F.R. Assets
Total Fed Credit #
Gold stock
SDR Certif. Accounts
Treas. Curr. Outst.
Total
Currency in circ
Treas. Cash Hldgs
Treas. Fed Deposits
Foreign Fed Deposits
Other Fed Deposits
Other FR liab/cap
Total factors
Reserves F.R. banks
Fgn hold U.S. debt
2,347
....
....
3,006
2
16
-579
40,006
7,659,629
11,041
5,200
52,616
7,747,117
2,347,775
395
758,448
9,692
171,032
-83,608
4,484,221
3,262,895
3,388,717
+499
+2
-13
-334
-592
-25,349
....
....
+14
-25,254
+7,252
+1
+27,043
+2
-8,306
-7,407
+158,308
-183,564
+2,977
-1,926
+2
+6
-89
+1,978
-842,330
....
....
+572
-841,770
+38,504
+296
+334,823
+757
-46,240
-111,731
-1,274,522
+432,751
+64,089
Company Name-Ticker Symbol (Exchange)
Total Reserves:
Nonborrowed Res
Borrowed Reserves
Monetary Base
Prev.
Month
Month %
Chg.
Year
Ago
3,403,400
3,250,100
153,337
5,731,400
3,276,500
3,104,600
171,891
5,601,300
3.87
4.69
-10.79
2.32
3,126,200
3,107,000
19,178
5,419,400
Q
Q
M
Q
M
M
M
M
M
M
M
M
M
M
M
M
M
M
M
M
M
M
M
M
M
M
M
M
M
M
M
From
Record
Date
Ex-Div
Date
Payment
Date
.26
.22
.38
.37
.15
.125
.116
.006
.0383
.0292
.0434
.0342
.0803
.0779
.0468
.0333
.0782
.0583
.0461
.0375
.0394
.0297
.0786
.0768
.0622
.0604
.10459 .09339
.04585 .04395
.02039 .01969
.013
.0125
.0115
.011
.02057 .02017
.01475 .01411
.0225
.022
.03361 .03211
.0185
.0175
.03652
.0354
.142
.0566
.0735 .040192
.0866
.0865
.0974
.0971
.0916
.0911
.1289
.1278
.0954
.0867
18.2 %
2.7
20.0
1833.3
31.2
26.9
3.1
40.5
34.1
22.9
32.7
2.3
3.0
12.0
4.3
3.6
4.0
4.5
2.0
4.5
2.3
4.7
5.7
3.2
150.9
82.9
0.1
0.3
0.5
0.9
10.0
1-16
1-16
1-12
1-31
1-23
1-12
1-12
1-23
1-23
1-12
1-23
1-23
1-22
1-11
1-17
1-17
1-17
1-17
1-17
1-17
1-17
1-17
1-17
1-17
1-12
1-12
1-16
1-16
1-16
1-16
1-22
1-12
1-12
1-11
1-30
1-22
1-11
1-11
1-22
1-22
1-11
1-22
1-22
1-19
1-10
1-16
1-16
1-16
1-16
1-16
1-16
1-16
1-16
1-16
1-16
1-11
1-11
1-12
1-12
1-12
1-12
1-19
1-29
1-23
1-31
2-15
1-31
1-19
1-19
1-31
1-31
1-19
1-31
1-31
1-31
1-22
1-31
1-31
1-31
1-31
1-31
1-31
1-31
1-31
1-31
1-31
2-01
2-01
1-31
1-31
1-31
1-31
1-31
Record
Date
Ex-Div
Date
Payment
Date
2-20
2-16
3-12
Record Ex-Div
Date Date
Pay
Date
To
Adjusted
Yield
Period
To
From
%
Decrease
4.1
Q
.25
.48
-47.9 %
Walgreens Boots Alliance-WBA (Nasdaq)
Stock Splits/Dividends
Record Ex-Div
Amount Date Date
Pay
Date
NONE
Week’s ExDividend
Dates
This list includes payouts on
common stocks.
This list includes payouts on
common stocks.
NYSE
NASDAQ
Tuesday (January 9)
AT & T
Brady Cl A
Darden Restaurants
General Mills
Lincoln National
Toronto-Dominion Bank
Verizon Communications
.278
.235
1.31
.59
.45
.751
.665
Wednesday (January 10)
.40
Thursday (January 11)
Abbott Laboratories
Advance Auto Parts
American Financial Group
Arcosa
BankUnited
Buckle
Buckle
Freeport-McMoRan
Freeport-McMoRan
IDEX Corp
Methode Electronics
Science Applications
Toll Brothers
Trinity Industries
Winnebago Industries
.55
.25
.71
.05
.27
2.50
.35
.075
.075
.64
.14
.37
.21
.28
.31
Friday (January 12)
AbbVie
Alamo Group
Hormel Foods
Sandstorm Gold
NONE
Sunday (January 14)
NONE
Monday (January 15)
NONE
Special Dividends
Company Name-Ticker Symbol (Exchange)
Amount
NONE
Week’s ExDividend
Dates
Saturday (January 13)
Latest
Month
Period
0.5
3.1
11.1
0.8
5.0
5.0
10.0
5.5
5.3
5.5
4.9
9.0
11.6
8.4
8.4
7.7
4.4
4.2
9.0
10.1
3.6
8.6
4.1
10.6
9.8
5.5
7.7
7.3
7.6
13.9
9.6
%
Increase
Dividend Payment Reductions
Oracle
Bought outright
Adjusted
Yield
Alamo Group-ALG (NYSE)
Bank OZK-OZK (Nasdaq)
BlackRock ESG Cap Alloc-ECAT (NYSE)
Cal-Maine Foods-CALM (Nasdaq)
Eaton Vance CA Mun Bd-EVM (NYSE AMER )
Eaton Vance Calif Muni-CEV (NYSE AMER )
Eaton Vance Ltd Duration-EVV (NYSE AMER )
Eaton Vance Mun Bd Fd-EIM (NYSE AMER )
Eaton Vance Mun Inc 2028-ETX (NYSE)
Eaton Vance Mun Income-EVN (NYSE)
Eaton Vance New York Muni-ENX (NYSE AMER )
Etn Vnc Short Dur Fd-EVG (NYSE)
High Income Secs Fund-PCF (NYSE)
Lazard Global TR Fund-LGI (NYSE)
MFS Charter-MCR (NYSE)
MFS Govt Mkts Income Tr-MGF (NYSE)
MFS Hi Inc Muni-CXE (NYSE)
MFS Hi Yld Muni-CMU (NYSE)
MFS Inc Tr-MIN (NYSE)
MFS Intermed Hi Inc-CIF (NYSE)
MFS Invest Grade Muni-CXH (NYSE)
MFS Multimkt-MMT (NYSE)
MFS Munl Inco-MFM (NYSE)
MFS Special Value-MFV (NYSE)
Nuveen Mtg & Income Fund-JLS (NYSE)
Nuveen Taxable Muni-NBB (NYSE)
RiverNorth Flex Mun II-RFMZ (NYSE)
RiverNorth Mgd Dur Muni-RMMZ (NYSE)
RiverNorth Mgd Dur Muni-RMM (NYSE)
Rivernorth Opps Fund-RIV (NYSE)
Special Opp Fund-SPE (NYSE)
Company Name-Ticker Symbol (Exchange)
Bond Buyer Municipal Bond Index
v-Week ended Thursday. y-Yield to maturity, week ended Thursday. zSource: LSEG.*Barclays T-Bond Index discontinued by firm.
Reserve Aggr (Mil. $)
Month Ended Nov:
January 8, 2024
1.55
.26
.282
.015
U.S. Treasury Bills
Maturity
Tuesday (January 9)
InterDigital
Intuit
.40
.90
Wednesday (January 10)
Johnson Outdoors Cl A
.33
Thursday (January 11)
Bel Fuse A
Bel Fuse Cl B
Camden National
City Holding Co.
Immersion
Norwood Financial
.06
.07
.42
.715
.045
.30
Friday (January 12)
GE HealthCare Techs
Phillips Edison
.03
.097
Saturday (January 13)
NONE
Sunday (January 14)
NONE
Monday (January 15)
NONE
Week’s ExDividend
Dates
This list includes payouts on
common stocks.
NYSE American
Tuesday (January 9)
NONE
Wednesday (January 10)
NONE
Thursday (January 11)
Caledonia Mining
Friday (January 12)
NONE
Saturday (January 13)
NONE
Sunday (January 14)
NONE
Monday (January 15)
NONE
.14
January 09
January 11
January 16
January 18
January 23
January 25
January 30
February 01
February 06
February 08
February 13
February 15
February 20
February 22
February 27
February 29
March 05
March 07
March 12
March 14
March 19
March 21
March 26
March 28
April 02
April 04
April 09
April 11
April 16
April 18
April 23
April 25
April 30
May 02
May 07
May 09
May 16
May 23
May 30
June 06
June 13
Jun 20 '24
Jun 27 '24
Jul 05 '24
Jul 11 '24
Aug 08 '24
Sep 05 '24
Oct 03 '24
Oct 31 '24
Nov 29 '24
Dec 26 '24
Bid
Asked
Wkly
Chg.
Ask
Yld.
5.22
5.23
5.26
5.26
5.27
5.26
5.25
5.25
5.27
5.27
5.27
5.27
5.27
5.28
5.27
5.27
5.25
5.23
5.21
5.22
5.23
5.22
5.20
5.21
5.21
5.22
5.19
5.19
5.19
5.18
5.18
5.17
5.17
5.16
5.18
5.15
5.12
5.12
5.09
5.07
5.05
5.04
5.04
5.03
4.98
4.82
4.77
4.71
4.67
4.61
4.59
5.21
5.22
5.25
5.25
5.26
5.25
5.24
5.24
5.26
5.26
5.26
5.26
5.26
5.27
5.26
5.26
5.24
5.22
5.20
5.21
5.22
5.21
5.19
5.20
5.20
5.21
5.18
5.18
5.18
5.17
5.17
5.16
5.16
5.15
5.17
5.14
5.11
5.11
5.08
5.06
5.04
5.03
5.03
5.02
4.97
4.81
4.76
4.70
4.66
4.60
4.58
-0.02
0.01
-0.01
-0.01
0.01
-0.01
-0.03
-0.03
-0.03
....
-0.03
0.02
0.01
0.02
-0.01
0.02
0.06
0.02
0.01
0.04
0.03
0.02
-0.02
....
....
0.02
-0.02
....
-0.02
-0.01
-0.03
....
-0.05
0.01
....
....
....
0.02
0.02
0.03
-0.01
-0.01
-0.01
....
0.26
0.07
0.02
-0.01
0.04
0.04
0.05
5.30
5.31
5.34
5.35
5.36
5.34
5.35
5.35
5.37
5.37
5.38
5.38
5.38
5.38
5.38
5.38
5.37
5.36
5.34
5.35
5.36
5.35
5.34
5.35
5.35
5.36
5.33
5.33
5.34
5.33
5.34
5.32
5.33
5.32
5.35
5.32
5.29
5.29
5.27
5.26
5.24
5.24
5.24
5.24
5.18
5.01
4.97
4.91
4.88
4.82
4.82
Top 5 Insider Purchases by
Company in 2024
Company
Number of Number of
Sym Insiders
Shares
Dominari Holdings
Longeveron
Collective Audience
Globalstar
Highpeak Energy
DOMH
LGVN
CAUD
GSAT
HPK
2 12,000
2 20,000
2 20,000
1 500,000
1 50,000
$ Value
Avg.
Price
30,860
27,757
27,468
963,700
734,340
$2.57
$1.39
$1.37
$1.93
$14.69
Top 5 Insider Sales by Company in 2024
Ionis Pharmaceuticals
Alphabet
Meta Platforms
Credo Technology
Airbnb
IONS
GOOG
META
CRDO
ABNB
7 305,013 15,321,350 $50.23
4 45,034 6,329,835 $140.56
3 30,247 10,785,241 $356.57
3 430,000 8,540,794 $19.86
2 169,417 23,190,423 $136.88
Week’s
Dividend
Payment
Week’s
Dividend
Payment
This list includes payouts on
common stocks.
This list includes payouts on
common stocks.
NYSE
NASDAQ
Monday (January 8)
Monday (January 8)
Ameris Bancorp
Elbit Systems
Flexsteel Industries
Albany International
.26
Ambev ADR
.144
Dillard's
20.00
Intl Flavors & Fragrances .81
McCormick
.42
McCormick Vtg
.42
Merck
.77
Schneider National
.09
ServisFirst Bancshares
.30
Tuesday (January 9)
ADT
.035
Belden
.05
Grupo Aval Acciones ADR .018
Vail Resorts
2.06
Wednesday (January 10)
Air Lease
Altria Group
Amphenol Cl A
Community Bank Sys
Disney
Guaranty Bancshares
Philip Morris Intl
.21
.98
.22
.45
.30
.23
1.30
Thursday (January 11)
Hewlett Packard Ent
Illinois Tool Works
John Wiley & Sons A
John Wiley & Sons B
Kaman
National Grid ADR
Schlumberger
Southwest Airlines
Taiwan Semiconductor
Thor Industries
Tootsie Roll Indus
Toro Co
UWM Holdings
.13
1.40
.35
.35
.20
1.19
.25
.18
.472
.48
.09
.36
.10
Friday (January 12)
American Vanguard
Banco Bradesco Ord ADR
Banco Bradesco Ord ADR
Benchmark Electronics
Eagle Materials
ESAB
Flowserve
Franklin Resources
Granite Construction
Johnson Controls Intl
Korn Ferry
Leggett & Platt
Medtronic
Motorola Solutions
National Fuel Gas
Nutrien
Omnicom Group
Primoris Services
Quanta Services
Ralph Lauren Cl A
Regal Rexnord
REV Group
Sonic Automotive Cl A
State Street
Xenia Hotels & Resorts
Saturday (January 13)
NONE
Sunday (January 14)
NONE
.03
.004
.036
.165
.25
.06
.20
.31
.13
.37
.33
.46
.69
.98
.495
.53
.70
.06
.09
.75
.35
.05
.30
.69
.10
.15
.50
.15
Tuesday (January 9)
Coca-Cola Consolidated 16.00
CSP
.04
J & J Snack Foods
.735
Kulicke & Soffa Inds
.20
Opera ADR
.40
Seagate Technology
.70
SEI Investments
.46
Upbound Group
.37
Wednesday (January 10)
Academy Sports
.09
Hingham Institution Savs .63
Virco Manufacturing
.02
Thursday (January 11)
NONE
Friday (January 12)
AFC Gamma
.48
Alico
.05
BayCom
.10
Canterbury Park Holding .07
Chicago Atl Real Est Fin
.47
Chicago Atl Real Est Fin
.29
Colliers International
.15
Costco Wholesale
15.00
Dentsply Sirona
.14
Escalade
.15
Fulton Financial
.17
ICF International
.14
Limoneira
.075
Lincoln Electric
.71
Mondelez Intl Cl A
.425
National Research
.12
NewtekOne
.18
Saga Communications
2.00
Towne Bank
.25
Trinity Capital
.50
Washington Trust Bancorp .56
Saturday (January 13)
NONE
Sunday (January 14)
NONE
Week’s
Dividend
Payment
This list includes payouts on
common stocks.
NYSE American
Monday (January 8)
NONE
Tuesday (January 9)
NONE
Wednesday (January 10)
NONE
Thursday (January 11)
NONE
Friday (January 12)
NONE
Saturday (January 13)
NONE
Sunday (January 14)
NONE
January 8, 2024
MARKET LABORATORY
D ATA
Week’s
New Highs and
Lows
Augmedix
AutolusTherap
BayviewAcqnA
Brainsway
BroadCapital
Canna-GlobalA
CapitalBancorp
CapitalProduct
CellectarBiosci
CentralGarden
CheckPoint
Coca-ColaEuro
CogentComm
CollegiumPharm
CtrlPlainsBcshs
Cytokinetics
DenaliCapAcqnA
DyneTherap
EdifyAcqnA
EksoBionics
EnergySvsofAmerica
EnsignGroup
ePlus
ErieIndemnity
EuroDry
Euroseas
Exelixis
FinWiseBancorp
FirstAdvantage
FirstNWBncp
FirstUnited
FirstUS Bcshs
Flex
FosterLB
Freshpet
FTACEmeraldA
GigaCloudTech
GigCapital5
GlobalLightsAcqn
HCM Acqn A
HudsonTech
Immunocore
Immunome
InceptionGrowth
InflectionPtIIA
INmuneBio
Innoviva
IntlGeneralIns
NYSE
137
New Highs
32
New Lows
Nasdaq
213
New Highs
207
New Lows
NYSE American
8
13
New Highs
New Lows
Only includes COMMON and REIT stocks
NYSE American
NovaBayPharm
NEW HIGHS
Nasdaq
AlphaProTech
Globalstar
Inuvo
M-tronInds
For personal non-commercial use only. Do not edit or alter. Reproductions not permitted.
To reprint or license content, please contact Barron's reprints department at 800-843-0008 or www.djreprints.com
NEW LOWS
AirspanNetworks
CalidiBiotherap
ContangoOre
DakotaGold
EMX Royalty
Enservco
Graphex
ITTechPkg
IvanhoeElectric
KulrTech
MexcoEnergy
Northann
NEW HIGHS
AbeonaTherap
AcriCapitalA
Adagene
ADMA Biologics
Agric&NatSolnsA
AI Transportation
AlarumTech
AlimeraSciences
AmerCoastalIns
Amgen
AppliedTherap
APxAcqnI A
ArgoBlockchain
AryaSciencesIV
AscendisPharma
AstroNova
Arrowhead Pharmaceuticals
15,790,000
$28.50
$450,015,000
Catalyst Pharmaceuticals
10,000,000
$15.00
$150,000,000
CCC Intelligent Solutions Holdings 22,000,000
$10.55
$232,100,000
Dyne Therapeutics
17,150,000
$17.50
$300,125,000
Keros Therapeutics
4,025,000
$40.00
$161,000,000
Kymera Therapeutics
10,891,089
$25.25
$274,999,133
Longboard Pharmaceuticals 10,000,000
$21.00
$210,000,000
$9.00
$99,996,666
Source: Dealogic LLC, New York City; (212) 577-4400.
Barron’s 50-Stock Average
This index is a weighted average of 50 leading issues. Useful in security valuation. Source: Barron's Stats
Jan 4
2024
S&P 500 Index
Barron’s 50 Index
Dec 28
2023
Jan
2023
Yr-to-Yr
% Chg
4688.68 4783.35 3937.63
19.07
12282.2412434.09
11370
8.03
8.98
Projected quarterly earn
154.13
154.13
141.42
Annualized projected earn
616.50
616.50
565.69
8.98
Annualized projected P/E
19.92
20.17
20.1
–0.96
531.45
519.68
479.67
10.79
23.11
23.93
23.7
–2.50
Five-year average earn
Five-year average P/E
Year-end earn
681.35
Year-end P/E
18.03
18.25
Year-end earns yield, %
5.55
5.48
5.3
4.94
Best grade bond yields, %
3.77
3.63
4.29
–12.12
0.68
0.66
0.81
–16.29
253.16 252.94
238.33
6.22
2.10
–1.69
Bond yields/stock ylds, %
Actual year-end divs
Actual yr-end divs yld, %
2.06
681.35 600.92
2.03
18.9
ReNewEnergy
ReWalkRobotics
RossStores
RushEnt A
SeanergyMaritime
SevenHillsRlty
ShattuckLabs
SilenceTherap
SilverSunTechs
SimplyGoodFoods
SizzleAcqn
Smith-Midland
SparkIAcqnA
SpringValleyII A
SpringWorks
SproutsFarmers
StealthGas
StoneX
SuperiorGroup
SyrosPharm
T-MobileUS
TandyLeather
TatTechnologies
TrailblazerI A
TwinDisc
UnionBankshares
Vaxcyte
VersaBank
VertexPharm
VillageSuper A
VircoMfg
VirTra
WerewolfTherap
ZevraTherap
NEW LOWS
AadiBioscience
AccelerateDiag
Aclarion
AgileTherap
Agric&NatSolnsA
AI Transportation
Ainos
AirshipAI
AkariTherap
AlloVir
AlternusCleanEner
AltisourcePortf
AmericanRebel
AngioDynamics
AquaMetals
ArtesianRscs A
Assertio
Atreca
AtriCure
AuroraTechA
AvaloTherap
BanzaiIntl
Baozun
BayviewAcqnA
Beneficient
Bio-key
Biofrontera
Biolase
BluejayDiag
BrenmillerEner
BroogeEnergy
BruushOralCare
BurgerFiIntl
Canoo
CapitalBancorp
CareMax
CartesianTherap
ChargeEnt
CheerHolding
ChijetMotor
CISO Global
ClearmindMed
CoeptisTherap
Cricut
CXApp
CyclacelPharm
Cyngn
DigitalBrands
DocGo
DuosTechs
E-HomeHousehold
ECDAutoDesign
Edgio
ElectraVehicles
ElevaiLabs
EnvericBiosci
EosEnergy
EsportsEnt
FaradayFuture
ForzaX1
This table lists the latest reported diluted quarterly earnings of the Dow Jones Averages component stocks based upon generally accepted
accounting principles. Earnings include discontinued and nonrecurring items but exclude extraordinary items and accounting changes as
reported by the company and adjusted by the Dow Divisor in effect at quarter end.
Secondary Distributions of common stocks
11,111,111
IonisPharm
KalVistaPharm
KellyServices A
KellyServicesB
KewauneeSci
KuraOncology
LCattertonA
Lensar
LibertySirius A
LibertySirius B
LibertySirius C
Liquidia
LongboardPharm
LuxUrban
LyraTherap
MakeMyTrip
Marriott
MDxHealth
MereoBioPharma
Merus
MicroStrategy
MontereyCapA
MountainCrestIV
MountainI A
Neurocrine
Neurogene
NeuroPace
Nkarta
NN
NocturneAcqnA
OCA Acqn A
OdysseyMarine
OmniAb
OptexSystems
OraSureTechs
PactivEvergreen
PangaeaLogistics
PatrickIndustries
Pilgrim'sPride
PonoCapitalThree
Popular
Priveterra II A
Pro-Dex
ProvidentBncp
QuettaAcqn
RamacoRscsA
RCM Tech
RegenPharm
B A R R ON S .C OM / D ATA
Quarterly Earnings: Dow Jones Industrial Average
Distributions & Offerings
Voyager Therapeutics
49
BARRON’S
13.39
–4.73
Company (Symbol)
Am Exp (AXP)
Apple Inc (AAPL)
Boeing (BA)
Caterpillar (CAT)
Chevron Corp (CVX)
Cisco Systems (CSCO)
Coca-Cola (KO)
Disney, Walt (DIS)
Dow (DOW)
Salesforce.com (CRM)
Goldman Sachs (GS)
Home Depot (HD)
IBM (IBM)
Intel (INTC)
JohnsonJ (JNJ)
JPMorgCh (JPM)
McDonalds (MCD)
Merck (MRK)
Microsoft (MSFT)
Nike Inc (NKE)
Amgen (AMGN)
Proc Gamble (PG)
3M Co. (MMM)
Travelers Co (TRV)
UnitedHealth Grp (UNH)
Honeywell (HON)
Verizon (VZ)
Visa (V)
Walgreens (WBA)
Wal-Mart (WMT)
Total Earnings
DJIA Divisor
DJIA Average
DJIA Qtr. Earn
DJIA 4-Qtr Earn
DJIA P/E Ratio
2023
Sep.
2023
June
2023
Mar.
2022
Dec.
2022
Sep.
3.30
2.89
2.40
2.07
2.47
1.46
1.26
1.52
1.88
1.29
– 2.70
– .25
– .69
– 1.06
– 5.49
5.45
5.67
3.74
2.79
3.87
3.48
3.20
3.46
3.33
5.78
.89
.97
.78
.67
.65
.71
.59
.72
.47
.65
.14
– .25
.69
.70
.09
.42
.68
– .13
.85
1.02
1.25
1.28
.20
– .10
.21
5.47
3.08
8.79
3.32
8.25
3.81
4.65
3.82
3.30
4.24
1.87
1.72
1.01
8.15
– 3.54
.07
.35
– .68
– .16
.25
1.69
2.80
– .03
1.33
1.68
4.33
4.75
4.10
3.57
3.12
3.17
3.15
2.45
2.59
2.68
1.86
– 2.35
1.11
1.18
1.28
2.99
2.69
2.45
2.20
2.35
1.03
.94
.66
.79
.85
3.22
2.57
5.28
3.00
3.98
1.83
1.37
1.37
1.59
1.57
– 3.74
– 12.35
1.76
.98
6.77
1.74
– .07
4.13
3.44
1.89
6.24
5.82
5.95
5.03
5.55
2.27
2.22
2.07
1.51
2.28
1.13
1.10
1.17
1.56
1.17
2.27
2.00
2.09
1.99
1.86
– .08
– .21
.14
.81
– 4.31
.17
2.92
.62
2.32
– .66
55.74
43.19
60.95
60.10
51.80
0.15172752595384 0.15172752595384 0.15172752595384 0.15172752595384 0.15172752595384
33507.50
34407.60
33274.15
33147.25
28725.51
367.37
284.66
401.71
396.10
341.40
1449.84
1423.87
1534.33
1578.15
1576.38
23.1
24.2
21.7
21.0
18.2
Fresh2
GDS Holdings
GlblMofyMetaverse
GlobalGas
Globavend
Gogo
GoldenHeaven
GreenGiant
Greenlane
H World
HeartTestLabs
HitekGlobal
HuizeHolding
Hywin
Infobird
Inpixon
InspiraTech
InspireVeterinary
InteractStrength
IntuitiveMachinesA
JaguarHealth
JayudGlblLogistics
KaixinAuto
Kidpik
KingsoftCloud
KintaraTherap
LumiraDx
LuokungTech
LytusTech
MaisonSolutions
Mangoceuticals
Maplebear
MeihuaIntlMed
MicroAlgo
MicroCloudHologram
MiddlesexWater
MilestonePharm
Mobileye
MobixLabs
Mondee
MyMD Pharm
NaaSTechnology
NatlResearch
NauticusRobot
NB Bancorp
NioCorpDevts
noco-noco
NotableLabs
Novavax
NubiaBrandA
Nukkleus
NuvveHolding
Nxu
Nyxoah
OhioValleyBanc
Ohmyhome
Ontrak
OPKO Health
OriginMaterials
PhioPharm
PolarPower
PonoCapitalThree
ProfoundMed
ProFrac
QualigenTherap
RailVision
reAlphaTech
ReconTech
RegencellBio
RenttheRunway
ResourcesConnect
ReToEcoSol
Rumble
SafeguardSci
SalemMedia
SellasLifeSci
ShengfengDevt
SMXSecurityMatters
Srivaru
StaarSurgical
Staffing360
Sunworks
SuperCom
TigoEnergy
ToughBuiltInds
TransCodeTherap
TurboEnergy
TuSimple
U Power
VastRenewables
VerbTech
VertexEnergy
Veru
ViraxBiolabs
VisionMarineTech
Vroom
VyneTherap
WindtreeTherap
XBPEurope
YanGuFangIntl
Zhongchao
Zoomcar
NYSE
NEW HIGHS
Abercrombie&Fitch
Allstate
AlphaMetal
AmerEagle
AmerExpress
AIG
Ameriprise
ApolloGlbMgmt
ArcadiumLithium
ArchResources
Assurant
AssuredGuaranty
Bladex
BancoSantander
BanColombia
BankNY Mellon
BlockHR
BostonSci
Brady
CanNtlRlwy
CapitalOne
Cencora
Citigroup
CorebridgeFin
Crawford B
Danaos
DeutscheBank
DorianLPG
ENI
ElancoAnimal
EquitransMdstm
EssentGroup
ExpeditorsIntl
FlameAcqnA
GSK
GeneralDynamics
GoldmanSachs
Greenbrier
HCI Group
HamiltonBeach
HartfordFinl
HimalayaShipping
HuntingIngalls
HysterYaleMatls
InterContinentl
JPMorganChase
JanusIntl
KodiakGasSvcs
Philips
LabCorp.ofAmerica
EliLilly
Loews
LumentFinance
MPLX
MarathonPetrol
Matson
MauiLand
McKesson
MolinaHealthcare
NGL Energy
NaturalResPtrs
Navigator
Nomura
Novartis
NovoNordisk
ONEOK
OldRepublic
PGT Innovations
Pearson
PerformanceFood
PetroleoBrasil
PetroleoBrasilA
Phillips66
Pinstripes
Progressive
RadianGroup
SFL
STAG Indl
SafeBulkers
ScorpioTankers
StifelFinancial
SynchronyFinl
Teekay
TeekayTankers
Textron
Torrid
TurningPoint
US Foods
UltraparPart
Unisys
Universal
VTEX
Vistra
WarriorMetCoal
WasteMgt
YirenDigital
ZalatorisAcqn
NEW LOWS
AMC Ent
ATI PhysTherapy
agilon health
ArcadiumLithium
AshfordHosp
BlackBerry
CanoHealth
Cazoo
COPEL
CompassMinerals
CoreCard
Dingdong
ElectriqPower
EndeavourSilver
Fisker
GrafTechIntl
GreenTree
JohnBeanTech
Lanvin
LufaxHolding
MBIA
MariaDB
MedicalProp
PNM Resources
P10
Pinstripes
Velo3D
Quarterly Earnings: Dow Jones Utility Average
This table lists the latest reported diluted quarterly earnings of the Dow Jones Utility Average component stocks based on generally
accepted accounting principles. The total is then adjusted by the Dow Divisor in effect at the end of the quarter.
Company (Symbol)
AES Corp.(AES)
Am El Pwr (AEP)
Amer Watr Wks (AWK)
Atmos Energy (ATO)
Cons Ed (ED)
DominEnergy (D)
Duke En (DUK)
Edis Intl (EIX)
Exelon(EXC)
FirstEnergy(FE)
NextEra En (NEE)
Xcel (XEL)
PubSvcEn (PEG)
Sempra Energy (SRE)
Southn Co (SO)
Total Earnings
DJUA Divisor
DJUA Average
DJUA Qtr. Earn
DJUA 4-Qtr. Earn
DJUA P/E Ratio
2023
Sep.
2023
June
2023
Mar.
2022
Dec.
2022
Sep.
.32
– .06
.21
– .82
.59
1.83
1.01
.77
.75
1.33
1.66
1.44
.91
.81
1.63
.80
.94
2.48
1.91
.51
1.53
.65
4.06
.53
1.73
.17
.69
1.17
– .07
.91
1.59
– .32
1.01
– .71
1.81
.40
.92
.81
1.09
– .33
.70
.34
.67
.43
.68
.74
.41
.51
– .71
.44
.60
1.38
1.04
.76
.86
1.19
.52
.76
.69
1.18
.27
1.18
2.58
1.58
.22
1.14
1.91
3.07
1.39
1.53
1.30
.77
.79
– .08
1.36
14.24
11.78
20.84
7.55
14.45
1.19780346554510 1.27924906167720 1.27924906167720 1.27924906167720 1.27924906167720
816.55
906.66
939.79
967.40
888.47
11.89
9.21
16.29
5.90
11.30
43.29
42.70
41.27
36.29
41.99
18.86
21.23
22.77
26.66
21.16
50
BARRON’S
There is no “normal” to investing, only a stability
of methodology that hopefully gets one to the
desired objectives.
Sustainable Gains
Matter More Than
Home Runs
T
oday’s investment
landscape has been
punctuated by the
impact of Covid
and, to a lesser
degree, the monetary and fiscal aftereffects of the response. A profound
period of calamity and psychological
despair nearly obliterated all of the
financial gains of the previous generation. Unfortunately, we now know
that crisis is metaphorically and literally but a sneeze away.
A difficult period of growth is
ahead. Assets that fare relatively well
in good times and bad are harder to
uncover. Defensive sectors such as
BY SCOTTY
C. GEORGE
The writer is the
chief investment
strategist for
Alexander Capital,
and creator of
ArlingtonEconometrics,
a proprietary
quantitative
market analytics
tool.
commodities and short-term bonds
are seemingly safer bets for the immediate future.
While it is always nice to have a
one-off home run, strategies that instead concentrate on trend duration
reduce risk and increase portfolio
alpha over significant periods. Juxtaposed against index benchmarking and
implied exogenous risks, being nimble
with one’s allocation while still maintaining strict adherence to quantifiable
data more often confirms the outcome
you desire from your portfolio.
The Federal Reserve and other
global central bankers tried, postCovid, to stimulate growth and build
liquidity, which became the precondi-
tion for asset bubbles. But try as we
might to battle them, market capitulations and cyclical rhythms are a part
of the natural economic ecosystem.
These patterns often provide clues as
to what themes lie ahead.
In order for inflation to flourish,
there must be a climate of excess demand accommodated by “easy” money
supply. Current anecdotal facts show,
however, that the pent-up demand
immediately following the pandemic
has mostly been appeased. Publicand private-sector spending has been
muted in recent months as a result of
monetary biases. We believe that the
preoccupation with systemic inflation
is transitory, if not transitional, and
has already shown a likelihood of
diminishing.
Higher personal and corporate savings rates, encouraged by the Fed raising interest rates, will be a net positive
for the domestic economy. We view
this surplus of cash as a potential
boon for equities as well as a balance
point against portfolio instability in
the coming year.
Equity price volatility, for example,
seems more capricious than ever.
Technology has sped up the rate at
which progress, research, and analysis is developing. Bull markets can
be created, or eviscerated, in seconds,
not weeks or months.
Our best advice to clients as we
begin a new year is not to engage in
hourly market watching but to commit to a strategy that is inherently
“other directed”—to invest in that
which limits the power one gives to
news coverage and focuses instead
upon using capital to build profits
from human and cultural problem
solving.
A way to begin the year effectively
is to establish a discipline for managing both risk and resources. There is
no “normal” to investing, only a stability of methodology that hopefully gets
one to the desired objectives.
I believe that all disciplines are
cyclical. Each can be measured for the
durability and probability of managing risk. For the most part, protecting
against drawdown is equally as important as predicting upside potential,
particularly for the affluent who have
much more to lose if wrong. The challenge, of course, is to rein in expectations consistent with the real momentum and longer-term characteristics of
macro events. Micro might work for
traders and benchmark followers, but
discipline and process identifies winners from gamblers.
Our recent executions for clients
were to magnify the compelling case
for allocating cash into short-term
bonds, thanks to the historical increase
in rates during the past two years. We
haven’t seen this significant a hedge
against equity risk and volatility in
over a decade. Finally, the relationship
between equity and fixed-income allocations is being normalized.
In our equity portfolios, we are
seizing upon capital gains potential in
biotech, water purification and agriculture, telecommunications, alternative energy, emerging markets, and
infrastructure. We view the socially
responsible aspect of portfolio construction as critical during the next
decade and beyond. Despite the potential for volatility early this year because of presidential politics, our eyes
are firmly upon the long-term efficiencies of the capital markets.
We see equity prices forging higher
for the coming year, supported by
modestly declining interest rates and
a global recovery from the backdrop
of pandemic and confusion.
In other words, the cyclical, and
secular, bullish bias remains. The
view from 30,000 feet is of a planet
that needs to get its house in order—
from climate, to security, to economics, poverty, hunger, diseases, and
hatred. If we are correct, this year
should see a sequence of positive processes, both political and economic,
designed to eradicate the worst, accelerate the best among us.
It is always more difficult to move
forward against a headwind. But being pessimistic is of no benefit, either.
Anyone can make money when the
markets are doing well. We believe
that obstacles can be overcome with
prudent asset allocation models.
Therefore, our strategic conclusion is
to widen the aperture of perception
and utilize investment capital to remedy a fragile Earth. B
Illustration by Alex Nabaum
For personal non-commercial use only. Do not edit or alter. Reproductions not permitted.
To reprint or license content, please contact Barron's reprints department at 800-843-0008 or www.djreprints.com
O T H E R VO I C E S
January 8, 2024
January 8, 2024
RETIREMENT
MAILBAG
Watch Out for This Rude
Surprise From Medicare
Why Invest in the
Saudi Dictatorship?
BY ELIZABETH O’BRIEN
To the Editor:
U.S. investors flocked to China and to a
lesser extent Russia, and we have seen
how that turned out (“Inside Saudi Arabia’s $3 Trillion Plan to Move Past Oil,”
Dec. 28). Now they are fleeing those countries for yet another dictatorship full of
“promise”? When will Americans figure
out that the short-term gains of funding
countries that oppose democracy, the rule
of law, and human rights are far outweighed by the threats to our democracy.
Michael Fitzsimmons
On Barrons.com
P
For personal non-commercial use only. Do not edit or alter. Reproductions not permitted.
To reprint or license content, please contact Barron's reprints department at 800-843-0008 or www.djreprints.com
51
BARRON’S
lanning for your Medicare premiums isn’t on most preretirement checklists, but it’s an important consideration for those
with higher incomes.
Your Medicare premium for a given
year is based on your income from two
years prior—typically from the last tax
return on file. Since you know that in
advance, there could well be opportunities to head off some income-based surcharges down the line.
First, it helps to understand how these
extra costs work. For 2024, most beneficiaries pay the standard Part B premium
of $174.70 a month. Individuals with
2022 modified adjusted gross incomes,
or MAGI, over $103,000 and married
couples filing jointly with incomes over
$206,000 pay what’s known as an
“income-related monthly adjustment
amount,” or IRMAA.
There are five income tiers above
the standard bracket, topping out at
a monthly premium of $594 per month
for individuals making $500,000 or
more and couples making $750,000
or more. For example, moving from the
third tier to the fourth, which starts
above $193,000, raises your monthly
premium to $559.00 from $454.20.
Note: While adjusted gross income, or
AGI, has a fixed definition, modified adjusted gross income can vary by context.
.Your Medicare MAGI is your adjusted
gross income (found on line 11 of the
Form 1040), plus tax-exempt interest
income (found on line 2a of the Form
1040).
If your MAGI is on the edge of a
bracket, you could save thousands of
dollars a year if you can prevent it from
going over.
“Miss it by five cents and you’re
sunk,” says Steve Parrish, professor
of practice at the American College of
Financial Services.
Many affluent retirees see their income rise in their early 70s, when the
government requires them to start withdrawing money from their traditional
retirement accounts and paying income
tax on it. One way to lower your required minimum distributions is to convert your traditional accounts to posttax
Roth accounts before the required minimum distribution requirement kicks in,
currently at age 73. You will owe income
tax on the amount converted, but if you
do it between the time you retire and age
73, you may be in a lower tax bracket.
Another option available to those age
70½ and older is to donate to charity
through a qualified charitable distribution of up to $100,000 a year. This
money goes directly from your individual
retirement account to a nonprofit organization and never hits your adjusted gross
income, says Mike Piper, a certified public accountant in St. Louis. B
To the Editor:
If you’re a retiree living off the current
income of your investments, then scrutinize the payout histories of some of these
funds, like the Nuveen AMT-Free Quality
Municipal Income, that have been choppy
with their distributions over the years
(“Here Are Barron’s 12 Best Income Investments for the New Year,” Dec. 29). If
you’re on a 10- to 30-year glide path, think
about preserving the purchasing power of
those distributions in the out years. Fixedincome and near-fixed-income-based
funds can’t do that for you. Only equities
and equity-based funds can keep you up
with inflation.
Beth Pollock
On Barrons.com
Reversion to the Mean
Income Tiers for Medicare Part B Premiums*
Individuals
Married Couples Filing Jointly
2024 Part B Premium
Less than or equal to $103K
Less than or equal to $206K
$174.70
From $103K to $129K
From $206K to $258K
$244.60
From $129K to $161K
From $258K to $322K
$349.40
From $161K to $193K
From $322K to $386K
$454.20
From $193K to $500K
From $386K to $750K
$559.00
Greater than or equal to $500K
Greater than or equal to $750K
$594.00
*2022 MAGI
Choppy Distributions
Source: Centers for Medicare & Medicaid Services
To the Editor:
I suspect that Steven M. Sears’ insightful
article will prove prescient in 2024
(“What Went Right for Investors in 2023
Can Go Wrong in 2024,” Striking Price,
Dec. 27). A single year’s 24% return on
the S&P 500 index could certainly lead
to speculation in the market rather than
thoughtful recognition that the long re-
cord of about 9% historical returns is the
more realistic measure over the course of
any considerable period of time. Putting
aside geopolitics, dysfunctional domestic
politics, wars or rumors of war, terrorism, and responsible monetary policy
coupled with irresponsible fiscal policy,
reversion to the mean seems to be the
immutable rule. This latest rally seems to
be a good opportunity to monetize some
of those unrealized gains and thereby
“own” those paper profits rather than
“rent” them.
Timothy Cribbin
St. Louis
New Year’s Resolution
To the Editor:
It’s that time of year when we typically
look forward to making predictions
while also chronicling how inaccurate
last year’s predictions were. As time,
rather than money, is our most precious
finite resource, it seems that reviewing
the past and predicting the future are
not the most productive ways to expend
our diminishing time.
This supports those who recommend
that we preferentially focus on today,
which shouldn’t entail prognostications,
and look for ways to enrich our current
life experiences. That is my New Year’s
resolution.
Dr. Douglas Propp
Naples, Fla.
Send letters to Mail@Barrons.com.
To be considered for publication,
correspondence must bear the writer’s
name, address, and phone number.
Letters are subject to editing.
The Barron’s Daily is our morning briefing
for what you need to know for the day.
Sign up at barrons.com/newsletters.
M
52
W
L
C
10
11
12
H
G
R
P
4
BARRON’S
8
3
F
2
D
6
7
9
0
A
I
January 8, 2024
EXCLUSIVE OFFER BELOW FOR BARRON’S READERS
FEBRUARY 21–23, 2024
LAS VEGAS
Paris Las Vegas
KEITH
FITZ-GERALD
Join the Experts and Discover...
THE BEST MONEY &
TRADING IDEAS IN 2024
ATTEND IN PERSON
SECURE A STANDARD PASS FOR JUST $199
$99
Coupon
Code
BARR99
Simply visit Barrons.MoneyShow.com or call 1.800.970.4355.
Diamond Sponsor
Silver Sponsors
MISH SCHNEIDER
JOHN CARTER
DAN IVES
KRISTINA HOOPER
RALPH ACAMPORA
JAMES WEST
KATHLEEN HAYS
HOWARD TULLMAN
CARLEY GARNER
and Discover the Biggest Factors
That Will Affect Your Money
in the Months Ahead
TOM DEMARK
For personal non-commercial use only. Do not edit or alter. Reproductions not permitted.
To reprint or license content, please contact Barron's reprints department at 800-843-0008 or www.djreprints.com
STEVE
FORBES
Bronze Sponsors
Thought Leaders
Income
Stocks
Exchange
Partner
Alternative
Investing
Funds Quarterly | Q4
ETFS AND MUTUAL FUNDS
For personal non-commercial use only. Do not edit or alter. Reproductions not permitted.
To reprint or license content, please contact Barron's reprints department at 800-843-0008 or www.djreprints.com
JANUARY 8, 2024
BALANCED
FUNDS
RISE AGAIN
Funds that
mix stocks and
bonds to capture
growth and
safety are staging
a comeback.
Where to find the
right one. PAGE L2.
PLUS: The best
Japan-focused
funds. PAGE L6
L2
BARRON’S
January 8, 2024
For personal non-commercial use only. Do not edit or alter. Reproductions not permitted.
To reprint or license content, please contact Barron's reprints department at 800-843-0008 or www.djreprints.com
In Search of
The Best
All-In-One
Funds
January 8, 2024
Its 0.25% expense ratio competes
well with many non-Vanguard index
funds.
Wellington typically sticks to a 65%
stocks/35% bonds allocation and has
historically had a value-oriented investment strategy, although that has
shifted recently as equity manager
Daniel Pozen has tilted the portfolio
more toward high-quality but pricier
stocks. The bond side of the fund has
always been high quality, heavily in
government and A- to AAA-rated
corporate debt.
The rise in bond interest rates makes the classic 60/40
balanced fund attractive again.
O
BY LEWIS BRAHAM
ne fund to solve
all your problems—it’s the
dream of every
investor who
wants the simple
life. But for all
except aggressive investors with 100%
in stocks, it was largely impossible
until recently, with interest rates close
to 0% before 2022, which rendered
the bond portion of any balanced or
allocation fund invested in both stocks
and bonds largely dead money.
That, in turn, led many risk-averse
investors to shun the classic 60%
stocks/40% bonds paradigm and seek
separate alternatives to bonds in moreexotic fixed-income and hedged funds
to reduce portfolio volatility. Many
hired financial advisors to “optimize”
their portfolios with the right mix of
high-yield, floating-rate, real estate,
and options-writing funds.
But as painful as 2022-23’s rate
increases were, they made life much
simpler, with Treasury bonds now
yielding upward of 4% and high-quality corporate bonds over 5%. “There
are a lot of really good [balanced]
funds out there,” says Jason Kephart,
Morningstar’s director of multi-asset
fund ratings. “The interest-rate environment makes the funds’ fixed-income portfolio a lot more attractive
than it has been in the past.”
By buying a single allocation fund,
you could say goodbye to your financial
advisor and save on fees. Or, if you’re
more sophisticated, you could use an
allocation fund to streamline your portfolio, retaining only those ancillary
funds that truly make a difference. Boring balanced funds tend to be cheaper
than highly specialized ones, so they’re
a good core investment.
Even better, because allocation
funds reduce volatility through diversification, investors tend to hold on to
them. That produces superior results
Morningstar consistently has found in
its annual Mind the Gap studies, as
greedy and/or fearful investors tend to
buy high and sell low more volatile
niche funds, leading to poor returns
from ill-timed trades.
Positive Rate Environment
Sharply rising rates like 2022’s usually
make stocks and bonds correlated in
their price moves. That can hurt both
assets: Investors sell stocks that look
L3
BARRON’S
less attractive relative to newly issued
bonds with higher yields. Meanwhile,
older, already-issued bonds with
lower yields than newly issued ones
also sell off. By contrast, sharply falling rates, which often come with a
recession, tend to hurt stocks but benefit high-quality bonds. That’s when
balanced funds particularly shine.
Both the yield and cushioning effect
of bonds should benefit balanced funds
in 2024 as inflation continues to cool in
an expected downturn. “I think the
benefit of a balanced or allocation fund
is likely to really shine in 2024, if rates
fall because the economy is weak,” says
Scott Opsal, co-manager of Leuthold
Core Investment, a tactical allocation
fund. “That’s the case where the bonds
would provide that safe haven you’re
looking for in a balanced fund.”
Certainly, balanced funds proved
their worth this past quarter. The $50
billion Vanguard Balanced Index,
which is a classic 60/40 indexed fund,
surged 10% while the average category fund gained 8.6%. Given that
40% of the fund is in boring bonds,
that compares well with the S&P 500
index’s 11.7% increase. For the year,
the Vanguard fund was up 17.6% versus the S&P 500’s eye-popping total
return of 26.3%.
Of course, most funds did well in
2023’s final quarter, in what was a
banner year overall for the stock market after 2022’s debacle. The true star
remained funds in the Technology
category, up 16.4% for the quarter and
43.3% for the year. Meanwhile, the
tech-dominated Nasdaq 100 index
was up a strong 14.6% that quarter
and a surreal 55.1% for the year.
The question is, what happens in a
likely turbulent 2024 election year? A
repeat of 2023’s exuberance seems nigh
impossible. That’s why less-risky allocation funds now make more sense.
Moderate Allocation
There are many kinds of allocation
funds, with different investment strategies. Morningstar has 21 allocation
fund categories, although 13 of those
are variations of what are called target-date funds, which adjust their
stock and bond allocations based on
investors’ expected retirement dates.
(Target-Date 2025, Target-Date 2030,
and so on.) You will most likely see
these funds in your 401(k) plan.
The oldest and most-traditional
balanced funds fall into Morningstar’s three “moderate allocation”
categories. Typically, Moderate Allocation category funds like Vanguard
Balanced Index have 50% to 70% of
their portfolios in stocks. Moderately
Conservative Allocation funds typically have 30% to 50% stocks, and
Moderately Aggressive Allocation
funds, 70% to 85%.
Although the passively managed
Vanguard Balanced Index is a perfectly good choice—with a dirt cheap
0.07% expense ratio—Vanguard also
runs some of the best actively managed allocation funds, notably the
$105 billion Vanguard Wellington
in the Moderate Allocation category.
Illustrations by
Alberto Miranda
GROWTH OR VALUE
Fidelity Puritan also has a highquality, if more growth-focused, stock
tilt and more flexibility in its stock
allocations, which have ranged between 60% and 71% since manager
Dan Kelley took over the fund in 2018.
That growth emphasis has led to category-dominating performance, with
the fund beating 96% of its peers in
the past 10 years. It tends to do poorly,
though, when growth stocks lag, as in
2022, when it fell 17.2% versus the
category’s average 13.6% loss.
Value investors should instead consider FPA Crescent, which has
beaten 90% of its peers in the past five
years. This fund is far more flexible
than other allocation funds. Morningstar categorizes it as Moderately Aggressive Allocation because in recent
years it has had 70% of its portfolio in
stocks. This seems misleading, though,
as the fund has proven successful in
downside risk control. In 2022, it lost
9.2% versus the Moderately Aggressive category’s 15% decline.
Since its launch in 1993, FPA Crescent’s managers have been successful
in their goal of achieving an “absolute
return”—not losing money in a fiveyear market cycle. “We’ve never had a
rolling five-year period in the fund’s
history where we’ve lost money,” says
co-manager Brian Selmo.
Although stocks typically hover in
the 50% to 70% allocation range for
FPA, they have been as low as 34%
after the 2007-09 financial crisis
ended in March 2009, when junk
bonds were paying equity-like yields,
and as high as 77% in 2021, when
bonds paid little and cash was unattractive. The management team will
hold cash, currently 28%, when they
can’t find attractive opportunities.
Selmo called bond valuations just
“OK,” so cash is still preferable.
Instead, FPA’s team has recently
been buying unusual stock value plays
like Heineken Holding, which trades
at a significant discount to the beer
maker’s common stock, and Douglas
Emmett, a real estate investment trust
with high-quality assets that has recently sold off.
ETFs
There are only 112 allocation exchangetraded funds compared with over 1,200
mutual funds. Two worthwhile ones are
iShares Core Growth Allocation and
Capital Group Core Balanced.
At $2.2 billion, the iShares fund is the
largest allocation ETF. It employs a
straightforward 60/40 indexed allocation strategy, but is more diversified
than Vanguard Balanced Index, having
24% exposure to international stocks.
That exposure has caused it to lag behind Vanguard’s fund, but it’s a good
option, with a low 0.15% expense ratio.
The Capital Group ETF just launched
in September, but it has a great pedigree.
It is run in a similar investment style,
and by some of the same managers, as
the $211 billion American Funds
American Balanced fund, which has
an excellent record. Yet the ETF has a
lower 0.33% expense ratio than the mutual fund’s 0.57%.
Conservative Allocation
It’s hard to beat Vanguard Wellesley Income in the Moderately Conservative Allocation category. Unlike Wellington, it invests in 35% to 40% stocks
and has a greater emphasis on dividendpaying ones. This should serve it well in
a recession as interest rates come down
and stocks with steady dividends become more attractive relative to bonds
with falling yields. The fund has a
0.23% expense ratio and has beaten 94%
of its category peers in the past 10 years,
but it lagged behind in 2023’s techstock-driven market.
For slightly more risk, you could buy
Fidelity Multi-Asset Income. Its
stock allocations are more flexible,
ranging between 30% and 60%, and
currently 34%. That flexibility has paid
off and the fund has dominated this
category, besting 99% of its peers in the
past five years.
Morningstar’s Conservative Allocation category is the least volatile, typically holding only between 15% to 30%
stocks. Just about 50 mutual funds fall
into this category. Still, there are excellent standouts, such as BlackRock
Managed Income and Victory Cornerstone Conservative. Both funds’
managers have proven skilled at shifting
between different fixed-income sectors
while keeping a lid on risk.
L4
For personal non-commercial use only. Do not edit or alter. Reproductions not permitted.
To reprint or license content, please contact Barron's reprints department at 800-843-0008 or www.djreprints.com
Global Allocation
Perhaps the most interesting category
today is Global Allocation, as stocks
are cheaper overseas. But it’s tricky to
run a global allocation fund well.
Fund managers must have deep analytical resources to cover the world in
both stocks and bonds.
T. Rowe Price Global Allocation
has those resources. Its managers,
Charles Shriver and Toby Thompson,
are backed by an 80-member multiasset team covering every asset class
worldwide. That has helped it beat
90% of its peers in the past decade.
Because of cheaper valuations, Shriver
is currently overweight emerging market stocks and bonds and favors U.S.
small-caps over large-caps.
While Shriver focuses more on
broad asset-class moves and largely
depends on T. Rowe’s deep bench of
fund managers to pick individual securities, other global allocation funds
do their own stock-picking, with a
particular value or growth tilt.
Loomis Sayles Global Allocation
has a definite growth slant, so it did
terrifically in 2023 and poorly in 2022,
but is excellent overall. Eaton Vance
Global Income Builder is more
eclectic, as its managers seek income
with high-yield bonds, but the fund
has a significant weighting in tech
stocks such as Microsoft, Alphabet,
and Amazon.com. “It’s a big differentiator because a lot of income funds
are solely focused on investing in companies that have those high dividend
yields,” says fund co-manager Chris
Dyer. “That will skew their allocation
to industries such as utilities, energy,
telecommunications, and insurance.”
More on the value side are First
Eagle Global and Vanguard Global
Wellington, both of which proved
defensive in 2022’s growth stock rout.
Although the U.S. Wellington fund
has a quality growth slant, Global
Wellington tilts more toward dividends and value investing. Consequently, Global Wellington’s average
portfolio stock price/earnings ratio is
12.6, cheaper than Wellington’s 16.8.
Lately, Global Wellington co-manager Nataliya Kofman has been buying
European stocks like consumer-staples conglomerate Unilever, which
has a hefty 3.8% dividend yield and is
in the midst of a turnaround, eliminating old products “consumers are not
willing to pay a premium for.” Long
term, she’s bullish on Japanese stocks,
which accounts for 9.8% of the fund’s
stock portfolio. She favors financials
BARRON’S
•
Funds Quarterly
January 8, 2024
Balancing Act
These 21 funds share strong performance records, low fees, and other attributes.
Fund / Ticker
Morningstar Category
Q4 2023
2023
BlackRock Managed Income / BLADX
Conservative Allocation
7.4%
10.0%
Victory Cornerstone Conservative / USCCX
Conservative Allocation
6.5
9.7
Fidelity Multi-Asset Income FMSDX
Moderately Conservative Allocation
6.9%
Vanguard Wellesley Income / VWINX
Moderately Conservative Allocation
7.9
American Funds American Balanced / ABALX
Moderate Allocation
Capital Group Core Balanced / CGBL
Moderate Allocation
iShares Core Growth Allocation / AOR
Total Return
2022
10-Year
Expense
Category Rank
Ratio
5-Year
10-Year
-9.5%
3.9%
3.8%
11
0.70%
-11.1
4.5
3.6
26
0.57
11.7%
-12.8%
10.6%
N/A
N/A
0.81%
7.0
-9.1
6.0
5.4
6
0.23
9.9%
14.0%
-12.1%
9.0%
7.6%
18
0.57%
9.5
N/A
N/A
N/A
N/A
N/A
0.33
Moderate Allocation
9.3
15.2
-15.3
7.7
5.9
60
0.15
Fidelity Puritan / FPURX
Moderate Allocation
10.0
20.2
-17.2
11.7
8.9
4
0.51
FPA Crescent / FPACX
Moderately Aggressive Allocation
7.5
20.3
-9.2
11.2
7.2
36
1.06
Vanguard Balanced Index / VBIAX
Moderate Allocation
10.0
17.6
-16.9
9.7
7.8
16
0.07
Vanguard Wellington / VWELX
Moderate Allocation
9.6
14.3
-14.3
9.7
7.9
13
0.25
Eaton Vance Global Income Builder / EDIAX
Global Allocation
9.7%
18.2%
-16.8%
9.2%
6.1%
6
1.17%
First Eagle Global / SGENX
Global Allocation
7.4
12.8
-6.5
9.1
6.1
7
1.11
Loomis Sayles Global Allocation / LGMAX
Global Allocation
12.1
22.2
-23.2
9.4
7
3
1.14
T. Rowe Price Global Allocation / RPGAX
Global Allocation
8.2
13.8
-14.5
7.9
5.8
10
0.94
Vanguard Global Wellington / VGWLX
Global Allocation
8.2
12.4
-7.2
9.3
N/A
N/A
0.50
American Funds 2035 Target Date
Retirement / RFFTX*
Target-Date 2035
10.5%
16.9%
-16.2%
10.5%
8.2%
1
0.35%
T. Rowe Price Retirement 2035 / TRPJX*
Target-Date 2035
10.0
18.3
-17.9
10.3
N/A
N/A
0.42
Columbia Thermostat / CTFAX
Tactical Allocation
8.5%
11.4%
-13.1%
8.9%
5.9%
20
0.85%
Hundredfold Select Alternative / HFSAX
Tactical Allocation
10.2
10.9
-9.4
10.9
7.5
8
1.75
Leuthold Core Investment / LCORX
Tactical Allocation
7.9
11.7
-6.8
8.1
6.1
18
1.38
Bloomberg U.S. Aggregate Bond Index
6.8%
5.5%
-13.1%
1.1%
1.8%
N/A
N/A
S&P 500 Stock Index
11.7
26.3
-18.1
15.7
12
N/A
N/A
Returns as of Dec. 29, 2023. Five- and 10-year returns are annualized. *The two target-date funds are institutional share classes comonly found in retirement plans. N/A=not applicable
Source: Morningstar Direct
such as Japan’s largest bank, Mitsubishi UFJ Financial Group, and insurer Tokio Marine Holdings.
Target-Date
Many Barron’s readers may feel too
sophisticated to use a target-date fund,
yet the products have $3.3 trillion in
assets because they’re often the qualified default investment alternatives in
401(k) plans. Thus, new employees
are automatically invested in them.
The good news is there are many
excellent target-date funds, and because they’re in 401(k)s, employees
often have access to their cheapest
institutional share classes. Many of
the best are run by the largest fund
shops. T. Rowe Price has excellent
ones, as do American Funds, Fidelity,
BlackRock, TIAA, and Dimensional
Fund Advisors. Though Vanguard
doesn’t dominate these categories performance-wise, it has the most assets.
It pays to look under the hood of
your target-date fund. For instance, T.
Rowe Price’s top-performing funds
have heavier equity weightings than
their competitors, leading to more
potential upside and down. Part of the
thinking behind the stock emphasis is
the concern that investors haven’t
saved enough and could outlive their
assets in retirement, according to T.
Rowe’s target-date fund lead manager
Wyatt Lee: “People tend to underestimate how long that they’re going to
need their assets.”
By way of comparison, as of Nov. 30,
T. Rowe Price Retirement 2035 had
78.7% of its assets in stocks and American Funds 2035 Target Date Retirement, 68.6%. Both have proven to
be excellent funds, but T. Rowe’s fund
has done better on the way up and
American better on the way down.
Of course, it isn’t just how much is
in equity in a target-date fund that
determines its risk. “You have to think
about the type of equity,” says Samir
Mathur, who, as chair of Capital
Group’s Portfolio Solutions Committee, helps determine American’s target-date fund allocations. “We find
that many of our competitors don’t
think along those lines. They use the
same type of equity throughout,
whether you’re a 20-year-old or 60.”
For younger investors in American
Funds, stocks are a lot more growthfocused, while for older investors,
there is more of a conservative, dividend-stock bent.
Tactical Allocation
The only strategy harder to pull off
than global allocation is tactical allocation, or shifting aggressively between
asset classes. Much academic research
has shown that market-timing different asset classes is a losing strategy for
most investors. Of the funds in Morningstar’s Tactical Allocation category,
Leuthold Core is one that truly stands
out, having more consistently hit the
mark with its allocation shifts than
most of its peers. Two other strong
performers have been Hundredfold
Select Alternative and Columbia
Thermostat.
Still, you really have to have faith in
a tactical fund manager to delegate
allocation decisions completely to
them. Given the more benign outlook
for bonds this year, now might be a
better time to stick to a steady-Eddie
fixed 60/40 balanced fund. B
January 8, 2024
BARRON’S
•
L5
Funds Quarterly
For personal non-commercial use only. Do not edit or alter. Reproductions not permitted.
To reprint or license content, please contact Barron's reprints department at 800-843-0008 or www.djreprints.com
FIND
YOUR
SILVER
LINING
BY UNCOVERING OPPORTUNITIES
See how our investment platform — backed by 100 years of active
management — can help you keep your clients focused on their
long-term goals. Find your silver lining at mfs.com/silverlining.
©2023 MFS Investment Management 55685.1
For personal non-commercial use only. Do not edit or alter. Reproductions not permitted.
To reprint or license content, please contact Barron's reprints department at 800-843-0008 or www.djreprints.com
L6
BARRON’S
•
Funds Quarterly
Japan Is Back. Here
Are the Best Funds.
Investors are reawakening to Japan’s long-term
potential. Here’s how to invest as the country shakes off
its decadeslong slumber.
BY LAWRENCE C. STRAUSS
J
apan is back in a big way.
The Nikkei 225 stock
index gained 28% in 2023,
eclipsing the S&P 500
index’s 24%. It was a big
turnaround from Japan’s
poor 2022 performance
and the relative doldrums of the past
decade.
The various catalysts driving Japanese stocks include a view that the
country is fixing its longtime deflation woes, improving corporate governance, and growing more shareholder-friendly through a series of
structural reforms over the past decade. And there is hope that the Bank
of Japan will soon become less re-
strictive in keeping a lid on bond
yields, making Japanese assets even
more attractive.
For all of those reasons and more,
this looks like a good time for U.S.
fund investors to consider increasing
their exposure to Japan.
Although U.S. investors can buy
American depositary receipts of Japanese companies, mutual funds can
offer more convenience and diversification than individual stocks do.
“It’s been happening for some time
now, but the pace of change really
started to pick up” in 2023, says
Drew Edwards, a portfolio manager
and head of Japan value equites at
GMO. “It’s still a pretty cheap market,” says Russ Koesterich, a portfolio
manager of the BlackRock Global
Allocation fund. “A lot of names in
Japan still score very well in terms of
their valuation, particularly compared with the U.S.”
Shuntaro Takeuchi, a manager of
the Matthews Japan fund, notes that
the MSCI Japan Index trades at 14.6
times forward 12-month earnings, in
the middle of its range for the past 10
January 8, 2024
years. Another encouraging sign, he
says, is that “Japan’s dividends and
buybacks have been steadily improving over the decade, but still lag behind other developed markets.”
There are different ways for U.S.
fund investors to play Japan. One option is international funds that have a
broader focus, such as the $123 billion
Vanguard FTSE Developed Markets exchange-traded fund. Japan
was the portfolio’s largest country
weighting, at 22%, as of Sept. 30. Investors, however, can drill down further by using various Japan-focused
funds, both active and passive.
Morningstar recently supplied Barron’s with a list of 26 open-end Japan
stock funds, 11 of which are actively
managed. The rest are index funds.
The largest is the $14 billion
iShares MSCI Japan ETF, which
covers roughly 85% of the Japanese
stock market, according to Zachary
Evens, a Morningstar research analyst.
“It’s not the entire universe, but it’s
a pretty full representation of the Japanese stock market,” he says. The
fund’s holdings include Toyota Motor, Sony Group, Mitsubishi UFJ
Financial Group, and Hitachi.
The iShares MSCI Japan exchangetraded fund and several other large
index funds have captured the lion’s
share of fund flows recently. The
iShares ETF alone raked in about
$2.7 billion on a net basis over the
12-month period ended Nov. 30, according to Morningstar.
Kristy Akullian, a senior investment strategist at iShares, a unit of
BlackRock, says the ETF “is very
much used by the retail investors, and
heavily traded by institutional ones.”
Many of the actively managed
Japan funds tracked by Morningstar,
however, have had outflows, even after a good stretch for Japanese stocks.
Investors “definitely prefer passive, and they definitely prefer lowercost,” says Evens.
The iShares ETF that tracks the
broad Japanese stock market sports an
expense ratio of 0.50%, compared with
around 1% for many of the actively
managed portfolios in this category.
Another big consideration for U.S.
investors is whether to pick a fund that
hedges currency risk.
The Nikkei 225 returned 31% last
year in local currency. That was well
ahead of the 22% result in U.S. dollars.
The yen slid to a multidecade low
against the greenback in mid-November. That currency, however, has re-
January 8, 2024
BARRON’S
•
Funds Quarterly
Rising Sums
These 10 U.S. funds focus on the Japanese stock market and had a strong
showing in 2023.
Fund / Ticker
1-Year
Total Return
3-Year
5-Year
Expense
Ratio
Assets
Index
Fund
$14.0 billion
Yes
iShares MSCI Japan / EWJ
20.3%
0.1%
6.6%
0.50%
JPMorgan BetaBuilders
Japan / BBJP
20.6
0.3
6.7
0.19
9.7
Yes
WisdomTree Japan
Hedged Equity / DXJ
42.0
21.1
17.0
0.48
2.9
Yes
Yes
Franklin FTSE Japan / FLJP
20.1
0.4
6.9
0.09
1.6
Matthews Japan / MJFOX
17.2
-5.7
6.5
1.05
$639 million
No
Fidelity Japan / FJPNX
15.2
-2.5
8.0
1.13
623
No
Fidelity SAI Japan Stock
Index / FSJPX
19.7
0.11
566
Yes
Fidelity Japan Smaller
Companies / FJSCX
14.9
-0.7
4.6
0.91
464
No
Hennessy Japan / HJPIX
22.4
-5.9
4.5
1.05
332
No
1.7
-12.8
2.4
1.02
322
No
T. Rowe Price
Japan / PRJPX
N/A
N/A
For personal non-commercial use only. Do not edit or alter. Reproductions not permitted.
To reprint or license content, please contact Barron's reprints department at 800-843-0008 or www.djreprints.com
Note: Data as of Dec. 29; three- and five-year returns are annualized. N/A=not applicable
gained some ground as traders have
factored in the increased likelihood of
a rate increase by the Bank of Japan,
while the Federal Reserve is likely to
cut rates this year. (The yen did
weaken a bit following the Jan. 1
earthquake on Japan’s west coast.)
E
vens says two crucial considerations are whether a fund
hedges and the length of an
investing time horizon. “The
longer the time horizon, the less effect exchange rates will have on the
overall performance of the fund,” he
says.
The iShares Currency Hedged
MSCI Japan ETF is very similar to
iShares MSCI Japan, but it hedges, as
its moniker suggests. With assets
under management of around $200
million, it’s tiny compared with its
much larger sister fund.
But the hedged version has had
much better performance over the
past half-decade. Its five-year annual
return is 14.5%, well ahead of the
6.6% result for the unhedged version.
Both funds have the same expense
ratio of 0.50%.
“I’m a little bit puzzled by the lack
of assets in the hedged version relative to the unhedged version, because
typically flows follow performance,”
says Evens.
Instead, the hedged version had
net outflows of about $2.7 million
during the 12 months ended Nov. 30.
Akullian of iShares says she
doesn’t believe “most retail investors
think about currency as much in in-
Source: Morningstar Direct
ternational exposure” and that “looking across all international exposures, we see a lot more money going
into unhedged than hedged.”
Of the 26 Japan funds that Morningstar tracks, only four actually hedge.
Matthews Japan, which is actively
managed, doesn’t hedge. With about
$640 million under management, it’s
the largest fund by assets among the
actively managed Japan-focused portfolios, according to Morningstar.
“My job is to invest in the companies that can provide good investment
results—not call the currency,” says
Takeuchi, one of the fund’s managers.
The fund returned about 18% in
2023, including dividends. Its fiveyear annual return of 6.5% ranks in
the top half of Morningstar’s Japan
stock category.
Takeuchi observes that investors
sometimes overlook the country’s
stock returns over the past decade.
He points out that from the beginning of 2014 through Nov. 30, the
MSCI Japan Index had an annual
return of 4.9%, compared with 4.2%
for the comparable index for Europe
and 2.6% for emerging markets. The
S&P 500 returned 11.6% annualized
over that period.
Change is certainly in the air in
Japan, and U.S. fund investors have
plenty of options to at least nibble.
“There’s actually good interest in
Japan, because investors are always
looking at change and the potential
for change,” says Simon Fennell, a
portfolio manager at William Blair
and longtime investor in Japan. B
Investing in Education would like to
recognize and thank Carson Group for
sponsoring Creighton University and
University of Nebraska–Lincoln to
improve financial proficiency. Pairing
the Next-Gen Talent with Barron’sranked RIAs.
Ron Carson
Founder and CEO
Carson Group
© 2023 Dow Jones & Company, Inc. All rights reserved. 2EIIE6137
L7
L8
BARRON’S
•
Funds Quarterly
January 8, 2024
Barron’s Lipper Fund Listings
Data provided by
Stock Funds
NOTICE TO READERS: DJ Quarterly tables are on pages L26 & L29.
OBJ
QTR
RETURN THROUGH 12/29
1YR
3 YRS
5 YRS
(Annualized)
10YRS
LATEST WK’S DATA
(as of Thursday)
CLOSE
WK’S
NAV
CHG
NAME
OBJ
QTR
RETURN THROUGH 12/29
1YR
3 YRS
5 YRS
(Annualized)
10YRS
LATEST WK’S DATA
(as of Thursday)
CLOSE
WK’S
NAV
CHG
AM BEACON LCV;INV
AM BEACON LCV;R5 r
AM BEACON SC VAL;INV
MLVE
MLVE
SCCE
517.6
1162.6
272.5
22.44
25.73
23.50
5.91
6.55
7.80
8.74
9.63
12.28
9.41
9.95
9.66
11.73
12.22
10.97
7.84
8.25
6.70
22.26
25.52
22.74
–0.24
–0.28
–1.03
AAM/BAHL&GAYNOR INCGRO;I r
AB ALL MKT REAL RET;1 r
AB ALL MKT TOT RET;A
AB CONC INTL GR;ADV r
AB CONCENTRATED GRO;ADV r
EIEI
RR
MTAM
ILCG
LCGE
1495.0
599.3
391.3
387.8
1060.7
22.88
8.53
14.21
10.52
52.72
8.78
5.96
9.18
9.13
12.84
6.79
4.59
11.04
4.26
19.70
6.84
8.06
0.21
–9.35
5.86
10.32
7.93
4.72
4.23
14.97
9.15
1.55
3.44
I
11.72
22.89
8.42
14.00
10.20
51.19
–0.02
–0.16
–0.24
–0.32
–1.71
AM BEACON SC VAL;R5 r
AMANA GROWTH;INV
AMANA INCOME;INV
AMER CENT BALANCED;INV
AMER CENT DC VAL;INV
SCCE
LCGE
EIEI
MTAM
MLVE
2160.9
2242.2
793.4
805.1
1571.1
24.94
71.42
60.07
17.94
32.72
8.12
13.71
8.01
9.85
8.80
12.89
25.66
13.55
16.18
8.44
10.09
10.02
8.28
3.67
5.44
11.39
18.69
12.63
8.46
10.21
7.08
14.29
9.25
6.51
8.21
24.14
69.71
59.96
17.69
32.49
–1.09
–1.79
–0.02
–0.28
–0.34
AB DISCOVERY GR;A
AB DISCOVERY GR;ADV r
AB DISCOVERY VALUE;ADV r
AB DISCOVERY VALUE;Z r
AB EQUITY INC;A
MCGE
MCGE
SCCE
SCCE
EIEI
582.1
1129.4
1506.4
761.6
299.2
10.02
11.34
22.20
21.18
30.33
12.08
12.17
14.77
14.83
11.82
18.72
18.99
16.98
17.08
22.50
–5.62
–5.40
10.03
10.08
11.18
10.83
11.11
10.57
10.64
12.27
8.49
8.74
7.36
7.44
8.64
9.59
10.85
21.53
20.53
29.95
–0.54
–0.61
–0.86
–0.83
–0.46
AMER CENT EM MKTS;I r
AMER CENT EM MKTS;INV
AMER CENT EM MKTS;R6 r
AMER CENT EQ GRO;INV
AMER CENT EQ INC;A
EM
EM
EM
MLCE
EIEI
493.7
337.5
460.9
1395.2
691.0
10.29
10.03
10.29
27.10
8.42
7.89
7.78
7.93
12.33
5.49
5.60
5.43
5.86
24.36
3.64
–10.53
–10.72
–10.39
6.64
5.27
1.86
1.65
2.02
12.25
7.80
2.40
2.20
2.56
9.29
7.72
10.10
9.84
10.10
26.62
8.46
–0.19
–0.19
–0.19
–0.55
+0.04
AB GROWTH;A
AB INTL LOW VOL EQ;ADV r
AB INTL SM CP;ADV r
AB INTLSTR EQ;ADV r
AB INTLSTR EQ;Z r
MLGE
IMLG
ISMC
IMLC
IMLC
1043.9
712.1
836.7
6070.2
1126.3
100.52
13.36
11.15
11.54
11.56
14.65
11.40
7.98
8.68
8.62
37.49
15.54
13.07
13.85
13.89
5.41
2.70
0.24
1.18
1.16
15.86
6.20
5.40
5.32
5.31
13.70
I
I
I
I
98.02
13.23
10.94
11.33
11.35
–2.79
–0.09
–0.20
–0.18
–0.18
AMER CENT EQ INC;I r
AMER CENT EQ INC;INV
AMER CENT EQ INC;R6 r
AMER CENT EQ INC;Y r
AMER CENT FOC DG;G r
EIEI
EIEI
EIEI
EIEI
MLGE
3056.3
3233.2
594.0
701.9
487.2
8.44
8.42
8.44
8.45
51.62
5.62
5.44
5.53
5.66
11.97
4.22
3.90
4.25
4.38
36.81
5.78
5.53
5.89
5.92
–1.77
8.30
8.07
8.46
8.48
I
8.22
8.00
8.38
I
I
8.48
8.46
8.49
8.49
49.81
+0.05
+0.04
+0.05
+0.04
–2.14
AB LG CAP GR;A
AB LG CAP GR;ADV r
AB LG CAP GR;C
AB LG CAP GR;I r
AB LG CAP GR;Z r
LCGE 4351.3
LCGE 12336.7
LCGE
492.3
LCGE
831.8
LCGE 5389.4
82.21
92.79
53.18
92.09
92.69
13.85
13.93
13.65
13.92
13.95
34.66
35.00
33.68
34.98
35.11
7.15
7.42
6.35
7.39
7.49
17.14
17.44
16.27
17.42
17.52
14.31
14.60
13.46
14.61
I
80.46
90.81
52.04
90.13
90.71
–1.93
–2.18
–1.25
–2.15
–2.17
AMER CENT FOC DG;I r
AMER CENT FOC DG;INV
AMER CENT FOC GL GRO;INV
AMER CENT FOC LC VAL;INV
AMER CENT GL GOLD;INV
MLGE
MLGE
GLCG
MLVE
AU
336.1
690.7
400.1
530.8
511.3
49.25
48.43
10.69
9.92
10.66
11.80
11.74
11.34
7.25
18.14
35.94
35.66
18.47
6.06
7.51
–2.39
–2.59
1.22
8.37
–5.02
16.44
16.21
12.54
10.73
7.03
13.45
13.22
8.30
7.86
4.12
47.51
46.72
10.44
9.98
10.17
–2.05
–2.02
–0.27
+0.06
–0.57
AB RELATIVE VALUE;A
AB RELATIVE VALUE;ADV r
AB SEL US LONG/SHORT;ADV r
AB SM CP CORE;ADV r
AB SM CP GR;A n
MLVE
MLVE
LSE
SCCE
SCGE
1338.3
353.9
1200.5
611.4
601.5
6.10
6.17
13.45
12.68
53.59
8.26
8.44
6.28
14.81
10.40
11.22
11.74
10.95
20.92
17.83
10.73
11.02
5.54
6.55
–7.77
11.43
11.76
8.70
11.05
10.35
8.93
9.22
6.11
I
8.47
6.07
6.13
13.37
12.28
51.03
–0.05
–0.05
–0.09
–0.55
–3.23
AMER CENT GROWTH;I r
AMER CENT GROWTH;INV
AMER CENT GROWTH;R6 r
AMER CENT HERTGE;INV
AMER CENT INT SM-MC;G r
LCGE
LCGE
LCGE
MLGE
ISMG
1692.2
9005.0
1223.3
3710.0
443.8
50.19
48.57
50.36
21.88
9.45
14.89
14.83
14.93
11.09
9.12
43.55
43.27
43.78
20.64
5.02
8.01
7.79
8.17
–1.25
–4.38
18.29
18.05
18.47
13.21
8.29
13.75
13.52
13.92
9.35
I
48.79
47.22
48.96
21.08
9.18
–1.58
–1.52
–1.58
–0.95
–0.27
AB SM CP GR;I nr
AB SM CP GR;Z r
AB SUS INTL THEMATIC;ADV r
AB SUSTAIN GL THEM;A
AB SUSTAIN GL THEM;ADV r
SCGE
SCGE
IMLG
GMLG
GMLG
445.7
1115.8
656.9
718.4
1062.0
61.55
62.16
19.69
145.74
158.23
10.48
10.51
11.68
11.22
11.28
18.14
18.26
13.42
15.97
16.25
–7.50
–7.42
–3.39
1.08
1.34
10.65
10.75
8.29
13.26
13.54
8.77
I
4.16
9.74
10.02
58.61
59.18
19.06
141.37
153.49
–3.71
–3.75
–0.64
–4.65
–5.04
AMER CENT INTL GR;I r
AMER CENT INTL GR;INV
AMER CENT ITL OPP;INV
AMER CENT MC VAL;I r
AMER CENT MC VAL;INV
ILCG
ILCG
ISMG
MCVE
MCVE
285.2
887.8
358.0
1686.6
1904.7
12.05
12.13
9.07
15.57
15.55
10.75
10.68
9.28
10.57
10.45
12.51
12.31
8.62
6.35
6.15
–2.77
–2.98
–7.20
9.01
8.80
8.26
8.05
6.21
11.25
11.02
4.09
3.87
3.90
8.92
8.70
11.69
11.76
8.76
15.50
15.48
–0.36
–0.37
–0.31
–0.11
–0.11
AB TM WLTH APPR STR;ADV r
AB VALUE;ADV r
AB WEALTH APP;A
AB WEALTH APP;ADV r
ABRDN EMERGING MKTS;INST r
GLCC
MLVE
MTAA
MTAA
EM
712.9
344.4
336.0
802.0
1162.7
19.09
16.40
18.55
18.47
13.13
10.60
9.10
10.79
10.92
7.25
20.54
18.79
20.72
21.05
6.65
5.74
12.14
5.72
6.00
–9.26
10.83
11.37
10.77
11.07
2.85
7.39
6.70
7.00
7.28
1.89
18.73
16.25
18.20
18.12
12.74
–0.39
–0.20
–0.38
–0.37
–0.38
AMER CENT MC VAL;R6 r
AMER CENT N-US IV;G r
AMER CENT OC 2025;INV
AMER CENT OC 2025;R6 r
AMER CENT OC 2030;I r
MCVE
IMLV
MATG
MATG
MATC
3462.3
470.9
607.3
453.7
277.3
15.56
9.27
13.46
9.38
11.99
10.55
9.78
7.99
8.07
8.56
6.52
24.22
11.25
11.58
12.31
9.17
8.47
1.60
1.95
1.91
11.40
6.10
6.52
6.88
7.26
9.08
I
5.04
5.40
5.63
15.49
9.16
13.32
9.29
11.85
–0.12
–0.10
–0.16
–0.11
–0.15
ABRDN US SM CAP EQ;INST r
ACADIAN EMRG MKT;INV
AEGIS VALUE;I r
AKRE FOCUS FUND;INST r
AKRE FOCUS FUND;RTL
SCGE
EM
SCVE
LCGE
LCGE
264.8
310.5
371.1
7326.5
4527.2
34.81
20.58
35.35
59.76
57.37
9.98
8.22
5.33
16.70
16.62
11.46
22.62
13.13
28.75
28.39
2.69
1.55
19.84
7.40
7.11
11.53
6.40
20.75
15.14
14.84
9.16
3.66
9.18
13.21
12.91
33.67
20.39
34.95
58.62
56.28
–1.56
–0.16
–0.50
–1.33
–1.28
AMER CENT OC 2030;INV
AMER CENT OC 2030;R
AMER CENT OC 2030;R6 r
AMER CENT OC 2035;I r
AMER CENT OC 2035;INV
MATC
MATC
MATC
MATD
MATD
380.7
324.6
560.8
273.8
565.6
12.00
11.99
10.64
15.33
15.32
8.43
8.28
8.49
8.86
8.80
12.07
11.53
12.47
13.08
12.86
1.71
1.17
2.04
2.01
1.81
7.03
6.50
7.41
7.80
7.59
5.42
4.89
5.77
6.01
5.80
11.86
11.85
10.52
15.14
15.12
–0.15
–0.16
–0.14
–0.22
–0.22
ALGER II SPECTRA;A
ALGER INST CAP APP;I r
ALGER PORT CAP APP;I-2
ALGER PORT LCG;I-2
ALGER CAPITAL APPREC;A
LCGE
LCGE
LCGE
MLGE
LCGE
1046.7
1080.6
395.9
294.3
828.8
20.48
33.12
78.22
62.42
25.27
14.80
15.23
15.20
12.75
15.26
41.34
42.88
43.13
32.67
43.04
–1.41
2.10
2.67
–3.09
2.05
12.70
14.90
15.43
14.14
14.91
10.98
12.14
12.54
11.03
12.12
19.81
32.16
76.01
60.62
24.54
–0.75
–1.09
–2.50
–2.08
–0.82
AMER CENT OC 2035;R
AMER CENT OC 2035;R6 r
AMER CENT OC 2040;INV
AMER CENT OC 2040;R
AMER CENT OC 2040;R6 r
MATD
MATD
MATH
MATH
MATH
349.5
546.3
291.2
321.9
435.5
15.33
9.76
12.83
12.83
11.06
8.71
8.92
9.11
9.02
9.21
12.29
13.26
13.64
13.08
14.01
1.30
2.15
1.93
1.42
2.30
7.05
7.97
8.14
7.60
8.53
5.27
6.16
6.21
5.69
6.58
15.13
9.64
12.66
12.65
10.91
–0.22
–0.14
–0.20
–0.21
–0.17
ALLSPRING GL L/S EQ;R6 r
AM BEACON INTL EQ;R5 r
LSE
ILCV
421.6
394.2
11.61
18.24
5.48
7.49
3.12
20.09
3.75
5.48
3.76
7.22
I
3.08
11.67
18.01
+0.08
–0.24
AMER CENT OC 2045;INV
AMER CENT OC 2045;R
AMER CENT OC 2045;R6 r
AMER CENT OC 2050;R
AMER CENT OC 2050;R6 r
MATI
MATI
MATI
MATE
MATE
411.4
314.6
416.1
259.1
348.5
16.54
16.56
9.91
13.84
11.94
9.50
9.37
9.59
9.63
9.78
14.31
13.80
14.70
14.55
15.46
2.13
1.64
2.49
2.03
2.89
8.76
8.22
9.14
8.91
9.83
6.64
6.11
7.01
6.51
7.39
16.30
16.31
9.77
13.62
11.76
–0.28
–0.28
–0.16
–0.25
–0.21
AMER CENT OC 2055;R6 r
AMER CENT OC IN RET;INV
AMER CENT OC IN RET;R6 r
AMER CENT OC AGGR;INV
AMER CENT OC CONSV;INV
MATK
MATJ
MATJ
MTAG
MTAM
257.7
743.9
379.8
880.9
1134.9
12.67
11.97
9.11
14.77
12.53
10.09
7.86
7.97
9.63
7.96
16.10
11.07
11.38
15.15
10.52
3.13
1.63
1.96
2.78
1.19
10.15
6.13
6.50
9.71
6.29
7.60
4.63
4.97
7.02
4.77
12.47
11.84
9.02
14.53
12.39
–0.23
–0.14
–0.10
–0.27
–0.16
AMER CENT OC MODT;INV
AMER CENT OC VRYAGG;INV
AMER CENT OC VRYCSV;INV
AMER CENT REAL EST;INV
AMER CENT REAL EST;R6 r
MTAG
MTAA
MTAC
RE
RE
1759.9
332.8
403.8
296.1
281.7
14.22
17.28
11.17
24.88
24.97
9.08
10.63
6.57
16.13
16.28
13.03
17.28
7.60
10.99
11.43
1.89
3.03
0.58
5.70
6.08
8.09
11.08
4.50
7.18
7.57
5.95
7.90
3.61
7.13
7.51
14.02
16.95
11.09
24.56
24.64
–0.23
–0.38
–0.10
–0.61
–0.61
AMER CENT SC GRO;G r
AMER CENT SC GRO;I r
AMER CENT SC GRO;INV
AMER CENT SC GRO;R6 r
AMER CENT SC VAL;G nr
SCGE
SCGE
SCGE
SCGE
SCCE
483.4
757.8
763.5
929.8
476.5
20.88
19.63
18.67
20.06
10.53
11.30
11.09
11.00
11.07
14.64
18.43
17.33
17.13
17.52
17.42
–1.49
–2.43
–2.63
–2.30
11.82
I
13.98
13.75
14.15
I
I
10.06
9.84
10.22
I
20.10
18.89
17.97
19.31
10.20
–1.00
–0.95
–0.90
–0.97
–0.44
About Our Listings
The quarterly mutual fund listings cover funds with at least $250 million in
assets.
FOOTNOTES
s Copyright Lipper
For personal non-commercial use only. Do not edit or alter. Reproductions not permitted.
To reprint or license content, please contact Barron's reprints department at 800-843-0008 or www.djreprints.com
NAME
LATEST
REPORTED
NAV
ASSETS
($ SHR)
($MIL)
12/29/23
LATEST
REPORTED
NAV
ASSETS
($ SHR)
($MIL)
12/29/23
r
means the fund is only open to institutions
or to certain groups. AHA Investment
Funds, for example, are open to
participants in the Amercian Hospital
Association’s Investment Program
n means the fund is closed to new investors.
H indicates something unusual is going on
that may affect the fund’s performance or
operation. Check the footnotes for details.
January 8, 2024
BARRON’S
•
L9
Funds Quarterly
Stock Funds
s Copyright Lipper
For personal non-commercial use only. Do not edit or alter. Reproductions not permitted.
To reprint or license content, please contact Barron's reprints department at 800-843-0008 or www.djreprints.com
NAME
OBJ
LATEST
REPORTED
NAV
ASSETS
($ SHR)
($MIL)
12/29/23
QTR
RETURN THROUGH 12/29
1YR
3 YRS
5 YRS
(Annualized)
10YRS
LATEST WK’S DATA
(as of Thursday)
CLOSE
WK’S
NAV
CHG
NAME
Data provided by
OBJ
LATEST
REPORTED
NAV
ASSETS
($ SHR)
($MIL)
12/29/23
QTR
RETURN THROUGH 12/29
1YR
3 YRS
5 YRS
(Annualized)
10YRS
LATEST WK’S DATA
(as of Thursday)
CLOSE
WK’S
NAV
CHG
AMER CENT SC VAL;I nr
AMER CENT SC VAL;INV n
AMER CENT SC VAL;R6 nr
AMER CENT SELECT;INV
AMER CENT STR MDT;A
SCCE
SCCE
SCCE
LCGE
MTAM
2070.3
802.8
2345.2
4256.2
258.2
10.50
10.37
10.51
100.14
6.09
14.41
14.43
14.56
11.76
8.83
16.34
16.08
16.62
39.90
12.86
10.87
10.67
11.07
7.56
2.50
14.74
14.54
14.94
17.84
8.48
8.93
8.72
9.10
13.49
5.94
10.17
10.04
10.17
97.27
6.00
–0.45
–0.44
–0.45
–3.34
–0.10
ARTISAN MID CAP V;INV
ARTISAN MID CAP;INST nr
ARTISAN MID CAP;INV n
ARTISAN SMALL CAP;INV
AVANTIS EMG MKT EQ;INSTL r
MCCE
MCGE
MCGE
SCGE
EM
365.7
2504.5
1327.3
509.8
331.4
15.52
41.59
34.78
32.23
11.06
11.21
8.96
8.86
9.18
9.02
18.15
24.30
23.99
9.29
15.15
9.02
–4.51
–4.74
–11.10
–0.28
11.03
13.91
13.64
9.65
I
6.27
9.16
8.90
8.00
I
15.24
40.05
33.50
30.63
10.85
–0.36
–1.87
–1.56
–2.08
–0.19
AMER CENT SUSTAIN E;G r
AMER CENT SUSTAIN E;I r
AMER CENT SUSTAIN E;INV
AMER CENT ULTRA;A
AMER CENT ULTRA;I r
LCCE
LCCE
LCCE
LCGE
LCGE
2847.3
430.9
848.1
265.9
1168.3
47.32
47.22
47.13
68.88
79.11
11.98
11.82
11.76
14.06
14.18
25.18
24.45
24.20
42.96
43.59
9.59
8.94
8.73
5.78
6.25
I
15.68
15.45
18.88
19.42
I
11.76
11.54
14.26
14.77
46.53
46.43
46.34
66.68
76.59
–0.91
–0.92
–0.92
–2.51
–2.87
AVANTIS INTL SCV;INSTL r
AVANTIS US EQTY;INSTL r
AVANTIS US SCV;INSTL r
AVE MARIA GROWTH
AVE MARIA RISING DIV
ISMV
MLCE
SCCE
MLGE
EIEI
285.6
612.2
546.1
980.7
1003.6
11.76
15.58
16.27
44.71
21.16
9.51
11.89
15.18
14.25
9.43
16.74
21.45
22.97
30.29
13.19
6.27
9.83
17.99
6.45
10.36
I
I
I
14.38
12.79
I
I
I
11.12
9.19
11.61
15.27
15.84
42.74
20.69
–0.15
–0.38
–0.62
–2.17
–0.51
AMER CENT ULTRA;INV
AMER CENT ULTRA;R6 r
AMER CENT VALUE;I r
AMER CENT VALUE;INV
AMERICAN FUNDS AMCP;A
LCGE 17661.1
LCGE 1970.1
MLVE
477.6
MLVE 1158.0
MLGE 34453.4
74.52
79.92
7.87
7.84
38.12
14.13
14.24
9.61
9.44
14.26
43.31
43.82
9.06
8.73
30.98
6.04
6.42
10.83
10.60
4.87
19.18
19.60
11.77
11.55
12.08
14.54
14.94
8.45
8.23
10.06
72.14
77.36
7.87
7.84
37.10
–2.71
–2.91
–0.01
–0.02
–1.21
AVE MARIA VALUE
BARON ASSET FUND;INST r
BARON ASSET FUND;RTL
BARON DISCOVERY;INST r
BARON EMERG MKT;INST r
MCGE
MCGE
MCGE
SCGE
EM
372.0
2478.8
2170.0
1234.5
4283.8
23.85
103.99
98.03
28.01
14.02
2.46
12.45
12.38
12.44
6.81
3.52
17.35
17.04
22.58
8.29
10.52
–0.21
–0.47
–5.86
–8.96
11.55
12.82
12.53
11.94
2.99
6.23
10.49
10.20
11.02
2.48
23.34
100.39
94.64
26.46
13.75
–0.68
–4.14
–3.90
–1.95
–0.24
AMERICAN FUNDS BAL;A
AMERICAN FUNDS CIB;A
AMERICAN FUNDS CWGI;A
AMERICAN FUNDS EUPC;A
AMERICAN FUNDS FINV;A
MTAG
GEI
GLCC
ILCG
LCCE
95055.9
58827.2
51723.6
19437.0
62394.5
31.99
66.22
60.12
54.69
71.49
9.88
9.29
11.81
10.26
13.33
14.01
8.96
20.80
15.60
25.88
5.07
5.18
4.67
–3.02
8.71
8.92
7.12
10.64
7.64
13.51
7.55
5.18
7.23
4.53
10.66
31.61
65.87
59.24
53.64
70.21
–0.43
–0.41
–0.96
–1.08
–1.51
BARON EMERG MKT;RTL
BARON FIFTH AVE GRO;INST r
BARON FOCUSED GRO;INST r
BARON FOCUSED GRO;RTL
BARON GLOBAL ADVTG;INST r
EM
MLGE
MLGE
MLGE
GMLG
253.2
398.7
688.3
316.3
471.8
13.93
43.35
38.09
36.45
31.49
6.80
17.61
9.74
9.66
14.80
8.03
57.58
27.78
27.40
25.56
–9.18
–4.62
3.05
2.77
–15.03
2.72
11.93
26.01
25.69
9.88
2.21
11.04
15.54
15.25
9.04
13.66
41.11
37.20
35.60
30.08
–0.24
–2.60
–1.27
–1.21
–1.69
AMERICAN FUNDS GB;A
AMERICAN FUNDS GRO;A
AMERICAN FUNDS ICA;A
AMERICAN FUNDS IG&I;A
AMERICAN FUNDS INC;A
FX
5073.1
LCGE 118064.3
LCCE 75492.5
ILCC 4196.1
MTAM 72329.3
36.31
63.16
50.40
35.87
23.44
10.48
14.29
13.69
9.39
8.72
13.68
37.20
28.50
15.27
7.59
2.08
4.29
10.72
2.24
5.73
6.63
14.90
14.12
7.93
8.09
4.62
11.85
10.62
3.67
6.48
35.88
61.53
49.46
35.36
23.28
–0.49
–1.97
–1.08
–0.49
–0.18
BARON GROWTH;INST r
BARON GROWTH;RTL
BARON INTERNATL GRO;INST r
BARON OPPORTUNITY;INST r
BARON OPPORTUNITY;RTL
MCGE
MCGE
IMLG
MLGE
MLGE
5314.3
2313.7
314.5
546.3
552.0
101.08
95.66
25.98
37.57
35.28
7.70
7.63
7.78
15.10
15.03
14.97
14.68
7.60
49.98
49.55
2.34
2.08
–4.91
–1.26
–1.51
14.92
14.62
7.79
20.71
20.40
10.24
9.96
5.18
14.08
13.78
98.74
93.44
25.29
35.98
33.78
–3.02
–2.86
–0.64
–1.84
–1.74
AMERICAN FUNDS MUT;A
AMERICAN FUNDS NECO;A
AMERICAN FUNDS NPER;A
AMERICAN FUNDS NWLD;A
AMERICAN FUNDS SMCP;A
LCVE
GMLG
GLCG
EM
GSME
36351.1
14298.8
53593.6
12401.2
25970.7
51.00
53.97
55.90
75.03
66.25
9.29
13.44
11.36
8.83
13.18
9.40
29.07
24.59
15.72
18.85
9.30
0.53
2.84
–1.89
–2.79
10.73
11.38
13.54
8.49
10.55
9.14
9.37
9.76
5.09
7.64
50.79
52.67
54.81
73.85
64.11
–0.28
–1.52
–1.21
–1.18
–2.53
BARON PARTNERS FUND;INST r
BARON PARTNERS FUND;RTL
BARON REAL ESTATE;INST r
BARON REAL ESTATE;RTL
BARON SMALL CAP FUND;INS r
MLGE
MLGE
RE
RE
SCGE
3465.3
2961.5
1319.0
381.7
3075.7
166.21
159.63
35.75
34.72
32.69
8.39
8.33
18.42
18.33
12.64
43.47
43.09
25.04
24.70
27.19
2.86
2.60
3.62
3.36
0.52
31.57
31.23
18.32
18.01
14.02
19.11
18.80
10.06
9.78
9.31
160.18
153.83
34.67
33.67
31.37
–8.01
–7.70
–1.38
–1.34
–1.68
AMERICAN FUNDS T2010;A
AMERICAN FUNDS T2015;A
AMERICAN FUNDS T2020;A
AMERICAN FUNDS T2025;A
AMERICAN FUNDS T2030;A
MATA
MATF
MATB
MATG
MATC
534.3
819.4
2210.3
3659.4
4022.7
11.31
11.90
12.97
14.57
16.14
7.63
7.98
8.45
8.81
9.63
8.43
9.23
10.06
11.56
14.08
2.27
2.40
2.48
2.52
3.12
5.73
6.15
6.53
7.46
8.54
4.75
5.03
5.42
6.05
6.89
11.22
11.80
12.85
14.42
15.93
–0.09
–0.11
–0.13
–0.17
–0.23
BARON SMALL CAP FUND;RTL
BERNSTEIN INTLSTR EQ;SCB r
BLACKROCK ADV GLBL;A
BLACKROCK ADV INTL;I r
BLACKROCK ADV LC CR;A
SCGE
IMLC
GLCC
ILCC
MLCE
1303.6
382.9
272.9
990.1
1435.5
30.26
11.53
23.55
18.04
18.92
12.57
8.35
11.30
10.50
12.08
26.88
13.30
22.42
19.44
25.28
0.27
0.83
5.72
5.32
8.60
13.73
5.02
11.38
8.81
14.55
9.03
I
6.65
4.81
10.79
29.04
11.32
23.09
17.79
18.59
–1.55
–0.19
–0.48
–0.20
–0.39
AMERICAN FUNDS T2035;A
AMERICAN FUNDS T2040;A
AMERICAN FUNDS T2045;A
AMERICAN FUNDS T2050;A
AMERICAN FUNDS WASH;A
MATD 3405.6
MATH 2930.7
MATI 2302.4
MATE 2093.3
LCVE 75424.6
17.55
18.47
18.94
18.62
57.20
10.36
11.19
11.48
11.60
11.28
16.50
18.95
19.73
20.34
17.22
3.83
4.42
4.48
4.38
11.30
10.02
10.81
11.00
11.03
13.27
7.79
8.23
8.37
8.42
10.61
17.30
18.17
18.62
18.30
56.55
–0.29
–0.34
–0.37
–0.37
–0.74
BLACKROCK ADV LC CR;I r
BLACKROCK ADV LCG;A
BLACKROCK ADV LCG;I r
BLACKROCK ADV LCV;A
BLACKROCK ADV SC GR;INST r
MLCE
LCGE
LCGE
MLVE
SCGE
1374.3
501.5
565.7
375.0
349.2
20.02
21.80
23.18
29.08
18.84
12.17
14.42
14.49
10.23
13.93
25.61
39.37
39.75
13.42
18.73
8.88
7.05
7.31
9.34
–2.64
14.85
17.02
17.30
11.00
10.51
11.07
11.40
11.71
8.47
7.22
19.67
21.22
22.57
28.90
18.15
–0.41
–0.65
–0.69
–0.27
–0.95
AMG BOSTON COM GL IMP;I
AMG GW&K SC CORE;I r
AMG GW&K SM/MD CAP CR;I r
AMG GW&K SM/MD CAP CR;Z r
AMG RR MID CAP VAL;N
MLCE
SCGE
SCGE
SCGE
MCCE
587.5
421.3
296.4
362.5
251.3
37.79
30.30
17.26
17.29
20.24
13.03
10.34
12.30
12.32
11.60
13.74
8.39
14.76
14.78
22.64
–0.58
3.28
5.81
5.88
14.07
10.27
11.29
13.84
13.90
12.22
8.64
7.60
I
I
7.03
36.56
29.16
16.69
16.72
19.90
–1.34
–1.49
–0.73
–0.73
–0.43
BLACKROCK CAP APP;A
BLACKROCK CAP APP;I r
BLACKROCK CAP APP;K r
BLACKROCK EMG MKT;A
BLACKROCK EMG MKT;I r
LCGE
LCGE
LCGE
EM
EM
1938.5
737.2
597.4
306.7
3675.0
31.89
36.55
37.00
23.31
24.25
15.77
15.83
15.86
8.61
8.67
48.85
49.26
49.40
10.50
10.77
3.75
4.02
4.10
–6.22
–5.99
15.58
15.88
15.99
5.26
5.52
12.37
12.67
12.79
3.38
3.72
30.82
35.34
35.77
22.78
23.70
–1.20
–1.37
–1.38
–0.50
–0.51
AMG RR SM CAP VAL;I r
AMG TIMESSQUAREMCG;I r
AMG TIMESSQUAREMCG;N
AMG TIMESSQUAREMCG;Z r
AMG YACKTMAN FOCSD;I r
SCCE
MCGE
MCGE
MCGE
MLVE
900.4
401.7
411.4
482.3
1902.3
15.29
16.50
15.41
16.60
20.10
8.69
13.54
13.54
13.52
10.66
15.09
24.94
24.82
25.03
16.67
9.45
4.08
3.94
4.15
7.83
11.73
15.59
15.42
15.66
11.94
8.61
I
10.49
10.72
9.86
14.99
15.92
14.87
16.02
19.86
–0.39
–0.66
–0.61
–0.66
–0.28
BLACKROCK EQTY DIV;A
BLACKROCK EQTY DIV;C
BLACKROCK EQTY DIV;I r
BLACKROCK EQTY DIV;R r
BLACKROCK GL ALLOC;A
EIEI
EIEI
EIEI
EIEI
FX
4686.8
265.2
10118.4
407.1
8788.0
19.08
17.86
19.18
19.39
18.28
9.77
9.60
9.91
9.71
9.85
12.37
11.49
12.69
12.00
12.34
8.94
8.13
9.20
8.57
0.13
11.26
10.44
11.53
10.89
7.29
8.76
7.97
9.03
8.41
4.52
19.08
17.86
19.18
19.38
17.99
–0.02
–0.02
–0.01
–0.02
–0.32
AMG YACKTMAN FOCSD;N
AMG YACKTMAN FUND;I r
AQR DIV ARBITRAGE;I r
AQR DIV ARBITRAGE;R6 r
AQR DIV STRAT;I r
MLVE
MLVE
AED
AED
AMS
1798.8
8474.5
1217.8
527.5
421.7
20.18
23.34
11.89
11.89
11.22
10.59
9.78
1.55
1.57
–0.65
16.45
15.39
4.51
4.70
8.88
7.63
8.54
2.41
2.53
11.38
11.74
11.64
7.85
7.95
I
9.66
9.42
4.38
I
I
19.95
23.13
11.89
11.88
11.27
–0.28
–0.25
+0.00
–0.01
+0.05
BLACKROCK GL ALLOC;C
BLACKROCK GL ALLOC;I r
BLACKROCK GL ALLOC;R r
BLACKROCK HI EQ INC;A
BLACKROCK HI EQ INC;I r
FX
FX
FX
EIEI
EIEI
401.1
6900.7
281.8
300.9
1464.0
15.84
18.44
17.05
23.33
27.89
9.66
9.93
9.74
8.79
8.90
11.50
12.62
11.96
9.71
9.99
–0.64
0.39
–0.23
9.73
10.01
6.46
7.57
6.91
9.84
10.12
3.73
4.80
4.17
7.50
7.82
15.58
18.15
16.78
23.29
27.84
–0.29
–0.32
–0.30
–0.06
–0.07
AQR EM MLT-STYLE II;R6 r
AQR GLOBAL EQUITY;R6 r
AQR INTL MULT-STYLE;R6 r
AQR LG CAP DEF STYLE;I r
AQR LG CAP DEF STYLE;R6 r
EM
GMLV
IMLV
MLCE
MLCE
435.5
307.4
436.8
1878.4
733.9
9.56
9.61
12.88
21.98
21.93
8.07
8.24
10.38
7.56
7.53
12.64
23.00
19.70
9.41
9.47
–3.57
7.73
5.73
5.24
5.30
3.73
10.92
8.62
11.14
11.23
I
I
I
11.08
I
9.38
9.51
12.78
21.97
21.93
–0.19
–0.11
–0.07
+0.01
+0.02
BLACKROCK HS OPP;A
BLACKROCK HS OPP;C
BLACKROCK HS OPP;I r
BLACKROCK INTL DIV;I r
BLACKROCK INTL;A
H
H
H
IEI
ILCG
2811.9
334.7
4224.7
541.4
359.3
65.40
53.67
69.96
34.64
19.13
5.79
5.59
5.87
11.34
12.35
3.57
2.79
3.84
15.61
19.37
2.89
2.12
3.15
5.66
–0.53
10.27
9.45
10.56
9.75
9.46
11.43
10.62
11.73
3.70
3.98
66.52
54.58
71.16
33.93
18.69
+1.16
+0.95
+1.25
–0.66
–0.44
AQR LG CAP MOM STYLE;I r
AQR LG CAP MULT-STYLE;R6 r
AQR LNG-SHT EQTY;I r
AQR MGD FUTURES STRAT;I r
AQR RISK-BAL COMM STR;I r
MLCE
MLCE
LSE
MFF
CMG
341.9
861.2
906.6
1151.8
377.6
19.22
17.07
13.19
8.18
8.29
12.38
10.63
2.92
–4.55
–0.68
18.06
26.30
24.38
1.80
–0.23
6.83
10.70
24.77
10.89
19.14
14.84
14.18
11.09
6.72
16.66
10.90
I
9.36
2.50
4.51
18.71
16.76
13.43
8.15
8.16
–0.58
–0.37
+0.29
–0.05
–0.25
BLACKROCK INTL;I r
BLACKROCK IS EAFE;A
BLACKROCK IS EAFE;INST r
BLACKROCK IS R2000;INST r
BLACKROCK IS S&P500;K r
ILCG 1053.3
ILCC
388.2
ILCC 1156.8
SCCE
404.3
SPSP 13687.2
19.61
15.08
15.19
22.90
558.85
12.36
10.75
10.85
14.01
11.67
19.68
18.02
18.32
16.90
26.24
–0.29
3.91
4.16
2.21
9.96
9.73
7.98
8.25
9.96
15.66
4.30
3.97
4.24
7.14
12.00
19.17
14.83
14.94
22.12
549.46
–0.44
–0.21
–0.22
–1.13
–10.95
AQR STYLE PREMIA AL;I r
AQR STYLE PREMIA AL;R6 r
ARBITRAGE FUND;I r
ARI FDS PTF OP GRO;A
ARIEL APPRECIATION;INV
ABR
ABR
AED
MLCE
MCVE
356.9
482.1
925.9
576.0
839.3
6.84
6.88
13.20
11.28
39.14
–5.51
–5.50
3.37
9.72
10.70
12.81
12.84
6.05
15.95
10.62
22.53
22.66
2.11
2.38
6.83
5.67
5.78
3.16
8.87
10.28
4.54
I
2.71
6.14
6.32
7.06
7.10
13.19
11.09
37.82
+0.25
+0.25
–0.02
–0.34
–1.64
BLACKROCK LC FOC GRO;A
BLACKROCK LC FOC GRO;I r
BLACKROCK LC FOCUS VAL;A
BLACKROCK LC FOCUS VAL;I r
BLACKROCK MC GRO;A
LCGE
LCGE
MLVE
MLVE
MCGE
891.6
493.1
838.7
997.8
1723.2
6.20
6.95
18.01
18.49
32.66
15.60
15.57
10.96
11.04
14.76
52.65
52.69
15.92
16.22
27.93
3.22
3.46
10.47
10.75
–3.00
16.08
16.35
11.45
11.76
12.57
12.94
13.26
7.64
7.94
11.19
6.00
6.73
17.94
18.42
31.22
–0.23
–0.25
–0.10
–0.11
–1.66
ARIEL FUND;INVESTOR
ARISTOTLE INTL EQ;I2
ARISTOTLE VAL EQTY;I2
ARTISAN GLOBAL OPP;INST r
ARTISAN GLOBAL OPP;INV
MCVE
ILCC
GMLC
GLCG
GLCG
1235.3
420.4
679.1
1535.4
690.1
68.30
13.17
20.28
31.80
30.90
13.41
10.27
14.30
13.13
13.03
15.81
17.73
19.70
23.29
23.00
7.02
2.54
8.30
–0.65
–0.91
10.95
8.09
13.94
13.30
13.03
7.54
I
I
10.04
9.77
66.00
12.87
19.96
30.87
30.00
–2.91
–0.30
–0.36
–1.01
–0.98
BLACKROCK MC GRO;I r
BLACKROCK MD CP VAL;A
BLACKROCK MD CP VAL;I r
BLACKROCK MLT-A INC;A
BLACKROCK MLT-A INC;C
MCGE
MCVE
MCVE
FX
FX
5537.4
288.8
740.3
3907.7
558.2
38.51
21.06
22.48
9.98
9.96
14.85
10.36
10.40
7.98
7.68
28.24
12.29
12.57
10.80
9.98
–2.75
10.68
10.93
1.48
0.72
12.85
13.37
13.64
4.77
3.97
11.50
8.31
8.60
3.78
2.99
36.81
20.84
22.25
9.88
9.87
–1.95
–0.30
–0.32
–0.10
–0.10
ARTISAN INTERNATL;INST r
ARTISAN INTERNATL;INV
ARTISAN INTL VAL;INST nr
ARTISAN INTL VAL;INV n
ARTISAN ITL SMMID;INV n
ILCG 2664.2
ILCG 1518.8
ILCV 18668.9
ILCV 2790.0
ISMG
268.5
26.93
26.82
45.96
45.84
17.32
9.94
9.90
10.62
10.56
11.38
14.52
14.26
22.95
22.65
11.03
0.29
0.06
10.26
10.00
–4.28
7.08
6.84
12.62
12.36
9.71
3.65
3.41
7.03
6.78
4.15
26.70
26.59
45.62
45.49
16.67
–0.20
–0.20
–0.25
–0.26
–0.74
BLACKROCK MLT-A INC;I r
BLACKROCK SUSTAIN BAL;A
BLACKROCK SUSTAIN BAL;I r
BLACKROCK TCT OPP;I r
BLACKROCK TECH OPPT;A
FX
MTAG
MTAG
AGM
GTK
6290.1
875.4
503.4
1002.1
1765.4
9.99
24.62
24.75
13.29
50.96
8.04
9.74
9.79
–2.10
16.88
11.06
16.59
16.89
2.98
49.09
1.74
4.57
4.83
3.18
–2.86
5.03
9.86
10.13
3.61
19.68
4.03
7.78
8.08
3.25
17.19
9.90
24.29
24.42
13.36
48.78
–0.09
–0.36
–0.36
+0.11
–2.44
L10
BARRON’S
•
Funds Quarterly
January 8, 2024
Stock Funds
s Copyright Lipper
For personal non-commercial use only. Do not edit or alter. Reproductions not permitted.
To reprint or license content, please contact Barron's reprints department at 800-843-0008 or www.djreprints.com
NAME
OBJ
LATEST
REPORTED
NAV
ASSETS
($ SHR)
($MIL)
12/29/23
QTR
RETURN THROUGH 12/29
1YR
3 YRS
5 YRS
(Annualized)
10YRS
LATEST WK’S DATA
(as of Thursday)
CLOSE
WK’S
NAV
CHG
BLACKROCK TECH OPPT;C
BLACKROCK TECH OPPT;INST r
BLACKROCK UNCONSTRD EQ;I r
BNY MELLON ASSET ALL;M r
BNY MELLON INTL;M r
GTK
GTK
GLCG
MTAG
IMLC
270.6
2476.8
283.2
422.2
253.2
40.46
56.18
12.99
12.51
13.75
16.67
16.97
14.45
9.07
8.02
47.99
49.49
33.37
14.60
16.95
–3.59
–2.62
8.66
3.87
2.54
18.79
19.98
15.71
9.11
7.15
16.30
17.51
9.21
6.41
3.37
38.72
53.77
12.58
12.30
13.64
–1.95
–2.70
–0.43
–0.36
–0.09
BNY MELLON MC MLT-ST;M r
BNY MELLON SC MLT-ST;M r
BNYM ACTIVE MIDCAP;A
BNYM APPRECIATION;INV
BNYM DYNAMIC VALUE;A
BNYM DYNAMIC VALUE;I r
BNYM GLOBAL REAL RTN;Y r
BNYM GLOBAL STOCK;I r
BNYM INSTL S&P 500;I r
BNYM INTERNATL STOCK;I r
MCGE
SCCE
MCGE
LCCE
MLVE
MLVE
ABR
GLCG
SPSP
ILCG
1273.2
532.5
415.2
1690.6
1077.4
2715.2
388.5
554.7
1826.8
3504.2
16.07
20.07
56.34
40.76
41.08
41.35
14.94
20.89
52.22
23.77
12.32
9.15
12.44
10.02
7.65
7.72
5.57
11.42
11.64
14.04
17.92
9.32
16.96
21.40
12.58
12.87
2.75
21.22
26.03
18.44
4.66
–0.21
8.32
8.16
15.55
15.84
0.27
4.86
9.78
0.88
12.99
10.38
10.17
16.22
15.18
15.47
4.37
12.29
15.47
9.37
9.05
7.22
7.48
11.03
10.25
10.53
3.45
9.09
11.81
6.20
15.60
19.33
55.08
40.09
40.92
41.19
14.77
20.35
51.34
23.20
–0.55
–1.02
–1.63
–0.73
–0.24
–0.23
–0.17
–0.56
–1.02
–0.56
BNYM INTERNATL STOCK;Y r
BNYM LARGE CP SECURITIES
BNYM MIDCAP INDEX;INV
BNYM OPPTNSTC MC VAL;A
BNYM RESEARCH GROWTH;A
BNYM RESEARCH GROWTH;Z n
BNYM S&P 500 INDEX
BNYM SMALL CAP IDX;INV
BNYM SMALL/MID CAP GRO;I r
BNYM SUST US EQUITY;Z n
BNYM TECHNOLOGY GROWTH;A
BNYM WORLDWIDE GROWTH;A
BOSTON TRUST ASSET MGMT r
BOSTON TRUST WALDEN EQTY r
BRANDES INV ITL EQ;I r
ILCG
LCCE
SPMC
MCCE
LCGE
LCGE
SPSP
SCCE
MCGE
LCCE
TK
GLCG
MTAG
LCCE
IMLV
2360.8
2003.6
1320.8
286.6
637.7
584.6
2176.4
975.5
1432.4
342.7
311.9
626.4
569.5
262.9
637.8
23.47
16.30
28.17
30.05
16.36
17.08
51.05
25.91
26.30
16.27
51.13
67.95
58.81
34.09
20.19
14.07
10.91
11.56
8.94
13.98
14.06
11.57
15.00
13.36
12.27
20.36
11.05
7.22
9.21
10.86
18.52
31.06
15.89
12.35
41.81
42.13
25.68
15.51
15.55
24.00
59.98
22.40
13.72
16.29
30.37
0.91
11.05
7.56
6.16
3.62
3.82
9.46
6.76
–9.55
6.57
–1.18
7.59
5.69
8.77
10.45
9.40
17.10
12.06
12.63
15.97
16.19
15.11
10.54
11.65
15.04
15.51
15.88
9.88
14.04
8.65
6.16
12.09
8.76
7.03
11.80
12.02
11.48
8.16
9.30
10.34
13.06
10.27
8.17
10.76
4.79
22.90
16.01
27.39
29.43
15.76
16.45
50.19
25.06
25.08
15.97
48.33
66.64
58.09
33.51
20.02
–0.55
–0.31
–1.04
–0.70
–0.70
–0.73
–1.01
–1.20
–1.47
–0.31
–3.08
–1.36
–0.78
–0.62
–0.24
BRIDGE BLDR INTL EQTY FD r
BRIDGE BLDR LG CAP GRO r
BRIDGE BLDR LG CAP VALUE r
BRIDGE BLDR SM MD CP GRO r
BRIDGE BLDR SM MD CP VAL r
BRIDGEWAY SM CP VAL
BRIGHT ROCK QLT LC;INST r
BROOKFIELD CC BF MSF;A n
BROWN ADV EM SEL;INST r
BROWN ADV FLEX EQ;INST r
ILCC 16227.1
LCGE 21339.8
MLVE 16504.7
MCGE 6099.3
MCCE 6037.9
SCVE
574.7
LCCE
366.2
EMP
268.4
EM
574.6
LCCE
298.0
12.27
22.42
16.23
14.17
13.70
38.54
20.90
4.72
10.79
34.81
9.79
13.65
10.11
11.40
13.21
13.30
8.97
3.66
5.28
13.21
17.27
32.20
13.81
20.97
15.04
14.08
20.96
17.78
10.69
34.68
2.02
6.04
10.82
–0.41
9.98
20.86
11.51
24.14
–1.51
10.03
8.23
16.47
13.89
11.37
12.29
17.86
14.58
5.83
5.78
16.90
I
I
I
I
I
9.38
10.09
0.30
2.56
12.10
12.06
21.94
16.10
13.66
13.36
37.37
20.74
4.74
10.56
34.13
–0.21
–0.54
–0.26
–0.63
–0.45
–1.75
–0.19
+0.04
–0.21
–0.80
BROWN ADV GRO EQ;INST r
BROWN ADV GRO EQ;INV
BROWN ADV SC FV;INST r
BROWN ADV SC GRO;INV
BROWN CAP SM CO;INV
LCGE
LCGE
SCCE
SCGE
MCGE
1699.1
656.6
669.0
911.7
716.0
27.17
26.48
29.44
22.62
69.83
14.62
14.57
12.58
9.38
8.74
33.99
33.77
16.17
12.43
19.12
1.94
1.79
11.70
–1.28
–10.88
14.58
14.42
10.32
11.10
5.85
11.62
11.45
6.91
8.40
7.43
26.16
25.50
28.55
21.82
65.98
–1.12
–1.09
–1.21
–1.02
–4.70
BRUCE FUND
BUFFALO DISCOVERY;INV
BUFFALO FLEX INC;INV
BUFFALO INTRNTL;INV
BUFFALO SMALL CAP;INV
FX
MCGE
MTAM
IMLG
SCGE
455.4
657.5
282.8
326.1
482.9
502.08
23.99
19.00
21.16
14.12
7.51
14.89
5.26
11.16
7.79
–0.74
24.30
7.43
18.33
5.45
2.07
–0.26
13.25
3.04
–8.19
7.83
11.81
11.02
10.77
12.66
6.72
9.72
7.08
7.06
7.50
502.11
23.11
19.10
20.61
13.52
–0.85
–1.00
+0.10
–0.53
–0.78
CALAMOS CONVERTIBLE;A
CALAMOS CONVERTIBLE;I r
CALAMOS EVOLV WLD GR;I r
CALAMOS GRO&INC;A
CALAMOS GRO&INC;I r
CV
CV
EM
FX
FX
254.5
585.4
331.7
1262.0
1065.0
19.94
17.01
16.75
42.27
40.10
6.16
6.24
7.47
9.41
9.50
10.59
10.92
6.59
20.32
20.64
–2.86
–2.61
–9.07
5.91
6.18
10.15
10.43
6.97
12.87
13.15
6.98
7.25
2.69
9.13
9.40
19.52
16.65
16.52
41.59
39.45
–0.50
–0.42
–0.18
–0.79
–0.75
CALAMOS GROWTH;A
CALAMOS GROWTH;I r
CALAMOS MKT NEUT INC;A
CALAMOS MKT NEUT INC;C
CALAMOS MKT NEUT INC;I r
CALVERT SOC INV BAL;A
CALVERT SOC INV EQTY;A
CALVERT US LCC RES IX;A
CANTOR GRO EQTY;A
CARILLON CH INCOME
LCGE 1012.8
LCGE
288.9
EMN
995.9
EMN
253.7
EMN 12748.7
MTAG
781.2
LCGE 2197.1
MLCE
725.9
MLCE
298.3
MTAC
309.0
35.71
55.31
14.37
14.46
14.18
39.28
76.63
40.60
10.17
12.80
13.13
13.19
2.18
2.04
2.27
9.55
12.80
12.77
11.16
6.29
37.57
37.90
8.92
8.14
9.17
16.34
17.93
26.93
28.68
7.77
4.18
4.43
2.89
2.13
3.15
4.04
7.81
7.52
10.41
1.30
14.53
14.81
4.04
3.27
4.30
9.97
16.28
15.67
16.46
3.56
9.89
10.16
3.40
2.63
3.65
7.20
12.71
11.70
12.62
2.92
34.72
53.79
14.36
14.45
14.17
38.70
75.05
39.75
9.96
12.69
–1.12
–1.73
+0.00
+0.00
–0.01
–0.65
–1.72
–0.99
–0.23
–0.13
CARILLON EGL MC GRO;A
CARILLON SCT MID CAP;I r
CAUSEWAY INTL VAL;INST r
CAUSEWAY INTL VAL;INV
CB AGGRESSIVE GROWTH;A
CB AGGRESSIVE GROWTH;I r
CB ALL CAP VALUE;A
CB APPRECIATION;A
CB APPRECIATION;I r
CB APPRECIATION;IS r
CB DIV STRAT;1 n
CB DIV STRAT;A
CB DIV STRAT;I r
CB INTL GRO;I r
CB LARGE CAP GR;A
MCGE
MCCE
ILCV
ILCV
MLCE
MLCE
MLVE
LCCE
LCCE
LCCE
EIEI
EIEI
EIEI
ILCG
LCGE
619.4
2932.6
6936.9
474.3
4008.0
338.2
1456.4
6209.4
903.8
539.9
1595.2
4698.7
1038.8
3310.5
3025.6
70.53
21.80
19.56
19.42
104.48
134.75
13.25
30.81
30.52
30.65
27.87
27.86
28.95
60.93
51.37
13.21
10.06
9.93
9.87
15.41
15.51
8.87
9.43
9.49
9.55
9.85
9.82
9.90
10.97
15.41
19.63
12.73
27.33
27.02
23.65
24.03
13.87
19.45
19.77
19.88
14.37
14.05
14.38
14.28
44.75
–0.40
2.63
9.00
8.73
–0.22
0.09
9.80
8.86
9.17
9.25
10.04
9.74
10.04
–2.15
5.63
13.18
10.69
10.39
10.12
8.06
8.40
9.90
13.90
14.23
14.32
13.55
13.24
13.56
9.00
15.22
10.45
8.79
4.49
4.24
6.02
6.35
6.74
10.63
10.95
11.06
10.34
10.04
10.37
6.97
12.82
68.22
21.32
19.37
19.23
101.34
130.69
13.10
30.58
30.29
30.42
27.82
27.80
28.89
59.51
49.98
–2.74
–0.59
–0.18
–0.18
–3.75
–4.84
–0.21
–0.26
–0.26
–0.26
–0.09
–0.09
–0.09
–1.38
–1.59
CB LARGE CAP GR;I r
CB LARGE CAP VAL;A
CB LARGE CAP VAL;I r
CB MID CAP;A
CB MID CAP;I r
LCGE
LCVE
LCVE
MCCE
MCCE
3696.9
1027.1
1091.0
1182.6
400.8
61.08
40.70
40.60
33.40
39.20
15.52
10.42
10.50
9.76
9.88
45.19
14.78
15.05
13.46
13.80
5.94
10.46
10.69
2.93
3.24
15.56
12.80
13.08
10.95
11.29
13.16
8.75
9.04
7.03
7.38
59.43
40.53
40.42
32.34
37.95
–1.88
–0.22
–0.22
–1.31
–1.54
NAME
Data provided by
OBJ
LATEST
REPORTED
NAV
ASSETS
($ SHR)
($MIL)
12/29/23
QTR
RETURN THROUGH 12/29
1YR
3 YRS
5 YRS
(Annualized)
10YRS
LATEST WK’S DATA
(as of Thursday)
CLOSE
WK’S
NAV
CHG
CB MID CAP;IS r
CB SMALL CAP GROWTH;A
CB SMALL CAP GROWTH;I r
CB SMALL CAP GROWTH;IS r
CB SMALL CAP;I r
CB VALUE TRUST;I r
CHAMPLAIN SM CO;ADV n
CIBC ATLAS DISC EQ;INST r
CIBC ATLAS EQTY INC;INST r
CLIPPER FUND
MCCE
SCGE
SCGE
SCGE
SCCE
MLVE
SCGE
LCCE
EIEI
LCVE
341.4
911.7
1135.2
2027.1
382.0
404.5
362.9
1574.3
310.0
1067.5
39.72
35.45
39.65
40.56
66.75
116.06
20.81
27.76
53.09
129.25
9.87
10.62
10.70
10.74
9.73
10.90
11.36
12.48
12.77
13.47
13.90
8.63
8.98
9.11
17.15
19.67
14.00
20.70
16.38
31.48
3.33
–4.71
–4.45
–4.32
3.57
12.96
0.49
7.11
8.34
7.96
11.40
9.22
9.53
9.67
8.52
15.41
9.50
13.87
14.12
12.39
7.48
7.72
8.04
8.18
7.35
9.80
8.30
11.62
9.70
9.32
38.46
33.77
37.77
38.63
64.86
115.03
19.96
27.29
52.43
127.98
–1.56
–2.10
–2.34
–2.40
–2.62
–1.66
–1.13
–0.54
–0.82
–1.70
COHEN&STEERS GL INFR;I r
COHEN&STEERS GL RLTY;I r
COHEN&STEERS INST RS r
COHEN&STEERS ITL RLTY;I r
COHEN&STEERS RE SEC;A n
COHEN&STEERS RE SEC;I nr
COHEN&STEERS RLTY SHS;L
COLUMBIA ACORN INTL;I r
COLUMBIA ACORN;A
COLUMBIA ACORN;I r
COLUMBIA THERMOSTAT;A
COLUMBIA THERMOSTAT;I r
COLUMBIA BALANCED;A
COLUMBIA BALANCED;ADV r
COLUMBIA BALANCED;C
GIF
GRE
RE
IRE
RE
RE
RE
ISMG
MCGE
MCGE
FX
FX
MTAG
MTAG
MTAG
743.4
1506.7
5973.6
421.8
767.7
4403.2
3392.2
838.5
570.7
2112.9
428.1
636.5
3495.3
379.9
1047.7
21.69
52.01
46.43
9.07
15.48
16.62
63.46
25.66
7.49
10.93
15.61
15.30
48.30
48.77
48.07
11.83
14.55
17.01
13.76
16.72
16.85
17.10
15.12
10.47
10.52
8.47
8.54
10.49
10.57
10.27
2.44
10.73
12.72
4.56
12.78
13.15
12.67
19.57
21.59
21.85
11.38
11.66
21.20
21.52
20.29
4.38
1.69
6.53
–5.00
5.51
5.79
6.43
–3.60
–4.43
–4.19
0.90
1.14
4.93
5.19
4.14
6.96
5.08
9.39
1.03
8.59
8.88
9.25
6.00
7.32
7.60
8.82
9.08
10.76
11.04
9.93
5.99
5.36
8.89
2.40
9.03
9.32
8.71
3.22
6.23
6.50
5.85
6.11
7.81
8.08
7.01
21.73
50.92
45.80
8.78
15.28
16.40
62.60
24.60
7.14
10.42
15.44
15.14
47.58
48.04
47.35
+0.01
–1.52
–1.15
–0.30
–0.38
–0.41
–1.58
–1.06
–0.43
–0.63
–0.19
–0.18
–0.81
–0.83
–0.82
COLUMBIA BALANCED;I r
COLUMBIA BALANCED;I2 r
COLUMBIA BALANCED;I3 r
COLUMBIA CA MOD AGG;A
COLUMBIA CA MOD CON;A
MTAG
MTAG
MTAG
MTAG
MTAC
2305.8
401.2
718.5
1479.1
316.2
48.16
48.20
48.78
11.02
9.47
10.56
10.56
10.56
9.57
8.08
21.49
21.54
21.59
17.47
12.00
5.19
5.22
5.28
2.73
0.40
11.04
11.08
11.13
8.25
4.84
8.08
8.15
8.20
6.21
3.96
47.45
47.48
48.06
10.85
9.36
–0.81
–0.82
–0.82
–0.18
–0.12
COLUMBIA CAP ALL AGG;A
COLUMBIA CAP ALL MDT;A
COLUMBIA CNTR CORE;A
COLUMBIA CNTR CORE;ADV r
COLUMBIA CNTR CORE;C
COLUMBIA CNTR CORE;I r
COLUMBIA CNTR CORE;I2 r
COLUMBIA CNTR CORE;I3 r
COLUMBIA CONV SECS;A
COLUMBIA CONV SECS;I r
COLUMBIA DISC CORE;A
COLUMBIA DISC CORE;I r
COLUMBIA DIV INCOME;A
COLUMBIA DIV INCOME;ADV r
COLUMBIA DIV INCOME;C
MTAG
MTAM
LCCE
LCCE
LCCE
LCCE
LCCE
LCCE
CV
CV
LCCE
LCCE
EIEI
EIEI
EIEI
1065.7
986.7
2151.6
606.5
294.1
5375.7
941.5
3060.8
292.4
587.5
3838.4
304.7
4257.9
3449.1
1282.9
11.84
9.94
31.06
32.29
26.07
31.43
32.26
32.28
20.26
20.30
13.05
13.17
30.38
31.01
29.30
9.98
9.04
12.72
12.78
12.53
12.81
12.83
12.83
6.74
6.79
9.93
10.00
8.59
8.62
8.37
19.86
14.80
31.75
32.06
30.82
32.11
32.18
32.21
11.91
12.22
24.10
24.35
10.21
10.49
9.39
4.09
1.36
9.89
10.16
9.08
10.17
10.24
10.30
–2.24
–2.00
9.99
10.28
9.59
9.86
8.77
9.79
6.63
16.50
16.79
15.64
16.80
16.89
16.94
11.75
12.04
13.52
13.82
12.59
12.87
11.75
7.15
5.18
11.49
11.77
10.66
11.77
11.88
11.94
8.62
8.89
10.86
11.14
10.25
10.52
9.43
11.65
9.80
30.50
31.71
25.59
30.86
31.67
31.70
19.86
19.90
12.86
12.98
30.22
30.85
29.14
–0.21
–0.15
–0.65
–0.68
–0.55
–0.66
–0.68
–0.68
–0.49
–0.49
–0.22
–0.22
–0.19
–0.20
–0.19
COLUMBIA DIV INCOME;I r
COLUMBIA DIV INCOME;I2 r
COLUMBIA DIV INCOME;I3 r
COLUMBIA DIV OPPTY;A
COLUMBIA DIV OPPTY;I r
COLUMBIA EMG MKT;I r
COLUMBIA FLX CAP INC;A
COLUMBIA FLX CAP INC;I r
COLUMBIA GL TECH GR;A
COLUMBIA GL TECH GR;I r
EIEI
EIEI
EIEI
EIEI
EIEI
EM
FX
FX
TK
TK
17621.2
3055.1
7640.2
1177.5
554.5
463.8
352.9
631.9
682.5
1037.3
30.41
30.98
31.03
35.13
35.38
12.50
13.11
13.10
66.49
70.17
8.65
8.68
8.68
8.05
8.15
8.04
7.13
7.20
16.62
16.70
10.52
10.56
10.60
4.84
5.10
8.89
8.41
8.68
56.44
56.83
9.88
9.93
9.99
9.13
9.40
–12.23
4.17
4.43
7.86
8.14
12.87
12.95
13.00
10.08
10.35
3.47
8.96
9.24
21.64
21.95
10.53
10.63
10.68
7.80
8.07
2.44
6.42
6.69
18.47
18.77
30.25
30.82
30.87
35.27
35.52
12.24
13.02
13.01
63.65
67.18
–0.19
–0.19
–0.19
+0.03
+0.03
–0.23
–0.13
–0.13
–3.14
–3.31
COLUMBIA GLBL OPPTYS;A
COLUMBIA GLBL VALUE;A
COLUMBIA INC BLDR;A
COLUMBIA INTL DIVINC;I r
COLUMBIA LC GR OPP;A
COLUMBIA LC GR OPP;I r
COLUMBIA LCV;A
COLUMBIA LGCP GRO;A
COLUMBIA LGCP GRO;I r
COLUMBIA LGCP INDEX;A
AGM
GMLV
MTAC
IEI
LCGE
LCGE
LCVE
LCGE
LCGE
SPSP
326.9
630.0
670.4
348.0
864.0
298.5
1558.0
2744.5
1246.8
465.3
12.62
12.06
11.45
19.49
14.15
17.07
15.34
57.00
61.03
51.02
8.42
9.39
9.02
11.04
16.17
16.20
8.55
14.73
14.77
11.55
11.29
11.98
9.02
18.43
31.26
31.61
9.55
43.52
43.87
25.70
–2.22
7.30
0.26
4.67
3.20
3.45
8.68
7.81
8.07
9.54
4.00
9.78
4.78
8.61
15.98
16.27
11.91
17.94
18.23
15.19
3.43
6.55
4.12
4.60
11.51
11.79
8.56
13.31
13.59
11.54
12.43
11.97
11.31
19.15
13.72
16.55
15.28
55.39
59.32
50.16
–0.20
–0.09
–0.17
–0.31
–0.50
–0.61
–0.10
–1.77
–1.88
–1.01
COLUMBIA LGCP INDEX;I r
COLUMBIA MDCP INDEX;A
COLUMBIA MDCP INDEX;I r
COLUMBIA MDCP INDEX;I2 r
COLUMBIA MLT STR ALT;I r
COLUMBIA OVER VAL;A
COLUMBIA SEL GL EQ;A
COLUMBIA SEL GL TCH;A
COLUMBIA SEL GL TCH;I r
COLUMBIA SEL LGCP EQ;I r
SPSP
SPMC
SPMC
SPMC
AMS
IMLV
GLCG
GTK
GTK
LCCE
2231.7
609.5
1059.8
569.6
575.2
298.7
467.1
1242.6
407.0
300.0
51.54
14.28
14.17
14.69
28.13
10.56
16.82
65.45
67.90
18.67
11.65
11.57
11.64
11.69
1.32
7.71
13.39
14.73
14.80
11.81
26.03
15.97
16.31
16.28
3.67
15.85
24.47
45.15
45.49
28.29
9.82
7.61
7.88
7.89
0.21
6.30
3.31
11.25
11.53
10.30
15.47
12.11
12.40
12.39
–0.55
7.87
13.49
25.49
25.80
15.62
11.82
8.77
9.04
9.04
I
4.38
9.55
19.80
20.10
12.01
50.67
13.89
13.77
14.28
28.01
10.51
16.41
62.59
64.95
18.38
–1.01
–0.52
–0.53
–0.54
–0.13
–0.03
–0.43
–3.33
–3.45
–0.32
COLUMBIA SEL MC VAL;A
COLUMBIA SEL MC VAL;I r
COLUMBIA SEL MC VAL;I3 r
COLUMBIA SEL MCG;A
COLUMBIA SEL MCG;I r
MCCE
MCCE
MCCE
MCGE
MCGE
993.6
842.7
350.6
738.3
641.3
12.96
13.01
12.94
21.64
24.85
12.68
12.79
12.81
12.18
12.29
10.25
10.49
10.62
24.94
25.25
9.62
9.89
10.04
–0.15
0.10
12.99
13.27
13.45
12.60
12.89
8.14
8.41
8.58
9.16
9.43
12.73
12.78
12.72
20.81
23.90
–0.30
–0.30
–0.29
–1.00
–1.15
COLUMBIA SEL T&INFO;A
COLUMBIA SEL T&INFO;C
COLUMBIA SEL T&INFO;I r
COLUMBIA SEL T&INFO;I2 r
COLUMBIA SELECT LCG;I r
TK
TK
TK
TK
LCGE
6966.1
352.4
2754.4
620.9
684.6
111.80
49.51
130.55
131.62
8.88
14.52
14.30
14.60
14.60
16.20
44.22
43.17
44.59
44.64
39.35
11.27
10.44
11.55
11.59
1.13
25.07
24.13
25.38
25.43
16.09
19.64
18.74
19.93
20.01
11.23
107.08
47.42
125.04
126.07
8.54
–5.55
–2.46
–6.48
–6.53
–0.38
COLUMBIA SELECT LCV;A
MLVE
336.8
30.30
9.15
5.52
9.67
12.12
8.89
30.22
–0.15
January 8, 2024
BARRON’S
•
L11
Funds Quarterly
Stock Funds
s Copyright Lipper
For personal non-commercial use only. Do not edit or alter. Reproductions not permitted.
To reprint or license content, please contact Barron's reprints department at 800-843-0008 or www.djreprints.com
NAME
OBJ
LATEST
REPORTED
NAV
ASSETS
($ SHR)
($MIL)
12/29/23
QTR
RETURN THROUGH 12/29
1YR
3 YRS
5 YRS
(Annualized)
10YRS
LATEST WK’S DATA
(as of Thursday)
CLOSE
WK’S
NAV
CHG
COLUMBIA SELECT LCV;ADV r
COLUMBIA SELECT LCV;I r
COLUMBIA SELECT SCV;A
COLUMBIA SMCP INDEX;A
MLVE
MLVE
SCCE
SCCE
359.2
1296.5
320.1
860.5
32.37
31.82
18.58
24.17
9.22
9.21
10.71
15.00
5.75
5.75
12.40
15.55
9.93
9.92
7.66
6.74
12.39
12.40
10.18
10.53
9.16
9.16
6.07
8.15
32.30
31.75
17.99
23.37
–0.15
–0.15
–0.78
–1.12
COLUMBIA SMCP INDEX;I r
COLUMBIA SMCP INDEX;I2 r
COLUMBIA SMCP VAL I;A
COLUMBIA SMCP VAL I;I r
COLUMBIA SMCP VAL II;I3 r
SCCE
SCCE
SCCE
SCCE
SCCE
1126.8
1004.3
273.5
595.0
587.9
24.42
25.23
42.79
49.99
17.50
15.06
15.08
14.87
14.95
12.89
15.81
15.81
21.36
21.66
14.26
7.00
7.00
12.52
12.80
9.91
10.80
10.81
13.19
13.47
12.10
8.42
8.42
8.21
8.48
7.48
23.61
24.39
41.57
48.56
16.96
–1.14
–1.18
–1.75
–2.05
–0.74
COLUMBIA SMCP VAL II;INS r
COLUMBIA SMCPGRO;A
COLUMBIA SMCPGRO;I r
COMMERCE VALUE
CONGRESS SMCP GRO;INST r
SCCE
SCGE
SCGE
LCVE
SCGE
299.1
362.8
859.0
259.7
794.7
16.78
20.81
22.95
31.16
38.81
12.86
9.99
10.02
8.96
6.24
14.10
25.89
26.17
2.48
20.27
9.72
–8.24
–8.02
7.44
7.35
11.90
13.02
13.30
9.18
16.57
7.27
9.81
10.08
8.27
10.77
16.26
19.71
21.74
31.06
37.37
–0.71
–1.39
–1.53
–0.18
–1.88
CRDT SUIS CMDTY RTN;INST r
CULLEN EMMKTS HI DIV;I r
CULLEN HIGH DIV EQTY;I r
CULLEN INTL HIGH DIV;I r
DAVENPORT CORE LEADERS
CMG
IEI
LCVE
IEI
LCCE
1059.0
586.2
664.3
261.2
890.3
22.18
11.87
13.56
10.86
31.58
–3.67
10.81
7.92
10.70
13.94
–8.90
26.39
2.99
17.78
28.95
10.76
5.49
7.99
5.51
8.23
7.53
8.85
7.68
7.98
13.90
–0.98
4.50
7.22
2.84
10.05
22.09
11.70
13.54
10.66
30.97
–0.27
–0.18
–0.03
–0.17
–0.67
DAVENPORT EQUITY OPPS
DAVENPORT SMCP FOCUS
DAVENPORT VALUE & INCOME
DAVIS FINANCIAL;A
DAVIS NY VENTURE;A
MLCE
SCCE
EIEI
FS
LCVE
798.9
775.7
818.3
391.5
4452.9
22.48
17.51
17.89
51.30
26.55
14.89
10.84
7.65
16.33
13.15
27.69
22.28
8.50
15.52
30.00
7.46
7.51
5.25
11.43
6.48
15.97
17.10
8.25
10.46
11.98
10.49
I
6.99
8.63
8.70
21.71
17.29
17.76
51.21
26.23
–0.89
–0.36
–0.16
–0.23
–0.43
DAVIS NY VENTURE;Y r
DAVIS OPPORTUNITY;A
DELAWARE G&I;A
DELAWARE IVY ASSET ST;A
DELAWARE IVY ASSET ST;I r
LCVE
MLVE
EIEI
AGM
AGM
1623.7
293.3
1211.4
1272.0
350.3
27.64
38.11
14.15
20.17
20.63
13.27
12.57
9.54
9.76
9.81
30.35
22.12
11.97
15.61
15.84
6.74
9.45
11.93
4.42
4.67
12.26
13.16
11.89
9.47
9.75
8.98
9.87
7.70
3.76
4.03
27.31
37.76
14.09
19.87
20.33
–0.44
–0.48
–0.10
–0.33
–0.34
DELAWARE IVY BALANCED;A
DELAWARE IVY CORE EQ;A
DELAWARE IVY GLBL GR;A
DELAWARE IVY INTL CE;A
DELAWARE IVY INTL CE;I r
MTAG
LCCE
GLCC
ILCC
ILCC
1096.4
2612.6
320.6
278.4
691.5
20.77
15.18
31.20
19.82
19.99
10.50
12.48
10.14
7.41
7.47
16.19
23.53
19.05
16.72
17.02
4.26
9.58
4.92
4.04
4.40
9.61
16.00
11.83
7.39
7.81
6.38
10.46
7.41
3.84
4.22
20.42
14.87
30.65
19.50
19.67
–0.40
–0.35
–0.62
–0.34
–0.34
DELAWARE IVY LCAP GRO;A
DELAWARE IVY LCAP GRO;I r
DELAWARE IVY MC GRWTH;A
DELAWARE IVY MC GRWTH;I r
DELAWARE IVY SC GRWTH;A
LCGE
LCGE
MCGE
MCGE
SCGE
2367.9
3541.1
1505.3
2943.8
603.1
29.80
32.74
26.31
30.37
11.58
13.12
13.19
14.14
14.25
7.10
37.81
38.17
19.97
20.31
13.27
9.41
9.71
–1.04
–0.73
–5.20
18.50
18.85
14.69
15.09
7.86
13.98
14.30
10.46
10.82
7.08
28.97
31.83
25.03
28.88
11.07
–0.89
–0.97
–1.52
–1.76
–0.65
DELAWARE IVY SC GRWTH;I r
DELAWARE IVY SCI&TECH;A
DELAWARE IVY SCI&TECH;I r
DELAWARE IVY SCI&TECH;Y r
DELAWARE IVY SYST EME;I r
SCGE
TK
TK
TK
EM
496.9
3362.5
1288.7
250.3
446.6
19.69
45.87
60.25
53.26
18.45
7.17
18.80
18.85
18.80
7.26
13.59
40.65
40.99
40.63
11.06
–4.90
3.16
3.37
3.14
–8.12
8.25
17.54
17.78
17.53
5.42
7.46
11.25
11.51
11.26
3.88
18.82
43.80
57.54
50.86
18.12
–1.11
–2.37
–3.11
–2.75
–0.34
DELAWARE IVY VALUE;A
DELAWARE OPPTY;A
DELAWARE SMCP VAL;A
DELAWARE SMD CP G;A
DELAWARE VALUE;INST r
MLVE
MCCE
SCCE
MCGE
MLVE
252.8
538.5
769.0
698.5
2578.5
16.52
31.79
65.09
15.88
16.77
9.69
12.51
11.58
14.24
9.05
5.18
10.78
9.23
20.21
2.10
9.48
9.51
8.60
–15.64
6.43
10.94
11.22
10.04
9.52
7.74
7.45
6.72
6.74
8.42
7.61
16.56
31.21
63.34
15.10
16.81
+0.03
–0.73
–2.42
–0.93
+0.03
DELAWARE WLTH BLDR;A
DFA CONT SMALL CO;INST r
DFA EMG MKTS CORE EQ;I r
DFA EMG MKTS SM CAP;I r
DFA EMG MKTS SOC CORE;I r
FX
EU
EM
EM
EM
748.0
766.0
25935.2
4117.1
1515.4
14.18
30.16
22.41
22.82
13.98
9.31
13.13
7.86
7.26
8.00
12.18
16.92
15.45
16.31
14.58
6.45
3.27
0.71
4.13
–0.90
7.76
9.79
6.18
8.10
5.19
5.38
6.54
4.00
5.55
3.58
14.02
29.49
22.06
22.57
13.73
–0.19
–0.66
–0.30
–0.15
–0.22
DFA EMG MKTS VALUE;I r
DFA EMG MKTS;I r
DFA GL RE SEC PORTF r
DFA GLBL ALL 25/75;INST r
DFA GLBL ALL 60/40;INST r
EM 10953.5
EM
4799.9
GRE 7608.5
MTAC
726.9
MTAM 3741.3
29.43
27.53
10.27
13.69
20.14
7.17
7.77
17.14
4.50
7.92
16.49
13.08
9.42
8.90
14.53
5.34
–1.22
2.96
1.88
4.56
5.66
4.95
5.17
4.49
8.55
3.74
3.37
5.90
3.42
5.99
28.98
27.02
10.09
13.62
19.90
–0.40
–0.47
–0.28
–0.09
–0.28
DFA GLBL EQUITY;INST r
DFA INTL CORE EQTY;I r
DFA INTL LG CP GR;INST r
DFA INTL REAL ESTATE;I r
DFA INTL SM CAP VAL;I r
MTAA 8509.3
IMLV 30936.3
IMLG
650.3
IRE
3626.5
ISMV 11084.2
30.47
15.32
15.98
3.73
21.23
11.13
10.32
13.13
15.28
9.34
20.29
17.49
18.49
5.96
17.58
8.13
5.00
2.87
–2.18
7.13
12.69
8.69
9.56
1.02
8.44
8.49
4.72
5.15
2.24
4.62
29.89
15.08
15.64
3.62
20.95
–0.66
–0.22
–0.31
–0.12
–0.26
DFA INTL SM CO;I r
DFA INTL SM CP GR;INST r
DFA INTL SOC CE PTF;INST r
DFA INTL SUSTAIN CORE 1 r
DFA INTL VALUE III;I r
ISMC 11487.5
ISMG
272.4
IMLV 1435.8
IMLC 3326.9
IMLV 2943.7
19.31
14.98
14.18
12.24
17.23
10.75
11.76
11.62
12.35
6.54
14.43
11.53
18.45
18.35
17.85
2.71
–1.60
3.86
2.98
10.59
8.02
6.88
7.85
8.66
8.96
4.94
5.08
4.20
4.61
4.29
18.93
14.57
13.90
12.01
17.12
–0.37
–0.40
–0.26
–0.21
–0.07
DFA INTL VALUE;I r
DFA INTL VECTOR EQ;I r
DFA LARGE CAP INTL;I r
DFA REAL ESTATE;I r
DFA SEL HDGD GLB EQ;INST r
IMLV
IMLV
IMLC
RE
GMLC
9051.6
3404.5
5770.7
7351.9
277.0
20.01
13.36
26.35
39.23
19.28
6.49
9.64
10.29
17.88
9.63
17.79
17.01
17.87
11.18
20.10
10.51
5.61
4.96
5.78
8.36
8.84
8.59
8.82
7.56
12.24
4.15
4.68
4.54
8.04
8.18
19.88
13.16
25.98
38.72
18.98
–0.09
–0.18
–0.33
–0.98
–0.33
DFA US CORE EQ 1;I r
DFA US CORE EQ 2;I r
DFA US LARGE CO;I r
DFA US LG CAP VAL III;I r
DFA US LG CAP VAL;I r
MLCE
MLCE
SPSP
MLVE
MLVE
31700.4
31643.8
10991.0
3603.2
23403.7
36.06
32.47
31.62
28.60
44.54
11.46
11.62
11.67
9.09
9.07
22.96
21.86
26.25
11.57
11.47
10.05
10.33
9.92
10.48
10.39
15.10
14.99
15.63
11.01
10.90
10.92
10.32
11.97
8.46
8.33
35.36
31.81
31.09
28.47
44.33
–0.85
–0.80
–0.62
–0.21
–0.33
NAME
Data provided by
OBJ
LATEST
REPORTED
NAV
ASSETS
($ SHR)
($MIL)
12/29/23
QTR
RETURN THROUGH 12/29
1YR
3 YRS
5 YRS
(Annualized)
10YRS
LATEST WK’S DATA
(as of Thursday)
CLOSE
WK’S
NAV
CHG
DFA US LG CP GR;INST r
DFA US MICRO CAP;I r
DFA US SM CP GR;INST r
DFA US SMALL CAP VAL;I r
DFA US SMALL CAP;I r
LCGE 3098.7
SCCE 7029.0
SCGE 1022.2
SCVE 15303.3
SCCE 15282.6
31.29
26.28
25.43
44.94
44.36
12.30
14.44
11.32
14.81
13.67
24.94
17.86
21.24
18.91
17.64
10.20
11.26
7.88
17.07
9.93
16.59
12.12
13.58
14.14
12.45
12.74
8.05
8.75
7.99
8.07
30.68
25.46
24.57
43.70
42.89
–0.65
–1.16
–1.10
–1.72
–1.98
DFA US SOC CORE EQ 2;I r
DFA US SUSTAIN CORE 1;I r
DFA US TARGETED VALUE;I r
DFA US VECTOR EQTY;I r
DFA WLD EX US VAL;I r
MLCE 1705.5
MLCE 6130.6
SCVE 13038.4
MCCE 4697.3
IMLV
257.7
23.78
37.42
31.89
24.21
12.49
13.58
12.44
14.39
11.94
6.89
25.93
25.69
19.31
17.52
17.34
9.73
9.56
16.46
11.10
8.52
14.77
16.14
14.77
13.20
7.81
9.97
11.50
8.51
8.51
4.01
23.15
36.62
30.93
23.69
12.37
–0.76
–0.97
–1.32
–0.71
–0.10
DFA WLD EXUS TGT VL;INST r
DIAMOND HILL AC SEL;I r
DIAMOND HILL LG CAP;I nr
DIAMOND HILL LG CAP;INV n
DIAMOND HILL LG CAP;Y nr
ISMV
MLVE
LCVE
LCVE
LCVE
713.7
389.0
5229.4
331.9
2850.5
14.00
22.44
31.80
31.72
31.82
9.26
18.06
11.43
11.34
11.48
17.38
30.56
13.66
13.31
13.78
5.76
12.98
7.38
7.06
7.50
7.82
16.66
12.26
11.93
12.39
4.64
10.71
9.33
9.01
9.45
13.82
21.85
31.51
31.43
31.53
–0.16
–0.77
–0.37
–0.38
–0.38
DIAMOND HILL LS;I r
DIAMOND HILL S/MD CP;I nr
DODGE & COX BALANCE;I
DODGE & COX GLBL STOCK;I
DODGE & COX INTNL STCK;I
LSE
1543.3
SCCE
758.7
MTAG 12101.7
GLCV 9865.0
ILCV 38885.9
26.93
25.48
101.23
14.92
49.16
6.92
12.83
7.71
7.78
6.81
12.40
11.47
13.77
20.26
16.70
7.11
8.08
7.96
11.01
6.49
8.57
10.32
10.17
12.43
8.65
5.71
7.15
7.95
8.18
3.99
27.08
24.87
100.76
14.78
48.76
+0.13
–0.82
–0.63
–0.17
–0.33
DODGE & COX STCK;I
DOMINI IMPCT EQUITY;INV
DOMINI IMPCT INTL;INST r
DOUBLELINE SH EN CAPE;I r
DOUBLELINE SH EN CAPE;N
MLVE 61287.0
MLCE
833.0
IMLC
402.9
LCVE 3908.0
LCVE
308.4
243.55
32.45
8.42
14.27
14.26
9.82
13.11
13.98
13.01
12.95
17.48
28.42
21.80
27.01
26.72
12.81
4.99
2.54
6.67
6.40
13.94
14.76
6.05
13.56
13.28
10.45
9.40
3.76
12.57
12.30
242.45
31.68
8.29
14.03
14.01
–1.84
–0.86
–0.14
–0.39
–0.40
DRIEHAUS EM GRO;INV n
DWS CAPITAL GR;A
DWS CAPITAL GR;S
DWS CORE EQTY;A
DWS CORE EQTY;S
EM
LCGE
LCGE
MLCE
MLCE
571.1
788.0
1000.5
403.2
3443.2
34.60
103.21
105.83
30.53
31.02
8.20
14.42
14.49
12.22
12.28
11.24
38.17
38.50
25.25
25.56
–5.46
5.17
5.43
9.68
9.98
6.17
17.05
17.33
14.69
15.01
3.67
13.05
13.33
11.23
11.54
33.99
100.31
102.86
30.00
30.48
–0.59
–3.21
–3.29
–0.63
–0.63
DWS CROCI EQDV;A
DWS CROCI INTL;S
DWS EQ 500 IX;S
DWS GLBL INC B;A
DWS INTERNTL GR;S
MLVE
IMLV
SPSP
FX
ILCG
736.5
357.6
255.5
426.7
399.3
52.11
48.24
146.39
9.41
36.98
5.80
10.39
11.63
9.43
10.13
5.33
18.79
25.98
14.74
15.73
8.34
4.03
9.73
2.38
–3.94
8.30
7.09
15.37
6.80
7.40
7.64
3.52
11.75
4.67
3.75
52.57
47.66
143.92
9.30
36.00
+0.46
–0.44
–2.88
–0.13
–0.99
DWS LATIN AM EQ;S
DWS LC FOC GR;S
DWS S&P 500 IX;S
DWS SCI & TECH;A
EATON VANCE AC SMID;A
LT
LCGE
SPSP
TK
MCCE
311.5
270.9
909.4
1014.2
987.3
35.68
73.22
40.72
30.73
31.80
17.72
15.20
11.63
14.13
10.88
33.52
41.11
25.97
57.57
13.72
9.66
5.05
9.68
7.00
8.05
12.59
17.50
15.36
20.55
13.42
6.54
13.37
11.72
15.50
10.88
34.41
70.92
40.03
29.63
31.03
–1.33
–2.55
–0.80
–1.25
–0.89
EATON VANCE AC SMID;I r
EATON VANCE BAL;A
EATON VANCE DIV BLDR;A n
EATON VANCE GL M AR;I r
EATON VANCE GRO;A n
MCCE
MTAG
LCCE
AGM
LCGE
6475.1
395.7
650.8
1269.8
273.8
37.86
10.44
14.87
8.22
33.35
10.95
9.91
9.92
2.08
13.71
14.01
16.05
11.16
6.98
38.30
8.32
3.76
7.67
2.86
5.20
13.70
9.54
12.94
4.35
15.79
11.16
7.36
10.01
3.21
12.60
36.94
10.29
14.77
8.21
32.36
–1.06
–0.17
–0.13
–0.01
–1.11
EATON VANCE LC VAL;A n
EATON VANCE LC VAL;I nr
EATON VANCE TM EQ AA;A
EATON VANCE TM GL DV;A
EATON VANCE TM VAL;A
MLVE
MLVE
MLCE
GEI
LCVE
597.5
704.0
460.7
406.5
446.8
23.69
23.81
30.70
15.94
36.46
8.75
8.82
11.29
12.20
9.79
7.92
8.20
20.69
25.01
9.41
9.25
9.53
6.17
7.72
7.53
11.60
11.88
11.98
12.93
10.98
8.34
8.60
8.68
7.76
8.30
23.43
23.55
30.19
15.69
36.24
–0.33
–0.34
–0.61
–0.26
–0.33
EATON VANCE TM VAL;I r
EATON VANCE TMG1.0 n
EATON VANCE TMG1.1;A n
EATON VANCE TMG1.2;A
EATON VANCE WW H&S;A
LCVE
LCCE
LCCE
LCCE
GH
274.4
36.25
1281.4 2113.23
1921.9
94.94
854.6
42.71
697.1
13.07
9.82
11.64
11.56
11.51
6.00
9.66
28.62
28.24
28.05
5.66
7.78
8.80
8.50
8.34
5.32
11.25
15.60
15.26
15.09
10.71
8.56
36.04
11.72 2075.15
11.38
93.22
11.21
41.94
9.19
13.25
–0.32
–43.03
–1.94
–0.87
+0.20
EDGEWOOD GROWTH;INST r
ELFUN TRUSTS r
FAIRHOLME FAIRHOLME
FAM DIVIDEND FOCUS;INV
FAM VALUE;INV
LCGE 18133.3
LCCE 3638.4
FX
1412.7
EIEI
674.4
MLCE 1561.8
43.74
76.56
36.16
53.29
91.22
15.90
13.86
9.08
10.80
11.31
39.74
34.49
46.72
19.70
16.09
1.00
10.23
7.62
9.18
7.79
14.48
17.82
19.32
14.32
11.76
13.53
12.89
6.58
11.10
9.45
42.39
75.27
34.91
51.74
88.80
–1.50
–1.46
–1.64
–1.61
–2.58
FEDERATED HRMS CAP I;A
FEDERATED HRMS EQ I;A
FEDERATED HRMS ITL EQ;IS r
FEDERATED HRMS ITL EQ;R6 r
FEDERATED HRMS ITL GR;IS r
MTAC
EIEI
IMLG
IMLG
IMLG
453.6
634.4
958.6
362.5
709.5
8.15
22.15
23.75
23.75
13.55
9.00
9.92
11.50
11.49
11.20
10.51
9.05
14.57
14.62
8.82
2.02
6.66
–1.33
–1.30
–6.40
6.10
9.38
7.47
7.50
8.32
3.60
6.02
4.87
I
I
NA
NA
NA
NA
NA
NA
NA
NA
NA
NA
FEDERATED HRMS ITL LD;A
FEDERATED HRMS ITL LD;IS r
FEDERATED HRMS ITL SV;I r
FEDERATED HRMS KAU LC;A
FEDERATED HRMS KAU LC;IS r
ILCC
ILCC
IEI
MLGE
MLGE
257.5
836.2
550.6
546.4
862.3
36.93
36.94
3.71
18.39
19.92
9.55
9.63
7.35
14.34
14.39
16.99
17.35
11.04
32.37
32.68
3.69
3.96
6.49
1.71
1.96
10.27
10.56
7.35
13.20
13.48
4.12
4.40
2.68
10.63
10.91
NA
NA
NA
NA
NA
NA
NA
NA
NA
NA
FEDERATED HRMS KAUF;A
FEDERATED HRMS KAUF;INST r
FEDERATED HRMS KAUF;R r
FEDERATED HRMS KAU SC;A n
FEDERATED HRMS KAU SC;IS nr
MLGE
MLGE
MLGE
SCGE
SCGE
1099.0
358.3
3368.9
760.1
2527.3
5.25
5.51
5.26
45.97
47.60
12.02
12.07
12.00
10.81
10.94
14.91
15.53
14.87
14.48
15.03
–6.37
–5.89
–6.40
–6.98
–6.55
7.01
7.57
6.99
9.11
9.61
8.28
I
8.26
10.33
I
NA
NA
NA
NA
NA
NA
NA
NA
NA
NA
FEDERATED HRMS KAU SC;R6 nr
FEDERATED HRMS M&S A;A
FEDERATED HRMS M&S A;IS r
FEDERATED HRMS MDT AC;IS r
FEDERATED HRMS MDT L;A
SCGE
MTAC
MTAC
MLCE
MLVE
604.0
634.0
434.3
437.9
532.9
47.21
13.85
13.85
37.97
28.84
10.95
9.16
9.23
13.14
10.43
15.04
9.81
10.17
23.51
12.51
–6.53
2.66
2.94
11.69
11.28
9.63
5.84
6.13
16.61
12.00
I
4.64
4.90
12.00
I
NA
NA
NA
NA
NA
NA
NA
NA
NA
NA
L12
BARRON’S
•
Funds Quarterly
January 8, 2024
Stock Funds
s Copyright Lipper
For personal non-commercial use only. Do not edit or alter. Reproductions not permitted.
To reprint or license content, please contact Barron's reprints department at 800-843-0008 or www.djreprints.com
NAME
OBJ
LATEST
REPORTED
NAV
ASSETS
($ SHR)
($MIL)
12/29/23
QTR
RETURN THROUGH 12/29
1YR
3 YRS
5 YRS
(Annualized)
10YRS
LATEST WK’S DATA
(as of Thursday)
CLOSE
WK’S
NAV
CHG
NAME
Data provided by
OBJ
LATEST
REPORTED
NAV
ASSETS
($ SHR)
($MIL)
12/29/23
QTR
RETURN THROUGH 12/29
1YR
3 YRS
5 YRS
(Annualized)
10YRS
LATEST WK’S DATA
(as of Thursday)
CLOSE
WK’S
NAV
CHG
FEDERATED HRMS MDT L;IS r
FEDERATED HRMS MDT MG;A
FEDERATED HRMS MDT MG;IS r
FEDERATED HRMS MDT MN;IS r
FEDERATED HRMS MDT SC;IS r
MLVE
MCGE
MCGE
LSE
SCCE
361.7
298.0
386.7
318.5
903.0
28.86
45.19
48.21
17.56
23.43
10.53
14.06
14.16
0.64
16.11
12.79
27.05
27.44
4.96
20.58
11.53
5.50
5.81
12.21
6.50
12.26
15.26
15.60
8.68
10.78
9.03
11.26
11.57
5.72
8.70
NA
NA
NA
NA
NA
NA
NA
NA
NA
NA
FIDELITY ADV GR&INC;A
FIDELITY ADV HLTH;A
FIDELITY ADV HLTH;C
FIDELITY ADV HLTH;I r
FIDELITY ADV HLTH;M
LCVE
H
H
H
H
496.5
1460.3
303.6
2226.0
300.9
35.83
59.99
44.32
66.74
54.76
9.11
8.27
8.04
8.33
8.18
17.98
3.81
3.02
4.07
3.54
12.01
0.11
–0.64
0.37
–0.15
14.43
9.21
8.40
9.50
8.93
9.88
10.02
9.20
10.31
9.74
35.51
60.11
44.41
66.88
54.87
–0.38
+0.06
+0.04
+0.07
+0.05
FEDERATED HRMS SVD;A
FEDERATED HRMS SVD;C
FEDERATED HRMS SVD;INST r
FEDERATED HRMS SVD;R6 r
FEDERTD HRMS MDTLC;IS r
EIEI
EIEI
EIEI
EIEI
MLGE
1520.8
453.4
4927.0
1295.1
603.1
5.43
5.45
5.47
5.47
27.91
8.62
8.37
8.62
8.62
14.36
–2.07
–2.66
–1.81
–1.79
39.62
8.71
7.93
8.98
9.01
11.09
7.10
6.31
7.36
7.38
20.14
6.51
5.72
6.78
I
13.92
NA
NA
NA
NA
NA
NA
NA
NA
NA
NA
FIDELITY ADV HLTH;Z r
FIDELITY ADV INTL CA;A
FIDELITY ADV INTL CA;I r
FIDELITY ADV INTL CA;Z r
FIDELITY ADV INTL DS;I r
H
ILCG
ILCG
ILCG
ILCG
624.5
548.5
4546.7
1483.6
559.0
66.96
27.63
29.73
29.81
44.21
8.35
15.36
15.48
15.47
11.06
4.20
27.30
27.63
27.79
14.15
0.49
1.47
1.73
1.86
–1.57
9.63
11.01
11.30
11.45
8.09
I
7.29
7.57
I
4.15
67.11
26.96
29.01
29.09
43.26
+0.07
–0.67
–0.71
–0.72
–0.96
FIDELITY 500 INDEX FUND
FIDELITY ADV AM 20%;Z r
FIDELITY ADV AM 30%;Z r
FIDELITY ADV AM 40%;Z r
FIDELITY ADV AM 50%;Z r
SPSP 471907.0
MTAC 1968.2
MTAC
481.5
MTAC
585.9
MTAM 2035.4
165.49
13.29
11.47
12.39
19.51
11.69
6.35
7.37
8.09
8.79
26.29
7.95
9.84
11.48
13.17
9.99
0.32
0.75
1.37
1.92
15.68
3.96
5.21
6.43
7.54
12.02
I
I
I
I
162.71
13.17
11.35
12.24
19.24
–3.24
–0.14
–0.14
–0.17
–0.31
FIDELITY ADV INTL DS;Z r
FIDELITY ADV INTL GR;I r
FIDELITY ADV INTL GR;Z r
FIDELITY ADV INTL SC;I r
FIDELITY ADV INTL SC;Z r
ILCG
ILCG
ILCG
ISMC
ISMC
3225.1
1669.3
1430.9
1139.7
1522.0
44.14
19.10
19.12
31.58
31.53
11.11
14.87
14.88
11.55
11.58
14.27
20.87
21.02
19.63
19.76
–1.45
2.34
2.45
4.19
4.32
8.22
10.93
11.07
8.60
8.74
4.28
6.50
6.63
6.27
I
43.19
18.59
18.62
31.12
31.07
–0.96
–0.52
–0.51
–0.42
–0.42
FIDELITY ADV AM 60%;Z r
FIDELITY ADV AM 70%;Z r
FIDELITY ADV AM 85%;Z r
FIDELITY ADV BAL;A
FIDELITY ADV BAL;C
MTAM
MTAG
MTAA
MTAM
MTAM
1523.5
2204.9
1422.2
2001.4
1027.6
14.60
25.73
24.13
26.36
26.08
9.50
9.97
10.94
9.82
9.61
14.82
16.52
19.15
21.21
20.32
2.54
3.41
4.39
5.23
4.44
8.61
9.77
11.41
11.98
11.13
I
I
I
8.66
7.85
14.37
25.29
23.67
25.99
25.71
–0.25
–0.48
–0.50
–0.43
–0.43
FIDELITY ADV INTL SO;Z r
FIDELITY ADV JAPAN;Z r
FIDELITY ADV LEV CO;A
FIDELITY ADV LEV CO;I r
FIDELITY ADV LG CAP;A
ISMG
JA
MLCE
MLCE
LCVE
267.0
416.5
510.1
257.1
637.7
19.89
16.03
42.41
44.68
40.14
15.91
8.69
11.74
11.79
9.68
17.09
16.11
25.81
26.15
23.14
–0.59
–2.29
6.44
6.72
12.38
8.73
8.09
15.01
15.32
15.15
I
I
7.93
8.22
10.35
19.40
15.66
41.28
43.49
39.71
–0.55
–0.36
–1.34
–1.41
–0.54
FIDELITY ADV BAL;INST r
FIDELITY ADV BAL;M
FIDELITY ADV BAL;Z r
FIDELITY ADV BIOTECH;A
FIDELITY ADV BIOTECH;I r
MTAM
MTAM
MTAM
H
H
1993.1
1575.1
967.2
647.9
687.5
27.06
26.80
27.06
27.34
29.86
9.90
9.76
9.92
17.39
17.44
21.53
20.97
21.68
10.68
10.99
5.50
4.98
5.62
–0.59
–0.32
12.27
11.70
12.40
10.30
10.60
8.94
8.40
9.08
8.46
8.75
26.68
26.42
26.68
28.00
30.59
–0.44
–0.44
–0.44
+0.43
+0.47
FIDELITY ADV LG CAP;I r
FIDELITY ADV MA INC;I r
FIDELITY ADV MA INC;Z r
FIDELITY ADV MID CP2;A
FIDELITY ADV MID CP2;I r
LCVE
FX
FX
MCCE
MCCE
256.6
693.4
256.2
698.7
318.3
43.05
13.35
13.36
21.21
22.23
9.74
6.81
6.92
11.06
11.15
23.47
11.70
11.81
14.70
15.03
12.67
4.63
4.76
6.78
7.08
15.45
10.46
10.57
12.18
12.50
10.65
I
I
7.73
8.02
42.59
13.23
13.24
20.65
21.64
–0.57
–0.16
–0.15
–0.73
–0.77
FIDELITY ADV CAP DEV;A
FIDELITY ADV CAP DEV;O n
FIDELITY ADV CNS STP;A
FIDELITY ADV DIV GRO;A
FIDELITY ADV DIV GRO;I r
LCVE
LCVE
CG
MLCE
MLCE
638.1
3449.7
295.9
489.0
267.8
19.52
20.54
90.97
18.49
19.98
9.90
10.00
4.68
10.96
10.97
23.87
24.20
2.70
17.33
17.56
12.44
12.76
5.19
9.58
9.83
15.17
15.50
11.21
11.41
11.68
10.38
10.70
6.69
8.53
8.79
19.31
20.32
90.83
18.27
19.75
–0.26
–0.27
–0.06
–0.26
–0.28
FIDELITY ADV MID CP2;M
FIDELITY ADV NEW INS;A
FIDELITY ADV NEW INS;C
FIDELITY ADV NEW INS;I r
FIDELITY ADV NEW INS;M
MCCE
LCCE
LCCE
LCCE
LCCE
276.4
6314.3
641.8
7796.8
1537.8
20.37
32.50
24.08
34.00
30.24
11.00
11.46
11.24
11.51
11.39
14.42
35.95
34.86
36.26
35.60
6.53
7.01
6.19
7.28
6.75
11.92
14.37
13.50
14.65
14.08
7.47
11.02
10.19
11.30
10.75
19.83
31.99
23.70
33.46
29.76
–0.70
–0.62
–0.46
–0.65
–0.58
FIDELITY ADV DIV GRO;M
FIDELITY ADV DV IN;A
FIDELITY ADV DV IN;I r
FIDELITY ADV DV IN;Z r
FIDELITY ADV DVS STK;A
MLCE
ILCG
ILCG
ILCG
LCCE
349.3
471.3
500.6
335.6
433.3
18.42
24.77
25.31
25.24
30.55
10.86
10.17
10.20
10.27
11.73
17.05
17.12
17.34
17.54
27.88
9.32
0.15
0.39
0.54
9.37
11.16
9.18
9.45
9.62
16.26
8.27
4.92
5.19
5.35
11.26
18.20
24.25
24.78
24.71
29.85
–0.26
–0.52
–0.53
–0.53
–0.78
FIDELITY ADV NEW INS;Z r
FIDELITY ADV RE INC;A
FIDELITY ADV RE INC;I r
FIDELITY ADV RE INC;Z r
FIDELITY ADV SC GRO;A
LCCE
RE
RE
RE
SCGE
1693.0
296.1
1253.4
1600.3
309.8
34.14
11.49
11.53
11.52
26.13
11.55
7.79
8.01
7.99
13.46
36.43
9.02
9.37
9.52
18.72
7.41
3.30
3.59
3.70
–0.87
14.79
5.02
5.32
5.44
12.50
11.44
5.44
5.73
I
10.30
33.61
11.42
11.45
11.44
25.16
–0.65
–0.11
–0.12
–0.12
–1.29
FIDELITY ADV DVS STK;O n
FIDELITY ADV EM DSC;I r
FIDELITY ADV EM MKTS;Z r
FIDELITY ADV ENERGY;A
FIDELITY ADV ENERGY;I r
LCCE
EM
EM
NR
NR
2229.7
540.3
1806.6
359.6
498.8
31.91
16.47
35.72
42.68
45.26
11.83
9.47
8.55
–8.18
–8.14
28.33
20.78
15.30
1.04
1.29
9.77
4.35
I
36.23
36.62
16.67
9.71
I
13.29
13.63
11.64
5.48
I
2.25
2.55
31.18
15.98
34.85
42.92
45.52
–0.81
–0.43
–0.86
+0.18
+0.19
FIDELITY ADV SC GRO;I r
FIDELITY ADV SC GRO;Z r
FIDELITY ADV SC VAL;A
FIDELITY ADV SC VAL;I r
FIDELITY ADV SC VAL;Z r
SCGE
SCGE
SCCE
SCCE
SCCE
846.8
1750.3
269.5
1106.9
661.9
28.24
28.47
19.12
19.79
19.80
13.50
13.56
14.19
14.28
14.26
19.01
19.17
17.44
17.79
17.94
–0.62
–0.47
11.92
12.22
12.35
12.78
12.94
13.36
13.67
13.82
10.60
I
8.41
8.71
I
27.19
27.41
18.60
19.25
19.26
–1.39
–1.40
–0.72
–0.74
–0.74
FIDELITY ADV EQ GRO;A
FIDELITY ADV EQ GRO;I r
FIDELITY ADV EQ GRO;M
FIDELITY ADV EQ GRO;Z r
FIDELITY ADV EQ INC;A
MLGE
MLGE
MLGE
MLGE
EIEI
1917.0
2446.0
1682.6
1963.7
753.0
17.08
19.81
16.44
20.11
31.14
13.30
13.42
13.26
13.45
8.73
35.24
35.60
34.88
35.79
11.16
7.73
8.02
7.48
8.15
10.20
19.11
19.42
18.81
19.56
11.49
14.35
14.65
14.08
14.80
7.76
16.56
19.21
15.94
19.49
31.17
–0.60
–0.68
–0.57
–0.70
–0.02
FIDELITY ADV SEMICND;A
FIDELITY ADV SEMICND;I r
FIDELITY ADV SM CAP;A
FIDELITY ADV SM CAP;I r
FIDELITY ADV SM CAP;M
TK
TK
SCGE
SCGE
SCGE
642.3
596.2
714.7
485.2
474.5
60.95
65.87
28.15
32.63
24.72
13.58
13.64
12.14
12.20
12.10
74.91
75.33
18.28
18.57
18.00
21.41
21.72
7.19
7.46
6.92
33.30
33.66
13.81
14.11
13.54
24.83
25.19
7.70
7.99
7.45
57.41
62.05
27.21
31.54
23.89
–3.99
–4.31
–1.27
–1.47
–1.12
FIDELITY ADV EQ INC;I r
FIDELITY ADV EQ INC;M
FIDELITY ADV FCSD EM;I r
FIDELITY ADV FCSD EM;Z r
FIDELITY ADV FR 2020;A
EIEI
EIEI
EM
EM
MATB
386.5
545.4
2306.7
1494.6
546.6
33.42
32.31
28.53
28.46
11.51
8.77
8.64
8.73
8.73
8.71
11.41
10.88
8.45
8.60
12.09
10.46
9.94
–5.37
–5.26
0.54
11.77
11.22
7.45
7.59
6.35
8.03
7.50
4.96
5.11
5.13
33.47
32.35
27.88
27.81
11.36
–0.01
–0.02
–0.59
–0.59
–0.17
FIDELITY ADV SRS EQTY GR r
FIDELITY ADV SRS GRO OPP r
FIDELITY ADV SRS SM CP r
FIDELITY ADV SS MC
FIDELITY ADV SS MC;A
MLGE
MLGE
SCGE
SCCE
SCCE
1145.4
816.7
450.3
352.9
653.6
15.52
12.83
12.14
41.27
38.48
13.82
15.35
12.34
12.25
12.18
37.14
46.95
19.24
17.15
16.85
9.06
1.25
8.22
7.53
7.25
20.51
19.68
14.94
12.74
12.46
I
16.43
8.43
8.96
8.71
15.04
12.42
11.73
39.98
37.28
–0.54
–0.49
–0.55
–1.69
–1.58
FIDELITY ADV FR 2020;I r
FIDELITY ADV FR 2025;A
FIDELITY ADV FR 2025;I r
FIDELITY ADV FR 2025;M
FIDELITY ADV FR 2025;Z r
MATB
MATG
MATG
MATG
MATG
271.2
894.9
536.7
323.5
307.0
11.66
12.15
12.32
12.17
12.14
8.75
9.25
9.38
9.21
9.37
12.37
13.18
13.54
12.90
13.50
0.80
1.00
1.25
0.75
1.33
6.61
7.07
7.34
6.80
7.42
5.40
5.58
5.84
5.32
I
11.51
11.98
12.14
12.00
11.97
–0.17
–0.19
–0.20
–0.19
–0.19
FIDELITY ADV SS MC;I r
FIDELITY ADV SS MC;M
FIDELITY ADV STK SL AC;A
FIDELITY ADV STK SL AC;Z r
FIDELITY ADV STK SSC;I r
SCCE
SCCE
MLCE
MLCE
SCGE
368.4
464.0
254.8
3479.1
636.9
41.41
38.94
68.79
68.70
33.60
12.25
12.11
12.34
12.44
13.12
17.17
16.59
26.60
27.10
19.42
7.51
7.00
7.63
8.04
6.86
12.73
12.20
15.40
15.85
14.14
8.96
8.45
10.87
11.32
8.96
40.12
37.72
67.32
67.24
32.50
–1.69
–1.60
–1.73
–1.73
–1.47
FIDELITY ADV FR 2030;A
FIDELITY ADV FR 2030;I r
FIDELITY ADV FR 2030;M
FIDELITY ADV FR 2030;Z r
FIDELITY ADV FR 2035;A
MATC
MATC
MATC
MATC
MATD
1111.4
737.5
414.5
398.9
981.5
13.46
13.59
13.34
13.40
13.68
9.60
9.67
9.50
9.63
10.09
14.29
14.56
14.02
14.70
16.37
1.62
1.89
1.37
1.97
2.78
8.09
8.36
7.83
8.46
9.60
6.27
6.54
6.01
I
7.09
13.26
13.39
13.14
13.20
13.46
–0.23
–0.23
–0.23
–0.23
–0.25
FIDELITY ADV STK SSC;Z r
FIDELITY ADV STR D&I;A
FIDELITY ADV STR D&I;I r
FIDELITY ADV STR D&I;M
FIDELITY ADV TECH;A
SCGE
MTAG
MTAG
MTAG
TK
345.7
885.7
613.7
297.8
1997.5
33.54
15.74
15.82
15.74
95.16
13.20
8.10
8.13
8.03
13.09
19.59
9.13
9.43
8.93
59.19
7.01
5.19
5.46
4.94
8.95
14.29
9.56
9.83
9.28
26.12
I
7.73
8.01
7.46
19.23
32.45
15.64
15.72
15.64
90.77
–1.46
–0.15
–0.15
–0.15
–4.91
FIDELITY ADV FR 2035;I r
FIDELITY ADV FR 2035;M
FIDELITY ADV FR 2035;Z r
FIDELITY ADV FR 2040;A
FIDELITY ADV FR 2040;I r
MATD
MATD
MATD
MATH
MATH
681.5
382.9
376.3
914.8
647.3
13.87
13.44
13.67
15.11
15.31
10.17
10.09
10.19
10.76
10.83
16.65
16.09
16.74
18.39
18.73
3.03
2.52
3.13
3.73
3.99
9.87
9.32
9.97
10.56
10.85
7.36
6.83
I
7.52
7.79
13.65
13.22
13.45
14.85
15.04
–0.25
–0.25
–0.25
–0.30
–0.30
FIDELITY ADV TECH;C
FIDELITY ADV TECH;M
FIDELITY ADV TECH;Z r
FIDELITY ADV UTIL;A
FIDELITY ADV VAL STR
TK
TK
TK
UT
MCCE
304.1
652.9
538.8
304.4
703.9
69.89
86.54
107.32
36.03
55.26
12.86
13.02
13.19
10.11
11.80
57.99
58.82
59.80
–1.71
20.51
8.12
8.69
9.37
6.55
14.17
25.17
25.81
26.61
7.99
16.73
18.33
18.94
I
8.62
9.42
66.66
82.54
102.37
36.39
53.92
–3.62
–4.48
–5.54
+0.30
–1.77
FIDELITY ADV FR 2040;M
FIDELITY ADV FR 2040;Z r
FIDELITY ADV FR 2045;A
FIDELITY ADV FR 2045;I r
FIDELITY ADV FR 2045;Z r
MATH
MATH
MATI
MATI
MATI
358.5
320.4
579.6
503.9
257.9
14.95
15.08
11.95
12.10
11.86
10.69
10.83
10.93
10.94
11.07
18.13
18.82
18.99
19.24
19.42
3.47
4.11
3.88
4.11
4.26
10.27
10.95
10.66
10.91
11.05
7.25
I
7.57
7.84
I
14.69
14.81
11.73
11.88
11.64
–0.30
–0.30
–0.24
–0.25
–0.24
FIDELITY ADV VAL STR;A
FIDELITY ADV VAL STR;I r
FIDELITY ASSET MGR 20%
FIDELITY ASSET MGR 30%
FIDELITY ASSET MGR 40%
MCCE
MCCE
MTAC
MTAC
MTAC
386.9
515.8
3372.9
1429.0
1488.8
44.56
50.57
13.30
11.47
12.39
11.74
11.79
6.33
7.35
8.06
20.20
20.48
7.99
9.81
11.52
13.87
14.15
0.29
0.69
1.33
16.42
16.71
3.93
5.18
6.39
9.13
9.39
3.32
4.20
4.97
43.48
49.36
13.18
11.35
12.24
–1.42
–1.61
–0.14
–0.14
–0.17
FIDELITY ADV FR 2050;A
FIDELITY ADV FR 2050;I r
FIDELITY ADV FR 2055;A
FIDELITY ADV FR 2055;I r
FIDELITY ADV GL C ST;I r
MATE
MATE
MATK
MATK
GNR
503.3
470.0
306.5
335.3
331.4
11.99
12.15
13.43
13.55
17.85
10.90
11.04
10.92
11.01
–0.85
18.92
19.30
18.89
19.22
–5.18
3.87
4.14
3.87
4.14
13.04
10.64
10.94
10.66
10.94
12.57
7.57
7.84
7.57
7.85
4.67
11.78
11.93
13.19
13.30
17.64
–0.24
–0.24
–0.27
–0.28
–0.25
FIDELITY ASSET MGR 50%
FIDELITY ASSET MGR 60%
FIDELITY ASSET MGR 70%
FIDELITY ASSET MGR 85%
FIDELITY BALANCED
MTAM 7293.3
MTAM 2169.2
MTAG 4018.9
MTAA 2095.5
MTAG 34744.8
19.58
14.61
25.77
24.27
26.93
8.83
9.50
9.90
10.88
9.86
13.09
14.81
16.45
18.98
21.60
1.85
2.44
3.32
4.28
5.58
7.46
8.54
9.68
11.32
12.37
5.63
6.28
6.94
7.93
9.04
19.30
14.38
25.34
23.81
26.55
–0.31
–0.26
–0.48
–0.51
–0.44
FIDELITY ADV GR OPP;A
FIDELITY ADV GR OPP;C
FIDELITY ADV GR OPP;I r
FIDELITY ADV GR OPP;M
FIDELITY ADV GR OPP;Z r
MLGE
MLGE
MLGE
MLGE
MLGE
3587.8
978.2
8036.3
2657.8
2983.0
128.32
102.87
142.34
126.02
144.37
15.14
14.91
15.20
15.06
15.24
45.14
44.06
45.51
44.80
45.70
–0.14
–0.89
0.12
–0.38
0.24
18.69
17.80
18.99
18.41
19.14
15.53
14.66
15.84
15.26
15.98
124.20
99.56
137.78
121.98
139.74
–4.96
–3.99
–5.49
–4.87
–5.57
FIDELITY BALANCED K6 r
FIDELITY BALANCED;K r
FIDELITY BLUE CHIP GR
FIDELITY BLUE CHIP GR K6 r
FIDELITY BLUE CHIP GR;K r
MTAG 1678.0
MTAG 8228.0
LCGE 47535.0
LCGE 12222.8
LCGE 4505.5
14.14
26.93
173.27
26.84
174.22
9.97
9.86
15.08
14.56
15.11
21.93
21.68
55.60
55.57
55.76
5.89
5.67
5.53
5.97
5.62
I
12.46
20.53
21.42
20.64
I
9.14
15.78
I
15.90
13.94
26.55
167.77
26.04
168.69
–0.23
–0.44
–6.51
–0.95
–6.55
January 8, 2024
BARRON’S
•
L13
Funds Quarterly
Stock Funds
s Copyright Lipper
For personal non-commercial use only. Do not edit or alter. Reproductions not permitted.
To reprint or license content, please contact Barron's reprints department at 800-843-0008 or www.djreprints.com
NAME
OBJ
LATEST
REPORTED
NAV
ASSETS
($ SHR)
($MIL)
12/29/23
QTR
RETURN THROUGH 12/29
1YR
3 YRS
5 YRS
(Annualized)
10YRS
LATEST WK’S DATA
(as of Thursday)
CLOSE
WK’S
NAV
CHG
NAME
Data provided by
OBJ
LATEST
REPORTED
NAV
ASSETS
($ SHR)
($MIL)
12/29/23
QTR
RETURN THROUGH 12/29
1YR
3 YRS
5 YRS
(Annualized)
10YRS
LATEST WK’S DATA
(as of Thursday)
CLOSE
WK’S
NAV
CHG
FIDELITY BLUE CHIP VALUE
FIDELITY CANADA;CANADA
FIDELITY CAP APP
FIDELITY CAP APP;K r
FIDELITY CHINA REGION
MLVE
ILCG
MLGE
MLGE
CH
727.6
869.1
5636.1
269.7
810.4
24.89
64.49
39.69
39.85
32.01
7.14
9.89
12.71
12.73
3.54
7.08
14.65
28.79
28.90
–0.29
10.77
10.96
8.04
8.13
–13.06
9.53
12.40
17.01
17.12
5.58
7.40
5.76
11.63
11.74
4.52
24.96
63.92
38.53
38.68
31.22
+0.05
–0.51
–1.30
–1.31
–0.66
FIDELITY FREEDOM 2025;K r
FIDELITY FREEDOM 2025;K6 r
FIDELITY FREEDOM 2030
FIDELITY FREEDOM 2030;K r
FIDELITY FREEDOM 2030;K6 r
MATG 9465.4
MATG 4437.1
MATC 13314.9
MATC 13443.7
MATC 6665.1
13.07
13.03
16.57
16.55
16.49
9.34
9.51
9.68
9.69
9.81
14.22
14.44
15.37
15.47
15.72
1.61
1.75
2.22
2.30
2.46
7.55
7.70
8.50
8.60
8.75
I
I
6.69
I
I
12.89
12.85
16.33
16.32
16.25
–0.21
–0.20
–0.28
–0.27
–0.27
FIDELITY CONTRAFUND
FIDELITY CONTRAFUND K6 r
FIDELITY CONTRAFUND;K r
FIDELITY CONVERTIBLE
FIDELITY DISCPLN EQ
LCCE 107024.5
LCCE 28946.1
LCCE 9879.6
CV
1515.3
LCGE 1706.3
16.09
23.05
16.15
32.44
58.49
11.45
11.35
11.48
5.49
13.33
39.33
37.67
39.47
11.42
34.04
7.52
7.59
7.60
1.26
7.18
16.46
16.38
16.56
13.74
16.09
12.82
I
12.92
7.99
10.63
15.86
22.72
15.92
31.88
57.13
–0.29
–0.41
–0.29
–0.69
–1.51
FIDELITY FREEDOM 2035
FIDELITY FREEDOM 2035;K r
FIDELITY FREEDOM 2035;K6 r
FIDELITY FREEDOM 2040
FIDELITY FREEDOM 2040;K r
MATD 9837.8
MATD 11378.1
MATD 6149.8
MATH 10297.9
MATH 11110.2
14.53
14.51
14.46
10.49
10.49
10.28
10.29
10.39
10.89
10.92
17.67
17.80
18.06
20.07
20.09
3.48
3.58
3.72
4.55
4.63
10.06
10.17
10.32
11.10
11.21
7.54
I
I
8.00
I
14.30
14.28
14.23
10.31
10.31
–0.26
–0.26
–0.26
–0.20
–0.20
FIDELITY DIVIDEND GR
FIDELITY DIVIDEND GR;K r
FIDELITY DVSD INTL
FIDELITY DVSD INTL;K r
FIDELITY DVSFD INTL K6 r
MLVE
MLVE
ILCG
ILCG
ILCG
5835.0
494.3
8450.7
1173.2
4508.1
33.00
32.95
41.07
40.97
13.57
11.06
11.09
10.33
10.36
10.32
17.83
17.97
17.71
17.82
17.56
10.03
10.14
0.37
0.49
0.73
11.87
11.98
9.30
9.42
9.63
8.90
9.02
4.87
5.00
I
32.59
32.54
40.21
40.11
13.29
–0.49
–0.49
–0.85
–0.85
–0.27
FIDELITY FREEDOM 2040;K6 r
FIDELITY FREEDOM 2045
FIDELITY FREEDOM 2045;K r
FIDELITY FREEDOM 2045;K6 r
FIDELITY FREEDOM 2050
MATH
MATI
MATI
MATI
MATE
6222.2
6003.4
8451.8
4866.1
5173.2
10.43
12.08
12.06
12.01
12.22
10.92
11.16
11.14
11.23
11.05
20.26
20.56
20.66
20.91
20.46
4.77
4.69
4.78
4.95
4.68
11.37
11.20
11.31
11.49
11.18
I
8.06
I
I
8.05
10.26
11.86
11.85
11.80
12.01
–0.20
–0.24
–0.24
–0.24
–0.24
FIDELITY EM DSC
FIDELITY EMERG ASIA
FIDELITY EMERG MKTS
FIDELITY EMERG MKTS IDX
FIDELITY EMERG MKTS;K r
EM
EM
EM
EM
EM
438.5
931.1
4435.7
7125.2
1497.2
16.43
39.95
35.77
10.05
35.77
9.50
8.44
8.53
7.67
8.58
20.76
13.58
15.16
9.50
15.35
4.34
–12.65
–5.40
–5.32
–5.27
9.70
8.58
8.44
3.41
8.58
5.47
6.91
5.53
2.73
5.68
15.94
38.98
34.90
9.85
34.89
–0.42
–0.89
–0.86
–0.19
–0.86
FIDELITY FREEDOM 2050;K r
FIDELITY FREEDOM 2050;K6 r
FIDELITY FREEDOM 2055
FIDELITY FREEDOM 2055;K r
FIDELITY FREEDOM 2055;K6 r
MATE
MATE
MATK
MATK
MATK
7914.0
4448.3
2708.1
4887.0
2723.2
12.21
12.18
14.15
14.14
14.11
11.11
11.19
11.12
11.13
11.20
20.64
20.87
20.55
20.65
20.85
4.77
4.95
4.68
4.78
4.95
11.30
11.47
11.19
11.31
11.47
I
I
8.05
I
I
12.00
11.97
13.90
13.89
13.86
–0.24
–0.24
–0.28
–0.28
–0.28
FIDELITY ENT TECH SVC PT
FIDELITY EQTY DIV INC
FIDELITY EQTY DIV INC;K r
FIDELITY EQUITY-INC
FIDELITY EQUITY-INC;K r
TK
EIEI
EIEI
EIEI
EIEI
2019.1
5107.4
817.5
7197.9
566.2
62.34
27.12
27.11
67.46
67.40
14.21
8.84
8.85
8.77
8.80
23.17
11.58
11.69
10.60
10.70
–3.49
10.50
10.59
9.30
9.40
10.93
11.83
11.93
12.27
12.37
11.51
8.54
8.65
8.58
8.69
60.35
27.14
27.13
67.18
67.11
–2.32
–0.03
–0.02
–0.37
–0.37
FIDELITY FREEDOM 2060
FIDELITY FREEDOM 2060;K r
FIDELITY FREEDOM 2060;K6 r
FIDELITY FREEDOM 2065;K r
FIDELITY FREEDOM 2065;K6 r
MATL
MATL
MATL
MATM
MATM
1203.9
2477.3
1416.9
528.1
313.5
13.00
12.99
12.98
11.90
11.92
11.14
11.13
11.18
11.18
11.17
20.50
20.59
20.87
20.69
20.78
4.69
4.78
4.93
4.78
4.94
11.20
11.30
11.46
I
I
I
I
I
I
I
12.77
12.76
12.76
11.69
11.71
–0.25
–0.26
–0.25
–0.23
–0.24
FIDELITY EUROPE
FIDELITY EXTENDED MKT IX
FIDELITY FLEX 500 INDEX r
FIDELITY FLEX INTL INDEX r
FIDELITY FLEX MID CAP IX r
EU
574.6
MCGE 36227.6
SPSP 3928.6
ILCC 1929.9
MCCE
368.1
34.34
78.06
20.33
12.61
16.46
11.45
15.14
11.66
9.89
12.84
13.67
25.37
26.27
15.47
17.30
–1.22
1.21
10.00
1.61
5.95
7.23
11.89
15.69
7.12
12.74
3.33
8.56
I
I
I
33.76
75.29
19.99
12.41
16.06
–0.57
–3.73
–0.40
–0.18
–0.51
FIDELITY FREEDOM INC
FIDELITY FREEDOM INC;K r
FIDELITY FREEDOM INC;K6 r
FIDELITY FUND
FIDELITY FUND;K r
MATJ
MATJ
MATJ
LCGE
LCGE
1292.7
623.8
257.3
6558.3
258.8
10.44
10.42
10.41
74.48
74.48
6.40
6.43
6.51
11.56
11.59
8.18
8.26
8.42
30.92
31.03
–0.36
–0.32
–0.22
8.94
9.03
3.59
3.64
3.71
16.89
16.98
3.26
I
I
12.08
12.19
10.35
10.33
10.32
73.00
73.00
–0.10
–0.10
–0.10
–1.65
–1.65
FIDELITY FLEX SM CAP IDX r
FIDELITY FOCUSED STK
FIDELITY FR BL 2020;PRM r
FIDELITY FR BL 2025;K6 r
FIDELITY FR BL 2025;PRM r
SCCE
LCGE
MATB
MATG
MATG
328.1
2875.8
275.8
687.3
555.9
14.51
30.29
10.09
10.37
10.35
14.13
10.11
8.92
9.50
9.54
17.13
28.93
13.01
14.27
14.32
2.36
6.35
I
1.36
I
10.10
16.06
I
7.45
I
I
12.29
I
I
I
14.01
29.73
9.96
10.23
10.20
–0.72
–0.69
–0.15
–0.16
–0.17
FIDELITY GLOBAL COM STK
FIDELITY GLOBAL EX US IX
FIDELITY GRO & INC
FIDELITY GRO & INC;K r
FIDELITY GRO CO K6 nr
GNR
404.2
ILCC 9506.3
LCVE 8299.7
LCVE 1370.1
MLGE 16148.3
17.87
14.08
54.20
54.14
22.45
–0.86
9.98
9.29
9.31
14.48
–5.19
15.59
18.61
18.72
46.02
13.01
1.63
12.35
12.46
6.30
12.50
7.11
14.80
14.92
I
4.60
3.85
10.27
10.39
I
17.66
13.85
53.71
53.64
21.80
–0.25
–0.21
–0.59
–0.59
–0.77
FIDELITY FR BL 2030;PRM r
FIDELITY FR BL 2035;PRM r
FIDELITY FR BL 2040;PRM r
FIDELITY FR BL 2045;PRM r
FIDELITY FR BL 2050;PRM r
MATC
MATD
MATH
MATI
MATE
774.7
859.9
795.0
738.2
599.8
10.55
10.98
11.31
11.33
11.32
9.80
10.41
11.07
11.23
11.23
15.55
17.91
20.26
20.79
20.77
I
I
I
I
I
I
I
I
I
I
I
I
I
I
I
10.40
10.80
11.11
11.13
11.12
–0.17
–0.20
–0.22
–0.23
–0.22
FIDELITY GRO COMPANY n
FIDELITY GRO COMPANY;K nr
FIDELITY GRO DISCOVERY
FIDELITY GRO DISCOVERY;K r
FIDELITY GRO STRAT
LCGE 45439.2
LCGE 8170.5
MLGE 3801.4
MLGE
439.9
MLGE 3136.4
31.92
32.09
53.86
53.95
56.43
14.20
14.19
13.44
13.44
10.84
47.23
47.33
35.65
35.76
20.93
6.15
6.21
8.03
8.13
2.58
22.63
22.71
19.34
19.45
13.79
16.83
16.93
14.60
14.72
10.02
30.98
31.15
52.21
52.30
54.76
–1.10
–1.10
–1.87
–1.87
–1.94
FIDELITY FR BL 2055;PRM r
FIDELITY FR BL 2060;K6 r
FIDELITY FRDM I 2010;IP r
FIDELITY FRDM I 2015;IP r
FIDELITY FRDM I 2015;PR r
MATK
MATL
MATA
MATF
MATF
320.8
284.1
512.2
1125.3
513.4
11.40
11.54
12.74
14.05
14.04
11.26
11.20
7.11
7.95
7.89
20.84
20.69
9.88
11.33
11.27
I
4.47
0.17
0.58
0.58
I
11.25
4.90
5.76
I
I
I
I
I
I
11.19
11.33
12.62
13.90
13.89
–0.23
–0.23
–0.15
–0.18
–0.18
FIDELITY INTERNATIONL IX
FIDELITY INTL CAP APP
FIDELITY INTL CAP APP K6 r
FIDELITY INTL DISC K6 r
FIDELITY INTL DISCVRY
ILCC 46445.0
ILCG 5044.6
ILCG 1382.2
ILCG
666.7
ILCG 3764.6
47.35
26.52
15.30
12.25
44.38
10.75
15.41
15.38
11.23
11.08
18.31
27.57
27.54
14.39
14.16
4.18
1.73
1.91
–1.44
–1.55
8.34
11.36
11.66
I
8.11
4.42
7.66
I
I
4.16
46.61
25.88
14.93
11.98
43.42
–0.66
–0.64
–0.37
–0.27
–0.97
FIDELITY FRDM I 2020;IP r
FIDELITY FRDM I 2020;PR r
FIDELITY FRDM I 2025;IP r
FIDELITY FRDM I 2025;PR r
FIDELITY FRDM I 2030;IP r
MATB 4299.0
MATB 1582.0
MATG 8683.7
MATG 3208.9
MATC 12720.5
15.51
15.50
17.70
17.69
18.91
8.70
8.65
9.31
9.33
9.70
12.72
12.76
13.95
13.98
15.16
0.92
0.94
1.38
1.41
2.04
6.51
I
7.22
I
8.22
I
I
I
I
I
15.32
15.31
17.46
17.45
18.64
–0.23
–0.23
–0.29
–0.29
–0.32
FIDELITY INTL GROWTH
FIDELITY INTL SC OPP
FIDELITY INTL SM CAP
FIDELITY INTL SUSTAIN IX
FIDELITY INTL VALUE
ILCG
ISMG
ISMC
ILCC
ILCV
1494.0
756.6
1526.2
418.0
519.8
19.15
19.97
31.36
11.70
9.82
14.90
15.88
11.57
10.14
9.62
20.89
16.99
19.62
14.66
19.26
2.34
–0.71
4.19
0.04
8.04
10.92
8.61
8.59
6.69
9.15
6.49
6.60
6.25
I
3.51
18.64
19.47
30.90
11.48
9.70
–0.52
–0.56
–0.42
–0.21
–0.11
FIDELITY FRDM I 2030;PR r
FIDELITY FRDM I 2035;IP r
FIDELITY FRDM I 2035;PR r
FIDELITY FRDM I 2040;IP r
FIDELITY FRDM I 2040;PR r
MATC 4287.2
MATD 12044.6
MATD 4583.1
MATH 12374.5
MATH 4611.0
18.90
21.50
21.50
22.20
22.19
9.66
10.23
10.25
10.85
10.87
15.13
17.31
17.33
19.44
19.47
2.05
3.24
3.26
4.26
4.28
I
9.71
I
10.73
I
I
I
I
I
I
18.63
21.16
21.16
21.82
21.81
–0.32
–0.39
–0.39
–0.43
–0.43
FIDELITY JAPAN SM CO
FIDELITY LARGE CAP STOCK
FIDELITY LATIN AMERICA
FIDELITY LOW-PRCD STK
FIDELITY LOW-PRCD STK K6 r
JA
473.1
LCVE 3400.2
LT
259.9
MCVE 24265.5
MCVE 3550.7
15.07
45.09
21.08
44.07
15.05
7.29
9.68
11.92
10.81
10.79
15.18
23.52
23.95
14.35
14.85
–0.68
12.68
1.98
10.28
10.74
4.60
15.45
3.43
13.00
13.18
5.15
10.61
–0.28
8.74
I
14.77
44.62
20.44
43.39
14.82
–0.26
–0.59
–0.67
–0.84
–0.29
FIDELITY FRDM I 2045;IP r
FIDELITY FRDM I 2045;PR r
FIDELITY FRDM I 2050;IP r
FIDELITY FRDM I 2050;PR r
FIDELITY FRDM I 2055;INV r
MATI 10507.5
MATI 4239.4
MATE 9996.0
MATE 3925.4
MATK 1052.7
23.16
23.16
23.20
23.20
19.09
11.06
11.08
11.04
11.06
11.10
19.95
19.98
19.97
20.00
19.95
4.40
4.42
4.40
4.44
4.36
10.82
I
10.83
I
10.78
I
I
I
I
7.92
22.76
22.75
22.80
22.79
18.75
–0.46
–0.46
–0.46
–0.46
–0.38
FIDELITY LOW-PRCD STK;K r
FIDELITY LRG CAP GRO IDX
FIDELITY LRG CAP VAL IDX
FIDELITY LVRGD CO STK
FIDELITY MAGELLAN FUND
MCVE 3251.8
LCGE 19284.7
MLVE 6700.7
MLCE 1919.0
LCGE 28354.2
43.99
29.50
16.17
34.87
12.31
10.84
14.23
9.49
11.76
13.31
14.44
42.77
11.50
26.11
30.95
10.37
8.86
8.84
6.94
6.60
13.10
19.48
10.90
16.01
15.31
8.83
I
I
8.50
11.77
43.31
28.67
16.06
33.94
12.01
–0.84
–0.94
–0.16
–1.11
–0.31
FIDELITY FRDM I 2055;IP r
FIDELITY FRDM I 2055;PR r
FIDELITY FRDM I 2060;INV r
FIDELITY FRDM I 2060;IP r
FIDELITY FRDM I 2060;PR r
MATK
MATK
MATL
MATL
MATL
7242.1
2541.9
628.5
3769.2
1275.1
19.09
19.09
16.17
16.17
16.17
11.07
11.09
11.02
11.05
11.07
19.93
20.03
19.91
19.97
19.99
4.39
4.43
4.36
4.40
4.42
10.81
I
10.78
10.83
I
I
I
I
I
I
18.76
18.75
15.89
15.89
15.89
–0.38
–0.38
–0.32
–0.32
–0.32
FIDELITY MAGELLAN FUND;K r
FIDELITY MEGA CAP STOCK
FIDELITY MID CAP GRO IDX
FIDELITY MID CAP INDEX
FIDELITY MID CAP STK K6 r
LCGE
768.4
LCVE 1498.5
MCGE
747.9
MCCE 31271.0
MCCE
907.6
12.30
20.94
27.08
29.95
14.63
13.38
10.24
14.51
12.79
9.19
31.05
26.51
25.79
17.21
11.56
6.66
13.28
1.31
5.92
10.09
15.41
16.58
I
12.68
I
11.86
11.40
I
9.41
I
12.00
20.71
26.16
29.22
14.35
–0.31
–0.26
–1.09
–0.92
–0.37
FIDELITY FRDM I 2065;IP r
FIDELITY FRDM I 2065;PR r
FIDELITY FRDM IX INC;IP r
FIDELITY FRDM IX INC;PR r
FIDELITY FREEDOM 2005
MATM
MATM
MATJ
MATJ
MATA
855.3
375.4
791.6
394.6
364.5
13.07
13.07
11.50
11.50
11.02
11.05
11.07
6.36
6.36
6.50
19.88
20.01
8.32
8.43
8.45
4.38
4.40
–0.31
–0.29
–0.22
I
I
3.55
I
4.12
I
I
I
I
3.81
12.85
12.85
11.41
11.41
10.92
–0.26
–0.26
–0.11
–0.11
–0.10
FIDELITY MID CAP VAL IDX
FIDELITY MID CAP VALUE
FIDELITY MID-CAP STOCK
FIDELITY MID-CAP STOCK;K r
FIDELITY MULTI ASSET INC
MCCE
MCCE
MCCE
MCCE
FX
807.4
1139.4
6413.3
939.5
1046.1
25.14
29.12
40.52
40.56
13.36
12.09
14.04
9.15
9.18
6.89
12.76
22.62
11.04
11.14
11.72
8.32
13.70
10.21
10.31
4.68
I
12.90
13.33
13.43
10.48
I
8.10
9.49
9.60
I
24.62
28.43
39.77
39.81
13.24
–0.68
–0.90
–0.98
–0.99
–0.15
FIDELITY FREEDOM 2010
FIDELITY FREEDOM 2010;K r
FIDELITY FREEDOM 2010;K6 r
FIDELITY FREEDOM 2015
FIDELITY FREEDOM 2015;K r
MATA
MATA
MATA
MATF
MATF
2463.4
890.6
285.7
3133.2
1602.7
13.63
13.62
13.54
11.18
11.16
7.17
7.19
7.19
8.04
8.07
9.82
9.94
9.97
11.39
11.44
0.22
0.28
0.34
0.66
0.73
5.03
5.11
5.17
5.93
6.00
4.43
I
I
5.03
I
13.50
13.49
13.41
11.05
11.03
–0.14
–0.14
–0.15
–0.14
–0.14
FIDELITY MULTI-ASSET IDX
FIDELITY NASDAQ COM IDX
FIDELITY NEW MILLENNIUM
FIDELITY NORDIC
FIDELITY OTC
MTAA 7878.3
MLGE 14335.5
MLVE 3868.1
EU
331.8
LCGE 19514.0
54.41
190.15
47.73
62.86
18.29
10.91
13.90
11.56
14.01
13.67
19.29
45.13
25.35
20.85
42.64
4.59
6.24
15.21
3.32
6.58
10.73
18.83
15.33
13.08
19.86
7.94
14.72
10.49
7.66
16.03
53.44
183.83
46.66
62.65
17.73
–1.11
–7.38
–1.23
–0.46
–0.64
FIDELITY FREEDOM 2015;K6 r
FIDELITY FREEDOM 2020
FIDELITY FREEDOM 2020;K r
FIDELITY FREEDOM 2020;K6 r
FIDELITY FREEDOM 2025
MATF
MATB
MATB
MATB
MATG
588.7
8116.5
5597.0
2253.7
9470.6
11.10
14.03
14.02
13.95
13.10
8.03
8.76
8.81
8.83
9.36
11.54
12.85
13.00
13.17
14.10
0.81
1.05
1.14
1.24
1.53
6.08
6.73
6.81
6.92
7.46
I
5.52
I
I
5.97
10.98
13.86
13.84
13.78
12.92
–0.14
–0.20
–0.20
–0.20
–0.21
FIDELITY OTC K6 r
FIDELITY OTC;K r
FIDELITY OVERSEAS
FIDELITY OVERSEAS;K r
FIDELITY PACIFIC BASIN
LCGE
LCGE
IMLG
IMLG
PC
20.12
18.72
60.30
60.15
29.59
13.69
13.76
13.14
13.15
8.86
43.48
42.92
20.55
20.69
14.06
6.95
6.68
2.67
2.77
–3.79
I
19.97
9.91
10.03
9.36
I
16.15
6.21
6.33
7.04
19.49
18.14
58.92
58.78
28.65
–0.72
–0.66
–1.38
–1.37
–0.91
2114.4
6689.8
7967.9
928.7
697.6
L14
BARRON’S
•
Funds Quarterly
January 8, 2024
Stock Funds
s Copyright Lipper
For personal non-commercial use only. Do not edit or alter. Reproductions not permitted.
To reprint or license content, please contact Barron's reprints department at 800-843-0008 or www.djreprints.com
NAME
OBJ
LATEST
REPORTED
NAV
ASSETS
($ SHR)
($MIL)
12/29/23
QTR
RETURN THROUGH 12/29
1YR
3 YRS
5 YRS
(Annualized)
10YRS
LATEST WK’S DATA
(as of Thursday)
CLOSE
WK’S
NAV
CHG
NAME
Data provided by
OBJ
LATEST
REPORTED
NAV
ASSETS
($ SHR)
($MIL)
12/29/23
FIDELITY PURITAN
FIDELITY PURITAN K6 FUND r
FIDELITY PURITAN;K r
FIDELITY REAL EST INC
FIDELITY REAL ESTATE
MTAG 24585.5
MTAG 1391.5
MTAG 3422.9
RE
1253.5
RE
2754.0
23.30
14.13
23.27
11.58
38.50
9.98
10.05
9.98
7.97
16.86
20.22
20.30
20.28
9.32
10.87
5.77
5.90
5.85
3.57
6.11
11.58
I
11.68
5.32
6.61
8.83
I
8.92
5.71
7.44
22.89
13.88
22.86
11.50
37.82
–0.45
–0.28
–0.46
–0.12
–1.12
FIDELITY TECH HARDWARE
FIDELITY TELECOM & UTILS
FIDELITY TOTAL INTL IDX
FIDELITY TOTAL MARKET IX
FIDELITY TREND
TK
890.7
UT
880.9
IMLC 11519.1
MLCE 83398.7
MLGE 2868.5
FIDELITY REAL ESTATE IDX
FIDELITY SAI EM INDEX r
FIDELITY SAI EM LV IDX nr
FIDELITY SAI EM VAL IDX r
FIDELITY SAI INFLTN FOC r
RE
EM
EM
EM
CMG
2637.0
4047.3
3510.6
3021.6
2654.7
15.79
12.98
10.94
12.13
84.29
18.10
7.72
7.17
8.81
–7.39
11.94
9.40
15.28
17.43
–11.90
5.17
–5.39
3.58
1.11
8.42
4.88
3.29
I
I
7.27
6.32
I
I
I
I
15.52
12.72
10.81
11.87
84.53
–0.46
–0.24
–0.12
–0.26
–0.33
FIDELITY US SUSTAIN IDX
FIDELITY VALUE DISCV
FIDELITY VALUE FUND
FIDELITY VALUE FUND;K r
FIDELITY WORLDWIDE
LCCE
MLVE
MCCE
MCCE
GMLG
FIDELITY SAI INT VAL IDX r
FIDELITY SAI INTL INDEX r
FIDELITY SAI INTL SMA nr
FIDELITY SAI ITL LOW VOL r
FIDELITY SAI ITL MOM IDX r
ILCV
ILCC
IMLG
IMLC
ILCG
4240.8
6245.4
621.3
6789.6
662.1
9.33
13.59
11.53
10.93
12.94
6.90
10.70
11.55
8.86
11.18
18.98
18.24
15.84
13.84
21.02
8.39
4.13
–2.99
2.68
2.38
7.49
8.31
I
4.34
I
I
I
I
I
I
9.29
13.38
11.25
10.86
12.78
–0.03
–0.19
–0.30
–0.02
–0.14
FIDELITY SAI ITL QL IDX r
FIDELITY SAI S-M CAP 500 r
FIDELITY SAI US LC IDX r
FIDELITY SAI US LOW VOL r
FIDELITY SAI US MOMENTUM r
ILCG
308.1
SCGE 1579.7
SPSP 10749.6
LCCE 9463.0
LCCE
317.3
12.32
6.12
19.73
18.67
13.30
14.06
12.86
11.69
9.82
14.92
18.43
17.75
26.23
14.80
14.62
3.82
5.84
9.98
7.52
5.79
I
12.96
15.65
11.76
13.82
I
I
I
I
I
12.09
5.94
19.40
18.62
12.94
FIDELITY SAI US QUAL IDX r
FIDELITY SAI US VAL INDX r
FIDELITY SEL BANKING
FIDELITY SEL BIO TECH
FIDELITY SEL BRKG & IM
LCGE 13248.9
MLVE 1382.8
FS
427.9
H
4599.9
FS
794.9
19.36
10.79
25.06
17.83
134.74
12.09
9.73
26.58
14.88
19.60
29.62
12.58
8.46
10.08
27.75
10.86
12.24
9.45
–6.72
14.00
17.13
11.77
9.32
8.83
19.03
I
I
7.04
7.39
10.34
FIDELITY SEL CHEMICALS
FIDELITY SEL CNSMR DSC
FIDELITY SEL CNSMR STP
FIDELITY SEL CNST&HOUS
FIDELITY SEL COMM SERV
BM
CS
CG
CG
CS
645.4
524.2
918.8
670.6
1177.4
15.43
58.73
92.16
107.44
87.87
11.17
15.53
4.75
17.06
13.12
12.73
41.78
2.99
30.84
56.85
8.64
3.26
5.49
16.78
3.92
10.28
13.67
11.53
23.05
15.05
FIDELITY SEL DEFENSE
FIDELITY SEL ENERGY
FIDELITY SEL ENV&ALT ENG
FIDELITY SEL GOLD
FIDELITY SEL HEALTH
ID
NR
ID
AU
H
1613.7
2177.9
516.8
1052.5
7731.0
16.95
55.54
32.97
22.16
28.76
21.61
–8.20
12.43
11.74
8.24
16.21
0.93
26.29
–0.36
4.13
9.23
36.73
6.80
–8.25
0.41
FIDELITY SEL HEALTH CARE
FIDELITY SEL INDUSTRLS
FIDELITY SEL INSURANCE
FIDELITY SEL LEISURE
FIDELITY SEL MATERIALS
H
ID
FS
CS
BM
1578.5
517.1
468.1
658.8
529.1
133.22
34.21
76.67
18.37
96.90
6.02
14.81
8.56
14.02
4.17
1.51
23.12
12.98
30.12
7.31
FIDELITY SEL MD TCH & DV
FIDELITY SEL NAT RES
FIDELITY SEL PHARM
FIDELITY SEL RETAILING
FIDELITY SEL SEMICND
H
NR
GH
CS
TK
5772.5
618.6
863.4
2872.8
12176.2
61.96
40.70
23.61
18.76
24.25
8.21
–5.98
6.89
14.43
13.88
FIDELITY SEL SW & IT SVC
FIDELITY SEL TECHNLGY
FIDELITY SEL TRANSPORT
FIDELITY SEL UTILITIES
FIDELITY SEL WIRELESS
TK
TK
ID
UT
TL
11796.7
12637.4
584.8
1222.8
335.4
27.67
28.51
104.46
100.73
11.67
FIDELITY SERIES CANADA r
FIDELITY SM CAP DISC
FIDELITY SM CAP GR K6 r
FIDELITY SM CAP GRO
FIDELITY SM CAP STOCK
ILCG
SCCE
SCGE
SCGE
SCGE
5218.6
2595.5
2099.6
2676.7
1194.1
FIDELITY SM CAP VAL
FIDELITY SM CP GRO IDX
FIDELITY SM CP VAL IDX
FIDELITY SMALL CAP INDEX
FIDELITY SRS ALL-SCTR r
QTR
RETURN THROUGH 12/29
1YR
3 YRS
5 YRS
(Annualized)
10YRS
LATEST WK’S DATA
(as of Thursday)
CLOSE
WK’S
NAV
CHG
94.74
27.04
13.15
131.75
149.46
12.30
11.24
9.97
12.16
14.95
33.51
3.38
15.51
26.12
44.39
5.65
5.19
1.61
8.45
5.59
19.23
7.72
7.20
15.06
18.65
13.26
7.71
I
11.42
13.85
92.12
27.26
12.92
129.19
143.55
–2.90
+0.19
–0.21
–3.11
–6.71
2966.0
2814.2
7972.8
1144.5
2255.0
21.25
35.10
14.36
14.38
31.11
12.20
6.63
13.27
13.36
11.43
29.04
5.30
19.53
19.61
24.95
10.62
8.14
13.77
13.88
3.28
16.14
11.08
16.20
16.33
13.19
I
8.24
9.40
9.51
9.06
20.91
35.17
14.00
14.02
30.52
–0.38
+0.05
–0.48
–0.48
–0.69
FIDELITY ZERO EXT MKT IX
FIDELITY ZERO INTL INDEX
FIDELITY ZERO LRG CAP IX
FIDELITY ZERO TOT MKT IX
FIRST EAGLE GLOBAL;A
SCCE 1533.0
IMLC 3776.3
LCCE 7610.6
MLCE 17654.6
FX
13866.1
12.25
11.07
16.85
16.62
63.09
13.60
10.12
11.99
12.17
7.37
18.14
16.30
27.45
26.21
12.80
5.57
1.89
9.20
8.72
5.79
11.66
7.40
15.76
15.22
9.03
I
I
I
I
6.08
11.85
10.89
16.56
16.30
62.52
–0.55
–0.17
–0.34
–0.39
–0.67
–0.20
–0.24
–0.38
–0.04
–0.41
FIRST EAGLE GOLD;A
FIRST EAGLE OVSEAS;A
FIRST EAGLE US VALUE;A
FIRST EAGLE US VALUE;I r
FIRST TRUST MRGR ARBTR;I r
AU
IMLV
MLVE
MLVE
AED
596.6
1438.7
574.2
587.1
1795.0
24.05
24.24
19.03
19.49
10.63
12.06
7.46
7.75
7.77
1.31
7.02
10.42
14.42
14.71
3.30
–0.95
2.12
8.59
8.87
3.74
11.77
6.02
10.23
10.52
3.90
5.51
3.90
7.36
7.64
I
23.32
24.03
18.86
19.32
10.63
–0.86
–0.18
–0.23
–0.24
+0.00
19.05
10.75
24.83
17.97
130.99
–0.36
–0.07
–0.50
–0.09
–4.88
FMI COMMON STOCK;INV
FMI INTERNATIONL;INV
FMI LARGE CAP;INV
FPA CRESCENT;INST
FPA CRESCENT;SI r
SCCE
IMLC
MLVE
FX
FX
643.1
1127.9
975.0
7009.3
2695.7
34.13
33.90
14.94
38.63
38.65
12.04
6.27
13.13
7.52
7.54
24.87
21.81
21.08
20.27
20.33
15.35
7.72
7.07
7.95
8.01
15.17
7.92
10.84
11.10
I
9.64
6.16
9.11
7.13
I
33.22
33.51
14.65
38.03
38.05
–1.14
–0.43
–0.32
–0.71
–0.71
6.95
10.78
6.99
14.59
9.80
15.00
56.41
92.02
103.77
85.75
–0.52
–2.71
–0.06
–4.23
–2.74
FPA QUEENS RD SCV;INST r
FRANKLIN ALL CRFLO;A
FRANKLIN ALL CSV;A
FRANKLIN ALL GLBL AL;A
FRANKLIN ALL GRO;A
SCCE
MTAA
MTAC
FX
MTAG
561.6
770.1
745.0
2409.8
1038.2
36.89
21.40
13.22
14.01
17.92
13.15
12.67
8.50
9.44
10.14
16.24
25.36
11.37
12.92
17.59
9.27
4.73
0.71
3.62
4.28
I
11.31
4.81
5.88
9.63
I
8.00
3.60
3.88
6.77
36.01
20.94
13.05
13.83
17.63
–1.25
–0.52
–0.19
–0.20
–0.32
9.91
13.64
13.36
5.83
10.61
9.70
2.56
9.07
3.33
10.81
16.57
55.85
32.08
21.33
28.82
–0.37
+0.23
–1.04
–0.97
+0.03
FRANKLIN ALL MODT;A
FRANKLIN CUST DYNA;A
FRANKLIN CUST DYNA;ADV r
FRANKLIN CUST DYNA;C
FRANKLIN CUST DYNA;R6 r
MTAM
MLGE
MLGE
MLGE
MLGE
1355.4
9455.6
2721.1
825.7
8013.3
14.39
133.73
139.73
106.74
141.82
9.21
14.88
14.95
14.65
14.97
14.37
44.42
44.78
43.35
44.92
2.53
–0.99
–0.74
–1.73
–0.64
7.29
15.85
16.14
14.99
16.26
5.25
13.41
13.69
12.56
13.84
14.19
128.37
134.13
102.45
136.14
–0.23
–6.00
–6.26
–4.80
–6.35
7.14
8.89
16.33
10.27
8.40
11.81
13.05
15.35
15.37
11.76
12.49
8.45
10.89
11.29
5.56
135.49
33.10
77.64
17.92
95.05
+2.41
–1.28
+1.00
–0.47
–2.45
FRANKLIN CUST GRO;A
FRANKLIN CUST GRO;ADV r
FRANKLIN CUST GRO;C
FRANKLIN CUST GRO;R r
FRANKLIN CUST GRO;R6 r
MLGE 10746.4
MLGE 3004.1
MLGE
343.0
MLGE
270.5
MLGE 2419.0
122.64
123.71
103.39
121.12
123.59
13.35
13.43
13.14
13.28
13.45
27.66
27.99
26.72
27.35
28.09
5.22
5.48
4.44
4.96
5.57
15.00
15.29
14.14
14.72
15.39
12.08
12.36
11.25
11.80
12.50
119.35
120.39
100.61
117.86
120.27
–3.63
–3.66
–3.07
–3.59
–3.65
0.62
6.40
12.52
26.85
78.14
–1.99
27.88
8.31
1.88
22.50
9.67
14.54
13.19
14.03
34.21
13.16
2.94
9.33
13.40
25.53
60.70
40.88
24.37
18.16
22.83
–1.41
+0.07
+0.75
–0.66
–1.60
FRANKLIN CUST INC;A1 n
FRANKLIN CUST INC;ADV r
FRANKLIN CUST INC;C
FRANKLIN CUST INC;R r
FRANKLIN CUST INC;R6 r
FX
FX
FX
FX
FX
29866.1
13110.3
4772.3
306.8
1706.2
2.33
2.31
2.37
2.27
2.32
7.48
7.58
7.20
7.08
7.56
8.63
8.83
7.90
7.95
8.84
6.52
6.72
6.00
6.11
6.90
7.70
7.90
7.10
7.27
8.03
5.20
5.34
4.63
4.78
5.44
2.30
2.28
2.35
2.25
2.29
–0.03
–0.03
–0.03
–0.03
–0.03
19.42
12.91
9.86
10.39
16.71
51.56
59.83
19.24
–1.17
25.93
8.29
7.16
11.02
6.96
0.64
20.72
24.93
12.73
8.59
13.71
17.17
18.66
10.54
9.10
9.37
26.47
27.23
102.05
101.76
11.44
–1.38
–1.43
–3.24
+0.86
–0.28
FRANKLIN CUST UTIL;A1 n
FRANKLIN CUST UTIL;ADV r
FRANKLIN GLD&PR MT;A
FRANKLIN INTL GRO;A
FRANKLIN INV CV SC;A n
UT
UT
AU
IMLG
CV
2849.9
1163.3
651.8
397.4
942.0
19.27
19.48
16.65
16.41
20.72
8.15
8.22
15.21
16.55
7.16
–4.84
–4.69
2.06
15.00
9.97
4.51
4.67
–9.08
–7.53
–0.20
7.25
7.41
10.34
7.49
12.48
8.21
8.37
3.79
4.93
9.63
19.53
19.74
15.88
15.73
20.43
+0.23
+0.24
–0.88
–0.69
–0.39
14.69
26.60
15.07
28.16
17.21
10.46
14.53
13.74
13.55
14.99
15.93
21.32
19.62
19.02
19.70
11.57
11.20
–0.24
–0.59
3.69
13.14
13.34
13.20
12.81
10.43
I
7.72
I
10.61
7.44
14.54
25.78
14.51
27.11
16.61
–0.13
–1.05
–0.74
–1.38
–0.80
FRANKLIN INV CV SC;ADV nr
FRANKLIN INV EQ INC;A
FRANKLIN INV MGD INC;A
FRANKLIN MA CSV GR;A
FRANKLIN MA GROWTH;A
CV
EIEI
MTAM
MTAM
MTAA
1526.8
2947.9
2986.7
278.4
775.1
20.71
29.34
12.44
13.60
15.91
7.17
7.86
8.31
9.19
9.96
10.25
9.04
7.63
13.02
17.09
0.04
8.35
4.79
2.45
5.61
12.75
11.01
7.41
6.53
9.22
9.90
8.46
5.89
4.95
6.08
20.42
29.25
12.35
13.41
15.67
–0.40
–0.14
–0.11
–0.22
–0.28
SCCE 2689.6
SCGE
477.6
SCCE
896.2
SCCE 22271.9
MLCE 3158.7
19.78
24.36
24.08
25.04
10.77
14.21
12.76
15.23
14.05
11.90
17.74
18.90
14.73
17.12
30.59
12.20
–3.36
7.95
2.32
10.47
13.67
I
I
10.07
17.63
8.70
I
I
7.32
12.36
19.24
23.44
23.35
24.19
10.58
–0.75
–1.29
–1.10
–1.24
–0.23
FRANKLIN MA MDT GR;A
FRANKLIN MGD RS DV;A
FRANKLIN MGD RS DV;ADV r
FRANKLIN MGD RS DV;C
FRANKLIN MGD RS DV;R6 r
MTAG
465.5
LCCE 17844.4
LCCE 4074.3
LCCE
937.3
LCCE 3093.5
15.46
88.45
88.32
86.49
88.30
9.72
9.31
9.38
9.10
9.40
15.80
12.16
12.43
11.32
12.51
4.50
8.29
8.56
7.48
8.63
8.19
13.91
14.19
13.06
14.28
5.77
10.22
10.49
9.39
10.61
15.23
87.22
87.10
85.28
87.08
–0.26
–1.27
–1.27
–1.26
–1.26
FIDELITY SRS BLUECHP G
FIDELITY SRS COMM STR r
FIDELITY SRS EM OPPTY r
FIDELITY SRS EMERG MKTS r
FIDELITY SRS GL EX US IX r
LCGE 9337.1
CMG 1637.8
EM 22844.7
EM
5627.4
ILCC 42213.9
15.62
92.63
17.33
8.46
13.85
15.57
–4.66
9.00
9.00
9.95
57.42
–8.25
14.23
12.10
15.56
6.63
10.28
–6.23
–6.73
1.61
21.40
6.89
5.79
0.95
7.12
16.66
–1.53
3.76
I
3.85
15.12
92.49
16.97
8.29
13.62
–0.59
–0.86
–0.33
–0.16
–0.21
FRANKLIN MUT BEACON;A
FRANKLIN MUT BEACON;Z r
FRANKLIN MUT GL DISC;A
FRANKLIN MUT GL DISC;Z r
FRANKLIN MUT ITL VAL;A
GMLV
GMLV
GMLV
GMLV
ILCV
805.9
2050.2
5030.5
3040.5
277.3
15.38
15.59
29.64
30.54
23.19
8.97
9.03
9.46
9.50
9.20
15.19
15.48
20.27
20.58
16.45
5.72
5.98
10.91
11.19
10.26
8.86
9.13
10.11
10.39
8.86
6.53
6.81
6.04
6.32
3.91
15.36
15.58
29.62
30.51
22.97
–0.03
–0.02
–0.04
–0.05
–0.17
FIDELITY SRS GRO CO r
FIDELITY SRS INTL GRO r
FIDELITY SRS INTL SC r
FIDELITY SRS INTL VAL r
FIDELITY SRS LRG CAP VAL r
LCGE 14446.5
ILCG 14800.3
ISMG 4141.9
ILCV 14536.7
MLVE 6353.0
19.47
17.13
16.96
11.67
14.72
14.42
14.73
15.18
9.82
9.57
45.91
21.73
18.36
20.33
11.59
7.09
3.06
1.08
9.12
8.91
23.84
11.97
9.63
10.31
10.96
17.55
7.11
6.84
4.23
8.40
18.91
16.69
16.56
11.53
14.62
–0.66
–0.45
–0.43
–0.13
–0.14
FRANKLIN MUT QUEST;A
FRANKLIN MUT QUEST;Z r
FRANKLIN MUT SHARES;A
FRANKLIN MUT SHARES;R6 r
FRANKLIN MUT SHARES;Z r
FX
FX
MLVE
MLVE
MLVE
570.4
1971.9
2624.8
288.6
3756.9
13.44
13.69
24.16
24.51
24.53
8.89
9.08
9.79
9.91
9.85
10.26
10.51
13.64
14.00
13.93
4.43
4.70
7.83
8.15
8.10
4.57
4.84
8.00
8.34
8.27
3.39
3.66
5.56
5.92
5.83
13.44
13.68
24.13
24.48
24.50
–0.02
–0.02
–0.08
–0.08
–0.09
FIDELITY SRS OVERSEAS nr
FIDELITY SRS RE INCOME
FIDELITY SRS SC DISCV r
FIDELITY SRS SM CAP OPP
FIDELITY SRS TOT MK IX nr
ILCG 14198.7
RE
251.1
SCCE 1285.0
SCGE 5454.9
MLCE 60685.6
12.97
9.49
11.68
13.90
15.69
12.95
4.35
14.22
13.29
12.14
21.48
8.29
21.77
20.38
26.14
3.69
3.41
11.66
6.93
8.44
I
5.23
14.69
13.20
I
I
5.53
8.58
8.46
I
12.68
9.45
11.32
13.45
15.39
–0.29
–0.06
–0.46
–0.60
–0.37
FRANKLIN STR BD;A n
FRANKLIN STR GR OP;A
FRANKLIN STR GR OP;ADV r
FRANKLIN STR GR OP;R6 r
FRANKLIN STR NT RE;A
H
MLGE
MLGE
MLGE
GNR
597.5
3184.2
265.6
370.7
269.7
127.06
42.80
48.85
50.02
28.83
17.33
15.39
15.45
15.48
–0.49
18.40
39.80
40.15
40.27
3.28
–5.23
1.12
1.38
1.47
22.36
8.31
15.00
15.29
15.40
9.57
5.74
10.99
11.28
11.43
–0.65
128.43
41.27
47.11
48.24
28.65
+0.42
–1.75
–1.99
–2.04
–0.30
FIDELITY STK SEL AC
FIDELITY STK SEL LCV;LCV
FIDELITY STK SEL SC;S
FIDELITY STRAT DIV&INC
FIDELITY STRAT RL RTN
MLCE
MLVE
SCGE
MTAG
RR
69.20
25.72
33.39
15.88
8.33
12.43
10.07
13.16
8.18
3.29
26.98
14.46
19.46
9.43
4.59
7.94
10.79
6.88
5.50
5.40
15.74
12.03
14.14
9.86
6.06
11.22
8.59
8.96
8.03
3.19
67.72
25.57
32.30
15.78
8.29
–1.74
–0.21
–1.46
–0.15
–0.07
FRANKLIN STR S/MCG;A
FRANKLIN STR S/MCG;ADV r
FRANKLIN STR SCG;A
FRANKLIN STR SCG;ADV r
FRANKLIN STR SCG;R6 r
MCGE
MCGE
SCGE
SCGE
SCGE
2697.5
430.2
759.5
355.8
1305.2
35.12
41.64
20.59
23.51
24.20
16.14
16.22
17.59
17.67
17.70
27.20
27.50
30.65
31.05
31.24
–2.51
–2.27
–3.37
–3.11
–2.98
13.76
14.04
11.11
11.39
11.57
9.28
9.55
7.85
8.13
8.32
33.82
40.10
19.69
22.47
23.13
–1.48
–1.76
–1.16
–1.34
–1.38
1635.0
447.2
1543.4
2947.0
260.7
January 8, 2024
BARRON’S
•
L15
Funds Quarterly
Stock Funds
s Copyright Lipper
For personal non-commercial use only. Do not edit or alter. Reproductions not permitted.
To reprint or license content, please contact Barron's reprints department at 800-843-0008 or www.djreprints.com
NAME
OBJ
LATEST
REPORTED
NAV
ASSETS
($ SHR)
($MIL)
12/29/23
QTR
RETURN THROUGH 12/29
1YR
3 YRS
5 YRS
(Annualized)
10YRS
LATEST WK’S DATA
(as of Thursday)
CLOSE
WK’S
NAV
CHG
NAME
Data provided by
OBJ
LATEST
REPORTED
NAV
ASSETS
($ SHR)
($MIL)
12/29/23
QTR
RETURN THROUGH 12/29
1YR
3 YRS
5 YRS
(Annualized)
10YRS
LATEST WK’S DATA
(as of Thursday)
CLOSE
WK’S
NAV
CHG
FRANKLIN VAL MUS MCV;A
FRANKLIN VAL SCV;A n
FRANKLIN VAL SCV;ADV nr
FROST GRO EQTY;INST r
GABELLI ASSET;AAA
MCVE
SCVE
SCVE
LCGE
MLVE
653.0
1141.4
1272.3
259.8
1212.9
33.99
53.76
57.71
14.63
48.51
10.77
12.10
12.19
14.25
8.90
9.03
12.89
13.16
45.24
10.29
9.09
8.35
8.62
7.54
5.44
9.53
11.06
11.34
17.11
9.81
5.48
6.90
7.18
13.61
6.91
33.45
52.01
55.83
14.26
47.62
–0.67
–2.36
–2.53
–0.41
–1.02
HARTFD HEALTHCARE;A
HARTFD HEALTHCARE;I r
HARTFD INTL OPPTY;A
HARTFD INTL OPPTY;I r
HARTFD INTL OPPTY;R5 r
GH
GH
ILCG
ILCG
ILCG
680.2
258.4
410.1
375.5
297.7
36.69
40.03
17.04
16.90
17.91
8.42
8.48
9.91
9.99
9.97
3.79
4.06
11.54
11.85
11.86
0.25
0.51
–0.74
–0.43
–0.44
10.48
10.78
8.13
8.46
8.46
9.72
10.02
3.76
4.09
4.08
37.07
40.44
16.71
16.57
17.57
+0.32
+0.35
–0.32
–0.32
–0.33
GABELLI ASSET;I r
GABELLI EQ SC GRO;AAA
GABELLI EQ SC GRO;I r
GABELLI GROWTH;AAA
GABELLI INV ABC;AAA
GABELLI UTILITIES;A
GABELLI UTILITIES;I r
GALLERY MNDRN INTL VE
GATEWAY GATEWAY FD;A
GEORGE PUTNAM BAL;A
MLVE
SCCE
SCCE
LCGE
AED
UT
UT
ILCV
EMN
MTAM
451.2
980.2
573.3
675.3
392.8
819.1
313.1
802.5
779.4
1274.9
48.30
41.83
43.78
87.01
10.43
5.49
5.93
14.57
40.42
22.94
8.96
13.47
13.55
14.03
2.76
8.83
8.67
9.10
4.55
10.19
10.57
21.34
21.65
45.39
6.83
–5.50
–5.31
19.82
14.43
19.92
5.71
9.99
10.26
2.77
2.99
1.63
1.87
5.80
3.83
4.72
10.09
12.95
13.23
15.17
3.33
3.78
4.03
5.98
5.82
10.47
7.18
8.03
8.30
12.23
2.56
4.14
4.40
3.36
4.47
8.01
47.41
40.56
42.45
84.71
10.44
5.53
5.97
14.47
40.19
22.61
–1.01
–1.53
–1.61
–2.52
+0.00
+0.02
+0.02
–0.07
–0.24
–0.38
HARTFD INTL OPPTY;Y r
HARTFD INTL VALUE;I r
HARTFD INTL VALUE;Y r
HARTFD MIDCAP VAL;A
HARTFD MIDCAP;A
HARTFD MIDCAP;I r
HARTFD MIDCAP;Y r
HARTFD MODT ALLOC;A
HARTFD MULT-ASSET INC;A
HARTFD SCHR EM E;A
ILCG
IMLV
IMLV
MCCE
MCGE
MCGE
MCGE
MTAM
MTAM
EM
714.0
2077.8
906.0
422.2
2228.7
1149.1
330.2
277.5
477.4
986.0
18.03
17.64
18.10
15.87
25.25
26.89
34.24
11.70
18.72
15.68
9.95
8.30
8.36
11.69
12.35
12.44
12.43
9.16
7.42
8.15
11.83
19.83
19.82
15.87
14.39
14.74
14.69
12.56
10.24
8.60
–0.43
11.60
11.63
10.85
–1.75
–1.51
–1.47
1.60
1.34
–7.32
8.48
9.09
9.13
12.19
9.35
9.62
9.68
6.61
4.91
3.63
4.14
5.74
5.78
7.37
8.40
8.66
8.76
4.27
4.79
2.60
17.69
17.44
17.89
15.56
24.44
26.03
33.15
11.54
18.59
15.29
–0.33
–0.17
–0.18
–0.42
–1.02
–1.08
–1.37
–0.17
–0.13
–0.36
GEORGE PUTNAM BAL;Y r
GLENMEDE SC EQTY;ADV n
GMO INTL EQUITY;III r
GMO INTL EQUITY;IV r
GMO QUALITY;III r
GMO QUALITY;IV r
GMO QUALITY;VI r
GOLDMAN EMG MKTS;I r
GOLDMAN EQUITY INC;A
GOLDMAN GRO STR;A
MTAM
SCCE
IMLV
IMLV
LCCE
LCCE
LCCE
EM
LCVE
MTAG
270.4
469.6
350.5
563.4
2903.7
756.8
2660.7
1924.2
301.1
325.3
23.05
31.40
22.90
22.86
28.73
28.82
28.73
21.43
43.16
17.87
10.21
13.16
8.93
8.97
11.85
11.84
11.87
6.29
9.52
8.17
20.17
17.02
20.49
20.56
30.01
30.06
30.13
6.65
8.13
15.74
4.96
10.45
6.57
6.63
11.63
11.68
11.74
–10.04
7.99
3.78
10.75
13.55
10.12
10.19
16.76
16.82
16.87
3.75
10.23
9.27
8.28
8.06
3.80
3.87
13.43
13.48
13.54
3.60
7.50
6.21
22.72
30.40
22.78
22.74
28.40
28.49
28.40
20.97
42.99
17.59
–0.39
–1.36
–0.05
–0.05
–0.38
–0.38
–0.37
–0.41
–0.25
–0.31
HARTFD SCHR EM E;I r
HARTFD SCHR INTL STK;A
HARTFD SCHR INTL STK;I r
HARTFD SCHR US MC O;I r
HARTFD SMALL CO;A
HARTFORD BAL HLS;IA
HARTFORD CAP APP HLS;IA
HARTFORD CAP APP HLS;IB
HARTFORD DIV&GRO HLS;IA
HARTFORD DIV&GRO HLS;IB
EM
ILCG
ILCG
MCCE
SCGE
MTAG
MLCE
MLCE
EIEI
EIEI
1882.9
306.2
2923.1
515.3
317.0
1513.0
3218.8
371.5
3082.6
378.7
15.62
17.24
16.65
18.22
18.08
28.76
46.05
44.87
22.63
22.42
8.20
11.61
11.74
10.07
12.37
9.47
12.01
11.95
10.25
10.19
8.79
16.69
17.01
12.68
16.05
14.78
20.00
19.70
14.18
13.89
–7.08
1.64
1.93
7.50
–6.97
5.94
5.27
5.00
11.13
10.86
3.90
10.30
10.61
11.67
11.06
10.26
13.30
13.02
13.72
13.44
2.85
5.48
5.76
9.10
7.20
7.61
9.27
9.00
10.58
10.31
15.23
16.92
16.34
17.81
17.38
28.41
45.27
44.10
22.47
22.26
–0.36
–0.31
–0.30
–0.48
–0.90
–0.39
–0.90
–0.88
–0.20
–0.20
GOLDMAN INC BUILDER;A
GOLDMAN INTL EQ ESG;INST r
GOLDMAN ITL E INS;INST nr
GOLDMAN LC GRO INS;INST r
GOLDMAN LRG CP CORE;A
GOLDMAN MID CAP GRO;A
GOLDMAN MID CAP GRO;INST r
GOLDMAN MID CAP VAL;A
GOLDMAN MID CAP VAL;I r
GOLDMAN SM CAP VAL;I nr
MTAM
ILCG
IMLC
MLGE
LCCE
MLGE
MLGE
MCCE
MCCE
SCCE
604.2
601.7
726.1
262.8
857.9
255.7
271.3
439.0
318.9
549.8
24.23
27.34
13.86
27.76
29.84
11.68
19.12
34.31
34.91
44.85
8.70
9.27
9.85
13.27
12.24
14.51
14.56
13.06
13.16
13.35
10.43
15.83
20.83
37.45
26.49
18.82
19.20
11.45
11.85
11.32
3.35
3.71
4.73
7.84
8.09
–0.99
–0.69
9.11
9.50
6.34
7.61
11.99
7.98
16.53
15.45
13.46
13.82
13.11
13.52
8.61
4.92
5.15
5.10
13.34
11.99
9.11
9.49
7.77
8.19
6.33
24.01
26.82
13.71
27.04
29.26
11.26
18.43
33.70
34.29
43.41
–0.24
–0.50
–0.12
–0.83
–0.68
–0.49
–0.81
–0.80
–0.81
–2.02
HARTFORD HLS SC GRO;IA n
HARTFORD INTL OPP HLS;IA
HARTFORD MIDCAP HLS;IA
HARTFORD SM CO HLS;IA n
HARTFORD STOCK HLS;IA
HARTFORD DISC EQ HLS;IA
HARTFORD DISC EQ HLS;IB
HEARTLAND MDCP VAL;INST r
HEARTLAND VALUE;INV
HENNESSY CRNST MDCP;INST r
SCGE
ILCG
MCGE
SCGE
LCCE
LCCE
LCCE
MCVE
SCCE
SCCE
576.3
792.6
1078.9
392.1
1236.9
2375.7
283.7
384.8
624.4
395.4
25.71
15.13
27.35
15.83
96.68
18.86
18.52
13.85
44.99
20.80
11.78
10.04
12.52
12.51
10.27
11.68
11.57
7.58
11.68
9.09
18.42
11.72
14.87
16.74
7.72
21.24
20.95
13.72
17.13
31.27
–4.13
–0.47
–1.50
–6.45
8.49
7.24
6.96
12.39
8.69
20.05
9.78
8.47
9.70
11.77
13.44
14.32
14.03
13.82
11.37
19.98
7.17
4.24
8.77
7.79
10.69
11.84
11.56
I
5.61
11.23
24.62
14.84
26.48
15.22
96.22
18.60
18.27
13.63
43.86
20.22
–1.38
–0.29
–1.08
–0.78
–0.41
–0.29
–0.29
–0.29
–1.60
–0.75
GOLDMAN TECH OPPTY;A
GOLDMAN US EQTY INS;A
GOLDMAN US EQTY INS;INST r
GOTHAM ABSOLUTE RTN;INST r
GOTHAM INDEX PLUS;INST r
TK
MLCE
MLCE
ABR
MLCE
368.5
306.2
274.0
551.1
577.7
22.39
56.35
58.95
19.47
22.60
18.59
11.62
11.74
6.44
10.05
57.79
23.11
23.56
17.73
26.42
5.13
8.50
8.90
12.36
14.05
18.43
13.55
13.97
8.21
13.59
15.25
10.60
11.02
5.10
I
21.49
55.36
57.92
19.40
22.29
–1.04
–1.17
–1.21
–0.07
–0.34
GPS LG CAP CORE;SVC
GREEN CENTURY BAL;INV
GREEN CENTURY EQUITY;INS r
GREEN CENTURY EQUITY;INV
GUGGENHEIM SMC VAL;A
MLCE
MTAG
LCCE
LCCE
SCVE
683.6
273.5
251.9
329.6
289.7
27.89
33.33
74.84
75.29
37.55
12.37
9.13
12.12
12.03
9.69
25.29
11.78
28.10
27.70
9.31
8.52
2.93
8.75
8.43
9.85
14.88
8.86
15.63
15.29
11.72
10.52
6.52
I
11.43
7.29
27.30
32.86
73.39
73.83
36.83
–0.71
–0.52
–1.62
–1.64
–1.01
GUIDESTONE AGG ALL;INV
GUIDESTONE BAL ALL;INV
GUIDESTONE CSV ALL;INV
GUIDESTONE EQTY IDX;INST r
GUIDESTONE EQTY IDX;INV
MTAA
MTAM
MTAC
SPSP
SPSP
742.6
944.0
312.6
2820.4
938.4
11.50
11.09
10.79
48.63
48.65
10.68
8.22
5.62
11.84
11.76
20.66
12.32
8.80
26.51
26.16
3.69
0.46
0.49
9.68
9.39
10.31
5.65
3.74
15.48
15.17
7.05
4.17
2.78
11.90
11.62
11.28
10.94
10.70
47.80
47.82
–0.24
–0.16
–0.09
–0.96
–0.96
HENNESSY CRNST MDCP;INV
HENNESSY CRNST VAL;INV
HENNESSY FOCUS;INV
HENNESSY GAS UTILITY;INV
HENNESSY JAPAN;INST r
HOMESTEAD VALUE
HOOD RIVER SM CP GR;INST r
HOTCHKIS MID CAP VAL;I r
HOTCHKIS SM CAP VAL;I nr
HOTCHKIS VALUE OPPS;I r
HUSSMAN INV STRAT GRO
INDEP FRANCH PRTNRS USEQ r
INVESCO ACTIVE ALLOC;A
INVESCO BR ALLOC;A
INVESCO BR ALLOC;Y r
SCCE
LCVE
MLCE
UT
JA
LCVE
SCGE
MCVE
SCCE
MLVE
LSE
MLCE
MTAG
AGM
AGM
353.5
264.8
388.5
397.0
284.0
949.1
880.9
318.7
725.6
444.0
370.1
1893.3
1589.3
726.3
521.3
19.75
19.29
43.29
23.07
38.57
48.96
56.81
53.50
76.34
36.70
6.07
18.43
13.08
8.54
8.77
8.92
5.76
12.34
7.29
10.02
10.63
15.58
9.25
10.95
12.61
–4.61
7.26
9.47
5.20
5.22
30.78
5.81
20.85
0.27
23.35
12.86
21.52
19.86
18.83
26.66
–11.61
20.95
13.52
5.96
6.34
19.59
13.41
6.04
8.35
–5.82
10.08
2.70
19.25
18.39
16.20
1.14
8.36
1.42
–0.54
–0.28
19.55
10.53
11.15
6.86
4.52
12.88
16.66
13.98
14.77
15.72
–0.78
15.40
7.77
4.26
4.52
10.85
7.85
8.21
5.86
7.72
10.20
11.68
7.11
8.33
10.33
–3.82
11.52
5.37
3.45
3.71
19.21
19.47
41.75
23.32
37.48
48.75
54.43
52.16
74.11
36.10
6.14
18.10
12.84
8.42
8.65
–0.71
+0.17
–1.73
+0.20
–0.91
–0.26
–3.18
–1.73
–2.94
–0.71
–0.10
–0.33
–0.28
–0.19
–0.19
GUIDESTONE GR ALLOC;INV
GUIDESTONE GRO EQTY;INST r
GUIDESTONE GRO EQTY;INV
GUIDESTONE INTL EQ;INST r
GUIDESTONE INTL EQ;INV
GUIDESTONE SC EQTY;INST r
GUIDESTONE SC EQTY;INV
GUIDESTONE VAL EQTY;INST r
GUIDESTONE VAL EQTY;INV
HARBOR CAP APPREC;INST r
HARBOR CAP APPREC;INV
HARBOR INTERNATL;INST r
HARBOR INTERNATL;INV
HARBOR LG CAP VALUE;INST r
HARBOR SM CAP GRO;INST nr
MTAG
758.8
LCGE
759.4
LCGE
749.8
ILCC
788.2
ILCC
339.2
SCCE
461.1
SCCE
280.1
MLVE
616.5
MLVE
365.3
LCGE 16166.3
LCGE
945.9
IMLC 2572.8
IMLC
267.4
MLCE
689.0
SCGE
763.8
11.68
23.76
23.19
13.91
13.89
17.09
16.90
17.97
17.95
96.49
88.87
44.11
43.74
21.55
13.23
9.58
14.55
14.46
10.03
9.85
12.91
12.78
9.25
9.17
16.30
16.19
9.63
9.55
14.23
12.83
16.57
42.22
41.81
18.39
18.03
14.90
14.57
10.83
10.55
53.74
53.20
16.12
15.73
19.67
22.20
2.15
3.11
2.85
2.91
2.62
4.86
4.57
9.12
8.84
3.45
3.08
3.11
2.74
8.35
–0.03
8.06
14.94
14.64
7.73
7.42
11.65
11.34
11.48
11.18
17.91
17.48
8.33
7.94
14.09
14.50
5.53
11.97
11.70
4.31
4.03
7.16
6.84
8.03
7.74
14.04
13.62
3.06
2.68
11.11
9.53
11.49
23.04
22.48
13.69
13.68
16.48
16.30
17.87
17.85
93.37
85.99
43.34
42.96
21.21
12.77
–0.21
–0.82
–0.81
–0.19
–0.18
–0.82
–0.81
–0.14
–0.14
–3.54
–3.26
–0.72
–0.73
–0.39
–0.59
INVESCO CAP APPR;A
INVESCO CHARTER;A
INVESCO COMSTOCK SLCT;A
INVESCO COMSTOCK;A
INVESCO DEV MKT;A n
INVESCO DEV MKT;Y nr
INVESCO DISCOVERY;A n
INVESCO DISCOVERY;Y nr
INVESCO DISCVRY MC G;A
INVESCO DIV INC;A
LCGE 4192.5
LCCE 2922.6
LCVE
569.2
LCVE 6296.3
EM
2365.6
EM 11413.5
SCGE 1403.8
SCGE 1498.1
MCGE 3358.5
EIEI
2751.7
64.30
16.98
32.38
27.32
39.35
38.62
83.76
103.53
23.53
24.62
13.83
10.13
6.62
8.12
6.96
6.99
10.87
10.93
10.83
9.07
35.51
23.04
12.09
12.24
11.17
11.40
17.02
17.30
12.96
7.02
4.54
7.51
14.65
14.69
–8.36
–8.14
–2.39
–2.16
–2.56
8.61
16.20
12.72
13.88
13.41
2.26
2.52
13.80
14.06
12.49
8.80
11.32
7.55
8.94
8.90
1.48
1.73
9.46
9.72
9.41
7.88
62.28
16.72
32.44
27.27
38.47
37.76
79.98
98.85
22.60
24.54
–2.22
–0.31
+0.02
–0.11
–0.83
–0.82
–4.82
–5.96
–1.07
–0.11
HARBOR SM CAP VAL;INST r
HARDING LOEVNER EM;ADV n
HARDING LOEVNER IE;I r
HARTFD BAL INCOME;A
HARTFD BAL INCOME;C
SCCE 1481.2
EM
1006.7
ILCG 11960.4
MTAM 4299.3
MTAM 1575.8
38.57
40.96
25.95
14.30
14.05
11.49
6.38
12.14
8.25
8.04
15.07
6.76
15.06
7.69
6.82
6.08
–9.31
–0.14
2.47
1.69
11.74
1.26
8.46
6.60
5.79
8.61
1.19
5.51
5.67
4.88
37.29
39.68
25.31
14.19
13.94
–1.67
–1.25
–0.63
–0.13
–0.13
INVESCO DVSFD DIV;A
INVESCO DVSFD DIV;INV
INVESCO ENERGY;A
INVESCO EQ & INCOME;A
INVESCO EQ-WTD 500;A
INVESCO EQ-WTD 500;C
INVESCO EQ-WTD 500;Y r
INVESCO EQV ASIA PC E;A
INVESCO EQV E MAC;A
INVESCO EQV E MAC;R6 nr
EIEI
EIEI
NR
MTAG
MLVE
MLVE
MLVE
XJ
EM
EM
3786.4
1520.6
299.4
9840.3
2944.3
516.9
2167.3
305.4
426.2
488.8
17.62
17.61
27.98
10.08
69.07
64.70
70.16
27.09
33.33
33.13
9.72
9.74
–5.04
8.19
11.74
11.53
11.80
4.10
4.99
5.12
8.76
8.86
0.26
9.99
13.33
12.47
13.61
0.87
8.81
9.23
8.37
8.45
33.73
6.21
8.75
7.95
9.03
–5.46
–5.91
–5.55
9.76
9.86
11.18
9.61
13.20
12.36
13.48
4.80
4.87
5.27
7.55
7.63
–1.83
6.84
9.82
9.02
10.09
4.46
2.38
2.79
17.51
17.51
28.29
10.02
67.95
63.65
69.03
26.32
32.65
32.45
–0.13
–0.12
+0.29
–0.08
–1.38
–1.30
–1.39
–0.71
–0.65
–0.64
HARTFD BAL INCOME;I r
HARTFD CAP APPR;A
HARTFD CAP APPR;I r
HARTFD CHECKS & BAL;A
HARTFD CORE EQUITY;A
MTAM
MLCE
MLCE
MTAG
LCCE
3910.5
4440.0
499.4
1224.2
1637.7
14.30
39.01
39.29
9.38
45.55
8.31
11.89
11.94
9.71
11.65
7.95
18.95
19.30
13.00
21.15
2.72
4.01
4.29
3.75
6.85
6.86
12.13
12.44
9.09
13.96
5.93
8.76
9.07
7.07
11.52
14.19
38.27
38.54
9.27
44.93
–0.13
–0.86
–0.87
–0.13
–0.71
HARTFD CORE EQUITY;C
HARTFD CORE EQUITY;Y r
HARTFD DIV & GRO;A
HARTFD DIV & GRO;I r
HARTFD DIV & GRO;Y r
HARTFD EQUITY INC;A
HARTFD EQUITY INC;I r
HARTFD GRO ALLOC;A
HARTFD GROWTH OPPS;A
HARTFD GROWTH OPPS;I r
LCCE
LCCE
EIEI
EIEI
EIEI
EIEI
EIEI
MTAG
MLGE
MLGE
397.3
454.2
4759.3
3908.6
504.8
1871.3
1540.7
480.7
2445.3
990.8
40.91
46.29
32.75
32.53
33.86
19.98
19.79
13.10
42.03
46.68
11.42
11.71
10.13
10.19
10.21
8.18
8.20
10.04
15.53
15.57
20.25
21.44
13.81
14.07
14.10
7.03
7.23
14.99
40.66
40.98
6.05
7.12
10.71
10.98
11.01
9.99
10.24
3.03
–1.65
–1.41
13.11
14.27
13.30
13.60
13.64
11.82
12.08
8.57
14.82
15.12
10.69
11.86
10.15
10.42
10.50
8.93
9.19
5.50
12.40
12.68
40.35
45.66
32.52
32.30
33.62
19.94
19.76
12.90
40.63
45.13
–0.65
–0.73
–0.29
–0.29
–0.30
–0.07
–0.07
–0.22
–1.64
–1.82
INVESCO EQV E MAC;Y r
INVESCO EQV INTL EQ;A
INVESCO EQV INTL EQ;R6 r
INVESCO EQV INTL EQ;Y r
INVESCO FDMTL ALT;A
INVESCO GL CORE EQ;A
INVESCO GLB ALLOC;A
INVESCO GLOBAL FD;A
INVESCO GLOBAL FD;Y r
INVESCO GLOBAL OPP;A
EM
ILCG
ILCG
ILCG
AMS
GLCC
AGM
GLCG
GLCG
GSME
568.6
1110.5
1178.9
374.8
274.7
538.9
917.6
5834.6
1320.9
1958.5
33.29
22.82
23.43
22.92
23.93
14.34
18.38
89.79
91.19
50.81
5.08
12.73
12.84
12.86
1.74
13.17
9.32
14.39
14.46
16.24
9.07
17.53
18.03
17.87
3.55
21.79
15.64
34.03
34.34
17.34
–5.67
0.35
0.75
0.60
–0.54
3.11
1.69
1.61
1.85
–11.81
5.13
7.95
8.40
8.22
1.25
8.98
6.96
11.99
12.25
4.11
2.64
3.91
4.35
4.18
1.31
5.35
4.33
8.22
8.47
6.41
32.61
22.16
22.75
22.25
23.93
14.04
18.07
87.14
88.49
47.99
–0.64
–0.66
–0.67
–0.66
+0.00
–0.33
–0.36
–2.96
–3.01
–3.05
INVESCO GLOBAL OPP;Y r
INVESCO GOLD & SM;A
INVESCO GR & INCOME;A
INVESCO HEALTH CARE;A
INVESCO HEALTH CARE;INV
GSME
AU
LCVE
GH
GH
636.5
811.8
2471.8
650.7
564.3
52.44
22.89
20.28
35.83
35.84
16.30
13.52
9.87
6.76
6.76
17.63
6.36
12.56
3.05
3.05
–11.60
–4.94
10.85
–0.01
–0.01
4.36
11.34
11.79
8.59
8.59
6.66
5.35
8.23
6.72
6.72
49.54
21.94
20.17
36.20
36.21
–3.14
–1.16
–0.16
+0.36
+0.36
INVESCO INTL DIVSFD;A
IMLG
847.3
16.12
12.30
15.43
–3.61
6.11
3.74
15.60
–0.52
L16
BARRON’S
•
Funds Quarterly
January 8, 2024
Stock Funds
s Copyright Lipper
For personal non-commercial use only. Do not edit or alter. Reproductions not permitted.
To reprint or license content, please contact Barron's reprints department at 800-843-0008 or www.djreprints.com
NAME
OBJ
LATEST
REPORTED
NAV
ASSETS
($ SHR)
($MIL)
12/29/23
QTR
RETURN THROUGH 12/29
1YR
3 YRS
5 YRS
(Annualized)
10YRS
LATEST WK’S DATA
(as of Thursday)
CLOSE
WK’S
NAV
CHG
INVESCO INTL SM CO;A n
INVESCO INTL SM CO;Y nr
INVESCO MAIN SAC;A
INVESCO MAIN ST MC;A
ISMG
ISMG
MLCE
MCCE
796.7
1704.7
1065.1
1792.0
42.95
42.55
22.89
26.72
13.98
14.04
10.97
10.64
12.29
12.57
25.93
14.48
–4.18
–3.94
8.56
6.45
6.50
6.75
15.28
11.71
6.95
7.21
9.44
7.54
41.32
40.94
22.53
26.08
–1.64
–1.62
–0.43
–0.78
INVESCO MAIN ST MC;Y r
INVESCO MAIN STREET;A
INVESCO MAIN STREET;R r
INVESCO MAIN STREET;Y r
INVESCO OPPEN ITL GRO;A
MCCE
LCCE
LCCE
LCCE
IMLG
326.7
8274.8
275.0
471.2
1081.3
30.29
49.70
47.75
49.23
35.88
10.71
10.84
10.77
10.89
14.52
14.73
23.07
22.74
23.34
20.76
6.72
7.82
7.53
8.07
–0.99
12.00
13.60
13.29
13.85
8.76
7.81
9.95
9.66
10.20
3.78
29.56
48.83
46.91
48.37
34.52
–0.89
–1.00
–0.97
–0.99
–1.39
INVESCO OPPEN ITL GRO;Y r
INVESCO REAL ESTATE;A
INVESCO RISING DIV;A
INVESCO RISING DIV;Y r
INVESCO S&P 500 IDX;A
IMLG
RE
LCCE
LCCE
SPSP
2554.1
579.6
2311.4
305.5
1848.1
35.64
17.26
23.06
24.26
50.29
14.57
16.57
9.61
9.67
11.54
21.01
8.75
17.60
17.90
25.63
–0.75
4.86
9.16
9.43
9.42
9.03
5.62
13.82
14.09
15.08
4.04
6.37
9.16
9.42
11.42
34.30
17.05
22.80
23.99
49.44
–1.37
–0.41
–0.28
–0.30
–0.99
INVESCO S&P 500 IDX;C
INVESCO S&P 500 IDX;Y r
INVESCO SC VALUE;A
INVESCO SL RSK CSV IN;A
INVESCO SL RSK GR INV;A
SPSP
SPSP
SCVE
MTAC
MTAG
346.3
482.3
972.1
292.3
848.8
48.10
51.08
20.31
8.48
14.36
11.33
11.60
11.89
6.27
9.43
24.69
25.95
22.91
7.85
13.41
8.62
9.69
20.51
–2.10
1.50
14.24
15.36
20.69
2.68
7.13
10.60
11.69
10.09
2.62
4.98
47.29
50.22
19.78
8.41
14.09
–0.95
–1.00
–0.73
–0.09
–0.31
INVESCO SL RSK HG IV;A
INVESCO SL RSK MOD IN;A
INVESCO SM CAP EQTY;A
INVESCO SM CAP GR;A n
INVESCO SM CAP GR;R5 nr
GMLG
MTAM
SCCE
SCGE
SCGE
625.2
1457.9
549.0
511.8
651.2
13.56
10.63
13.35
25.45
32.93
10.07
8.72
9.07
10.60
10.69
14.60
12.24
15.96
12.66
13.08
1.97
0.56
3.39
–8.00
–7.68
8.82
6.36
12.15
8.73
9.12
5.71
4.72
6.30
7.35
7.74
13.27
10.46
12.89
24.39
31.56
–0.33
–0.19
–0.62
–1.35
–1.74
INVESCO SP MLP AL;A
INVESCO SP MLP AL;Y r
INVESCO SP MLP IN;A
INVESCO SP MLP IN;C
INVESCO SP MLP IN;Y r
EMP
EMP
EMP
EMP
EMP
392.1
342.8
1696.1
510.5
1083.9
6.41
6.82
5.12
4.22
5.50
3.69
3.62
4.69
4.44
4.55
20.44
20.45
20.32
19.42
20.72
29.40
29.65
29.61
28.61
29.84
10.60
10.85
14.34
13.50
14.61
1.82
2.07
3.19
2.44
3.43
6.39
6.81
5.10
4.20
5.49
+0.01
+0.02
+0.00
–0.01
+0.00
INVESCO SP MLP SL;A
INVESCO SP MLP SL;R6 r
INVESCO SP MLP SL;Y r
INVESCO SUMMIT;P
INVESCO TECH;A
EMP
EMP
EMP
MLGE
TK
435.4
277.6
829.9
2508.8
788.5
7.22
7.82
7.73
22.63
51.94
6.20
6.27
6.21
12.87
16.42
22.48
22.85
22.79
36.82
47.23
27.66
28.05
28.02
0.65
0.25
11.17
11.54
11.45
14.97
14.78
3.29
3.62
3.54
11.68
12.00
7.20
7.81
7.72
21.81
49.19
–0.02
–0.01
–0.01
–0.91
–3.18
INVESCO TECH;INV n
J HANCOCK BALANCED;A
J HANCOCK BALANCED;I r
J HANCOCK CLSC VAL;A
J HANCOCK CLSC VAL;I r
TK
MTAG
MTAG
MLVE
MLVE
553.0
2958.0
773.1
336.2
779.3
51.86
26.17
26.14
34.68
34.75
16.48
10.14
10.23
11.74
11.79
47.38
18.21
18.59
18.60
18.90
0.37
4.46
4.78
12.26
12.54
14.90
9.90
10.23
11.44
11.72
12.11
7.13
7.46
7.60
7.88
49.12
25.85
25.81
34.34
34.42
–3.17
–0.38
–0.38
–0.49
–0.48
J HANCOCK FDMNTL LCC;A
J HANCOCK FDMNTL LCC;I r
J HANCOCK II BC GRO;1 r
J HANCOCK II CAP AP;1 r
J HANCOCK II CAP AP;NAV r
LCCE
LCCE
LCGE
LCGE
LCGE
2026.6
768.9
1621.3
615.9
1004.3
62.45
66.39
47.59
13.70
13.83
15.21
15.28
13.98
16.31
16.23
32.17
32.48
49.45
53.08
53.15
8.71
8.98
2.68
3.37
3.41
15.90
16.19
13.52
18.10
18.16
10.52
10.80
12.32
14.11
14.16
61.10
64.96
46.32
13.27
13.40
–1.60
–1.70
–1.42
–0.49
–0.49
J HANCOCK II MM LS AG;1 r
J HANCOCK II MM LS AG;A
J HANCOCK II MM LS BL;1 r
J HANCOCK II MM LS BL;A
J HANCOCK II MM LS CS;1 r
MTAA
MTAA
MTAM
MTAM
MTAC
2488.4
557.4
5640.4
1774.1
1049.9
13.10
13.20
12.47
12.61
11.51
10.91
10.80
9.20
9.09
6.71
17.76
17.32
13.87
13.51
9.15
3.81
3.44
2.16
1.80
–0.07
10.85
10.44
7.92
7.53
4.19
7.52
7.13
5.71
5.33
3.28
12.83
12.93
12.28
12.41
11.41
–0.31
–0.32
–0.22
–0.23
–0.11
J HANCOCK II MM LS CS;A
J HANCOCK II MM LS GR;1 r
J HANCOCK II MM LS GR;5 r
J HANCOCK II MM LS GR;A
J HANCOCK II MM LS MD;1 r
MTAC
MTAG
MTAG
MTAG
MTAM
643.1
6162.1
373.0
1825.3
1460.9
11.55
12.88
12.85
12.98
11.70
6.69
10.20
10.19
10.11
7.88
8.84
16.19
16.29
15.78
11.51
–0.40
3.17
3.22
2.81
1.21
3.82
9.57
9.63
9.19
6.12
2.92
6.72
6.78
6.34
4.53
11.44
12.65
12.62
12.74
11.56
–0.12
–0.27
–0.27
–0.27
–0.16
J HANCOCK II MM LS MD;A
J HANCOCK II MM2020LF;1 r
J HANCOCK II MM2025LF;1 r
J HANCOCK II MM2030LF;1 r
J HANCOCK II MM2035LF;1 r
MTAM
MATB
MATG
MATC
MATD
668.3
272.6
634.4
847.2
791.0
11.80
7.89
8.62
9.09
9.44
7.82
8.29
8.95
9.78
10.57
11.11
11.54
12.80
14.33
15.99
0.86
1.47
1.64
1.90
2.39
5.73
6.97
7.82
8.65
9.45
4.17
5.40
5.99
6.50
6.96
11.65
7.79
8.51
8.95
9.27
–0.17
–0.11
–0.13
–0.17
–0.19
J HANCOCK II MM2040LF;1 r
J HANCOCK II MM2045LF;1 r
J HANCOCK II MM2050LF;1 r
J HANCOCK III DS VAL;A
J HANCOCK III DS VAL;I r
MATH
MATI
MATE
MLVE
MLVE
676.8
661.3
440.8
1256.2
6414.9
9.61
9.47
11.06
23.24
22.17
10.86
11.04
11.26
8.75
8.78
17.15
18.28
18.66
13.58
13.83
2.89
3.33
3.42
12.01
12.30
10.21
10.63
10.68
11.76
12.04
7.39
7.59
7.61
8.34
8.62
9.43
9.29
10.84
23.01
21.96
–0.21
–0.21
–0.25
–0.27
–0.24
J HANCOCK III DS VAL;R6 r
J HANCOCK III DVMC;A
J HANCOCK III DVMC;I r
J HANCOCK III DVMC;R6 r
J HANCOCK III GLSYD;A
MLVE 4049.9
MCCE 1415.9
MCCE 13877.8
MCCE 6220.1
GLCV
299.8
22.22
25.99
27.37
27.36
10.76
8.80
11.65
11.66
11.73
8.78
13.95
16.36
16.60
16.77
11.13
12.40
10.96
11.22
11.34
7.42
12.15
13.37
13.65
13.77
8.01
8.73
9.28
9.56
9.67
5.21
22.01
25.45
26.81
26.80
10.74
–0.25
–0.65
–0.69
–0.69
–0.03
J HANCOCK III GLSYD;I r
J HANCOCK III INTG;A n
J HANCOCK III INTG;I nr
J HANCOCK US GL LD G;A
J HANCOCK US GL LD G;I r
GLCV
ILCG
ILCG
LCGE
LCGE
531.3
462.5
2689.6
894.4
1087.1
10.81
24.49
24.66
62.36
70.06
8.81
8.11
8.22
13.65
13.72
11.35
12.52
12.90
29.14
29.45
7.66
–3.42
–3.12
2.64
2.90
8.26
6.99
7.31
14.26
14.54
5.49
5.60
5.92
11.56
11.84
10.79
24.06
24.22
61.22
68.79
–0.03
–0.44
–0.44
–1.31
–1.47
J HANCOCK VIT MV BAL;I
J HANCOCK VIT MV GRO;I
J HANCOCK 500 INDEX;I
J HANCOCK INTL EQ IX;I
J HANCOCK MC IDX;I n
MTAM
MTAG
SPSP
IMLC
SPMC
359.6
451.6
5814.3
326.2
887.1
10.00
10.51
49.87
18.33
19.60
9.47
10.31
11.61
9.97
11.57
11.99
13.69
25.90
15.36
16.01
1.44
2.98
9.65
1.30
7.65
4.62
5.18
15.34
6.90
12.14
3.81
3.70
11.69
3.65
8.81
9.85
10.33
49.03
18.03
19.05
–0.18
–0.21
–0.98
–0.27
–0.73
NAME
Data provided by
OBJ
LATEST
REPORTED
NAV
ASSETS
($ SHR)
($MIL)
12/29/23
QTR
RETURN THROUGH 12/29
1YR
3 YRS
5 YRS
(Annualized)
10YRS
LATEST WK’S DATA
(as of Thursday)
CLOSE
WK’S
NAV
CHG
J HANCOCK SC IDX;I n
J HANCOCK SCI&TECH;I
J HANCOCK TOT STK;I n
JAMES ADV BAL GR;RETAIL
JANUS ASPEN BAL;INST
SCCE
TK
MLCE
MTAM
MTAM
369.3
719.5
505.8
330.3
407.0
13.08
18.02
24.29
20.45
45.28
13.84
14.20
11.83
7.16
9.47
16.49
54.68
25.53
11.52
15.41
1.91
2.59
7.53
3.11
4.18
9.56
18.61
14.38
4.53
9.64
6.80
15.70
10.73
2.75
7.99
12.63
17.15
23.82
20.28
44.69
–0.65
–1.01
–0.57
–0.20
–0.64
JANUS ASPEN ENTRPRS;INST
JANUS ASPEN FORTY;INST
JANUS ASPEN GL RES;INST
JANUS ASPEN RESEARCH;INS
JENSEN QUALITY GR;I r
MCGE
LCGE
GLCC
LCGE
LCCE
592.0
402.1
549.8
422.1
5228.1
76.52
47.35
61.10
45.15
59.08
9.50
13.75
12.14
13.93
9.68
18.07
39.96
26.78
43.17
16.91
5.06
4.55
6.46
6.50
8.43
13.42
16.92
13.33
16.83
14.36
12.10
13.73
9.01
12.49
12.22
74.50
46.16
60.12
43.97
57.92
–2.32
–1.35
–1.10
–1.29
–1.21
JENSEN QUALITY GR;J
JNS HNDSN BALANCED;C
JNS HNDSN BALANCED;S r
JNS HNDSN BALANCED;T
JNS HNDSN CONTRARIAN;T
LCCE
MTAM
MTAM
MTAM
MLCE
2465.1
2076.5
365.7
4299.6
940.0
59.17
41.70
42.24
42.32
25.91
9.62
9.20
9.36
9.42
12.15
16.66
14.33
14.98
15.27
21.38
8.20
3.15
3.71
3.97
4.76
14.10
8.60
9.18
9.46
16.00
11.96
6.97
7.56
7.84
8.85
58.01
41.15
41.69
41.77
25.27
–1.21
–0.60
–0.60
–0.60
–0.89
JNS HNDSN ENTERPRISE;S r
JNS HNDSN ENTERPRISE;T
JNS HNDSN FORTY;A
JNS HNDSN FORTY;S r
JNS HNDSN GL EQ INC;A
MCGE
MCGE
LCGE
LCGE
GEI
278.0
3116.1
408.8
412.3
673.1
122.77
129.08
45.67
42.72
6.09
9.16
9.23
13.65
13.62
8.41
17.51
17.81
39.54
39.34
10.14
4.75
5.02
4.30
4.15
5.01
13.16
13.45
16.54
16.37
7.30
11.48
11.76
13.28
13.16
3.85
119.57
125.72
44.52
41.64
6.05
–3.68
–3.86
–1.30
–1.22
–0.04
JNS HNDSN GL EQ INC;C
JNS HNDSN GL TCH & I;T
JNS HNDSN GLB LF SCI;T
JNS HNDSN GLB RSRCH;T
JNS HNDSN GLB SELECT;T
GEI
GTK
GH
GLCC
GMLV
300.4
1422.5
1199.4
1139.5
540.9
5.98
51.72
68.72
95.02
16.87
8.20
16.26
8.47
12.11
11.12
9.37
55.14
7.40
26.61
17.29
4.40
4.37
3.66
6.24
6.98
6.60
20.00
12.52
13.14
12.58
3.13
16.76
11.40
8.85
8.45
5.94
49.65
69.57
93.49
16.59
–0.04
–2.27
+0.67
–1.71
–0.27
JNS HNDSN GRO & INC;T
JNS HNDSN MC VALUE;T
JNS HNDSN OVERSEAS;T
JNS HNDSN RESEARCH;T
JNS HNDSN SC VALUE;T
LCCE
MCCE
ILCC
LCGE
SCCE
1958.3
747.1
486.1
4168.2
281.7
68.94
15.09
43.31
65.85
23.59
10.70
11.48
8.00
13.87
13.31
17.84
11.26
10.81
42.96
13.16
9.16
8.02
4.53
6.36
7.71
12.70
10.07
11.08
16.64
7.97
10.94
7.11
3.27
12.40
6.59
67.91
14.88
42.55
64.13
22.97
–1.11
–0.28
–0.73
–1.88
–0.87
JNS HNDSN VENTURE;T
JPMORGAN EM MKT EQ;A n
JPMORGAN EM MKT EQ;I nr
JPMORGAN EM MKT EQ;L nr
JPMORGAN EQUITY IDX;A
SCGE
EM
EM
EM
SPSP
663.4
358.4
1686.9
1238.5
829.5
76.13
28.81
29.52
29.74
71.40
12.19
8.36
8.40
8.46
11.56
16.00
6.97
7.24
7.35
25.72
–1.87
–10.84
–10.62
–10.53
9.50
10.18
4.62
4.89
4.99
15.18
8.21
3.51
3.76
3.89
11.53
73.74
27.98
28.68
28.89
70.20
–3.18
–0.81
–0.82
–0.82
–1.40
JPMORGAN EQUITY IDX;I r
JPMORGAN EQUITY INC;A n
JPMORGAN EQUITY INC;I nr
JPMORGAN GRO ADVTG;A
JPMORGAN GRO ADVTG;I r
SPSP 1103.9
EIEI
4399.5
EIEI 17223.9
MLGE 3357.3
MLGE 4968.7
71.50
22.51
22.98
30.64
32.50
11.63
8.38
8.47
13.38
13.46
26.03
4.48
4.78
39.80
40.16
9.77
8.48
8.76
5.93
6.20
15.46
10.70
10.98
19.86
20.16
11.80
8.93
9.21
14.74
14.99
70.30
22.43
22.89
29.70
31.50
–1.40
–0.11
–0.12
–1.09
–1.15
JPMORGAN INTL EQ;A
JPMORGAN INTL EQ;I r
JPMORGAN INV BAL;A
JPMORGAN INV BAL;C
JPMORGAN INV BAL;I r
ILCG
ILCG
MTAM
MTAM
MTAM
397.4
824.6
4574.0
296.9
330.0
18.54
18.87
15.03
14.72
15.08
11.99
12.09
8.61
8.50
8.72
17.62
17.91
13.39
12.86
13.70
1.68
1.94
2.64
2.15
2.92
8.53
8.80
7.55
7.02
7.84
3.92
4.18
5.64
5.09
5.91
18.14
18.47
14.84
14.53
14.88
–0.38
–0.38
–0.37
–0.35
–0.38
JPMORGAN INV CSV GR;A
JPMORGAN INV CSV GR;C
JPMORGAN INV CSV GR;I r
JPMORGAN INV GR&INC;A
JPMORGAN INV GR&INC;I r
MTAC
MTAC
MTAC
MTAG
MTAG
2884.6
318.5
716.2
3814.8
275.6
12.14
12.08
12.24
17.92
17.50
7.37
7.35
7.47
9.57
9.62
9.85
9.43
10.23
15.84
16.09
0.71
0.23
0.98
4.03
4.27
4.97
4.46
5.25
9.68
9.94
3.95
3.42
4.22
6.99
7.26
12.02
11.95
12.12
17.66
17.24
–0.22
–0.21
–0.21
–0.48
–0.49
JPMORGAN INV GROWTH;A
JPMORGAN INV GROWTH;I r
JPMORGAN LGCP GRO;A
JPMORGAN LGCP GRO;I r
JPMORGAN LGCP VAL;A
MTAA 3896.3
MTAA
573.9
LCGE 5295.5
LCGE 17867.1
MLVE
293.1
22.66
23.39
58.52
60.14
19.25
10.80
10.84
13.32
13.40
10.17
18.95
19.22
34.28
34.62
10.97
5.61
5.85
5.70
5.97
10.92
12.00
12.26
20.59
20.89
13.85
8.55
8.82
15.11
15.37
10.00
22.27
22.98
56.87
58.44
19.06
–0.67
–0.70
–1.92
–1.97
–0.30
JPMORGAN LGCP VAL;I r
JPMORGAN MDCP EQ;I nr
JPMORGAN MDCP GRO;A
JPMORGAN MDCP GRO;I r
JPMORGAN MDCP VAL;A
MLVE
MCCE
MLGE
MLGE
MCCE
1352.0
1034.6
1309.2
2549.8
1175.4
18.82
58.10
37.45
46.62
34.62
10.29
12.45
13.07
13.16
12.11
11.27
16.16
22.83
23.11
10.86
11.19
5.40
–0.45
–0.19
9.52
14.14
13.80
15.21
15.54
10.59
10.23
9.93
10.87
11.20
7.65
18.63
56.91
36.07
44.91
34.20
–0.28
–1.47
–1.60
–1.99
–0.57
JPMORGAN MDCP VAL;I r
JPMORGAN MDCP VAL;L nr
JPMORGAN SC BLEND;A n
JPMORGAN SC BLEND;I nr
JPMORGAN SMCP EQTY;A
MCCE
MCCE
SCCE
SCCE
SCGE
1770.3
5815.9
365.3
431.7
451.1
35.26
35.94
24.39
30.23
42.36
12.16
12.21
12.14
12.16
12.34
11.13
11.29
15.15
15.40
11.61
9.79
9.97
2.09
2.35
2.61
10.86
11.08
11.55
11.83
10.34
7.91
8.15
9.46
9.74
8.14
34.84
35.51
23.54
29.18
41.06
–0.57
–0.59
–1.15
–1.42
–1.75
JPMORGAN SMCP EQTY;I r
JPMORGAN SMCP EQTY;R5 r
JPMORGAN SMCP GRO;A n
JPMORGAN SMCP GRO;I nr
JPMORGAN SMCP GRO;L nr
SCGE
SCGE
SCGE
SCGE
SCGE
2179.9
680.5
337.0
501.6
532.4
54.04
54.25
15.86
18.61
19.55
12.41
12.46
10.75
10.91
10.89
11.90
12.10
13.85
14.17
14.33
2.89
3.08
–10.26
–10.02
–9.89
10.63
10.84
9.54
9.83
9.98
8.45
8.66
8.35
8.62
8.78
52.38
52.59
15.18
17.80
18.71
–2.22
–2.23
–0.88
–1.04
–1.09
JPMORGAN SMCP VAL;R6 r
JPMORGAN SR 2020;A
JPMORGAN SR 2020;R5 r
JPMORGAN SR 2030;A
JPMORGAN SR 2030;R5 r
SCCE
MATB
MATB
MATC
MATC
954.2
304.5
347.0
722.3
1114.3
26.96
15.14
15.24
17.54
17.68
14.25
7.85
7.94
9.36
9.47
13.29
11.55
11.93
15.11
15.53
9.35
0.37
0.70
1.88
2.22
10.67
5.15
5.46
7.40
7.74
6.44
4.41
4.68
5.75
6.06
26.31
14.97
15.06
17.29
17.42
–1.01
–0.67
–0.73
–0.71
–0.78
JPMORGAN SR 2040;A
JPMORGAN SR 2040;R5 r
JPMORGAN SR INCOME;R5 r
JPMORGAN US EQ;A
JPMORGAN US EQ;C
MATH
MATH
MATJ
LCCE
LCCE
620.2
951.9
273.2
2186.3
408.8
19.86
20.04
14.79
21.16
20.08
10.54
10.63
7.98
12.00
11.84
18.44
18.93
12.01
26.71
26.10
3.88
4.23
0.70
9.49
8.95
9.73
10.09
5.11
16.84
16.26
6.98
7.29
4.07
12.02
11.46
19.53
19.71
14.62
20.79
19.73
–0.73
–0.79
–0.69
–0.43
–0.41
January 8, 2024
BARRON’S
•
L17
Funds Quarterly
Stock Funds
s Copyright Lipper
For personal non-commercial use only. Do not edit or alter. Reproductions not permitted.
To reprint or license content, please contact Barron's reprints department at 800-843-0008 or www.djreprints.com
NAME
OBJ
LATEST
REPORTED
NAV
ASSETS
($ SHR)
($MIL)
12/29/23
QTR
RETURN THROUGH 12/29
1YR
3 YRS
5 YRS
(Annualized)
10YRS
LATEST WK’S DATA
(as of Thursday)
CLOSE
WK’S
NAV
CHG
JPMORGAN US EQ;I r
JPMORGAN US EQ;L nr
JPMORGAN US EQ;R5 r
JPMORGAN US LCC +;A
JPMORGAN US LCC +;I r
LCCE
LCCE
LCCE
ELCC
ELCC
4120.8
2214.6
1174.0
260.3
949.9
21.25
21.31
21.32
16.48
17.39
12.07
12.12
12.12
11.78
11.83
27.04
27.26
27.25
29.45
29.82
9.76
9.94
9.94
10.71
10.98
17.13
17.31
17.31
17.20
17.49
12.28
12.44
12.47
11.93
12.21
20.88
20.94
20.95
16.17
17.06
–0.43
–0.42
–0.42
–0.34
–0.37
JPMORGAN US RES ENEQ;I r
JPMORGAN US RES ENEQ;R6 r
JPMORGAN US VALUE;A
JPMORGAN VAL ADVTG;A
JPMORGAN VAL ADVTG;I r
LCCE
LCCE
LCVE
MLVE
MLVE
773.7
6776.2
1145.4
1283.5
1692.3
36.97
36.90
69.55
35.22
35.52
11.64
11.65
8.54
10.73
10.84
28.23
28.29
9.19
9.48
9.78
11.06
11.15
10.51
10.43
10.72
16.78
16.89
12.46
10.83
11.11
11.90
12.06
9.52
8.03
8.30
36.31
36.25
69.19
35.08
35.37
–0.76
–0.75
–0.46
–0.27
–0.27
JPMORGAN VAL ADVTG;L r
KINETICS PARADIGM;NL
LAZARD EMG MKT EQ;INST nr
LAZARD EMG MKT EQ;OPN n
LAZARD GL LSTD INFR;INST r
LAZARD GL LSTD INFR;OPN
LAZARD INT STR EQ;INST r
LAZARD INT STR EQ;OPN
LAZARD INTL EQTY;INST r
LEUTHOLD CORE INV;INST r
MLVE
MCGE
EM
EM
GIF
GIF
IMLG
IMLG
IMLC
FX
1287.0
338.8
2390.4
276.0
8390.8
284.4
3965.9
311.1
1014.4
285.0
35.54
73.13
17.17
17.76
15.28
15.29
15.48
15.63
16.16
21.23
10.86
–3.63
9.46
9.32
10.41
10.33
11.86
11.69
8.93
7.98
9.90
–16.89
22.39
22.03
10.89
10.60
17.06
16.66
16.43
11.85
10.87
14.04
3.17
2.89
9.48
9.19
1.03
0.75
1.68
6.34
11.27
14.86
5.32
5.04
8.91
8.64
6.75
6.46
6.74
8.15
8.50
10.26
2.28
2.02
9.64
9.36
3.85
3.58
3.20
6.14
35.40
72.41
16.78
17.36
15.33
15.34
15.12
15.28
15.86
20.95
–0.27
–1.54
–0.36
–0.37
+0.06
+0.05
–0.36
–0.35
–0.32
–0.31
LKCM EQUITY FUND;INST r
LONGLEAF PARTNERS
LONGLEAF PARTNERS INTL
LONGLEAF PARTNERS SC n
LOOMIS SAYLES GRO;Y r
MLCE
495.7
MCVE 1369.7
IMLV
722.4
SCVE
853.8
LCGE 10531.9
34.41
22.58
15.92
24.97
23.23
8.62
7.99
7.40
10.85
14.07
12.65
24.49
17.42
20.15
51.42
5.27
5.70
–1.82
2.55
9.14
13.22
8.42
2.32
6.09
17.68
9.64
3.86
1.32
5.71
14.23
33.78
22.28
15.69
24.57
22.67
–0.72
–0.37
–0.22
–0.45
–0.68
LOOMIS SAYLES SCG;INST r
LORD ABBETT AFFILTED;A
LORD ABBETT AFFILTED;I r
LORD ABBETT ALPHA;A
LORD ABBETT CONVERT;I r
LORD ABBETT DEV GRO;A
LORD ABBETT DEV GRO;I r
LORD ABBETT DIV GRO;A
LORD ABBETT DIV GRO;I r
LORD ABBETT FUND EQ;A
SCGE
EIEI
EIEI
SCCE
CV
SCGE
SCGE
EIEI
EIEI
MLVE
998.9
4913.2
503.7
398.8
349.2
600.5
673.2
2288.9
854.4
1180.7
26.21
16.85
16.95
23.13
12.80
18.39
24.25
19.41
19.67
13.33
8.18
11.06
11.13
11.13
5.84
11.45
11.55
10.30
10.39
10.31
11.92
10.49
10.84
13.91
7.24
8.50
8.74
16.34
16.65
13.10
–1.71
8.08
8.37
0.08
–5.90
–12.28
–12.06
8.13
8.41
9.73
10.01
9.32
9.61
9.54
11.33
8.97
9.24
13.07
13.37
10.73
8.29
7.77
8.04
6.71
7.85
6.74
7.02
10.15
10.43
7.51
25.11
16.68
16.77
22.28
12.52
17.41
22.96
19.14
19.39
13.22
–1.38
–0.20
–0.20
–1.04
–0.34
–1.22
–1.61
–0.30
–0.30
–0.14
LORD ABBETT FUND EQ;I r
LORD ABBETT GRO OPP;A
LORD ABBETT MA BAL;A
LORD ABBETT MA INC;A
LORD ABBETT MDCP STK;A
LORD ABBETT VAL OPP;A
LORD ABBETT VAL OPP;I r
LSV VALUE EQUITY;INST r
LYRICAL US VAL EQTY;INST r
MAINSTAY BALANCED;A
MLVE
MLGE
MTAM
MTAC
MCCE
SCCE
SCCE
MLVE
MLCE
MTAG
374.6
318.7
1725.5
653.5
856.8
609.7
256.2
1129.8
610.9
351.6
13.43
19.39
10.93
15.09
32.11
17.69
18.82
24.97
22.91
29.80
10.42
9.67
8.87
7.55
11.27
10.45
10.55
9.25
14.87
6.74
13.37
10.80
11.90
9.03
15.50
16.69
17.04
12.40
27.62
7.12
9.99
–7.31
1.21
0.16
9.80
5.05
5.33
10.82
11.09
5.48
11.00
8.81
8.26
5.79
10.82
10.41
10.68
10.89
12.97
7.97
7.79
7.16
5.31
3.99
6.74
6.99
7.26
8.09
8.14
5.74
13.32
18.49
10.77
14.90
31.59
17.14
18.24
24.82
22.45
29.66
–0.14
–1.11
–0.18
–0.20
–0.66
–0.68
–0.71
–0.26
–0.61
–0.19
MAINSTAY EPOCH GL EQ;I r
MAINSTAY INCOME BLDR;A
MAINSTAY MK CONVERT;A
MAINSTAY S&P500 IDX;A
MAINSTAY S&P500 IDX;I r
MAINSTAY WMC VAL;A
MAINSTAY WNSLW LCG;A
MAIRS & POWER BALANCED
MAIRS & POWER GROWTH
MAIRS & POWER SML CAP
GLCV
FX
CV
SPSP
SPSP
MLVE
LCGE
MTAG
MLCE
SCCE
627.9
651.2
685.0
929.4
304.4
531.5
1351.4
779.3
5020.0
331.7
20.91
18.72
18.09
52.84
54.02
27.84
8.99
101.65
147.15
29.15
9.07
9.19
4.73
11.53
11.60
8.26
18.06
10.64
13.82
13.36
12.37
9.60
8.88
25.62
25.96
8.99
42.86
13.39
27.70
11.04
7.68
1.40
1.62
9.44
9.72
9.34
6.83
4.50
9.22
6.39
8.29
5.66
11.59
15.11
15.40
14.25
17.37
8.69
14.31
9.67
5.58
4.66
8.23
11.44
11.72
9.70
13.24
6.83
10.15
7.49
20.82
18.57
17.82
51.95
53.11
27.71
8.72
100.68
144.53
27.84
MANNING&NAPIER PB EXT;S
MANNING&NAPIER PB MAX;S
MANNING&NAPIER RAI ID;I r
MARSICO INV FD FOC;INV
MARSICO INV FD GROW;INV
MTAM
MLCE
ISMG
LCGE
LCGE
288.4
260.8
268.4
634.6
298.9
18.64
23.70
22.83
22.14
20.44
9.25
11.74
8.83
13.93
15.77
13.14
19.05
6.53
45.23
47.45
1.59
3.91
–5.38
5.18
2.56
8.02
11.82
8.40
18.23
17.67
5.30
7.86
6.50
12.59
11.80
MASSMUTUAL S BL CH;I r
MASSMUTUAL S BL CH;R5 r
MASSMUTUAL S EQ OP;I r
MASSMUTUAL S FND V;I r
MASSMUTUAL S MCG;I nr
LCGE
LCGE
LCVE
MLVE
MCGE
1581.2
294.1
448.3
314.5
4016.8
19.86
19.73
17.15
8.44
19.80
14.00
13.99
10.50
9.24
11.62
50.60
50.55
10.84
11.60
19.61
5.38
5.28
9.33
11.76
1.46
15.41
15.30
13.08
11.95
11.75
MASSMUTUAL S MCG;R5 nr
MASSMUTUAL S OSEAS;I r
MASSMUTUAL S S&P500;I r
MASSMUTUAL S S&P500;R3
MASSMUTUAL S S&P500;R4
MCGE
ILCC
SPSP
SPSP
SPSP
867.7
300.3
1108.1
272.4
388.1
19.34
8.67
15.27
13.61
14.49
11.54
11.02
11.65
11.41
11.53
19.50
18.87
26.17
25.12
25.48
1.35
4.65
9.90
9.04
9.32
MASSMUTUAL S S&P500;R5 r
MASSMUTUAL S S&P500;SV r
MASSMUTUAL S SCG;I r
MATTHEW 25 FUND
MATTHEWS ASIA CHINA;INV
SPSP
SPSP
SCGE
MLVE
CH
354.4
285.8
633.5
288.7
300.1
15.39
15.48
14.64
29.02
11.62
11.59
11.59
12.18
13.88
–5.16
25.99
25.83
16.93
36.44
–19.22
MATTHEWS ASIA D;INV
MATTHEWS ASIA INDIA;INV
MATTHEWS ASIA PAC;INV
MERGER FUND;A
MERIDIAN CONTRARIAN;LEG
IEI
INR
XJ
AED
SCCE
401.3
614.1
707.7
550.4
573.7
13.70
26.37
18.62
17.14
36.46
7.07
8.68
1.85
1.82
8.80
MERIDIAN GROWTH;LEG n
MFS AGGR GR ALLOC;A
MFS CORE EQUITY;A
SCGE
MTAA
MLCE
897.7
1572.7
2494.3
34.23
27.86
45.45
11.10
10.37
12.11
NAME
Data provided by
OBJ
LATEST
REPORTED
NAV
ASSETS
($ SHR)
($MIL)
12/29/23
QTR
RETURN THROUGH 12/29
1YR
3 YRS
5 YRS
(Annualized)
10YRS
LATEST WK’S DATA
(as of Thursday)
CLOSE
WK’S
NAV
CHG
MFS GLOBAL EQUITY;A
MFS GLOBAL TOT RTN;A
GLCV
MTAM
694.4
649.7
46.37
17.04
10.94
9.50
14.21
10.26
3.13
2.11
10.21
6.59
7.07
4.66
45.50
16.83
–0.88
–0.22
MFS GROWTH;A
MFS GROWTH;C
MFS GROWTH;I r
MFS INTERNATIONAL EQT;R6 r
MFS INTL INTR VAL;A n
LCGE 8522.4
LCGE
494.2
LCGE 11933.1
ILCC 14396.6
IMLG 1782.6
157.81
114.86
172.07
32.94
37.36
12.75
12.53
12.82
12.00
10.02
35.79
34.77
36.13
19.04
17.64
4.77
3.99
5.04
5.30
–0.15
15.71
14.84
16.00
10.74
8.47
12.65
11.81
12.93
6.23
6.84
153.67
111.84
167.56
32.33
36.53
–4.41
–3.23
–4.80
–0.54
–0.81
MFS INTL NEW DISCV;A
MFS INTL NEW DISCV;I r
MFS MASS INV GRO;A
MFS MASS INV GRO;I r
MFS MASS INV TR;A
ISMG
ISMG
LCCE
LCCE
LCCE
591.0
662.9
4794.0
1856.2
3743.1
30.50
31.63
39.36
41.03
34.32
10.23
10.28
12.04
12.08
11.60
12.78
13.01
24.08
24.34
19.15
–1.41
–1.17
8.14
8.41
8.13
5.19
5.45
16.72
17.00
13.73
4.22
4.48
12.77
13.03
10.43
29.78
30.89
38.34
39.97
33.73
–0.68
–0.70
–1.06
–1.11
–0.66
MFS MASS INV TR;I r
MFS MID CAP GROWTH;A
MFS MID CAP GROWTH;I r
MFS MID CAP VALUE;A
MFS MID CAP VALUE;I r
LCCE
MCGE
MCGE
MCVE
MCVE
1010.7
1643.2
3585.6
1881.7
3869.9
32.74
26.74
28.85
29.83
30.75
11.65
12.97
13.00
11.28
11.33
19.42
21.00
21.27
12.51
12.80
8.41
–0.55
–0.31
10.15
10.44
14.02
12.84
13.12
12.66
12.94
10.69
10.62
10.90
8.44
8.70
32.18
25.83
27.88
29.26
30.16
–0.63
–0.99
–1.06
–0.70
–0.73
MFS NEW DISCOVERY;A
MFS RESEARCH INTL;A
MFS RESEARCH;A
MFS RESEARCH;I r
MFS TECHNOLOGY;A
SCGE
IMLG
LCCE
LCCE
TK
757.1
700.1
1401.7
4055.2
750.0
23.48
22.16
53.35
55.24
52.20
10.23
9.15
12.48
12.57
17.75
13.98
13.10
22.46
22.77
53.89
–6.78
1.35
8.11
8.39
3.64
10.53
8.46
14.42
14.71
17.15
7.23
4.04
10.81
11.09
15.12
22.47
21.80
52.24
54.08
50.23
–1.25
–0.32
–1.22
–1.27
–2.17
MFS TOTAL RETURN;A
MFS TOTAL RETURN;I r
MFS UTILITIES;A
MFS VALUE;A
MFS VALUE;I r
MTAM 4958.8
MTAM
951.3
UT
1682.3
LCVE 7693.2
LCVE 24017.0
19.11
19.10
20.91
47.27
47.60
9.02
9.10
10.47
9.42
9.50
10.31
10.59
–2.25
7.89
8.18
4.33
4.60
3.78
8.20
8.48
8.41
8.67
8.15
11.24
11.52
6.40
6.66
6.23
8.41
8.68
18.90
18.90
21.02
47.04
47.37
–0.29
–0.29
+0.08
–0.24
–0.23
MILLER CONVERTIBLE BD;I r
MORG STAN I DISC;A n
MORG STAN I DISC;I nr
MORG STAN I GL FR;I r
MORG STAN I GROWTH;A
CV
MCGE
MCGE
GLCC
MLGE
598.0
476.0
335.2
2161.2
1898.9
12.54
10.27
15.15
34.36
34.41
3.71
22.12
22.28
9.51
20.99
6.06
46.30
46.66
16.42
49.87
–0.32
–22.32
–22.09
5.51
–15.95
6.14
9.60
9.90
11.50
9.42
4.62
7.24
7.55
9.68
10.85
12.44
9.58
14.12
33.82
32.33
–0.12
–0.89
–1.32
–0.57
–2.67
MORG STAN I GROWTH;I r
MORG STAN I INTL EQ;I r
MORG STAN INSIGHT;A
MORG STAN INSIGHT;I r
MORG STAN P EM MKT EQT
MLGE
ILCC
MLGE
MLGE
EM
1593.4
1078.2
812.0
572.0
434.6
38.42
13.58
26.39
32.81
12.90
21.05
10.79
21.22
21.34
7.70
50.25
16.91
52.72
53.03
9.85
–15.73
1.49
–18.06
–17.85
–6.06
9.70
6.99
9.59
9.88
2.45
11.14
3.40
11.04
11.36
1.77
36.10
13.27
24.82
30.86
12.62
–2.97
–0.30
–2.03
–2.53
–0.28
MORG STAN P LG CAP EQ
MORG STAN P SMID CAP EQ
NATIONWIDE ID AGGR;SVC r
NATIONWIDE ID MDTAGG;SVC r
NATIONWIDE INTL IDX;A
MLCE
SCCE
MTAA
MTAG
ILCC
2010.5
497.0
274.0
291.9
342.1
21.93
16.69
9.41
9.34
8.58
11.57
11.96
11.26
10.43
10.45
24.65
15.25
19.92
17.78
17.02
7.17
3.25
4.65
3.51
3.46
13.52
11.32
10.33
9.15
7.63
10.18
6.75
7.02
6.36
3.74
21.54
16.18
9.22
9.18
8.45
–0.45
–0.68
–0.22
–0.19
–0.12
–0.11
–0.17
–0.34
–1.04
–1.06
–0.20
–0.29
–1.12
–3.05
–1.67
NATIONWIDE INTL IDX;R6 r
NATIONWIDE MC MKT ID;R6 r
NATIONWIDE NATNWIDE;IS r
NATIONWIDE S&P 500;IS r
NATIXIS OAKMARK;A
NATIXIS US EQ OPP;A
NATIXIS US EQ OPP;Y r
NEUBERGER ALT EIPWS;INST r
NEUBERGER ALT LNGSH;INST r
NEUBERGER EMG MKT EQ;INS r
ILCC
SPMC
LCCE
SPSP
MLVE
LCCE
LCCE
OS
LSE
EM
561.1
327.3
1007.9
517.1
254.8
612.5
322.0
335.5
6270.3
252.4
8.65
16.16
28.07
22.73
27.24
36.73
48.54
10.96
17.45
17.38
10.60
11.58
12.23
11.62
12.75
12.95
13.02
4.96
5.30
5.62
17.61
16.16
25.53
25.78
30.96
37.01
37.35
15.35
13.14
4.68
3.91
7.84
8.24
9.54
15.01
9.98
10.27
6.62
4.72
–8.32
8.09
12.31
15.28
15.21
16.86
16.31
16.60
8.82
9.17
0.76
4.18
8.99
11.23
11.57
11.08
12.89
13.17
I
5.28
1.33
8.52
15.71
27.58
22.34
26.88
35.88
47.42
10.87
17.32
17.10
–0.12
–0.60
–0.57
–0.45
–0.48
–1.06
–1.39
–0.09
–0.12
–0.28
18.45
23.38
22.34
21.46
19.77
–0.20
–0.35
–0.48
–0.76
–0.73
I
13.08
10.41
8.30
10.35
19.35
19.22
17.08
8.38
19.19
–0.59
–0.59
–0.06
–0.08
–0.72
NEUBERGER EQTY INC;INST r
NEUBERGER FOCUS;INV n
NEUBERGER GENESIS;INST r
NEUBERGER GENESIS;INV
NEUBERGER GENESIS;R6 r
NEUBERGER GENESIS;TR
NEUBERGER INTL EQ;INST r
NEUBERGER INTR VAL;INST r
NEUBERGER LC GRO;INST r
NEUBERGER LC GRO;INV n
EIEI
GLCG
SCGE
SCGE
SCGE
SCGE
IMLG
SCCE
LCGE
LCGE
658.7
587.4
2556.7
1690.6
4740.2
1044.1
845.6
1332.8
486.8
1655.7
12.63
25.03
61.09
60.97
61.03
60.73
12.43
20.22
25.01
24.97
7.99
12.35
9.16
9.13
9.20
9.10
10.61
8.88
13.65
13.62
3.87
23.73
15.75
15.59
15.89
15.48
14.28
13.89
36.19
35.96
6.60
0.52
3.48
3.32
3.58
3.22
0.43
4.78
9.66
9.50
8.67
10.17
12.43
12.25
12.54
12.15
8.08
12.80
19.46
19.27
7.32
7.66
8.73
8.55
8.83
8.46
4.50
8.29
12.51
12.32
12.59
24.60
58.67
58.55
58.61
58.32
12.19
19.48
24.36
24.32
–0.06
–0.46
–3.08
–3.08
–3.08
–3.07
–0.23
–0.94
–0.72
–0.72
11.63
9.62
15.59
14.71
15.00
10.23
4.73
11.91
11.08
11.35
18.75
8.50
15.01
13.38
14.24
–0.70
–0.15
–0.30
–0.27
–0.29
NEUBERGER LC VALUE;INST r
NEUBERGER LC VALUE;INV n
NEUBERGER MID CP G;INST r
NEUBERGER MID CP G;INV n
NEUBERGER MID CP G;R6 r
LCVE
LCVE
MCGE
MCGE
MCGE
7882.5
1504.7
430.8
479.2
575.1
41.27
41.32
15.02
14.96
15.06
3.79
3.77
11.35
11.32
11.40
–1.61
–1.74
18.41
18.22
18.53
7.69
7.53
–1.57
–1.71
–1.47
12.20
12.02
12.26
12.08
12.38
9.67
9.48
9.27
9.08
9.37
41.60
41.65
14.51
14.45
14.55
+0.31
+0.31
–0.62
–0.61
–0.62
9.75
9.60
–1.39
5.27
–18.78
15.46
15.30
12.74
13.36
0.62
11.80
11.63
9.19
8.26
1.83
15.13
15.21
NA
28.18
11.28
–0.31
–0.31
NA
–1.06
–0.25
4.69
23.10
–4.87
4.18
12.29
–10.52
9.41
–10.34
1.55
5.63
0.89
8.62
0.56
3.08
12.52
2.85
11.65
3.49
2.85
9.57
13.41
26.54
18.11
17.14
35.27
–0.25
+0.16
–0.52
–0.01
–1.49
NEUBERGER RL EST;INST r
NEUBERGER SUS EQTY;INST r
NEUBERGER SUS EQTY;INV n
NEW ALTERNATIVES;A
NEW COVENANT BAL GRO
NEW COVENANT GROWTH
NICHOLAS EQUITY INC
NICHOLAS FUND
NICHOLAS II;I r
NICHOLAS LTD EDITION;I r
RE
LCCE
LCCE
S
MTAG
MLCE
EIEI
LCCE
MCGE
SCGE
414.5
550.6
384.5
308.3
335.8
528.9
452.0
3839.3
985.3
442.5
13.60
40.14
40.26
65.88
114.50
57.12
20.50
86.61
32.78
27.77
18.79
13.69
13.61
14.55
9.47
12.19
9.88
13.64
12.99
9.46
12.02
26.99
26.76
–2.49
16.77
25.20
7.87
34.23
19.88
17.17
5.09
8.58
8.39
–7.93
3.95
8.28
7.86
11.62
6.12
2.10
8.65
14.06
13.86
11.58
9.31
14.72
12.21
17.16
13.28
10.72
7.96
10.18
9.98
7.99
6.83
10.25
8.46
11.18
10.15
8.56
13.43
39.49
39.61
64.38
112.90
56.05
20.45
84.59
31.71
26.70
–0.32
–0.73
–0.74
–1.75
–1.89
–1.29
–0.08
–2.12
–1.20
–1.35
15.29
15.98
22.86
–2.08
4.56
8.37
8.40
11.35
14.90
7.75
8.07
11.38
33.19
27.30
44.48
–1.36
–0.62
–1.10
NORTHERN FDS ACTIVE M IE
NORTHERN FDS EM EQ IDX
NORTHERN FDS GL RE IDX
NORTHERN FDS INTL EQ IDX
NORTHERN FDS LG CP CORE
IMLG
EM
GRE
IMLC
MLCE
449.4
1436.1
1002.9
4393.9
256.9
11.62
10.71
9.63
13.81
24.50
10.62
7.77
14.78
10.79
11.03
20.72
9.15
10.02
18.02
24.23
4.61
–5.69
0.72
4.01
11.77
9.46
3.14
2.89
8.17
14.44
4.45
2.14
3.71
4.21
10.73
11.43
10.50
9.43
13.60
24.11
–0.19
–0.20
–0.28
–0.19
–0.46
L18
BARRON’S
•
Funds Quarterly
January 8, 2024
Stock Funds
s Copyright Lipper
For personal non-commercial use only. Do not edit or alter. Reproductions not permitted.
To reprint or license content, please contact Barron's reprints department at 800-843-0008 or www.djreprints.com
NAME
OBJ
LATEST
REPORTED
NAV
ASSETS
($ SHR)
($MIL)
12/29/23
NORTHERN FDS MID CAP IDX
NORTHERN FDS SM CAP IDX
NORTHERN FDS SM CAP VAL
NORTHERN FDS STOCK IDX
NUVEEN DIV VALUE;A
SPMC 1901.8
SCCE 1115.5
SCVE 1641.4
SPSP 12056.9
EIEI
376.0
NUVEEN DIV VALUE;I r
NUVEEN MID CP VALUE;I r
NUVEEN REAL EST;I r
OAKMARK EQTY & INC;INV
OAKMARK FUND;INV
EIEI
MCVE
RE
MTAM
MLVE
QTR
RETURN THROUGH 12/29
1YR
3 YRS
5 YRS
(Annualized)
10YRS
LATEST WK’S DATA
(as of Thursday)
CLOSE
WK’S
NAV
CHG
19.95
13.33
19.48
48.98
13.80
11.61
13.99
14.29
11.68
9.87
16.31
16.83
15.55
26.20
10.92
7.95
2.12
9.37
9.90
9.24
12.46
9.77
9.34
15.57
9.44
9.11
6.99
6.49
11.92
7.31
19.40
12.88
18.94
48.15
13.71
–0.74
–0.66
–0.78
–0.96
–0.13
292.2
350.0
548.1
4515.3
8932.7
14.03
52.00
15.39
33.76
132.56
9.85
9.62
15.77
9.95
12.92
11.20
14.50
11.51
17.34
30.89
9.50
11.97
5.87
7.49
15.02
9.71
12.58
6.94
10.00
16.89
7.58
8.79
7.31
6.70
11.33
13.94
51.32
15.19
33.27
130.79
–0.13
–0.97
–0.39
–0.60
–2.34
OAKMARK GLOBAL SEL;INV
OAKMARK GLOBAL;INV
OAKMARK INTERNATL;INV
OAKMARK INTL SC;INV
OAKMARK SELECT;INV
OBERWEIS INTL OPPS;INST r
OBERWEIS SM-CAP OPP;INV
OLD WESTBURY ALL CP CORE
OLD WESTBURY LC STRAT
OLD WESTBURY SM&MD CP ST
GLCV
361.4
GMLV
598.1
IMLV 5950.6
ISMC
393.5
MLVE 1788.4
ISMG
279.1
SCGE
286.5
MLCE 3182.6
GLCG 22046.7
GSME 8194.8
21.39
32.17
26.84
19.50
70.41
8.50
22.12
23.06
17.36
15.43
8.51
7.56
8.70
11.47
14.61
I
6.45
11.79
11.26
10.54
22.70
17.25
18.81
19.52
43.00
I
15.81
25.91
19.73
11.66
4.28
5.02
3.00
6.79
13.99
I
13.88
7.26
3.04
–3.00
10.72
10.35
7.32
11.02
15.94
I
19.60
15.05
9.57
6.77
6.20
5.75
3.34
4.83
8.86
I
11.78
9.82
6.70
5.01
21.18
31.63
26.39
19.03
68.35
8.26
21.24
22.55
17.00
14.98
–0.26
–0.61
–0.47
–0.49
–2.48
–0.25
–1.16
–0.57
–0.40
–0.54
OLSTEIN ALL CAP VAL;ADV r
OPTIMUM INTL;INST r
OPTIMUM LG CP GRO;INST r
OPTIMUM LG CP VAL;INST r
OPTIMUM S-M CAP GRO;INST r
MLVE
IMLG
LCGE
LCVE
SCGE
254.8
763.6
1730.6
1675.1
682.3
26.38
11.88
20.03
17.48
12.44
11.37
12.22
13.81
9.29
8.08
12.55
17.36
41.24
9.93
13.92
5.11
–0.69
2.77
9.50
–2.67
10.63
5.47
13.81
11.50
12.75
7.48
3.06
11.76
7.48
8.58
26.02
11.63
19.41
17.40
11.92
–0.47
–0.25
–0.70
–0.10
–0.65
OPTIMUM S-M CAP VAL;INST r
PACE ALT STR INV;P r
PACE INTL EQTY;P r
PACE LG CO GR;P r
PACE LG CO VL;P r
PACE S/M GR;P r
PACE S/M VL;P r
PARAMETRIC TM EM;I r
PARNASSUS MD CP GR;INV
PARNASSUS CORE EQTY;INV
SCCE
646.1
AMS
296.9
ILCC
690.5
LCGE
722.3
MLVE
688.6
SCGE
258.3
SCVE
293.3
EM
482.4
MLGE
645.5
EIEI 12934.9
14.09
10.60
17.05
15.75
19.45
13.86
19.05
39.55
55.57
55.11
11.51
4.25
10.47
13.50
9.43
10.44
11.79
6.38
15.61
11.77
10.56
5.15
20.41
35.15
15.40
15.89
12.58
10.65
35.60
24.93
7.04
2.84
5.15
5.52
11.37
–0.94
7.06
0.52
–0.47
9.05
9.16
4.89
9.01
16.68
10.66
10.83
11.59
3.61
10.48
15.48
4.07
2.66
5.11
12.38
7.83
7.76
7.09
1.83
8.45
11.63
13.73
10.54
16.81
15.32
19.40
13.27
18.47
39.06
53.37
54.05
–0.47
–0.07
–0.22
–0.50
–0.09
–0.76
–0.76
–0.41
–2.52
–1.17
PATIENT OPPORTUNITY;I r
PAYDEN EQTY INC;INV
PEAR TREE FOR VALSC;INST r
PEAR TREE FOREIGN V;INST r
PEAR TREE FOREIGN V;ORD
PEAR TREE FOREIGN V;R6 r
PERMANENT PORT PERM;I
PGIM BALANCED;A
PGIM GLBL REAL EST;Z r
PGIM JENN BLEND;A
MLCE
LCVE
ISMV
IMLV
IMLV
IMLV
AGM
MTAG
GRE
MLCE
646.4
316.2
626.8
2337.0
336.5
470.9
2814.5
686.0
484.7
941.6
33.53
16.48
15.68
22.98
23.10
11.14
51.23
16.50
19.18
22.32
18.10
9.80
11.69
11.71
11.59
11.69
7.58
9.57
14.00
13.40
39.59
5.36
21.29
20.34
19.89
20.44
11.96
16.78
11.26
27.46
–4.62
6.61
5.04
2.87
2.50
2.97
5.47
3.82
1.42
5.10
10.11
9.33
8.34
5.84
5.45
5.94
10.27
7.78
4.47
13.59
7.56
8.51
5.78
3.72
3.37
I
5.70
6.44
4.32
9.16
32.50
16.34
15.42
22.65
22.77
10.98
50.55
16.26
18.75
21.77
–1.43
–0.17
–0.29
–0.41
–0.41
–0.20
–0.90
–0.28
–0.60
–0.70
PGIM JENN DVSFD GRO;A
PGIM JENN FOCUSED GR;A
PGIM JENN GROWTH;A
PGIM JENN GROWTH;Z r
PGIM JENN HEALTH SCI;A
LCGE
LCGE
LCGE
LCGE
H
280.4
933.6
1686.1
3280.6
703.9
16.24
20.30
51.15
58.58
36.17
14.69
15.74
16.24
16.33
10.39
46.04
52.29
52.68
53.15
12.31
6.32
–1.56
3.12
3.43
2.21
17.39
16.06
17.78
18.14
12.26
12.62
13.00
13.82
14.17
10.57
15.76
19.62
49.52
56.71
36.67
–0.56
–0.76
–1.84
–2.11
+0.34
PGIM JENN HEALTH SCI;Z r
PGIM JENN MID-CAP GRO;A
PGIM JENN MID-CAP GRO;Z r
PGIM JENN NTRL RES;A
PGIM JENN SMALL CO;A
PGIM JENN SMALL CO;Z r
PGIM JENN UTILITY;A
PGIM JENN UTILITY;Z r
PGIM JENN VALUE;A
PGIM QUANT LCC;A
H
MCGE
MCGE
GNR
SCGE
SCGE
UT
UT
LCVE
LCCE
816.8
759.3
631.1
310.5
456.8
408.7
2411.2
300.8
397.7
465.7
44.94
14.32
20.04
50.92
18.90
22.43
12.95
13.01
20.02
18.57
10.48
10.92
11.02
–3.06
12.67
12.75
7.58
7.62
9.47
11.81
12.63
20.18
20.60
–2.18
11.48
11.85
–3.84
–3.62
14.41
26.36
2.49
0.55
0.87
15.72
5.26
5.61
3.37
3.66
9.82
10.71
12.58
14.66
15.03
14.95
13.72
14.12
7.90
8.24
11.32
14.25
10.90
9.36
9.69
1.43
8.73
9.07
7.46
7.79
7.01
10.78
45.57
13.81
19.34
50.07
18.32
21.75
13.03
13.09
19.92
18.24
+0.43
–0.60
–0.83
–1.07
–0.76
–0.90
+0.06
+0.06
–0.15
–0.38
PIMCO ALL ASSET;A
PIMCO ALL ASSET;I-2 r
PIMCO ALL ASSET;INST r
PIMCO ALL AST ATH;A
PIMCO ALL AST ATH;INST r
AGM
640.8
AGM
473.6
AGM 12203.3
AGM
266.0
AGM 1129.8
11.01
11.04
11.01
6.48
6.49
6.63
6.82
6.77
6.73
7.04
8.01
8.44
8.56
5.09
5.70
3.07
3.44
3.54
0.46
0.98
5.72
6.10
6.19
2.50
2.99
3.83
4.21
4.31
1.33
1.79
10.94
10.96
10.93
6.44
6.45
–0.10
–0.11
–0.11
–0.07
–0.06
PIMCO COMM RR STR;A
PIMCO COMM RR STR;I-2 r
PIMCO COMM RR STR;INST r
PIMCO COMM+ STRAT;I-2 r
PIMCO COMM+ STRAT;INST r
PIMCO INFL RSP MA;INST r
PIMCO RAE FDML AV+;INST r
PIMCO RAE PLUS;A
PIMCO RAE PLUS;INST r
PIMCO RE RL RTN;INST r
CMG
CMG
CMG
CMG
CMG
FX
EMN
LCVE
LCVE
RE
256.7
972.5
3695.1
1771.8
1969.2
1561.6
577.4
450.7
338.7
416.7
12.22
12.84
12.95
6.48
6.59
8.02
8.50
16.70
18.63
25.11
–3.32
–3.24
–3.20
–6.44
–6.31
5.52
2.04
12.78
12.89
17.89
–7.88
–7.66
–7.37
–0.85
–0.75
6.50
–1.75
17.90
18.52
12.30
9.88
10.26
10.41
20.59
20.80
4.77
3.13
10.87
11.34
6.85
8.28
8.67
8.78
13.74
13.83
6.71
–0.42
12.34
12.80
8.79
–1.07
–0.71
–0.61
1.71
1.82
4.24
–0.49
9.18
9.63
8.91
12.17
12.79
12.90
6.47
6.57
7.99
8.53
16.46
18.36
24.76
–0.15
–0.16
–0.15
–0.05
–0.06
–0.07
+0.03
–0.30
–0.33
–0.66
PIMCO S+ INTL(DH);A
PIMCO S+ INTL(DH);I-2 r
PIMCO S+ INTL(DH);INST r
PIMCO STK+ L DUR;INST r
PIMCO STK+ SMALL;INST r
IMLC
IMLC
IMLC
SESE
SCCE
352.6
732.0
1142.3
882.1
669.7
7.50
8.06
8.20
16.36
7.35
6.32
6.35
6.40
23.62
14.70
20.46
20.65
20.86
27.89
17.08
8.86
9.15
9.27
–2.96
0.54
11.06
11.37
11.50
13.59
9.06
7.53
7.85
7.95
13.51
7.05
7.47
8.03
8.16
15.82
7.09
–0.04
–0.05
–0.05
–0.71
–0.37
PIMCO STK+ABS RTN;A
PIMCO STK+ABS RTN;I-2 r
PIMCO STK+ABS RTN;INST r
PIMCO STOCKSPLUS;A
LCCE
LCCE
LCCE
LCCE
518.0
320.9
911.5
367.5
10.68
10.80
11.06
9.96
12.50
12.55
12.60
11.82
26.42
26.75
26.91
26.03
7.70
8.02
8.14
8.00
14.40
14.72
14.87
14.47
11.16
11.50
11.62
11.10
10.48
10.60
10.85
9.78
–0.23
–0.23
–0.23
–0.21
NAME
Data provided by
OBJ
LATEST
REPORTED
NAV
ASSETS
($ SHR)
($MIL)
12/29/23
QTR
RETURN THROUGH 12/29
1YR
3 YRS
5 YRS
(Annualized)
10YRS
LATEST WK’S DATA
(as of Thursday)
CLOSE
WK’S
NAV
CHG
PIMCO STOCKSPLUS;INST r
LCCE
1732.3
11.53
11.96
26.52
8.47
14.95
11.55
11.32
–0.24
PIMCO TRENDS MFS;INST r
PIONEER BAL ESG;A
PIONEER CORE EQTY;A
PIONEER DISC GRO;A
PIONEER DISC VAL;A
MFF
MTAM
LCCE
LCCE
MLVE
2396.0
272.8
1755.4
1772.4
261.4
10.75
10.28
20.76
16.30
13.70
–1.19
9.12
9.86
11.68
7.44
–4.19
15.62
18.18
28.66
8.19
7.09
4.34
7.09
8.12
7.63
6.61
9.24
14.29
18.14
11.28
5.02
7.08
10.11
12.82
7.76
10.66
10.14
20.40
15.90
13.67
–0.11
–0.15
–0.44
–0.47
–0.06
PIONEER EQTY INCOME;A
PIONEER FUND;A
PIONEER FUND;Y r
PIONEER MID CAP VAL;A
PIONEER SEL MC GR;A
EIEI
LCCE
LCCE
MCVE
MLGE
639.2
6482.6
961.6
687.4
1062.4
30.11
36.48
37.29
23.12
42.29
8.08
14.15
14.25
10.71
13.44
7.38
28.71
29.11
12.41
18.66
7.36
9.83
10.16
11.01
–4.16
9.15
16.55
16.90
12.26
10.18
8.14
12.00
12.32
7.28
8.49
29.98
35.72
36.51
22.76
40.77
–0.21
–0.91
–0.93
–0.49
–1.81
PIONEER SOL BALANCED;A
POLARIS GLOBAL VALUE
PRIMECAP ODYSSEY AG GR n
PRIMECAP ODYSSEY GROWTH
PRIMECAP ODYSSEY STOCK
MTAM
GMLV
MLGE
MLCE
MLVE
335.8
409.4
7187.3
6854.5
5794.6
10.93
30.95
42.91
36.74
35.08
5.81
12.27
10.27
11.14
10.21
11.74
14.77
25.03
23.87
21.23
4.69
5.23
1.28
7.94
10.57
7.77
8.82
10.60
12.73
13.58
4.38
6.57
10.85
11.65
11.30
10.85
30.62
41.71
36.10
34.67
–0.08
–0.94
–1.49
–0.81
–0.51
PRINCIPAL CAP APP;A
PRINCIPAL DVS INTL;INST r
PRINCIPAL EQTY INC;A
PRINCIPAL LCG I;INST r
PRINCIPAL LCG I;J
LCCE
ILCG
EIEI
LCGE
LCGE
1219.4
417.1
1213.4
2871.0
368.9
66.31
13.07
37.55
17.39
12.06
12.49
10.50
10.69
14.37
14.27
25.00
17.68
10.77
40.51
40.31
10.07
1.12
6.39
4.09
3.94
15.85
8.32
10.42
15.65
15.49
11.72
4.39
8.77
13.03
12.81
65.31
12.82
37.26
16.85
11.69
–1.17
–0.23
–0.34
–0.60
–0.42
PRINCIPAL LCS&P500;A
PRINCIPAL LCS&P500;INST r
PRINCIPAL LCS&P500;J
PRINCIPAL LCV III;INST r
PRINCIPAL LT 2020;INST r
SPSP
SPSP
SPSP
MLVE
MATB
697.5
4805.3
1025.1
2842.5
1491.0
23.31
23.30
22.97
18.00
12.00
11.56
11.61
11.56
9.00
8.30
25.74
26.03
25.83
9.97
12.25
9.53
9.79
9.60
9.11
1.60
15.19
15.48
15.27
11.13
6.95
11.53
11.84
11.59
8.81
5.30
22.91
22.91
22.58
17.87
11.84
–0.46
–0.46
–0.46
–0.17
–0.52
PRINCIPAL LT 2020;J
PRINCIPAL LT 2030;INST r
PRINCIPAL LT 2030;J
PRINCIPAL LT 2040;INST r
PRINCIPAL LT 2040;J
MATB
MATC
MATC
MATH
MATH
674.7
3689.7
1109.4
3117.3
815.1
11.90
13.48
13.42
15.22
15.02
8.12
9.91
9.88
10.93
10.83
11.99
15.13
14.94
18.36
18.10
1.40
2.60
2.42
3.81
3.59
6.78
8.68
8.51
10.14
9.95
5.09
6.33
6.12
7.18
6.96
11.75
13.26
13.21
14.94
14.75
–0.50
–0.58
–0.55
–0.61
–0.58
PRINCIPAL LT 2050;INST r
PRINCIPAL LT 2050;J
PRINCIPAL LT STR;INST r
PRINCIPAL MCG III;INST r
PRINCIPAL MCV I;INST r
MATE
MATE
MATJ
MCGE
MCCE
2394.9
270.9
479.5
1231.0
1189.3
15.94
15.28
10.90
11.49
16.35
11.68
11.61
7.62
13.17
10.50
20.40
20.09
10.93
20.59
11.07
4.62
4.40
0.22
0.85
11.06
11.07
10.85
4.58
13.64
13.07
7.70
7.41
3.65
9.54
8.65
15.62
14.98
10.77
11.07
16.04
–0.62
–0.57
–0.43
–0.49
–0.38
PRINCIPAL MIDCAP;A n
PRINCIPAL MIDCAP;J n
PRINCIPAL REAL EST;INST r
PRINCIPAL SAM BAL;A
PRINCIPAL SAM CSV B;A
MCGE
MCGE
RE
MTAG
MTAM
1799.3
346.1
3469.5
2073.0
527.1
36.72
35.17
27.79
15.34
11.73
14.76
14.80
15.33
9.85
8.60
25.55
25.70
13.33
15.64
11.69
6.33
6.49
5.78
3.03
1.27
15.11
15.29
8.48
7.70
5.51
11.36
11.53
8.64
5.79
4.41
35.54
34.04
27.43
15.12
11.59
–1.23
–1.18
–0.70
–0.41
–0.31
PRINCIPAL SAM CSV G;A
PRINCIPAL SAM FLEX;A
PRINCIPAL SAM STR G;A
PRINCIPAL SCV II;INST r
PRINCIPAL SMALLCAP;A
MTAG
MTAC
MTAA
SCCE
SCCE
1642.7
970.7
1214.8
271.4
272.4
17.86
11.62
20.50
12.17
24.46
10.91
7.67
11.62
14.22
11.32
18.93
9.06
21.42
20.01
15.34
4.52
0.16
5.48
12.96
3.17
9.68
3.88
11.38
12.97
11.16
7.04
3.43
7.82
7.95
7.51
17.58
11.51
20.14
11.79
23.68
–0.55
–0.28
–0.58
–0.53
–1.09
PRINCIPAL SMALLCAP;INST r
PROULTRANASDAQ;INV
PUTNAM ASST D AAB;A
PUTNAM ASST D AAC;A
PUTNAM ASST D AAG;A
SCCE
DL
MTAM
MTAC
MTAG
406.5
823.5
1261.8
343.9
1630.9
27.09
81.16
15.22
10.18
18.11
11.40
27.99
9.89
8.48
10.70
15.75
115.97
17.56
11.15
20.76
3.49
9.07
3.94
0.07
5.39
11.51
34.32
8.18
4.28
10.10
7.90
27.43
6.37
3.88
7.45
26.23
75.89
15.01
10.06
17.83
–1.20
–5.98
–0.25
–0.13
–0.33
PUTNAM CONV SEC;A
PUTNAM FOC INTL EQTY;A
PUTNAM GL HEALTH CR;A
PUTNAM INTL CP OPPTY;A
PUTNAM INTL EQUITY;A
CV
IMLC
GH
ISMG
IMLC
358.5
718.3
1383.5
259.9
580.0
23.16
14.60
57.73
39.10
25.11
7.29
10.81
7.85
12.21
9.58
10.13
19.04
9.03
15.22
18.62
–2.29
2.33
7.45
2.32
3.19
10.95
8.37
13.37
8.38
9.03
7.42
5.33
10.02
3.75
3.61
22.69
14.31
58.71
38.21
24.55
–0.57
–0.33
+0.98
–0.97
–0.53
PUTNAM LARGE CP GR;A
PUTNAM LARGE CP GR;R6 r
PUTNAM LARGE CP GR;Y r
PUTNAM LARGE CP VAL;A
PUTNAM LARGE CP VAL;C
PUTNAM LARGE CP VAL;Y r
PUTNAM RESEARCH;A
PUTNAM SM CAP GRO;A
PUTNAM SM CAP GRO;Y r
PUTNAM SSTNBL LDRS;A
LCGE
LCGE
LCGE
LCVE
LCVE
LCVE
LCCE
SCGE
SCGE
LCCE
6336.3
766.4
2017.3
9814.4
296.5
8525.2
389.7
442.8
685.3
5205.3
54.51
59.18
58.46
30.86
30.35
30.86
44.87
59.80
63.41
108.28
14.94
15.01
15.00
9.43
9.20
9.49
12.14
11.13
11.21
13.90
44.23
44.71
44.58
15.40
14.48
15.64
28.83
22.87
23.20
26.25
7.17
7.54
7.44
12.36
11.51
12.64
9.78
0.28
0.53
6.31
18.37
18.79
18.67
14.30
13.42
14.57
16.09
15.43
15.72
15.97
14.28
14.72
14.57
10.12
9.30
10.40
11.88
9.94
10.22
12.54
52.89
57.43
56.72
30.75
30.24
30.75
44.09
57.45
60.91
106.09
–1.79
–1.94
–1.93
–0.17
–0.18
–0.18
–0.91
–2.96
–3.14
–2.41
PUTNAM SSTNBL LDRS;Y r
PUTNAM SUSTAINBLE FT;A
RBB BP SCV2;INST r
RED OAK TECHNOLOGY SLCT
ROYCE FD PA MUT;INV
ROYCE FD PREMIER;INV
ROYCE FD SC OPPTY;INV
ROYCE FD SC SPEC EQ;INV
ROYCE FD SC TOT RET;INV
RUSS INV BAL STRAT;A
LCCE
MLGE
SCCE
TK
SCCE
SCGE
SCCE
SCVE
SCCE
MTAM
401.9
302.3
521.6
574.8
1401.8
1142.2
894.4
606.0
643.0
336.8
121.51
19.38
25.96
39.37
9.18
11.52
15.11
17.05
7.40
9.96
13.96
17.31
11.11
14.04
12.86
12.57
11.17
8.93
13.40
9.27
26.56
28.60
16.68
47.76
26.66
22.53
19.58
12.83
24.07
14.28
6.57
–3.50
9.11
8.32
8.64
6.42
9.07
8.99
10.62
2.90
16.26
12.24
11.06
16.61
13.11
12.51
16.05
9.39
11.65
5.30
12.82
8.18
6.90
15.25
8.02
8.19
8.65
5.96
7.41
4.04
119.06
18.68
25.16
37.90
8.81
11.04
14.48
16.68
7.16
9.81
–2.69
–0.82
–1.05
–1.65
–0.46
–0.60
–0.83
–0.51
–0.32
–0.17
RUSS INV EMERGING MKT;S r
RUSS INV GL RE SEC;S r
RUSS INV GLOBAL EQ;S r
RUSS INV GROWTH STR;A
RUSS INV INT DEV MKT;S r
EM
GRE
GMLV
MTAG
IMLC
518.6
260.5
778.4
336.1
797.7
15.10
29.28
9.27
11.45
41.38
6.72
14.58
10.59
10.10
9.81
8.36
10.29
22.42
17.42
16.27
–5.44
0.70
7.79
4.90
4.36
2.04
3.25
12.38
7.24
7.59
1.35
3.77
8.44
5.00
3.91
14.78
28.66
9.11
11.26
40.73
–0.32
–0.89
–0.18
–0.22
–0.61
January 8, 2024
BARRON’S
•
L19
Funds Quarterly
Stock Funds
s Copyright Lipper
For personal non-commercial use only. Do not edit or alter. Reproductions not permitted.
To reprint or license content, please contact Barron's reprints department at 800-843-0008 or www.djreprints.com
NAME
OBJ
LATEST
REPORTED
NAV
ASSETS
($ SHR)
($MIL)
12/29/23
QTR
RETURN THROUGH 12/29
1YR
3 YRS
5 YRS
(Annualized)
10YRS
LATEST WK’S DATA
(as of Thursday)
CLOSE
WK’S
NAV
CHG
NAME
Data provided by
OBJ
LATEST
REPORTED
NAV
ASSETS
($ SHR)
($MIL)
12/29/23
QTR
RETURN THROUGH 12/29
1YR
3 YRS
5 YRS
(Annualized)
10YRS
LATEST WK’S DATA
(as of Thursday)
CLOSE
WK’S
NAV
CHG
RUSS INV TM US LG CP;S r
RUSS INV TM US M&S CP;S r
RUSS INV US SM CP EQ;S r
RYDEX NASDAQ 2X;H
RYDEX NASDAQ-100;INV
LCCE
SCCE
SCCE
DL
LCGE
5533.5
1116.7
669.9
1018.5
1562.3
70.47
38.91
26.45
408.89
70.83
11.12
13.56
14.28
27.97
14.26
24.74
16.62
15.71
116.15
53.31
8.06
4.18
6.85
9.32
8.78
13.88
10.08
11.21
34.74
21.04
10.31
6.79
7.33
27.70
16.38
69.34
37.62
25.61
382.46
68.55
–1.32
–1.68
–1.15
–30.18
–2.60
T ROWE PRICE INT EU ST
T ROWE PRICE INT GGS
T ROWE PRICE INT GS
T ROWE PRICE INT IVE
T ROWE PRICE INT LT AM
EU
GMLG
GMLG
IMLV
LT
499.1
370.3
3064.2
321.6
328.8
23.96
36.17
57.29
16.15
22.64
12.09
8.81
12.41
8.69
17.07
19.01
19.19
25.70
19.15
34.67
2.26
–2.37
–0.15
7.15
4.67
8.83
11.91
15.31
8.61
5.22
3.57
9.45
12.10
3.26
2.43
23.41
35.46
55.85
15.97
21.89
–0.54
–0.78
–1.65
–0.15
–0.78
S BERNSTEIN EMG MKTS;EM
SB&H TRUST SC VALUE;INST r
SCHWAB CAP BAL
SCHWAB CAP CORE EQTY
SCHWAB CAP DIV EQ
EM
SCCE
MTAM
MLCE
EIEI
991.5
634.5
641.2
1305.2
484.6
25.40
13.83
15.54
20.09
14.18
7.05
9.76
9.55
10.63
9.11
10.44
11.95
17.88
22.79
6.90
–4.10
3.68
3.11
8.72
8.86
4.85
8.09
8.61
13.25
8.94
2.35
6.66
6.80
10.00
6.44
24.84
13.43
NA
19.70
14.17
–0.53
–0.55
NA
–0.45
–0.02
T ROWE PRICE INT NASIA
T ROWE PRICE INT OS
T ROWE PRICE INT STK
T ROWE PRICE LC GRO;I r
T ROWE PRICE LC VAL;I r
XJ
1074.9
ILCC 6708.2
IMLG 1767.1
LCGE 18724.5
MLVE 3265.1
15.81
12.47
19.10
65.78
22.44
5.91
9.80
11.06
14.26
11.24
0.80
16.31
16.41
46.21
9.69
–9.28
3.36
–0.15
5.29
9.54
4.16
8.19
7.85
15.92
11.40
4.19
4.36
4.94
13.99
8.73
15.42
12.25
18.71
64.07
22.31
–0.35
–0.21
–0.39
–1.90
–0.17
SCHWAB CAP FDM ITL LCI
SCHWAB CAP FDM US LCI
SCHWAB CAP FDM US SMCO I
SCHWAB CAP HEALTH CARE
SCHWAB CAP INTL IDX
IMLV
MLVE
SCCE
H
ILCC
2395.0
7826.8
1893.1
781.1
8823.9
10.50
24.27
16.54
25.36
22.56
9.18
11.19
14.64
6.13
10.87
19.92
18.15
20.14
0.65
18.17
8.10
13.13
10.27
5.76
4.08
9.26
15.29
12.60
9.45
8.24
4.80
10.85
8.54
9.48
4.30
10.37
24.03
15.98
25.86
22.20
–0.11
–0.31
–0.76
+0.50
–0.31
T ROWE PRICE MC GR
T ROWE PRICE MC VL n
T ROWE PRICE NEW ERA
T ROWE PRICE NH
T ROWE PRICE RET 2005
MCGE 12507.7
MCVE 4037.2
GNR 1036.7
MCGE 10411.4
MATA
834.2
100.04
31.20
37.24
56.22
11.51
11.72
13.20
–1.21
9.76
7.53
20.11
18.75
1.10
21.35
11.94
2.30
12.30
10.75
–5.70
1.46
11.82
13.23
9.10
12.74
5.98
10.61
9.45
2.97
11.53
4.73
97.23
30.71
37.13
53.91
11.37
–3.35
–0.69
–0.18
–2.85
–0.15
SCHWAB CAP INTL OPPS
SCHWAB CAP LG-CAP GRO
SCHWAB CAP MKTTRK AL E;I
SCHWAB CAP MKTTRK BAL;I
SCHWAB CAP MKTTRK GR;INV
IMLG
LCGE
MLCE
MTAM
MTAG
1047.5
327.0
832.6
571.6
910.6
19.95
27.74
21.90
18.77
24.79
9.87
13.17
11.82
9.54
10.65
12.49
38.27
20.86
14.61
17.78
–3.85
9.27
7.46
3.45
5.70
6.78
17.14
11.61
7.72
9.89
3.63
12.45
8.08
5.77
7.12
19.49
27.02
NA
NA
NA
–0.45
–0.79
NA
NA
NA
T ROWE PRICE RET 2010
T ROWE PRICE RET 2015
T ROWE PRICE R 2020
T ROWE PRICE R 2020;A
T ROWE PRICE R 2020;R r
MATA
MATF
MATB
MATB
MATB
2400.8
3628.6
8644.6
712.7
608.4
14.55
12.02
17.78
17.59
17.31
7.75
7.97
8.10
8.02
7.96
12.46
12.97
13.45
13.17
12.92
1.70
2.03
2.27
2.01
1.76
6.45
7.02
7.64
7.38
7.11
5.08
5.54
6.04
5.78
5.52
14.37
11.87
17.56
17.37
17.09
–0.19
–0.16
–0.25
–0.25
–0.25
SCHWAB CAP S&P 500 IDX
SCHWAB CAP SC IDX
SCHWAB CAP SM-CAP EQ
SCHWAB CAP TARGET 2020
SCHWAB CAP TARGET 2030
SPSP 80644.3
SCCE 5907.7
SCCE
582.3
MATB
343.4
MATC
983.3
73.10
32.51
20.04
12.78
15.47
11.69
14.07
13.33
8.37
9.59
26.25
17.06
19.88
12.84
16.39
9.97
2.27
10.09
1.21
2.79
15.66
10.05
11.11
6.07
8.22
11.97
7.21
7.62
4.86
6.18
71.87
31.40
19.43
NA
NA
–1.43
–1.61
–0.90
NA
NA
T ROWE PRICE R 2025
T ROWE PRICE R 2025;A
T ROWE PRICE R 2025;R r
T ROWE PRICE R 2030
T ROWE PRICE R 2030;A
MATG 9887.7
MATG
817.8
MATG
810.4
MATC 13451.2
MATC 1636.0
15.71
15.59
15.31
23.94
23.62
8.56
8.50
8.35
9.30
9.19
14.57
14.33
13.97
16.30
16.02
2.63
2.37
2.10
3.11
2.84
8.44
8.17
7.90
9.25
8.98
6.59
6.33
6.05
7.12
6.85
15.50
15.38
15.11
23.58
23.27
–0.23
–0.23
–0.23
–0.40
–0.40
SCHWAB CAP TARGET 2040
SCHWAB CAP TOT STK MKT
SCHWAB INV 1000 INDEX
SCHWAB INV GLBL REAL EST
SCHWAB SELECT LG CAP GR
MATH 1105.8
MLCE 20781.2
LCCE 14662.3
GRE
301.9
LCGE 2029.5
16.71
80.97
102.37
6.39
21.18
10.50
12.14
11.97
12.85
14.20
19.07
26.04
26.52
8.45
47.79
3.85
8.41
8.71
0.61
3.33
9.54
15.02
15.31
2.72
15.14
6.95
11.36
11.57
3.97
12.39
NA
79.40
100.46
6.27
20.55
NA
–1.91
–2.27
–0.17
–0.73
T ROWE PRICE R 2030;R r
T ROWE PRICE R 2035
T ROWE PRICE R 2035;A
T ROWE PRICE R 2035;R r
T ROWE PRICE R 2040
MATC
MATD
MATD
MATD
MATH
1478.9
9294.7
941.5
1007.4
9835.0
23.29
19.26
19.12
18.79
27.63
9.16
9.91
9.92
9.81
10.31
15.72
18.08
17.83
17.58
19.53
2.59
3.66
3.41
3.15
4.11
8.70
10.03
9.77
9.50
10.69
6.59
7.57
7.31
7.05
7.96
22.94
18.94
18.80
18.47
27.16
–0.40
–0.36
–0.36
–0.36
–0.54
SEI INST INTL EM EQTY;F r
SEI INST INTL INTL EQ;F r
SEI INST LG CAP GRO;F r
SEI INST LG CAP VAL;F r
SEI INST S&P 500;F r
EM
IMLC
LCGE
MLVE
SPSP
1322.7
3602.6
1282.6
1172.4
942.0
10.72
11.60
39.56
24.52
85.11
7.84
8.89
13.96
8.86
11.62
9.80
18.13
39.28
8.74
25.98
–5.41
2.96
7.52
9.67
9.73
3.47
8.27
17.27
9.56
15.41
1.91
4.09
12.44
7.17
11.69
10.48
11.49
38.51
24.48
83.67
–0.23
–0.14
–1.16
–0.10
–1.68
T ROWE PRICE R 2040;A
T ROWE PRICE R 2040;R r
T ROWE PRICE R 2045
T ROWE PRICE R 2045;A
T ROWE PRICE R 2045;R r
MATH
MATH
MATI
MATI
MATI
1360.5
1278.3
6143.3
739.6
775.4
27.28
26.96
19.92
19.72
19.38
10.22
10.18
10.54
10.48
10.44
19.27
18.95
20.46
20.17
19.89
3.86
3.59
4.53
4.27
4.00
10.41
10.14
11.18
10.90
10.62
7.69
7.42
8.21
7.94
7.67
26.81
26.49
19.56
19.37
19.03
–0.53
–0.54
–0.41
–0.40
–0.39
SEI INST SM CAP GR;F r
SEI INST SM CAP VAL;F r
SEI INST TX-MGD LGCP;F r
SEI INST TX-MGD S/M CP;F r
SEI INST US MGD VLTLTY;F r
SCGE
SCVE
MLCE
SCCE
MLVE
305.2
324.1
3501.4
724.6
532.4
32.51
24.63
33.56
24.46
14.06
12.22
13.07
11.05
11.81
6.65
13.71
15.50
17.38
12.92
3.71
–0.24
9.52
9.36
5.04
7.12
8.10
10.10
13.48
9.28
8.34
6.33
5.48
9.71
6.26
8.11
31.31
24.00
33.03
23.73
14.12
–1.60
–0.87
–0.60
–0.94
+0.05
T ROWE PRICE R 2050
T ROWE PRICE R 2050;A
T ROWE PRICE R 2050;R r
T ROWE PRICE R 2055
T ROWE PRICE R 2055;A
MATE
MATE
MATE
MATK
MATK
4989.0
944.6
887.6
3157.7
527.0
16.90
16.66
16.43
17.72
17.52
10.64
10.53
10.50
10.65
10.58
20.78
20.49
20.11
20.82
20.48
4.64
4.38
4.12
4.60
4.33
11.25
10.98
10.68
11.21
10.93
8.25
7.98
7.71
8.22
7.95
16.59
16.36
16.13
17.39
17.20
–0.35
–0.34
–0.34
–0.37
–0.36
SELECTED AMERICAN SHS;D
SELECTED AMERICAN SHS;S
SEQUOIA FUND
SHELTON EQTY INCOME;INV
SMEAD VALUE;I1 r
LCVE
LCVE
MLCE
EIEI
MLVE
1243.1
435.5
3099.4
556.2
4019.7
38.32
38.22
159.43
16.09
76.20
13.87
13.80
13.30
8.85
12.66
32.76
32.33
27.83
18.34
15.26
7.83
7.49
3.68
9.57
17.09
13.05
12.70
12.16
12.03
15.68
9.24
8.89
6.77
8.41
11.61
37.84
37.73
156.61
15.94
75.54
–0.64
–0.64
–3.26
–0.46
–1.07
T ROWE PRICE R BAL
T ROWE PRICE RE
T ROWE PRICE SC ALLOC
T ROWE PRICE SC STK n
T ROWE PRICE SC VAL
MATJ
RE
MTAC
SCGE
SCCE
1423.4
549.9
1050.9
2678.4
4542.6
12.76
12.12
18.81
58.00
51.99
7.25
17.38
7.37
14.60
13.14
11.33
13.12
11.96
17.43
12.22
1.69
7.29
1.17
1.72
4.69
6.21
6.03
5.89
11.96
10.19
4.71
6.26
4.93
9.18
7.21
12.62
11.94
18.59
56.04
50.51
–0.16
–0.31
–0.23
–2.61
–2.16
SOUND SHORE;INV
SOUTHERNSUN SC;I r
SPROTT GOLD EQUITY;INV
SS INST SMCP EQUITY;INV r
SS VARIABLE TR VIS;1
MLVE
SCCE
AU
SCCE
FX
499.2
272.6
539.3
1105.9
614.2
39.42
27.50
42.71
17.19
14.75
12.44
9.45
15.56
11.28
9.61
17.42
12.85
1.91
14.09
15.48
9.12
10.75
–7.94
5.45
3.04
11.54
16.11
6.81
11.33
6.16
7.87
6.17
2.66
8.06
4.92
39.05
26.44
40.81
16.57
14.51
–0.49
–1.35
–2.38
–0.83
–0.29
SS VARIABLE TR VIS;3
SSGA SS S&P 500 INDEX;N
STATE FARM BALANCED r
STATE FARM GROWTH r
T ROWE PRICE AC OPP
FX
SPSP
MTAM
LCCE
MLGE
750.4
1344.7
2284.0
6968.4
6459.3
14.74
225.43
84.13
106.21
63.94
9.58
11.66
7.67
12.50
10.68
15.21
26.15
13.68
20.74
29.03
2.79
9.85
6.51
10.72
7.05
5.90
15.59
10.77
14.98
19.11
4.66
11.90
7.89
10.67
14.71
14.50
221.63
83.25
104.53
62.71
–0.29
–4.43
–0.97
–1.88
–1.42
T ROWE PRICE BALANCED
T ROWE PRICE BC GRO
T ROWE PRICE BC GRO;ADV
T ROWE PRICE BC GRO;R r
T ROWE PRICE CAP APP;ADV
MTAG 2490.2
LCGE 28389.4
LCGE 1128.2
LCGE
727.9
MTAG
758.8
25.22
149.34
144.78
135.98
33.39
9.64
13.90
13.82
13.75
8.21
17.99
49.36
48.97
48.60
18.52
3.43
2.58
2.31
2.05
7.16
8.89
13.58
13.28
12.99
12.48
6.85
12.44
12.14
11.85
10.18
24.86
145.38
140.93
132.36
32.93
–0.39
–4.41
–4.29
–4.03
–0.52
T ROWE PRICE SCI&TCH
T ROWE PRICE SM ALLOC
T ROWE PRICE SMG ALLOC
T ROWE PRICE SPEC DE
T ROWE PRICE SPEC IE
T ROWE PRICE TOT EQ MK
T ROWE PRICE TX-EF EQ
T ROWE PRICE US ER
T ROWE PRICE US LCC
T ROWE PRICE VAL
TCW SELECT EQUITIES;I
TEMPLETON DEV MRKT;A
TEMPLETON FOREIGN;A
TEMPLETON FOREIGN;ADV r
TEMPLETON FOREIGN;R6 r
TK
MTAM
MTAG
MLCE
IMLC
MLCE
MLGE
LCCE
LCCE
LCVE
LCGE
EM
IMLV
IMLV
IMLV
4867.8
1067.8
1401.1
2004.1
615.6
2277.8
320.1
4371.6
1857.0
3288.6
488.3
685.1
1571.7
616.1
332.2
40.18
23.04
36.77
23.24
13.84
51.10
57.14
46.54
35.65
41.94
26.81
17.92
8.03
7.87
7.86
12.99
8.81
9.86
11.03
9.50
12.31
13.87
12.15
11.63
9.64
16.46
7.64
8.70
8.87
8.86
53.77
15.06
18.03
20.88
13.83
26.38
36.98
29.80
22.60
12.12
44.33
12.33
19.95
20.20
20.36
1.67
1.81
2.66
5.79
–0.68
8.41
5.18
10.49
9.33
8.88
4.94
–6.28
6.71
6.99
7.14
17.43
7.59
9.25
12.23
6.89
14.81
16.46
16.44
14.36
12.48
16.98
4.30
6.34
6.63
6.79
14.73
6.20
7.31
8.90
3.90
11.19
12.64
12.39
11.48
9.13
12.67
2.35
2.27
2.53
2.71
38.36
22.72
36.19
22.84
13.57
50.11
55.51
45.76
35.16
41.75
26.04
17.47
7.83
7.67
7.66
–2.12
–0.35
–0.65
–0.47
–0.25
–1.19
–1.82
–0.91
–0.53
–0.26
–0.79
–0.46
–0.20
–0.20
–0.20
T ROWE PRICE COMM/TECH
T ROWE PRICE DIV GR
T ROWE PRICE DIV GR;ADV
T ROWE PRICE DIV MC GR
T ROWE PRICE EI 500
TL
4593.5
LCCE 12291.1
LCCE
357.8
MCGE 1004.4
SPSP 7217.3
119.52
70.81
70.72
39.85
125.41
14.41
10.25
10.17
11.96
11.64
39.28
13.65
13.35
20.78
26.06
–3.18
8.74
8.46
1.17
9.80
13.31
13.93
13.63
13.48
15.47
11.83
11.27
10.97
10.77
11.80
116.65
70.01
69.92
38.56
123.30
–3.38
–0.87
–0.87
–1.52
–2.46
T ROWE PRICE EQ INC
T ROWE PRICE EXT EQ MK
T ROWE PRICE FINANCIAL
T ROWE PRICE GLBL TECH
T ROWE PRICE GS
EIEI
8359.6
MCGE
954.4
FS
734.7
GTK 2399.9
LCGE 12059.4
33.67
30.12
35.35
15.67
86.59
10.42
15.18
16.94
16.94
11.99
9.65
25.35
14.96
55.92
45.27
10.05
1.37
12.15
–8.61
1.44
11.32
11.72
14.05
12.45
13.33
7.98
8.39
10.13
14.37
11.71
33.58
29.05
35.33
14.96
84.12
–0.17
–1.44
–0.17
–0.78
–2.74
T ROWE PRICE GS;ADV
T ROWE PRICE GS;R r
T ROWE PRICE HLTH SCI
T ROWE PRICE I LC COR GR r
T ROWE PRICE I MCEQ GR nr
LCGE
LCGE
H
LCGE
MCGE
1354.5
662.4
9116.6
2940.2
5281.1
83.42
79.03
87.90
59.94
62.92
11.90
11.85
7.87
13.95
11.87
44.88
44.52
3.08
49.60
20.62
1.17
0.91
0.83
2.78
2.30
13.02
12.74
11.49
13.73
12.03
11.42
11.13
11.54
12.57
10.96
81.05
76.77
88.64
58.36
61.14
–2.64
–2.51
+0.44
–1.76
–2.12
TEMPLETON GLBL SM CO;A
TEMPLETON GROWTH;A
TEMPLETON GROWTH;R6 r
TEMPLETON WORLD;A
THIRD AVENUE RL EST;INST r
THIRD AVENUE VALUE;INST r
THORNBURG INC BLDR;A
THORNBURG INC BLDR;C
THORNBURG INTL EQ;A
THORNBURG INTL EQ;I r
THORNBURG S/M CP CR;A
THRIVENT FDS DVS I+;A n
THRIVENT FDS G STK;A n
THRIVENT FDS G STK;S
THRIVENT FDS LC GRO;A n
GSME
GMLV
GMLV
GMLV
GRE
GSME
GEI
GEI
ILCG
ILCG
SCCE
MTAC
GMLC
GMLC
LCGE
753.9
7664.3
254.8
2296.5
277.4
729.9
4136.2
502.2
393.6
1471.8
291.3
468.9
1495.4
427.4
441.2
9.39
25.55
25.64
15.00
21.69
64.54
23.87
23.83
24.02
25.01
66.65
6.88
25.82
26.20
14.93
13.84
11.58
11.69
14.62
20.67
9.26
8.33
8.11
8.68
8.78
9.84
7.16
11.25
11.35
14.01
16.64
20.98
21.34
32.30
23.27
20.16
18.00
17.08
15.28
15.53
13.14
9.65
21.67
22.09
46.09
0.70
3.94
4.25
3.30
5.73
19.98
9.12
8.30
0.87
1.17
1.19
0.58
5.75
6.10
5.65
7.56
6.40
6.73
5.81
5.62
16.00
8.72
7.92
10.07
10.41
8.32
4.19
10.66
11.04
17.20
3.95
3.22
3.57
3.06
4.02
7.54
6.06
5.28
4.61
4.96
7.40
3.59
7.51
7.90
12.95
9.05
25.09
25.18
14.61
21.01
64.34
23.92
23.89
23.84
24.83
64.11
6.81
25.38
25.75
14.57
–0.38
–0.50
–0.50
–0.43
–0.85
–0.27
+0.04
+0.04
–0.17
–0.18
–3.18
–0.11
–0.48
–0.48
–0.42
T ROWE PRICE I SC STK r
T ROWE PRICE IE IDX
T ROWE PRICE INST EME r
T ROWE PRICE INT DSC
T ROWE PRICE INT EMS
SCGE
ILCC
EM
ISMG
EM
4401.2
718.5
675.3
2717.5
864.5
26.63
15.60
32.01
62.99
34.63
14.58
10.80
5.69
11.35
5.63
17.55
18.04
2.22
13.14
2.06
1.73
3.85
–11.20
–5.40
–11.19
12.01
8.15
0.88
7.91
0.83
9.35
4.27
2.38
6.37
2.28
25.74
15.35
31.33
61.27
33.90
–1.19
–0.22
–0.62
–1.63
–0.67
THRIVENT FDS LC VAL;A n
THRIVENT FDS LC VAL;S
THRIVENT FDS MC STK;A n
THRIVENT FDS MC STK;S
THRIVENT FDS SC STK;A n
MLVE
MLVE
MCCE
MCCE
SCCE
296.8
1875.0
1424.6
2579.0
543.0
27.55
27.78
28.89
34.19
21.53
10.19
10.24
8.94
8.97
11.33
12.59
12.93
13.62
13.87
12.20
12.16
12.50
6.09
6.33
7.44
12.73
13.09
12.58
12.85
14.11
9.07
9.46
10.62
10.95
10.21
27.38
27.61
28.10
33.26
20.81
–0.24
–0.25
–0.98
–1.15
–0.94
TIAA-CREF LF STCK INDEX
TIAA-CREF EQ IDX;INST r
TIAA-CREF EQ IDX;RET r
MLCE
776.4
MLCE 14059.2
MLCE
742.2
39.17
33.67
34.23
12.07
12.08
12.00
25.91
25.91
25.59
8.53
8.54
8.25
15.09
15.12
14.84
11.41
11.45
11.17
38.42
33.03
33.58
–0.91
–0.78
–0.79
L20
BARRON’S
•
Funds Quarterly
January 8, 2024
Stock Funds
s Copyright Lipper
For personal non-commercial use only. Do not edit or alter. Reproductions not permitted.
To reprint or license content, please contact Barron's reprints department at 800-843-0008 or www.djreprints.com
NAME
OBJ
LATEST
REPORTED
NAV
ASSETS
($ SHR)
($MIL)
12/29/23
QTR
RETURN THROUGH 12/29
1YR
3 YRS
5 YRS
(Annualized)
10YRS
LATEST WK’S DATA
(as of Thursday)
CLOSE
WK’S
NAV
CHG
NAME
Data provided by
OBJ
LATEST
REPORTED
NAV
ASSETS
($ SHR)
($MIL)
12/29/23
QTR
RETURN THROUGH 12/29
1YR
3 YRS
5 YRS
(Annualized)
10YRS
LATEST WK’S DATA
(as of Thursday)
CLOSE
WK’S
NAV
CHG
–0.23
–0.38
–0.16
–0.17
–0.31
VALIC CO I LRG CPTL GRO
VALIC CO I MDCP INDEX
VALIC CO I MDCP STRAT GR
VALIC CO I SCI & TECH
VALIC CO I SM CAP INDEX
VALIC CO I STOCK INDEX
VALIC CO I SYSTEMATIC CR
VALUE LINE ASST ALL;INV
LCCE
SPMC
MCGE
TK
SCCE
SPSP
MLCE
MTAG
701.1
3044.7
970.3
2434.4
1027.8
5965.4
572.8
387.6
19.41
25.88
17.10
24.66
14.96
51.17
28.15
40.72
12.07
11.55
13.70
17.65
13.94
11.58
11.31
11.89
23.93
15.94
22.41
55.79
16.35
25.80
24.03
21.39
8.09
7.69
3.09
2.11
1.85
9.66
8.37
4.62
16.70
12.21
15.16
18.42
9.57
15.32
15.42
10.60
12.73
8.92
10.39
15.69
6.88
11.67
11.47
8.30
18.90
25.16
16.54
23.56
14.45
50.30
27.63
39.88
–0.53
–0.96
–0.66
–1.25
–0.75
–1.01
–0.61
–0.87
22.08
15.96
18.31
20.35
24.28
–0.32
–0.19
–0.25
–0.30
–0.42
VALUE LINE CAP APP;INV
VALUE LINE LG CO FC;INV
VALUE LINE MDCP FOC;INV
VALUE LINE SEL GRO;INV
VALUE LINE SMCP OPP;INV
MTAG
MLGE
MCGE
LCGE
SCGE
348.2
304.1
420.9
398.2
321.5
10.50
29.41
32.24
34.25
52.01
13.52
18.30
13.55
14.74
12.11
34.44
59.06
22.11
31.11
22.00
0.25
–0.05
9.81
8.90
4.37
11.07
12.87
16.53
16.78
12.49
8.67
11.89
12.76
11.92
9.61
10.26
28.27
31.23
33.39
50.36
–0.31
–1.39
–1.11
–0.89
–2.05
7.96
8.36
14.80
14.51
13.44
25.99
27.07
50.38
50.86
22.85
–0.48
–0.52
–1.65
–1.67
–0.86
16.54
16.52
10.88
10.61
12.50
12.23
6.08
6.55
7.34
8.20
9.11
10.34
10.07
10.83
10.16
13.14
13.10
8.36
8.09
7.95
7.68
4.91
5.25
5.73
6.24
6.74
7.53
7.26
7.63
7.45
22.61
22.73
22.89
23.38
19.88
19.80
11.65
12.50
13.27
13.97
14.82
10.00
15.62
12.50
19.13
–0.84
–0.85
–0.22
–0.23
–0.13
–0.13
–0.15
–0.16
–0.18
–0.21
–0.25
–0.18
–0.29
–0.24
–0.89
VANECK EMERG MKTS;Y r
VANECK INTL GOLD;A
VANECK INTL GOLD;Y r
VANGUARD 500 IDX;ADM
VANGUARD 500 IDX;INV nr
VANGUARD BAL IDX;ADM
VANGUARD BAL IDX;INST r
VANGUARD CAP;ADM n
VANGUARD CAP;INV n
VANGUARD CNSMR DIS;ADM
EM
318.2
AU
260.9
AU
273.3
SPSP 437896.5
SPSP 3105.3
MTAG 40403.0
MTAG 9513.4
MLCE 18523.8
MLCE 1335.9
CS
595.6
13.68
9.74
10.08
439.99
440.05
44.58
44.59
179.21
77.66
157.61
8.40
17.61
17.69
11.68
11.65
9.96
9.98
9.27
9.25
13.21
11.17
9.68
10.13
26.24
26.11
17.58
17.58
25.61
25.52
40.40
–9.70
–6.76
–6.45
9.96
9.85
3.73
3.74
7.88
7.80
4.36
2.28
9.60
9.95
15.65
15.53
9.61
9.62
14.45
14.37
16.53
1.21
4.99
5.32
11.99
11.88
7.73
7.74
12.69
12.61
12.34
13.52
9.29
9.61
432.59
432.65
43.90
43.91
176.64
76.55
151.55
–0.13
–0.52
–0.54
–8.62
–8.63
–0.80
–0.80
–3.12
–1.35
–7.19
VANGUARD CNSMR STP;ADM
VANGUARD DEV MKT;ADM
VANGUARD DEV MKT;INST r
VANGUARD DEV MKT;INST+ r
VANGUARD DIV A I;ADM
VANGUARD DIV EQTY;INV
VANGUARD DIV GRO;INV n
VANGUARD EM SEL STK;INV
VANGUARD EM ST I;ADM
VANGUARD EM ST I;INST r
CG
IMLC
IMLC
IMLC
EIEI
MLCE
EIEI
EM
EM
EM
1173.9
25104.8
13564.9
15920.5
13295.3
2460.7
51549.0
745.2
14987.5
6879.5
94.17
15.40
15.43
24.11
46.23
43.94
37.21
20.66
34.18
25.99
5.58
11.12
11.18
11.18
10.25
12.85
10.38
6.12
6.56
6.57
2.37
17.67
17.84
17.80
14.46
27.49
8.10
10.58
9.21
9.23
5.74
3.55
3.59
3.60
8.47
6.35
8.68
–3.68
–3.25
–3.21
10.58
8.36
8.41
8.40
13.83
15.32
13.50
4.67
4.66
4.70
8.33
4.54
4.56
I
10.69
11.13
10.76
2.98
2.98
3.02
94.27
15.13
15.15
23.68
45.71
42.91
37.03
20.22
33.68
25.61
+0.17
–0.25
–0.25
–0.39
–0.56
–1.23
–0.16
–0.41
–0.38
–0.29
–6.00
9.70
9.43
1.84
7.87
9.89
9.95
9.68
7.88
11.90
7.18
6.75
6.49
5.94
8.60
18.12
16.24
16.09
11.57
17.00
–0.86
–0.30
–0.30
–0.20
–0.82
VANGUARD EM ST I;INST+ r
VANGUARD ENERGY IDX;ADM
VANGUARD ENERGY;ADM
VANGUARD ENERGY;INV
VANGUARD EQUITY INC;ADM
EM
4072.5
NR
1766.1
GNR 3854.4
GNR 1876.5
EIEI 47377.3
86.44
58.60
87.26
46.51
84.27
6.55
–6.62
2.99
2.97
8.99
9.25
0.03
8.85
8.78
7.76
–3.19
36.53
19.87
19.77
10.63
4.72
13.27
6.19
6.11
11.85
3.03
2.66
0.37
0.29
9.70
85.19
58.96
87.93
46.87
84.24
–0.96
+0.17
+0.69
+0.37
–0.14
18.51
12.19
11.91
11.85
26.22
7.61
3.68
3.43
3.41
9.96
11.62
8.17
7.91
7.87
15.63
8.33
8.36
8.10
8.05
11.97
16.32
17.39
18.29
17.23
51.17
–0.79
–0.45
–0.47
–0.44
–1.02
11.59
14.03
13.91
12.72
12.62
25.89
17.04
16.74
22.49
22.20
9.67
2.34
2.06
8.40
8.12
15.34
10.08
9.81
15.05
14.76
11.69
7.33
7.06
11.00
10.72
50.80
21.93
22.06
25.33
25.87
–1.02
–1.12
–1.13
–0.50
–0.50
22.04
41.91
49.36
7.63
14.22
25.15
16.98
63.01
59.24
22.09
12.64
10.45
9.10
3.44
5.65
8.84
11.62
9.79
10.03
9.33
22.19
16.79
12.58
12.48
14.19
18.16
10.04
25.10
25.00
7.76
8.13
8.19
10.61
18.32
25.23
4.13
6.93
9.09
8.90
7.90
14.75
13.01
9.60
10.49
10.39
10.52
6.32
15.57
15.79
11.50
10.70
9.39
7.19
2.66
3.44
7.84
5.75
10.39
11.90
7.85
21.68
40.95
49.16
7.64
14.28
24.85
16.85
62.14
58.44
21.74
–0.42
–1.13
–0.23
+0.00
+0.08
–0.35
–0.18
–1.07
–0.97
–0.45
VANGUARD EQUITY INC;INV
VANGUARD EURO S;ADM
VANGUARD EURO S;INST r
VANGUARD EXPLORER VA;INV
VANGUARD EXPLORER;ADM
VANGUARD EXPLORER;INV
VANGUARD EXT MI;ADM
VANGUARD EXT MI;INS+ r
VANGUARD EXT MI;INST r
VANGUARD FINL INDX;ADM
VANGUARD FTSE SOC;INST r
VANGUARD FTSE XUS;ADM
VANGUARD FTSE XUS;INSP r
VANGUARD FTSE XUS;INST r
VANGUARD FTSEXUSSC;INS r
EIEI
EU
EU
SCCE
SCGE
SCGE
SCGE
SCGE
SCGE
FS
LCCE
IMLC
IMLC
IMLC
ISMG
4978.4
4601.5
793.7
906.5
16519.9
2959.0
21635.4
11083.8
14003.8
665.9
8005.2
7893.2
2981.4
4789.9
539.1
40.22
80.69
34.41
43.04
103.23
111.04
124.68
307.68
124.68
46.22
32.57
34.91
117.20
110.67
219.80
8.99
12.13
12.13
12.56
13.36
13.33
15.12
15.13
15.13
15.48
13.19
9.94
9.96
9.95
10.41
7.67
19.98
20.01
15.29
19.90
19.77
25.38
25.42
25.41
14.08
31.78
15.57
15.64
15.61
15.19
10.54
5.43
5.45
8.34
2.35
2.24
1.21
1.23
1.23
10.63
8.47
1.83
1.88
1.86
0.76
11.74
9.16
9.18
10.76
13.12
13.00
11.91
11.93
11.92
11.79
15.97
7.40
7.46
7.44
6.87
9.60
4.34
4.36
7.28
9.58
9.44
8.54
8.57
8.56
9.88
12.53
4.13
4.18
4.16
3.94
40.20
79.44
33.87
41.67
99.56
107.09
120.25
296.74
120.24
45.92
31.89
34.33
115.26
108.84
215.33
–0.07
–1.12
–0.48
–1.77
–4.70
–5.06
–5.98
–14.74
–5.98
–0.53
–0.79
–0.51
–1.71
–1.62
–4.24
VANGUARD GL CAP CYC;INV
VANGUARD GL MIN VOL;ADM
VANGUARD GLBL EQTY;INV
VANGUARD GRO & INC;ADM
VANGUARD GRO & INC;INV
GMLV
GSME
GMLC
LCCE
LCCE
1384.6
1691.9
7285.5
9539.4
3149.6
12.26
28.16
32.65
90.22
55.29
8.08
6.74
12.95
11.53
11.50
10.03
7.97
23.51
24.76
24.66
12.18
4.93
2.63
10.12
10.01
14.83
6.36
11.23
15.39
15.28
3.78
7.35
8.16
11.90
11.79
12.09
28.28
31.70
88.51
54.24
–0.19
+0.17
–1.07
–1.93
–1.18
3615.2
264.5
643.4
439.2
395.8
698.0
503.9
430.1
838.9
1311.1
52.13
36.59
35.92
23.31
12.77
14.43
5.58
10.10
13.36
12.02
12.64
13.74
13.67
12.84
22.91
23.02
11.78
8.29
11.10
9.97
27.46
24.71
24.51
23.44
51.66
52.05
15.71
10.23
20.04
15.70
7.42
2.43
2.28
4.66
–7.91
–7.68
6.77
–0.48
3.98
2.10
13.72
14.31
14.18
9.72
11.81
12.09
11.70
4.61
10.23
7.96
10.23
10.94
10.84
7.62
9.26
9.54
8.82
3.71
7.02
5.69
50.28
35.22
34.58
22.69
12.16
13.74
5.39
9.98
13.13
11.84
–2.20
–1.58
–1.55
–0.60
–0.72
–0.81
–0.25
–0.13
–0.25
–0.20
VANGUARD GRO IDX;ADM
VANGUARD GRO IDX;INST r
VANGUARD GRO IDX;INV nr
VANGUARD GXUS RE;ADM
VANGUARD HEALTH CARE;ADM
VANGUARD HEALTH CARE;INV
VANGUARD HLTH CR IDX;ADM
VANGUARD INDUS IDX;ADM
VANGUARD INFOTCH IDX;ADM
VANGUARD INS T STMK;INS+ r
LCGE
LCGE
LCGE
IRE
GH
GH
H
ID
TK
MLCE
64730.4
26836.7
408.2
300.7
37752.8
7076.3
2712.3
270.0
9465.3
28406.6
160.00
160.00
160.06
25.79
88.17
209.11
125.42
113.20
247.83
82.35
14.41
14.41
14.37
12.98
6.66
6.64
7.10
13.57
16.88
12.17
46.77
46.78
46.60
6.22
5.48
5.43
2.48
22.39
52.68
26.05
7.69
7.69
7.56
–4.47
6.09
6.04
5.28
10.57
11.87
8.47
19.16
19.17
19.02
–0.32
10.60
10.54
10.97
14.59
24.89
15.11
13.97
13.98
13.83
1.51
10.21
10.16
11.04
10.04
19.67
11.48
154.95
154.96
155.01
25.11
89.54
212.36
127.46
110.11
236.61
80.76
–5.67
–5.67
–5.68
–0.67
+1.31
+3.11
+1.86
–3.45
–12.53
–1.92
MTAM
MLGE
MTAM
MCVE
SCGE
GMLV
IMLV
GMLV
SCCE
SCCE
809.5
415.8
647.4
331.3
3738.6
384.7
5841.6
441.0
676.2
2537.1
11.00
25.41
31.93
27.04
41.00
17.01
27.36
18.52
77.11
79.76
9.00
20.09
9.56
8.74
12.65
7.86
5.71
6.93
15.23
15.32
12.66
47.30
18.43
11.96
21.16
12.70
12.47
15.20
14.07
14.45
0.69
–16.70
4.85
9.22
1.52
4.65
6.33
8.07
14.55
14.96
6.06
8.26
10.08
10.88
11.46
5.43
6.41
7.50
13.72
14.15
4.53
10.07
7.66
7.61
9.01
2.92
4.50
5.38
9.00
9.42
10.85
23.80
31.47
26.74
39.52
16.85
27.22
18.40
75.77
78.38
–0.16
–2.05
–0.52
–0.46
–1.93
–0.19
–0.16
–0.15
–2.04
–2.10
MLVE
EM
LCGE
ILCC
ILCG
IMLC
IMLV
627.5
719.0
1604.4
1925.6
400.9
427.9
507.7
11.80
5.85
13.15
8.02
11.09
24.07
9.96
9.67
6.95
14.55
10.47
12.93
11.64
6.07
12.56
12.11
46.94
17.25
17.66
18.35
14.38
9.00
–5.39
4.36
3.63
–3.94
3.56
2.93
9.97
3.30
16.27
7.70
9.54
8.68
5.91
8.15
1.89
12.40
3.95
5.62
6.96
1.64
11.79
5.74
12.72
7.90
10.76
23.65
9.83
–0.02
–0.11
–0.48
–0.11
–0.36
–0.40
–0.11
VANGUARD INS T STMK;INST r
VANGUARD INSTL INDX;INSP r
VANGUARD INSTL INDX;INST r
VANGUARD INTL EXPLRR;INV
VANGUARD INTL GRO;ADM
VANGUARD INTL GRO;INV
VANGUARD INTL VAL;INV
VANGUARD LG-CP I;ADM
VANGUARD LG-CP I;INST r
VANGUARD LS CONS GRO;INV
VANGUARD LS GROWTH;INV
VANGUARD LS INCOME;INV
VANGUARD LS MOD GRO;INV
VANGUARD MC G I;ADM
VANGUARD MC V I;ADM
MLCE 1279.9
SPSP 147550.7
SPSP 108747.9
ISMG 1394.2
ILCG 35588.7
ILCG 6658.7
ILCC 13297.0
LCCE 11447.4
LCCE 2531.5
MTAM 10007.3
MTAG 19443.4
MTAC 4141.6
MTAG 19934.0
MCGE 10341.0
MCVE 11402.8
82.37
393.47
393.48
17.03
101.81
32.02
40.36
110.27
453.84
20.37
41.44
15.17
30.45
94.53
75.08
12.17
11.68
11.68
12.46
11.37
11.34
9.27
11.97
11.97
8.43
10.36
7.51
9.40
13.11
11.51
26.05
26.26
26.24
15.28
14.81
14.66
16.15
27.28
27.28
12.48
18.55
9.48
15.49
23.14
9.76
8.47
9.98
9.96
–2.92
–7.61
–7.71
3.47
9.09
9.10
0.46
3.97
–1.34
2.21
1.82
9.18
15.11
15.67
15.66
5.12
10.62
10.50
7.77
15.60
15.61
5.52
9.83
3.27
7.68
13.70
11.31
11.47
12.02
12.00
3.57
7.09
6.96
3.78
11.90
11.91
4.76
7.36
3.36
6.09
10.12
8.49
80.78
386.85
386.86
16.52
98.77
31.06
39.60
108.35
445.94
20.12
40.76
15.01
30.01
91.33
74.29
–1.93
–7.72
–7.72
–0.50
–3.15
–1.00
–0.75
–2.25
–9.26
–0.29
–0.75
–0.18
–0.49
–3.82
–1.06
VANGUARD MD-CP I;ADM
VANGUARD MD-CP I;INST r
VANGUARD MD-CP I;INST+ r
MCCE 53834.5
MCCE 20598.1
MCCE 15650.9
288.07
63.64
313.84
12.27
12.29
12.28
15.98
16.00
16.00
5.49
5.50
5.51
12.71
12.72
12.73
9.41
9.42
9.43
281.90
62.27
307.12
–7.61
–1.68
–8.29
TIAA-CREF EQ IDX;RTL
TIAA-CREF GRO & INC;INST r
MLCE
LCCE
1461.6
1543.7
34.35
13.02
12.01
11.80
25.60
32.79
8.26
9.05
14.81
15.28
11.14
11.35
33.69
12.83
–0.80
–0.22
TIAA-CREF GRO & INC;RET r
TIAA-CREF GRO & INC;RTL
TIAA-CREF INTL EQ;INST r
TIAA-CREF INTL EQ;RET r
TIAA-CREF ITL EQ IX;INST r
LCCE
468.0
LCCE 1541.2
ILCC 2639.5
ILCC
328.0
ILCC 11621.0
13.50
22.06
13.00
13.59
21.86
11.73
11.70
8.89
8.86
10.83
32.48
32.42
16.89
16.62
18.20
8.80
8.78
2.31
2.06
4.12
14.99
14.96
8.85
8.59
8.25
11.07
11.03
3.57
3.32
4.40
13.30
21.73
12.80
13.38
21.51
TIAA-CREF ITL EQ IX;RET r
TIAA-CREF LC ID 2010;I r
TIAA-CREF LC ID 2020;I r
TIAA-CREF LC ID 2025;I r
TIAA-CREF LC ID 2035;I r
ILCC
MATA
MATB
MATG
MATD
1372.4
567.5
2864.1
5337.8
7253.2
22.44
16.13
18.53
20.61
24.66
10.75
7.47
8.28
8.67
9.79
17.93
11.42
13.07
14.19
17.25
3.87
1.12
1.74
2.24
3.58
8.00
5.99
7.03
7.82
9.57
4.14
4.96
5.71
6.25
7.37
TIAA-CREF LC ID 2040;I r
TIAA-CREF LC ID 2045;I r
TIAA-CREF LCG IDX;INST r
TIAA-CREF LCG IDX;RET r
TIAA-CREF LCG;INST r
MATH 7603.5
MATI 6258.3
LCGE 10729.6
LCGE 1025.1
LCGE 1566.0
26.42
27.54
51.84
52.33
23.62
10.37
10.66
14.21
14.13
15.43
18.98
20.07
42.63
42.29
47.04
4.43
5.05
8.81
8.54
4.91
10.52
11.29
19.44
19.14
16.83
TIAA-CREF LCG;RET r
TIAA-CREF LCG;RTL
TIAA-CREF LCV IDX;INST r
TIAA-CREF LCV IDX;RET r
TIAA-CREF LCV;INST r
TIAA-CREF LCV;RET r
TIAA-CREF LFCY 2015;RET r
TIAA-CREF LFCY 2020;RET r
TIAA-CREF LFCY 2025;RET r
TIAA-CREF LFCY 2030;RET r
TIAA-CREF LFCY 2035;RET r
TIAA-CREF LFCY 2040;INST r
TIAA-CREF LFCY 2040;RET r
TIAA-CREF LFCY 2045;RET r
TIAA-CREF MCG;INST r
LCGE
LCGE
MLVE
MLVE
LCVE
LCVE
MATF
MATB
MATG
MATC
MATD
MATH
MATH
MATI
MCGE
396.4
1265.3
7274.5
1480.4
2182.8
580.3
341.3
626.5
841.3
921.5
892.1
4656.8
1038.0
620.4
565.9
23.36
23.49
23.04
23.54
19.97
19.89
11.78
12.64
13.43
14.16
15.05
10.17
15.88
12.72
19.88
15.32
15.32
9.50
9.42
10.03
9.92
7.26
7.60
8.04
8.62
9.25
10.02
9.83
10.26
11.34
46.66
46.63
11.47
11.15
14.31
13.98
10.90
11.68
12.83
14.39
16.13
18.39
18.04
19.18
21.45
4.65
4.63
8.82
8.56
10.53
10.24
1.16
1.40
1.83
2.40
3.06
4.09
3.83
4.37
–5.77
TIAA-CREF MCG;RET r
TIAA-CREF MCV;INST r
TIAA-CREF MCV;RET r
TIAA-CREF MGD ALLOC;RTL
TIAA-CREF QNT SCE;INST r
MCGE
MCVE
MCVE
MTAM
SCCE
284.8
1063.2
425.3
772.9
1808.3
18.84
16.46
16.31
11.74
17.59
11.28
11.31
11.21
9.46
13.11
21.16
11.39
11.13
16.00
18.70
TIAA-CREF QNT SCE;RET r
TIAA-CREF REAL EST;INST r
TIAA-CREF REAL EST;RET r
TIAA-CREF REAL EST;RTL
TIAA-CREF S&P500 IDX;INS r
SCCE
RE
RE
RE
SPSP
417.9
2069.0
541.5
343.6
6349.7
16.89
17.62
18.54
17.46
52.05
13.07
17.03
17.01
16.98
11.68
TIAA-CREF S&P500 IDX;RET r
TIAA-CREF SCB IDX;INST r
TIAA-CREF SCB IDX;RET r
TIAA-CREF SOC CH EQ;INST r
TIAA-CREF SOC CH EQ;RET r
SPSP
SCCE
SCCE
MLCE
MLCE
2415.3
2748.0
672.7
4588.9
812.9
51.67
22.71
22.84
25.75
26.29
TIAA-CREF SOC CH EQ;RTL
TOCQUEVILLE TOCQ FD
TORRAY FUND
TORTOISE EGY INF & INC;I r
TORTOISE EGY INF TR;INST r
TOUCHSTONE BALANCED;A
TOUCHSTONE DIV EQ;C
TOUCHSTONE FOCUSED;Y r
TOUCHSTONE LRG CP FOC;A
TOUCHSTONE MC VALUE;INST r
MLCE
LCCE
LCVE
EMP
EMP
MTAG
LCVE
MLCE
LCCE
MCCE
630.8
449.6
324.2
426.8
1959.0
559.3
329.0
1103.7
1968.7
366.9
TOUCHSTONE MID CAP;Y r
TOUCHSTONE MID CP GR;I r
TOUCHSTONE MID CP GR;Y r
TOUCHSTONE NON-US ESG;A
TOUCHSTONE SEL GRO;A
TOUCHSTONE SEL GRO;Y r
TOUCHSTONE SMALL CO;A
TRANSAM AA CONSV;A
TRANSAM AA GROWTH;A
TRANSAM AA MODT GR;A
MCCE
MCGE
MCGE
IMLV
MLGE
MLGE
SCCE
MTAC
MTAA
MTAG
TRANSAM AA MODT;A
TRANSAM CAP GROWTH;A
TRANSAM MLT-MGD BAL;A
TRANSAM SM/MD CAP V;A
TROWE PRICE IE IUSSC
TWEEDY BROWNE INTL II-CU
TWEEDY BROWNE INTL VAL
TWEEDY BROWNE VALUE
UNDSC MGR BEH VAL;A n
UNDSC MGR BEH VAL;L nr
VALIC CO I DIV VALUE
VALIC CO I EMG ECONOMIES
VALIC CO I GROWTH
VALIC CO I INTL EQ IDX
VALIC CO I INTL GRO
VALIC CO I INTL SOC RESP
VALIC CO I INTL VALUE
January 8, 2024
BARRON’S
•
L21
Funds Quarterly
Stock Funds
s Copyright Lipper
For personal non-commercial use only. Do not edit or alter. Reproductions not permitted.
To reprint or license content, please contact Barron's reprints department at 800-843-0008 or www.djreprints.com
NAME
OBJ
LATEST
REPORTED
NAV
ASSETS
($ SHR)
($MIL)
12/29/23
QTR
RETURN THROUGH 12/29
1YR
3 YRS
5 YRS
(Annualized)
10YRS
LATEST WK’S DATA
(as of Thursday)
CLOSE
WK’S
NAV
CHG
VANGUARD MD-CP I;INV nr
VANGUARD MID-CAP GRTH
VANGUARD MTRLS IDX;ADM
VANGUARD PAC STK;ADM
VANGUARD PAC STK;INST r
VANGUARD PRIMECAP;ADM n
VANGUARD PRIMECAP;INV n
MCCE
404.9
MCGE 2793.3
BM
1079.5
PC
2307.9
PC
407.0
LCCE 63039.7
LCCE 4957.6
63.51
23.26
96.81
89.34
13.67
156.35
150.95
12.22
12.05
10.66
9.92
9.90
9.98
9.96
15.84
24.08
13.69
15.57
15.59
28.18
28.09
5.36
–1.62
8.50
–0.19
–0.17
9.88
9.81
12.57
10.90
13.52
6.38
6.41
14.76
14.68
9.27
8.25
8.33
4.50
4.53
13.07
12.99
62.15
22.33
94.84
87.29
13.36
154.57
149.23
–1.68
–1.10
–2.52
–1.90
–0.29
–2.06
–1.99
VANGUARD PRMCP CRE;INV n
VANGUARD RE IDX;ADM
VANGUARD RE IDX;INST r
VANGUARD RUS 1000 GI;INS r
VANGUARD RUS 1000 ID;INS r
VANGUARD RUS 1000 VI;INS r
VANGUARD RUS 2000 ID;INS r
VANGUARD RUS 3000 ID;INS r
VANGUARD S&P MC400;INST r
VANGUARD S&P SC600;INST r
MLCE 11626.9
RE
19480.3
RE
9412.3
LCGE 3858.6
LCCE 2032.8
MLVE 1320.8
SCCE
450.1
MLCE 1095.9
SPMC 1387.9
SCCE 1895.4
31.74
125.15
19.37
599.86
420.11
283.11
310.28
411.46
374.71
398.55
10.29
18.13
18.13
14.20
11.97
9.48
14.04
12.08
11.65
15.10
23.51
11.81
11.82
42.65
26.50
11.42
17.03
25.92
16.36
15.99
10.43
5.02
5.05
8.81
8.92
8.79
2.27
8.48
8.02
7.21
14.03
7.33
7.35
19.43
15.46
10.85
10.05
15.10
12.55
11.01
12.09
7.36
7.37
14.79
11.72
8.32
7.25
11.40
9.21
8.64
31.35
122.99
19.03
582.99
412.45
281.23
299.69
403.60
364.33
385.36
–0.47
–3.68
–0.57
–19.10
–9.12
–2.77
–15.36
–9.55
–13.78
–18.52
VANGUARD S-C ID;ADM
VANGUARD S-C ID;INST r
VANGUARD S-C ID;INST+ r
VANGUARD S-C ID;INV nr
VANGUARD SC G ID;ADM
SCCE 47117.5
SCCE 18837.6
SCCE 9616.1
SCCE
353.7
SCGE 12015.1
102.19
102.19
294.95
102.18
84.98
13.41
13.41
13.42
13.37
13.12
18.20
18.22
18.22
18.05
21.41
4.66
4.67
4.68
4.54
–2.78
11.70
11.72
11.73
11.57
10.54
8.43
8.44
8.46
8.30
7.86
98.87
98.87
285.38
98.86
81.59
–4.47
–4.47
–12.89
–4.47
–4.54
VANGUARD SC G ID;INS r
VANGUARD SC V I;ADM
VANGUARD SC V I;INS r
VANGUARD SEL VALUE;INV
VANGUARD STAR;INV
VANGUARD STR SC EQ;INV
VANGUARD STRAT EQTY;INV
VANGUARD T WLDSTK;INST r
VANGUARD TGT RET INC;INV
VANGUARD TGT RET2020;INV
VANGUARD TGT RET2025;INV
VANGUARD TGT RET2030;INV
VANGUARD TGT RET2035;INV
VANGUARD TGT RET2040;INV
VANGUARD TGT RET2045;INV
VANGUARD TGT RET2050;INV
VANGUARD TGT RET2055;INV
VANGUARD TGT RET2060;INV
VANGUARD TM BAL;ADM
VANGUARD TM CP APP;ADM
SCGE
SCCE
SCCE
MCVE
MTAG
SCCE
MCCE
GMLC
MATJ
MATB
MATG
MATC
MATD
MATH
MATI
MATE
MATK
MATL
MTAM
MLCE
3114.6
17757.5
5092.5
6357.9
22222.2
1307.0
7140.0
4335.0
35680.8
38096.5
73951.0
84828.9
86329.0
75757.2
72507.1
59982.4
39200.5
21275.6
8676.6
15419.5
68.06
77.34
43.23
28.90
26.85
37.42
34.36
209.99
13.02
26.87
18.38
35.48
22.12
39.30
26.66
44.44
49.59
45.69
41.19
247.12
13.15
13.63
13.61
15.44
10.40
15.65
13.49
11.26
7.34
8.00
8.87
9.53
9.82
10.23
10.57
10.79
10.78
10.79
9.14
11.92
21.44
15.99
15.99
25.33
17.11
21.28
19.21
21.89
10.74
12.51
14.55
16.03
17.14
18.34
19.48
20.17
20.16
20.18
15.53
26.64
–2.77
10.45
10.46
14.01
1.74
12.11
11.22
5.72
0.56
1.47
2.03
2.66
3.33
4.02
4.68
4.91
4.92
4.92
4.50
9.15
10.55
11.85
11.87
15.23
9.34
13.28
13.97
11.83
4.83
6.61
7.56
8.37
9.17
9.99
10.76
10.93
10.92
10.92
8.82
15.66
7.87
8.49
8.51
8.78
7.17
8.84
9.80
8.09
4.09
5.52
6.10
6.58
7.06
7.52
7.91
7.99
7.97
7.97
7.27
11.93
65.34
75.28
42.08
28.27
26.38
36.29
33.48
206.16
12.88
26.56
18.13
34.96
21.79
38.67
26.22
43.68
48.74
44.90
40.82
242.39
–3.64
–2.80
–1.56
–0.80
–0.54
–1.60
–1.17
–4.17
–0.15
–0.35
–0.28
–0.58
–0.37
–0.70
–0.49
–0.84
–0.94
–0.87
–0.43
–5.57
VANGUARD TM CP APP;INS r
VANGUARD TM SMCP;ADM
VANGUARD TM SMCP;INST r
VANGUARD TOT I S;ADM
VANGUARD TOT I S;INS r
VANGUARD TOT I S;INS + r
VANGUARD TOT I S;INV nr
VANGUARD TSM IDX;ADM
VANGUARD TSM IDX;INST r
VANGUARD TSM IDX;INV nr
MLCE 2611.5
SCCE 7179.3
SCCE
825.4
IMLC 69669.8
IMLC 37739.2
IMLC 30065.4
IMLC 176880.6
MLCE 323910.8
MLCE 77660.1
MLCE 20065.8
122.77
87.91
88.11
31.14
124.51
124.54
18.62
115.49
115.51
115.48
11.92
15.03
15.05
9.97
9.98
9.98
9.98
12.16
12.17
12.14
26.67
15.95
15.99
15.52
15.53
15.54
15.44
26.01
26.02
25.89
9.18
7.30
7.34
1.77
1.80
1.80
1.72
8.43
8.44
8.32
15.69
11.09
11.12
7.34
7.37
7.38
7.28
15.07
15.08
14.95
11.96
8.64
8.68
4.09
4.12
4.13
4.03
11.43
11.44
11.32
120.43
85.01
85.20
30.61
122.41
122.44
18.30
113.27
113.28
113.25
–2.76
–4.08
–4.09
–0.47
–1.86
–1.86
–0.28
–2.70
–2.70
–2.70
VANGUARD US GROWTH;ADM
VANGUARD US GROWTH;INV
VANGUARD UTIL INDX;ADM
VANGUARD VAL IDX;ADM
VANGUARD VAL IDX;INST r
VANGUARD WELLESLEY;ADM
VANGUARD WELLESLEY;INV
VANGUARD WELLINGTON;ADM n
VANGUARD WELLINGTON;I n
VANGUARD WINDSOR II;ADM
LCGE
LCGE
UT
LCVE
LCVE
MTAC
MTAC
MTAG
MTAG
LCVE
29202.2
8926.8
1382.8
32115.6
15321.7
42160.6
9298.6
91911.4
12831.1
43009.4
146.69
56.63
68.79
58.29
58.29
60.44
24.95
71.41
76.06
15.43
15.40
8.58
9.09
9.09
7.93
7.90
9.66
I
11.74
45.31
45.17
–7.45
9.24
9.26
7.10
7.00
14.43
I
21.07
–0.42
–0.52
3.18
10.61
10.62
1.90
1.83
5.33
I
10.72
15.91
15.80
6.36
11.73
11.74
5.99
5.91
9.66
I
14.96
13.00
12.87
8.55
9.72
9.73
5.48
5.40
7.96
I
10.14
141.52
54.63
69.66
58.24
58.23
60.04
24.79
70.45
40.80
75.15
–6.08
–2.35
+0.76
–0.16
–0.17
–0.49
–0.20
–1.09
–0.63
–1.08
VANGUARD WINDSOR II;INV
VANGUARD WINDSOR;ADM
VANGUARD WINDSOR;INV
VICTORY 500 INDEX;MEMBER
VICTORY 500 INDEX;REWARD
VICTORY AGGRSSV GR;FUND
VICTORY CAPITAL GR;FUND
VICTORY CORNERSTONE AGGR
VICTORY CORNERSTONE MA
VICTORY CORNERSTONE MODT
LCVE 11253.3
MLVE 17915.9
MLVE 4873.1
SPSP 4163.1
SPSP 6734.6
LCGE 1930.6
GMLC
853.9
MTAG
371.5
MTAM 2652.5
MTAM 1113.6
42.88
72.43
21.49
60.69
60.74
52.58
12.12
13.77
25.76
14.81
11.71
10.99
10.98
11.84
11.87
14.50
10.48
8.94
8.30
7.93
20.98
15.03
14.92
26.96
27.10
48.36
18.37
14.35
11.99
10.86
10.63
12.67
12.56
9.28
9.39
3.96
8.01
4.74
2.54
1.69
14.87
14.95
14.84
15.72
15.83
14.45
10.74
8.50
6.41
5.59
10.05
9.84
9.74
11.91
12.02
11.59
8.39
5.36
4.31
3.91
42.37
71.83
21.31
59.63
59.67
50.91
11.95
13.59
25.45
14.64
–0.61
–0.80
–0.24
–1.24
–1.25
–1.91
–0.17
–0.20
–0.35
–0.19
VICTORY EMERG MRKTS;INST r
VICTORY EXTND MRKT IDX
VICTORY GBL MGD VOL;INST r
VICTORY GR & TX STR;FUND
VICTORY GROWTH;FUND
VICTORY GROWTH;INST r
VICTORY GRWTH&INC;FUND
VICTORY INC STOCK;FUND
VICTORY INC STOCK;INST r
VICTORY INTNL;FUND
EM
MCGE
FX
MTAM
LCGE
LCGE
MLCE
EIEI
EIEI
IMLC
404.4
769.1
501.1
673.6
1873.8
412.4
1798.0
1677.0
854.2
1229.9
19.67
20.83
10.05
25.15
31.94
31.86
23.28
18.35
18.32
25.99
7.41
15.52
10.95
10.66
13.89
13.89
12.11
10.97
10.99
10.85
16.31
25.65
19.78
16.10
48.24
48.27
26.69
12.02
12.06
17.43
–2.75
3.34
7.01
3.91
5.48
5.50
8.20
10.71
10.74
4.26
5.79
13.12
9.73
8.04
15.47
15.50
12.62
10.98
11.00
7.52
2.51
8.90
5.99
6.90
12.52
12.57
9.46
8.64
8.68
4.39
19.24
20.16
9.91
24.91
31.05
30.98
22.85
18.27
18.23
25.58
–0.41
–0.92
–0.14
–0.28
–1.04
–1.03
–0.51
–0.13
–0.13
–0.35
VICTORY INTNL;INST r
VICTORY NASDAQ-100 IX;FD
VICTORY NASDAQ-100 IX;I r
VICTORY NASDAQ-100 IX;R6 r
VICTORY PRC MET&MIN;FUND
IMLC
LCGE
LCGE
LCGE
AU
1306.1
4623.2
772.7
303.6
456.0
25.88
42.08
42.13
42.09
17.00
10.88
14.46
14.47
14.51
15.40
17.49
54.41
54.46
54.63
6.70
4.34
9.68
9.68
9.83
–5.44
7.60
22.13
I
22.28
8.75
4.48
17.34
I
I
3.73
25.48
40.73
40.78
40.74
16.23
–0.35
–1.53
–1.53
–1.53
–0.86
NAME
Data provided by
OBJ
LATEST
REPORTED
NAV
ASSETS
($ SHR)
($MIL)
12/29/23
QTR
RETURN THROUGH 12/29
1YR
3 YRS
5 YRS
(Annualized)
10YRS
LATEST WK’S DATA
(as of Thursday)
CLOSE
WK’S
NAV
CHG
VICTORY SCI & TECH;FUND
VICTORY SML CP STCK;FUND
VICTORY SML CP STCK;INST r
VICTORY SUST WRLD;FUND
VICTORY TARGET MGD ALLOC r
TK
SCCE
SCCE
GMLC
MTAM
1062.2
597.1
407.3
1292.4
475.0
23.25
13.26
13.55
26.62
9.53
15.44
12.67
12.66
11.10
10.21
34.01
17.35
17.53
24.63
14.38
–8.85
3.51
3.59
5.53
3.49
10.87
11.83
11.93
12.43
9.04
11.53
7.20
7.32
8.18
I
22.28
12.79
13.07
26.17
9.41
–1.22
–0.64
–0.66
–0.49
–0.12
VICTORY TARGET RET 2030
VICTORY TARGET RET 2040
VICTORY TARGET RET 2050
VICTORY TARGET RET INC
VICTORY VALUE;FUND
VICTORY VALUE;INST r
VICTORY VAR RS LC ALPH;I
VICTORY ESTAB VAL;A n
VICTORY ESTAB VAL;I nr
VICTORY ESTAB VAL;R nr
MATC
MATH
MATE
MATJ
MLVE
MLVE
MLVE
MCCE
MCCE
MCCE
1207.2
1493.1
926.5
660.7
749.6
471.9
789.3
1563.2
4903.6
808.7
11.75
12.07
12.54
10.50
18.26
18.27
43.47
46.36
46.40
45.47
8.51
9.69
10.36
7.12
8.87
8.86
7.19
10.50
10.58
10.44
14.39
17.17
18.64
11.13
13.90
13.96
13.69
9.95
10.31
9.74
3.55
4.83
5.46
1.88
10.58
10.63
10.33
12.00
12.36
11.77
7.28
8.51
9.27
5.14
10.82
10.89
11.89
14.22
14.58
13.98
5.30
5.95
6.36
3.85
7.22
7.31
8.68
10.62
10.97
10.40
11.61
11.91
12.35
10.41
18.13
18.14
43.31
45.48
45.52
44.60
–0.15
–0.18
–0.21
–0.10
–0.18
–0.18
–0.24
–1.11
–1.11
–1.10
VICTORY ESTAB VAL;R6 nr
VICTORY INTEGRITY SCV;R6 r
VICTORY INTEGRITY SCV;Y r
VICTORY INTL SMCP;I nr
VICTORY INTL SMCP;Y nr
VICTORY INV GC;I r
VICTORY MULTI-CAP;A
VICTORY RS GLOBAL;Y r
VICTORY RS GROWTH;A
VICTORY RS INTERNATL;R6 r
MCCE
SCCE
SCCE
ISMG
ISMG
CV
MLCE
GMLG
LCGE
IMLC
9905.6
766.2
689.7
2505.3
716.3
253.3
381.5
396.6
253.4
266.4
46.42
35.18
34.85
14.50
14.43
16.78
47.23
20.44
24.64
11.60
10.59
12.00
11.94
9.96
9.94
5.25
9.28
11.88
13.61
12.03
10.35
17.80
17.65
15.45
15.29
8.30
24.52
26.93
44.65
20.17
12.40
13.35
13.21
–0.09
–0.23
2.22
10.93
8.16
4.97
5.07
14.62
12.71
12.57
8.04
7.88
7.55
14.26
14.16
15.29
I
I
7.66
7.50
5.62
5.46
7.29
10.29
10.36
11.28
I
45.55
34.29
33.98
14.20
14.13
16.65
46.46
20.12
23.89
11.42
–1.11
–1.29
–1.27
–0.30
–0.30
–0.18
–0.95
–0.34
–0.86
–0.15
VICTORY RS LG CP ALPHA;A
VICTORY RS SC GROWTH;A
VICTORY SM CO OPP;A n
VICTORY SM CO OPP;I nr
VICTORY SM CO OPP;R6 nr
MLVE
SCGE
SCCE
SCCE
SCCE
449.7
286.7
305.4
3352.0
3087.8
53.66
52.45
47.69
48.41
48.31
7.02
12.12
11.83
11.96
11.98
13.25
19.80
11.05
11.47
11.52
9.94
–12.47
8.96
9.36
9.40
11.44
4.97
11.30
11.70
11.75
8.30
5.78
9.09
9.46
I
53.47
49.97
46.04
46.73
46.63
–0.30
–3.20
–2.16
–2.19
–2.19
VICTORYII MKT NEU I;I r
VIRTUS CER LC VAL;I r
VIRTUS CER MC VAL;I r
VIRTUS KAR CAP GROWTH;A
VIRTUS KAR INTL SMC;I r
EMN
MLVE
MCCE
MLGE
ISMG
2934.6
380.9
1442.5
538.0
885.1
8.76
11.04
11.80
18.07
18.28
3.07
13.10
11.80
13.42
13.97
9.85
14.87
10.97
34.50
22.36
3.44
7.39
7.20
–1.33
–5.33
3.59
10.97
10.13
14.93
6.13
3.42
7.92
7.65
11.60
6.49
8.77
10.88
11.59
17.46
17.71
+0.02
–0.20
–0.27
–0.71
–0.61
VIRTUS KAR MID-CAP GR;A
VIRTUS KAR SM-CAP VAL;I r
VIRTUS KAR SM-CP G;A n
VIRTUS KAR SM-CP G;I nr
VIRTUS KAR SMCP CR;I nr
MCGE
SCCE
SCGE
SCGE
SCGE
318.6
634.4
418.9
2541.5
1287.6
55.06
24.32
31.58
33.20
52.06
9.64
14.95
5.87
5.94
14.49
22.00
19.15
20.03
20.36
32.38
–6.33
2.51
–4.56
–4.30
11.96
14.08
11.51
11.69
11.98
19.01
11.65
8.00
13.08
13.38
14.84
53.00
23.47
30.40
31.96
50.13
–2.58
–1.08
–1.59
–1.67
–2.38
VIRTUS SGA EM EQUITY;I r
VIRTUS SILVANT FG;A
VIRTUS TACTICAL ALL;A
VIRTUS VONTOBEL FO;I r
VIRTUS ZEVEN INN GRST;I r
EM
LCGE
MTAM
ILCG
MLGE
709.0
661.8
599.6
432.1
386.1
7.75
66.02
10.46
25.91
42.72
5.16
15.49
11.13
9.24
15.80
0.39
53.51
22.38
15.73
65.58
–10.34
6.96
–2.27
0.81
–12.65
–0.26
19.46
9.54
8.59
14.94
1.08
13.91
5.91
5.96
12.35
7.57
64.12
10.20
25.22
40.71
–0.19
–2.08
–0.30
–0.69
–2.50
VIRTUS ZVNBRGN TECH;A
VIRTUS ZVNBRGN TECH;INST r
VNFJ DIV VAL;A
VNFJ MID-CAP VAL;A
VNFJ MID-CAP VAL;INST r
TK
TK
EIEI
MCCE
MCCE
562.7
723.1
341.9
469.1
250.9
46.32
66.55
10.18
24.98
28.03
15.66
15.72
14.87
11.51
11.65
65.13
65.59
19.14
16.24
16.65
2.15
2.42
9.74
8.37
8.76
18.34
18.70
9.94
10.63
11.02
16.04
16.42
6.85
7.95
8.33
44.25
63.58
10.05
24.43
27.41
–2.37
–3.40
–0.18
–0.72
–0.81
VOYA LARGE-CAP GRO;I r
VOYA TRP GRO EQ;INL
WASATCH CORE GRO;INV
WASATCH MICRO CAP;INV
WASATCH MICRO CP V;INV
LCGE
LCGE
SCGE
SCGE
SCCE
333.9
1110.4
1842.3
546.5
256.3
46.40
85.11
86.29
6.84
3.36
14.04
12.61
17.15
12.69
13.13
38.19
46.89
33.43
22.58
13.13
4.78
1.55
3.75
–8.50
0.63
14.89
13.37
15.24
12.40
13.26
12.33
11.70
11.50
10.33
9.92
45.25
82.63
82.25
6.53
3.24
–1.28
–2.76
–4.98
–0.40
–0.16
WASATCH SM CAP GR;INV
WASATCH SM CAP VAL;INV
WASATCH ULTRA GRO;INV
WCM FOCUSED EM;INST r
WCM FOCUSED GL GRO;INST r
SCGE
SCCE
SCGE
EM
GLCG
896.6
601.6
833.1
1102.6
388.5
36.19
10.24
31.74
13.40
21.85
12.08
16.21
19.59
9.29
13.68
21.24
31.62
19.19
4.54
26.45
–7.77
8.98
–8.79
–10.71
0.27
11.18
12.48
12.41
5.98
13.47
8.63
9.64
11.62
3.38
10.01
34.41
9.86
29.98
12.95
21.34
–2.14
–0.50
–2.21
–0.45
–0.60
WCM FOCUSED ITL GRO;INST r
WCM FOCUSED ITL GRO;INV
WCM INTL SC GROWTH;INST r
WEITZ LG CAP EQ;INST r
WEITZ LG CAP EQ;INV
ILCG 16766.6
ILCG
720.6
ISMG
311.5
LCCE
346.2
LCCE
538.4
22.76
22.45
20.16
53.02
51.58
11.79
11.80
16.73
10.91
10.86
16.56
16.29
22.26
29.81
29.62
–1.02
–1.25
–6.21
8.43
8.27
11.73
11.48
13.04
15.27
15.06
8.44
8.18
I
I
9.09
22.28
21.96
19.38
51.66
50.25
–0.54
–0.54
–0.80
–1.59
–1.55
WEITZ MULTI CAP EQ;INST r
WEITZ PRTNRSIII OPP;INST r
WESMARK LARGE COMPANY
WESTWOOD INC OPP;INST r
WESTWOOD QUALTY SC;INST r
MLCE
LSE
LCCE
MTAC
SCCE
309.9
398.2
314.3
406.9
496.3
30.86
12.18
21.63
11.46
20.49
8.14
5.98
12.03
8.50
15.02
18.01
17.32
21.94
9.90
17.17
4.87
0.76
6.50
1.31
9.48
10.69
8.49
14.06
6.28
11.25
I
4.47
9.39
4.96
7.72
30.19
12.02
21.27
11.34
19.88
–0.75
–0.21
–0.43
–0.13
–0.83
WHITE OAK SELECT GROWTH
WILMINGTON INTL FND;INST r
WILMINGTON LC STR;INST r
WILMINGTON RL ASST;INST r
WM BLAIR EM MKT G;R6 nr
LCCE
IMLC
LCCE
RR
EM
375.7
519.9
535.7
388.7
639.5
128.73
8.64
27.51
13.57
11.74
11.44
8.83
11.89
5.76
9.14
26.47
12.55
26.22
1.14
10.26
6.40
–1.25
8.85
4.13
–8.65
12.12
5.63
15.37
5.23
6.62
10.70
3.24
11.75
3.16
3.83
126.17
8.53
27.01
NA
11.54
–3.02
–0.10
–0.60
NA
–0.20
WM BLAIR INST INTL GRO r
WM BLAIR INTL GRO;I nr
WM BLAIR INTL GRO;N n
WM BLAIR SM CAP GRO;I r
WM BLAIR SM CAP VAL;I r
IMLG
IMLG
IMLG
SCGE
SCCE
929.4
987.0
292.3
444.7
813.8
14.40
28.67
27.73
32.64
29.74
13.69
13.79
13.75
11.08
11.10
15.20
15.38
15.12
16.35
10.86
–3.32
–3.40
–3.65
1.17
8.46
9.38
9.23
8.93
11.96
10.60
4.75
4.60
4.29
9.92
7.74
14.02
27.91
26.99
31.09
28.77
–0.39
–0.78
–0.76
–1.91
–1.31
WM BLAIR SM-MD CP GR;I r
SCGE
1442.7
28.29
12.38
17.93
–0.44
11.30
10.10
27.16
–1.42
L22
BARRON’S
•
Funds Quarterly
January 8, 2024
Taxable Bond Funds
s Copyright Lipper
For personal non-commercial use only. Do not edit or alter. Reproductions not permitted.
To reprint or license content, please contact Barron's reprints department at 800-843-0008 or www.djreprints.com
NAME
OBJ
LATEST
REPORTED
NAV
ASSETS
($ SHR)
($MIL)
12/29/23
QTR
RETURN THROUGH 12/29
1YR
3 YRS
5 YRS
(Annualized)
10YRS
LATEST WK’S DATA
(as of Thursday)
CLOSE
WK’S
NAV
CHG
NAME
OBJ
Data provided by
LATEST
REPORTED
NAV
ASSETS
($ SHR)
($MIL)
12/29/23
QTR
RETURN THROUGH 12/29
1YR
3 YRS
5 YRS
(Annualized)
10YRS
LATEST WK’S DATA
(as of Thursday)
CLOSE
WK’S
NAV
CHG
AAM/HIMCO SHT DUR;I r
AB BOND INF STRAT;1 r
AB GLOBAL BOND;A
AB GLOBAL BOND;ADV r
AB GLOBAL BOND;I r
SID
IUT
GLI
GLI
GLI
360.7
339.4
340.0
3716.5
693.3
9.90
10.13
6.95
6.94
6.94
2.03
4.21
6.67
6.75
6.74
6.24
5.07
6.83
6.95
6.93
1.71
0.70
–2.43
–2.23
–2.23
2.48
3.85
0.89
1.11
1.10
I
2.70
1.98
2.25
2.25
9.89
10.08
6.89
6.89
6.89
+0.00
–0.04
–0.06
–0.06
–0.06
BNYM FLOAT RATE INCOME;Y r
BNYM GLOBAL FIXED INC;I r
BNYM HIGH YIELD;I r
BRIDGE BLDR CORE BOND r
BRIDGE BLDR CORE PLUS BD r
LP
591.1
GLI
1995.0
HY
490.2
MSI 16463.8
CPB 29871.5
11.04
19.86
5.36
9.03
8.89
3.58
6.88
6.45
6.88
6.85
13.28
7.79
12.31
6.45
6.56
5.49
–1.26
1.36
–2.87
–2.47
5.24
2.42
4.64
1.69
2.12
3.74
2.54
3.64
2.26
I
11.04
19.73
5.31
8.95
8.81
+0.01
–0.17
–0.06
–0.09
–0.10
AB GLOBAL BOND;Z r
AB HIGH INCOME;A
AB HIGH INCOME;ADV r
AB INTERM DURATION;ID
AB SH DUR HI YLD;ADV r
GLI
GHY
GHY
IID
GHY
787.8
851.9
1867.2
3588.7
631.4
6.94
6.92
6.93
11.43
9.24
6.75
7.45
7.50
7.02
5.75
6.98
14.33
14.59
5.45
11.82
–2.18
1.89
2.14
–3.45
1.88
1.15
4.35
4.61
0.94
4.05
2.30
3.68
3.94
1.90
3.31
6.89
6.85
6.86
11.32
9.17
–0.06
–0.07
–0.07
–0.12
–0.08
CALVERT FD CORE BOND;I r
CALVERT SOC INV BOND;A
CARILLON REAMS CR BD;I r
CARILLON REAMS CR+BD;I r
CARILLON REAMS UNCBD;I r
IID
IID
IID
CPB
ARB
729.1
316.9
431.4
1501.1
1277.8
15.98
14.56
10.89
30.07
12.25
6.43
6.90
6.88
7.18
6.19
6.05
7.30
5.41
6.27
8.53
–3.30
–2.03
–3.57
–2.78
1.01
4.67
1.83
2.24
3.01
4.01
I
2.28
2.14
2.53
2.39
15.85
14.44
10.79
29.79
12.18
–0.15
–0.13
–0.12
–0.33
–0.09
AB TAXABLE MLTI-SEC INC r
AMER CENT CORE +;INV
AMER CENT DIV BD;I r
AMER CENT DIV BD;INV
AMER CENT EM DEBT;G r
MSI
CPB
IID
IID
EMD
385.8
383.0
724.3
601.8
521.6
9.70
9.34
9.33
9.33
8.96
2.82
7.61
6.98
6.92
8.33
6.09
5.60
5.39
5.29
10.16
1.10
–3.44
–3.29
–3.48
–1.25
2.26
1.17
1.23
1.04
3.29
1.87
1.82
1.76
1.56
I
9.68
9.24
9.24
9.24
8.83
–0.01
–0.12
–0.11
–0.10
–0.12
CCM CMMNTY IMP BD;CRA r
COHEN&STEERS PREF S&I;A
COHEN&STEERS PREF S&I;C
COHEN&STEERS PREF S&I;I r
COLUMBIA BOND;I3 r
USM
FLX
FLX
FLX
IID
1172.8
725.7
261.4
5348.5
757.1
9.45
11.75
11.67
11.78
29.69
5.37
6.89
6.76
6.95
7.49
4.00
6.06
5.41
6.35
7.28
–2.82
–1.52
–2.15
–1.23
–3.41
0.13
3.61
2.94
3.90
1.52
0.97
4.48
3.81
4.81
2.12
9.39
11.70
11.62
11.73
29.40
–0.06
–0.06
–0.06
–0.06
–0.31
AMER CENT GL BOND;G r
AMER CENT GL BOND;INV
AMER CENT GNMA;INV
AMER CENT GOVT BOND;INV
AMER CENT HIGH INC;I r
GLI
GLI
GNM
IUG
HY
2669.7
375.6
359.8
255.6
449.2
8.74
8.69
9.05
9.56
8.59
6.90
6.69
7.53
6.70
7.00
7.53
6.58
4.70
3.49
13.70
–2.16
–2.98
–3.05
–3.64
2.39
1.52
0.69
0.07
0.27
5.45
I
1.75
0.86
0.99
I
8.67
8.62
8.94
9.47
8.49
–0.08
–0.09
–0.11
–0.10
–0.10
COLUMBIA CORP INCOME;I r
COLUMBIA FLTG RT;I r
COLUMBIA HY BOND;A
COLUMBIA LTD DUR CR;I r
COLUMBIA QUALITY INC;I r
BBB
LP
HY
SII
USM
683.5
309.0
457.5
262.3
300.3
9.19
33.66
10.83
9.73
17.91
8.30
2.72
6.67
4.17
8.63
9.58
12.00
12.07
6.76
4.27
–2.70
4.62
1.36
–0.14
–4.64
3.42
4.58
5.09
2.52
–0.36
2.95
3.79
3.98
2.02
1.25
9.08
33.66
10.71
9.68
17.70
–0.13
–0.01
–0.13
–0.05
–0.22
AMER CENT HIGH INC;Y r
AMER CENT INF-ADJ;G r
AMER CENT INF-ADJ;INV
AMER CENT INF-ADJ;R6 r
AMER CENT SD INF PRO;G r
HY
IUT
IUT
IUT
IUT
315.9
956.3
739.0
453.3
722.8
8.59
10.38
10.39
10.37
10.11
7.03
4.83
4.67
4.82
3.06
13.81
3.64
3.16
3.43
4.48
2.49
–0.85
–1.30
–1.06
2.57
5.56
3.19
2.72
2.98
3.73
4.58
I
1.92
I
I
8.49
10.33
10.35
10.32
10.08
–0.10
–0.07
–0.06
–0.07
–0.02
COLUMBIA SH TM BOND;I3 r
COLUMBIA STRAT INC;A
COLUMBIA STRAT INC;I r
COLUMBIA TOT RTN BD;A
COLUMBIA TOT RTN BD;I r
SID
MSI
MSI
IID
IID
266.5
965.5
3023.4
570.1
1415.9
9.62
21.84
21.39
30.61
30.62
3.50
6.97
7.03
8.03
8.10
7.46
9.86
10.13
7.66
7.89
1.12
–0.37
–0.11
–3.95
–3.72
2.44
3.14
3.38
1.60
1.86
1.74
3.20
3.46
2.14
2.40
9.59
21.64
21.19
30.28
30.29
–0.02
–0.20
–0.20
–0.36
–0.37
AMER CENT SD INF PRO;I r
AMER CENT SD INF PRO;INV
AMER CENT SD ST INC;I r
AMER CENT SHT DUR;INV
AMERICAN FUNDS BOND;A
IUT
IUT
SID
SID
IID
566.5
380.6
416.0
367.4
24250.4
10.10
10.01
8.93
9.79
11.49
2.90
2.87
3.32
3.02
6.69
4.00
3.82
5.82
4.70
4.71
2.10
1.98
0.63
0.46
–3.25
3.24
3.14
2.53
1.85
1.61
I
1.74
I
1.53
1.96
10.08
9.99
8.91
9.76
11.38
–0.01
–0.02
–0.02
–0.03
–0.12
COLUMBIA ULTRA ST;INST3 r
COLUMBIA US TRS IDX;I r
COMMERCE BOND
CRSBDG LW DR HI YLD;INST r
DELAWARE CORP BOND;A
USO
GUT
IID
HY
BBB
391.3
508.2
1111.6
649.5
400.4
9.17
10.05
17.87
9.72
15.46
1.82
5.60
6.71
2.54
7.86
6.27
4.06
6.58
7.63
7.19
2.39
–3.94
–2.56
5.28
–4.15
2.38
0.37
1.55
4.59
2.60
1.69
1.06
2.15
I
2.59
9.16
9.98
17.71
9.72
15.29
–0.01
–0.08
–0.17
+0.01
–0.20
AMERICAN FUNDS CWBD;A
AMERICAN FUNDS GOVT;A
AMERICAN FUNDS HI;A
AMERICAN FUNDS INTM;A
AMERICAN FUNDS STB;A
GLI
3526.5
GUS 2778.9
HY 10032.2
SII
8549.3
SUS 4292.3
16.63
12.17
9.50
12.55
9.51
8.99
5.92
7.04
4.46
2.45
5.81
2.79
12.07
4.43
3.93
–6.11
–3.18
3.30
–1.47
–0.31
–0.41
0.87
5.69
1.43
1.09
0.29
1.35
4.10
1.30
0.92
16.38
12.07
9.41
12.48
9.49
–0.28
–0.10
–0.09
–0.06
–0.02
DELAWARE CORP BOND;INST r
DELAWARE DVSFD INC;A
DELAWARE EXT DUR BD;INST r
DELAWARE HI YLD OPP;A
DELAWARE IVY HIGH INC;A
BBB
CPB
BBB
HY
HY
932.1
483.3
420.2
322.0
1120.9
15.46
7.71
14.78
3.46
6.06
7.93
7.42
12.61
6.78
6.75
7.46
6.40
9.64
12.89
12.18
–3.91
–3.28
–7.16
1.86
1.98
2.85
2.06
2.48
5.55
4.44
2.84
2.06
3.38
3.43
3.66
15.29
7.63
14.50
3.43
6.03
–0.20
–0.09
–0.38
–0.03
–0.03
AMG GW&K ESG BOND;N
ANGEL OAK MS INC;INST r
ASHMORE EM TOT RTN;INST r
AVE MARIA BOND
BAIRD AGGREGATE BD;INST r
BBB
270.1
MSI
2493.0
EMD
440.6
A
558.3
IID 41896.1
21.85
8.47
5.06
11.76
9.86
7.40
2.91
12.53
4.27
7.20
6.69
5.34
11.57
5.16
6.43
–2.94
–1.30
–7.48
2.17
–3.14
1.75
–0.17
–2.29
4.05
1.56
2.21
1.96
0.11
3.21
2.25
21.64
8.45
4.98
11.69
9.76
–0.25
+0.00
–0.09
–0.07
–0.10
DELAWARE IVY HIGH INC;I r
DELAWARE LTD-TM DVS;A
DFA 1-YEAR FIXED;I r
DFA 2-YEAR GL FIXED;I r
DFA 5-YEAR GL FIXED;I r
HY
SII
USO
GLI
GLI
1012.4
428.5
4553.8
4604.8
9377.2
6.06
7.83
10.20
9.67
9.96
6.81
3.02
1.34
1.39
1.44
12.46
5.08
4.98
4.95
5.00
2.23
0.05
1.16
0.60
–1.00
4.68
1.74
1.31
1.11
0.49
3.91
1.40
1.08
1.00
1.22
6.03
7.81
10.21
9.67
9.97
–0.03
–0.01
+0.01
+0.00
+0.01
BAIRD CORE PLUS BD;INST r
BAIRD INTMDT BOND;INST r
BAIRD SHORT-TERM BD;INST r
BBH LTD DURATION;N
BLACKROCK CORE BOND;A
CPB 26755.9
SII
8220.2
SID
9327.7
SID
444.8
IID
381.9
10.17
10.32
9.41
10.26
8.38
7.12
4.64
3.00
2.72
6.57
6.89
5.78
5.65
7.45
5.55
–2.67
–1.60
0.46
2.49
–3.71
2.01
1.84
2.04
2.93
1.08
2.54
1.98
1.78
2.23
1.62
10.08
10.27
9.39
10.25
8.31
–0.09
–0.04
–0.01
–0.01
–0.08
DFA INFL-PROT SECS;I r
DFA INT-TRM EXT QUAL;I r
DFA INTERMEDIATE GOVT;I r
DFA SELECT HEDGED GL r
DFA SH-TRM EXT QUAL;I r
IUT
BBB
IUG
GLI
SID
5278.2
1376.5
5626.6
1013.5
5866.5
10.83
9.63
11.05
9.09
10.28
4.58
8.33
5.61
1.90
1.88
3.93
9.61
4.59
5.55
5.44
–1.25
–3.49
–4.17
–0.62
–0.21
3.12
2.36
0.58
1.03
1.21
2.42
2.83
1.40
0.80
1.42
10.79
9.54
10.99
9.09
10.28
–0.07
–0.11
–0.08
+0.00
+0.01
BLACKROCK CORE BOND;I r
BLACKROCK CORE BOND;K r
BLACKROCK FLT RTE I;A
BLACKROCK FLT RTE I;INST r
BLACKROCK GL L/S CR;INST r
IID
IID
LP
LP
SFI
2818.6
720.2
335.1
2591.9
722.0
8.37
8.39
9.70
9.71
8.89
6.64
6.64
2.96
3.01
3.46
5.81
5.86
12.20
12.58
8.99
–3.48
–3.45
4.97
5.26
1.24
1.35
1.38
5.14
5.43
2.99
1.91
1.95
3.76
4.06
2.00
8.30
8.32
9.70
9.70
8.86
–0.08
–0.09
+0.00
+0.00
–0.02
DFA SHORT-TERM GOVT;I r
DFA WLD EX US GV FI;INST r
DODGE & COX GLOBAL BD;I
DODGE & COX INCOME;I
DOUBLELINE CR FXD IN;I r
SIU
1490.2
INI
1065.9
GLI
2219.9
IID 58108.6
CPB 6527.6
9.90
8.54
10.94
12.62
9.33
1.27
8.44
8.65
7.32
6.50
5.01
9.99
12.31
7.70
6.43
–0.30
–5.26
0.74
–1.66
–2.55
0.40
–0.38
5.12
2.70
1.08
0.69
2.25
I
2.79
2.14
9.91
8.46
10.81
12.50
9.26
+0.01
–0.13
–0.13
–0.14
–0.12
BLACKROCK HY BD;A
BLACKROCK HY BD;I r
BLACKROCK HY BD;K r
BLACKROCK INC;I r
BLACKROCK INF PR BD;A
HY
HY
HY
MSI
IUT
1106.9
11813.3
7720.0
693.4
336.9
7.04
7.04
7.04
8.96
9.49
6.73
6.82
6.85
6.01
4.30
13.34
13.56
13.68
9.35
3.44
2.16
2.50
2.56
–0.36
–1.24
5.29
5.61
5.72
3.44
3.00
4.21
4.55
4.64
3.30
1.92
6.96
6.97
6.97
8.90
9.46
–0.08
–0.08
–0.08
–0.07
–0.05
DOUBLELINE EM FXD INC;I r
DOUBLELINE FLEX INC;I r
DOUBLELINE INFRA INC;I r
DOUBLELINE LOW DUR BD;I r
DOUBLELINE LOW DUR BD;N
EMD
MSI
CPB
SID
SID
410.1
737.8
358.8
4685.7
757.0
8.73
8.51
9.26
9.57
9.56
7.04
3.47
6.25
2.73
2.56
9.63
7.83
8.88
6.76
6.50
–1.81
0.80
–1.20
1.52
1.26
2.10
2.48
1.96
2.25
2.00
3.12
I
I
2.07
1.82
8.68
8.50
9.21
9.56
9.55
–0.09
–0.06
–0.09
–0.04
–0.04
BLACKROCK INF PR BD;I r
BLACKROCK IS US AGB;K r
BLACKROCK LOW DUR;A
BLACKROCK LOW DUR;I r
BLACKROCK LOW DUR;K r
IUT
IID
SID
SID
SID
1206.2
2243.3
643.5
3493.8
613.1
9.77
9.10
9.00
9.01
9.00
4.35
6.61
3.11
3.29
3.30
3.73
5.59
5.39
5.77
5.82
–0.98
–3.39
–0.12
0.17
0.22
3.27
1.08
1.45
1.72
1.77
2.20
1.74
1.31
1.59
1.64
9.73
9.02
8.98
8.98
8.97
–0.06
–0.10
–0.02
–0.02
–0.02
DOUBLELINE TOT RTN;I r
DOUBLELINE TOT RTN;N
DWS GNMA;S
DWS HI INC;A
DWS SHORT DUR;S
USM 25652.2
USM 4521.4
GNM
439.9
HY
438.0
SID
273.7
8.84
8.83
11.89
4.37
8.33
6.43
6.37
7.23
6.15
3.23
5.33
4.95
4.94
11.45
6.34
–2.63
–2.91
–2.92
1.72
0.85
0.34
0.09
0.16
5.03
2.55
1.83
1.56
1.04
4.01
1.87
8.77
8.76
11.76
4.33
8.30
–0.11
–0.12
–0.13
–0.05
–0.03
BLACKROCK STR GL BD;I r
BLACKROCK TOT RTN;A
BLACKROCK TOT RTN;INST r
BNY MELLON BOND;M r
BNY MELLON INT BOND;M r
GLI
IID
IID
IID
SII
488.2
1278.2
10355.4
1228.3
492.7
5.32
10.04
10.03
11.05
11.85
8.23
6.66
6.64
6.65
3.60
6.75
5.64
5.84
5.48
5.26
–3.42
–3.63
–3.37
–3.52
–0.99
1.23
1.26
1.55
1.06
1.65
1.37
1.96
2.27
1.64
1.51
5.25
9.95
9.94
10.96
11.82
–0.09
–0.10
–0.11
–0.11
–0.03
EATON VANCE F-R&HI;I r
EATON VANCE FLT RT;A
EATON VANCE FLT RT;INST r
EATON VANCE FR AV;A
EATON VANCE FR AV;C
LP
LP
LP
LP
LP
8.32
8.70
8.42
10.06
10.04
3.50
2.86
2.94
3.28
3.15
12.16
11.83
12.21
14.04
13.49
4.40
4.25
4.55
5.11
4.56
4.80
4.34
4.60
5.09
4.57
3.92
3.52
3.78
4.13
3.61
8.30
8.70
8.41
10.05
10.03
–0.02
+0.00
–0.01
–0.01
–0.01
731.9
583.1
3185.2
1137.8
291.5
January 8, 2024
BARRON’S
•
L23
Funds Quarterly
Taxable Bond Funds
s Copyright Lipper
For personal non-commercial use only. Do not edit or alter. Reproductions not permitted.
To reprint or license content, please contact Barron's reprints department at 800-843-0008 or www.djreprints.com
NAME
OBJ
LATEST
REPORTED
NAV
ASSETS
($ SHR)
($MIL)
12/29/23
QTR
RETURN THROUGH 12/29
1YR
3 YRS
5 YRS
(Annualized)
10YRS
LATEST WK’S DATA
(as of Thursday)
CLOSE
WK’S
NAV
CHG
NAME
Data provided by
OBJ
LATEST
REPORTED
NAV
ASSETS
($ SHR)
($MIL)
12/29/23
QTR
RETURN THROUGH 12/29
1YR
3 YRS
5 YRS
(Annualized)
10YRS
LATEST WK’S DATA
(as of Thursday)
CLOSE
WK’S
NAV
CHG
EATON VANCE INC BSTN;A
EATON VANCE INC BSTN;I r
EATON VANCE SD G INC;A
EATON VANCE SD STR I;A
FEDERATED HRMS CRP B;A
HY
HY
SUS
MSI
BBB
591.4
3248.3
431.3
688.6
259.5
5.14
5.14
7.33
6.64
8.33
6.04
6.11
2.93
5.27
7.11
11.77
12.05
3.33
8.24
7.79
2.70
2.96
–0.19
2.25
–2.74
5.16
5.43
0.73
4.67
2.65
4.13
4.39
1.20
3.43
2.85
5.09
5.09
7.30
6.59
NA
–0.05
–0.05
–0.03
–0.04
NA
FIDELITY NEW MKTS INC
FIDELITY S05+YR INP BD I r
FIDELITY S5+YR INFP BD I r
FIDELITY SAI HIGH INCOME r
FIDELITY SAI LOW DUR INC r
EMD
IUT
IUT
GHY
SID
1629.9
6669.9
9235.2
1609.2
5985.9
12.42
9.47
7.66
8.88
10.06
11.98
2.55
6.31
6.40
1.69
13.97
4.65
2.81
10.76
5.70
–1.68
I
I
I
2.11
1.97
I
I
I
I
2.99
I
I
I
I
12.23
9.46
7.62
8.79
10.06
–0.20
–0.01
–0.08
–0.10
+0.00
FEDERATED HRMS CRP B;IS r
FEDERATED HRMS FRSI;IS r
FEDERATED HRMS GVULS;IS r
FEDERATED HRMS IN CB;IS r
FEDERATED HRMS IN HYB;IS r
BBB
LP
USO
BBB
HY
756.5
273.6
545.7
346.5
5464.8
8.33
8.69
9.81
8.49
8.84
7.04
2.39
1.85
5.39
6.83
7.93
9.53
5.10
6.40
13.12
–2.53
2.87
1.80
–1.67
1.65
2.91
3.12
1.80
2.33
5.06
3.08
2.95
1.27
2.35
4.44
NA
NA
NA
NA
NA
NA
NA
NA
NA
NA
FIDELITY SAI LT TBI r
FIDELITY SAI SHORT TMBD r
FIDELITY SAI TOTAL BD nr
FIDELITY SAI US TRS BD r
FIDELITY SH TERM BOND IX
GUT 4798.9
SID
3120.1
IID 20930.0
GUT 13013.4
SII
2348.4
7.55
9.65
9.07
8.82
9.76
12.88
2.77
6.83
5.53
3.35
2.69
5.20
7.31
4.18
4.90
–12.41
0.29
–2.09
–3.88
–0.67
–1.88
I
2.38
0.45
1.49
I
I
I
I
I
7.43
9.63
8.99
8.76
9.73
–0.20
–0.01
–0.10
–0.08
–0.03
FEDERATED HRMS IN HYB;R6 r
FEDERATED HRMS MTG STR
FEDERATED HRMS S-T I;IS r
FEDERATED HRMS SI TR;A
FEDERATED HRMS SI TR;IS r
HY
USM
SID
SID
SID
2145.7
905.2
843.6
323.8
401.6
8.84
8.53
8.40
10.04
10.04
6.83
7.57
2.96
3.45
3.51
13.13
5.18
5.36
4.80
5.17
1.63
–2.69
0.70
–0.57
–0.29
5.05
0.52
2.05
1.55
1.81
I
1.62
1.72
I
1.76
NA
NA
NA
NA
NA
NA
NA
NA
NA
NA
FIDELITY SH TR TRS BD IX
FIDELITY SH-TM BOND n
FIDELITY SRS BOND IDX nr
FIDELITY SRS INT DVMK BI r
FIDELITY SRS INV GD BD r
SUT 3492.2
SID
1675.7
IID 22731.3
INI
9347.6
IID 35594.0
10.12
8.39
9.07
8.74
10.10
3.25
2.84
6.63
6.62
6.92
4.47
5.34
5.52
7.99
6.79
–0.88
0.26
–3.39
I
–2.40
1.16
1.72
I
I
2.32
I
1.40
I
I
2.56
10.08
8.37
8.99
8.69
10.01
–0.03
–0.01
–0.10
–0.09
–0.10
FEDERATED HRMS STR I;IS r
FEDERATED HRMS SUS HY;A
FEDERATED HRMS TR BD;IS r
FEDERATED HRMS TR BD;R6 r
FEDERATED HRMS ULSH;A
MSI
HY
IID
IID
USO
364.3
305.2
9937.3
3109.3
328.5
8.05
6.73
9.58
9.58
9.17
8.07
7.30
6.60
6.72
1.88
9.75
12.42
5.17
5.18
5.74
–0.43
1.28
–2.67
–2.63
1.55
3.56
4.69
2.08
2.10
2.02
3.16
3.91
2.39
I
1.36
NA
NA
NA
NA
NA
NA
NA
NA
NA
NA
FIDELITY SRS LGTM TRS r
FIDELITY SRS SHTM CRDT r
FIDELITY SRS TRS BILL IX r
FIDELITY SUST BOND INDEX
FIDELITY TOTAL BOND
GUT 20661.3
SID
525.5
USO 1340.5
IID
366.6
IID 14278.4
5.86
9.85
9.94
9.34
9.59
12.39
3.00
1.48
6.51
6.82
3.24
6.07
5.13
5.43
7.23
–11.48
0.84
2.15
–3.45
–2.28
–1.40
2.33
1.95
0.94
2.31
I
I
I
I
2.58
5.77
9.82
9.94
9.25
9.50
–0.14
–0.02
+0.00
–0.10
–0.11
FEDERATED HRMS ULSH;IS r
FEDERATED HRMS ULSH;R6 r
FIDELITY ADV CORP BD;Z r
FIDELITY ADV CVS IN BD;Z r
FIDELITY ADV FLOAT;A
USO
USO
BBB
USO
LP
1762.6
556.2
600.8
329.0
620.0
9.17
9.17
10.53
10.06
9.31
2.03
2.03
8.49
1.65
2.72
5.90
5.91
9.00
I
12.10
1.71
1.72
–3.44
I
5.48
2.25
I
2.73
I
5.17
1.77
I
I
I
3.71
NA
NA
10.41
10.06
9.31
NA
NA
–0.15
+0.00
+0.00
FIDELITY TOTAL BOND K6 r
FIDELITY US BOND INDEX
FPA FLEXIBLE FXDINC;INST
FRANKLIN CUST GOVT;A1 n
FRANKLIN CUST GOVT;ADV r
IID
3243.8
IID 58462.0
MSI
907.0
GNM 1366.2
GNM
264.3
8.91
10.43
10.04
5.14
5.16
6.86
6.63
4.11
6.60
6.61
7.07
5.55
9.02
4.37
4.50
–2.20
–3.40
2.54
–2.86
–2.71
2.42
1.06
3.22
0.00
0.14
I
1.78
I
0.69
0.83
8.83
10.33
10.01
5.08
5.10
–0.09
–0.12
–0.02
–0.06
–0.06
FIDELITY ADV FLOAT;I r
FIDELITY ADV FLOAT;Z r
FIDELITY ADV GVT INC;Z r
FIDELITY ADV HI ADVT;A
FIDELITY ADV HI ADVT;I r
LP
LP
GUS
HY
HY
2097.6
2569.8
1547.2
497.2
806.5
9.29
9.29
9.28
11.26
10.49
2.78
2.81
6.19
6.48
6.41
12.40
12.49
4.19
12.44
12.63
5.75
5.81
–3.75
3.86
4.09
5.44
5.54
0.30
7.40
7.67
3.96
I
I
5.56
5.81
9.29
9.29
9.21
11.14
10.38
+0.00
–0.01
–0.08
–0.13
–0.13
FRANKLIN HIGH INC;A1 n
FRANKLIN HIGH INC;ADV r
FRANKLIN INV FLOAT;A
FRANKLIN INV FLOAT;ADV r
FRANKLIN INV LD GV;A
HY
HY
LP
LP
SUS
1279.6
308.8
880.2
331.4
280.4
1.72
1.71
7.74
7.75
7.52
6.62
6.69
2.80
2.86
2.43
13.84
13.35
14.80
15.07
3.95
2.73
2.69
6.93
7.19
0.16
5.75
5.79
3.87
4.13
0.72
3.78
3.87
3.15
3.42
0.44
1.70
1.70
7.74
7.74
7.52
–0.02
–0.01
+0.00
–0.01
+0.00
FIDELITY ADV HI ADVT;Z r
FIDELITY ADV INV GRD;I r
FIDELITY ADV INV GRD;Z r
FIDELITY ADV LTD TB;A
FIDELITY ADV LTD TB;I r
HY
IID
IID
SII
SII
417.6
1822.6
1587.0
308.4
490.4
10.50
7.26
7.27
11.17
11.20
6.54
6.87
6.90
3.57
3.64
12.85
6.43
6.72
5.95
6.25
4.22
–3.02
–2.85
–0.71
–0.44
7.79
1.92
2.08
1.65
1.91
I
2.22
I
1.45
1.71
10.38
7.20
7.20
11.13
11.16
–0.13
–0.07
–0.08
–0.03
–0.03
FRANKLIN INV LD TR;A
FRANKLIN INV TR;A
FRANKLIN INV TR;R6 r
FRANKLIN STR INC;A
FRANKLIN STR INC;ADV r
SID
CPB
CPB
MSI
MSI
1463.7
2574.3
403.7
2155.8
280.4
8.91
8.36
8.43
8.31
8.32
2.70
6.44
6.62
5.77
5.82
5.39
5.71
6.17
8.42
8.53
0.54
–3.74
–3.40
–0.39
–0.14
1.82
0.84
1.22
2.04
2.29
1.40
1.30
1.80
1.77
2.03
8.89
8.29
8.36
8.24
8.26
–0.02
–0.09
–0.08
–0.07
–0.06
FIDELITY ADV NM INC;I r
FIDELITY ADV NM INC;Z r
FIDELITY ADV STR IN;A
FIDELITY ADV STR IN;FSIF
FIDELITY ADV STR IN;I r
EMD
EMD
MSI
MSI
MSI
742.8
1704.6
1614.6
5426.9
4390.0
12.42
12.42
11.24
11.40
11.40
11.98
12.10
6.70
6.79
6.78
13.95
14.07
9.19
9.54
9.49
–1.70
–1.60
0.11
0.40
0.35
1.95
2.05
3.56
3.86
3.81
I
I
3.22
I
3.47
12.23
12.22
11.13
11.29
11.29
–0.20
–0.21
–0.12
–0.13
–0.13
FROST LOW DUR BD;INST r
FROST TOT RTN BD;INST r
GLENMEDE CORE FXD INC
GMO EMER CTRY DBT;III r
GMO EMER CTRY DBT;IV r
SII
CPB
IID
EMD
EMD
284.9
2607.8
388.3
1338.4
784.6
9.78
9.58
9.52
18.48
18.44
2.94
5.50
6.60
11.88
11.88
5.71
8.64
4.69
17.64
17.71
0.09
2.10
–4.07
–0.95
–0.90
1.53
3.02
0.32
3.55
3.61
1.52
3.08
1.10
4.28
4.34
9.76
9.54
9.44
18.21
18.17
–0.01
–0.06
–0.11
–0.27
–0.28
FIDELITY ADV STR IN;M
FIDELITY ADV STR IN;Z r
FIDELITY ADV TOT BD;A
FIDELITY ADV TOT BD;I r
FIDELITY ADV TOT BD;M
MSI
MSI
IID
IID
IID
613.8
1049.2
900.9
10328.0
299.2
11.23
11.41
9.60
9.58
9.58
6.71
6.80
6.86
6.94
6.87
9.20
9.60
6.91
7.18
6.92
0.09
0.45
–2.54
–2.31
–2.55
3.56
3.93
2.02
2.28
2.00
3.22
I
2.28
2.54
2.28
11.12
11.30
9.51
9.49
9.49
–0.13
–0.13
–0.10
–0.10
–0.10
GMO US TREASURY r
GOLDMAN CORE FXD INC;I r
GUGGENHEIM FR STRAT;INST r
GUGGENHEIM TR BD;A
GUGGENHEIM TR BD;INST r
SUT
437.0
IID
533.6
LP
798.3
CPB
470.6
CPB 20961.1
5.00
9.30
24.60
23.80
23.82
1.37
7.16
2.48
6.95
7.02
5.57
6.33
12.96
7.11
7.42
2.08
–3.55
5.60
–3.51
–3.23
1.94
1.60
5.10
1.50
1.80
1.31
2.00
4.06
2.86
3.18
5.00
9.21
24.60
23.60
23.62
+0.00
–0.10
+0.00
–0.24
–0.24
FIDELITY ADV TOT BD;Z r
FIDELITY CAPITAL & INC
FIDELITY CORPORATE BOND
FIDELITY EM MKTS DEBT r
FIDELITY EM MKTS DEBT LC r
IID
8193.4
HY 12306.1
BBB
885.3
EMD 1282.6
EML
404.0
9.58
9.65
10.53
7.75
9.37
6.97
6.43
8.47
10.33
8.77
7.33
12.99
8.79
12.47
13.53
–2.17
4.14
–3.52
–1.48
–1.47
2.40
8.17
2.63
2.05
I
I
6.14
3.00
3.40
I
9.49
9.54
10.42
7.62
9.24
–0.10
–0.12
–0.14
–0.13
–0.11
GUIDESTONE LD BD;INST r
GUIDESTONE MD BD;INST r
GUIDESTONE MD BD;INV
HARBOR CORE PLUS;INST r
HARTFD FLOAT RATE;A
SID
IID
IID
CPB
LP
670.6
2069.3
389.1
963.2
556.8
12.81
12.87
12.87
10.19
7.90
2.85
7.22
7.16
6.76
2.58
5.09
6.28
6.01
6.70
10.96
0.12
–3.85
–4.11
–2.74
3.62
1.54
1.28
1.01
1.66
4.06
1.45
1.94
1.66
2.11
3.18
12.78
12.74
12.74
10.11
7.90
–0.02
–0.13
–0.13
–0.10
+0.00
FIDELITY FLEX CONS INC B r
FIDELITY FLEX US BOND IX r
FIDELITY FLOAT RATE HI
FIDELITY HIGH INCOME
FIDELITY INC GNMA
USO
IID
LP
HY
GNM
348.6
1873.5
7633.3
2395.7
2208.7
10.03
9.18
9.30
7.64
10.26
1.79
6.64
2.79
6.34
7.51
5.93
5.45
12.55
10.96
5.43
2.52
–3.43
5.79
0.59
–2.48
2.42
1.04
5.51
3.56
0.34
I
I
4.02
3.46
1.30
10.02
9.10
9.30
7.57
10.14
–0.01
–0.10
+0.00
–0.08
–0.12
HARTFD FLOAT RATE;I r
HARTFD SHORT DUR;A
HARTFD SHORT DUR;I r
HARTFD STRAT INCOME;A
HARTFD STRAT INCOME;I r
LP
SID
SID
MSI
MSI
499.5
802.8
381.6
274.3
1285.9
7.81
9.57
9.52
7.70
7.73
2.68
3.35
3.50
7.20
7.41
11.16
6.78
7.18
9.45
9.92
3.87
0.49
0.79
–1.65
–1.33
4.32
2.24
2.55
3.58
3.88
3.45
1.78
2.08
3.28
3.57
7.81
9.55
9.49
7.64
7.67
+0.00
–0.02
–0.02
–0.06
–0.05
FIDELITY INC GOVT INC
FIDELITY INC INT GVT INC
FIDELITY INFL PROT BD IX
FIDELITY INT BOND
FIDELITY INT TRS BD IDX
GUS
SIU
IUT
SII
GUT
1528.1
438.3
9885.8
3453.1
8192.0
9.27
9.73
9.04
10.10
9.75
6.30
4.02
4.50
4.44
5.74
4.21
3.86
3.78
5.54
4.06
–3.81
–2.37
–1.12
–1.68
–4.14
0.23
0.57
3.04
1.78
0.61
1.08
0.93
2.35
1.84
I
9.19
9.69
9.01
10.05
9.69
–0.09
–0.05
–0.05
–0.05
–0.08
HARTFD TOT RTN BD;A
HARTFD WORLD BOND;A
HARTFD WORLD BOND;I r
HARTFORD TOT RTN HLS;IA
HARTFORD ULTSH BD HLS;IA
IID
GLI
GLI
IID
USO
1040.8
255.5
1123.1
1625.0
486.3
9.19
9.97
10.08
9.57
10.34
7.28
4.90
4.92
7.41
1.97
6.54
3.86
4.23
6.97
5.18
–3.36
–0.53
–0.24
–3.13
1.58
1.54
0.69
0.99
1.86
1.80
1.91
1.33
1.62
2.32
1.27
9.10
9.92
10.03
9.47
10.33
–0.09
–0.07
–0.06
–0.09
+0.00
FIDELITY INTL BOND INDEX
FIDELITY INV GRADE BOND
FIDELITY LG TR TRS BD IX
FIDELITY LTD TB
FIDELITY MTGE SEC;MTGE
INI
IID
GUT
SII
USM
711.2
5040.0
4208.4
1087.9
323.4
9.20
7.25
10.13
11.20
9.93
5.38
6.89
12.19
3.64
7.76
7.48
6.49
3.18
6.26
4.90
–1.99
–2.98
–11.51
–0.41
–3.05
I
1.96
–1.39
1.95
0.24
I
2.27
I
1.76
1.39
9.15
7.19
9.98
11.16
9.81
–0.08
–0.08
–0.24
–0.03
–0.12
HOMESTEAD SHT-TM BD
HOTCHKIS HIGH YIELD;I r
INVESCO CORE BOND;A
INVESCO CORE BOND;Y r
INVESCO CORP BOND;A
SID
HY
IID
IID
BBB
446.6
774.4
613.5
925.5
1090.6
4.91
10.51
5.72
5.69
6.29
3.41
6.11
6.87
6.96
8.32
5.40
13.08
5.24
5.70
7.89
–0.58
2.86
–3.81
–3.49
–3.41
1.48
4.36
1.26
1.57
3.05
1.45
3.81
1.93
2.22
3.21
4.89
10.41
5.67
5.64
6.22
–0.02
–0.10
–0.06
–0.06
–0.09
L24
BARRON’S
•
Funds Quarterly
January 8, 2024
Taxable Bond Funds
s Copyright Lipper
For personal non-commercial use only. Do not edit or alter. Reproductions not permitted.
To reprint or license content, please contact Barron's reprints department at 800-843-0008 or www.djreprints.com
NAME
OBJ
LATEST
REPORTED
NAV
ASSETS
($ SHR)
($MIL)
12/29/23
QTR
RETURN THROUGH 12/29
1YR
3 YRS
5 YRS
(Annualized)
10YRS
LATEST WK’S DATA
(as of Thursday)
CLOSE
WK’S
NAV
CHG
NAME
Data provided by
OBJ
LATEST
REPORTED
NAV
ASSETS
($ SHR)
($MIL)
12/29/23
QTR
RETURN THROUGH 12/29
1YR
3 YRS
5 YRS
(Annualized)
10YRS
LATEST WK’S DATA
(as of Thursday)
CLOSE
WK’S
NAV
CHG
INVESCO FLTG RT ESG;A
INVESCO GS INC;A
INVESCO HIGH YIELD;A
INVESCO INTL BOND;A
INVESCO INTL BOND;Y r
LP
GLI
HY
INI
INI
707.8
1421.7
560.6
427.7
449.4
6.82
3.15
3.52
4.45
4.44
2.07
6.82
5.54
7.77
7.86
11.67
8.65
9.89
8.25
8.27
4.97
–2.49
1.05
–5.43
–5.26
4.72
1.20
3.80
0.03
0.24
3.58
1.37
3.05
0.69
0.92
6.82
3.12
3.48
4.38
4.38
+0.01
–0.03
–0.04
–0.06
–0.06
METWEST FLTNG RT IN;I r
METWEST HIGH YLD BD;I r
METWEST INTMDT BD;I r
METWEST LOW DUR BOND;I r
METWEST TOTAL RTN;I r
LP
305.3
HY
368.4
SII
965.3
SID
1169.5
CPB 33309.5
9.45
9.31
9.49
8.32
9.19
2.78
6.35
5.13
3.85
7.47
12.11
11.01
5.53
5.78
6.00
4.19
0.69
–1.83
0.20
–3.70
4.66
5.12
1.69
1.69
1.23
3.72
3.75
1.69
1.47
1.83
9.45
9.23
9.42
8.29
9.09
+0.00
–0.09
–0.07
–0.03
–0.11
INVESCO QUALITY INC;A
INVESCO SENIOR FLT;A
INVESCO SH TM BOND;A
J HANCOCK BD IV GR B;A
J HANCOCK BOND;A
USM
LP
SID
IID
CPB
473.7
1541.0
1123.9
564.7
1880.1
9.81
6.67
8.06
9.16
13.60
7.40
1.83
3.07
6.82
7.09
5.25
11.49
5.71
5.80
6.22
–3.28
6.44
0.20
–3.67
–3.39
0.23
3.35
1.75
1.00
1.55
1.30
3.02
1.56
1.73
2.18
9.70
6.67
8.03
9.07
13.47
–0.11
+0.00
–0.02
–0.10
–0.15
METWEST TOTAL RTN;M
METWEST TOTAL RTN;PLAN r
METWEST UNCONS BD;I r
MFS CORP BOND;I r
MFS GOVT SEC;A
CPB 4140.2
CPB 17337.1
ARB 2060.9
BBB
932.0
IUG
435.7
9.20
8.62
10.35
12.43
8.75
7.53
7.54
4.92
8.38
6.23
5.76
6.07
7.87
9.21
3.83
–3.88
–3.64
0.03
–3.42
–3.76
1.03
1.31
2.23
2.83
0.11
1.62
1.91
2.37
2.91
0.81
9.09
8.52
10.27
12.29
8.67
–0.12
–0.11
–0.08
–0.17
–0.09
J HANCOCK BOND;I r
J HANCOCK BOND;R6 r
J HANCOCK II FLTRTI;I r
J HANCOCK II STR I O;A
J HANCOCK II STR I O;I r
CPB 6064.5
CPB 11399.3
LP
268.8
MSI
282.3
MSI
1266.7
13.60
13.62
7.66
10.02
10.02
7.08
7.10
2.43
6.29
6.37
6.53
6.65
13.56
7.30
7.62
–3.10
–3.01
4.54
–1.08
–0.78
1.85
1.95
5.09
2.98
3.29
2.49
2.61
3.40
2.38
2.68
13.47
13.49
7.67
9.94
9.94
–0.15
–0.16
+0.01
–0.09
–0.09
MFS LTD MAT;A
MFS TOT RET BOND;A
MFS TOT RET BOND;I r
MORG STAN GL FI OPPS;I r
MORG STAN I CPF;I r
SID
IID
IID
GLI
CPB
966.4
2317.0
1510.6
500.0
378.4
5.79
9.56
9.56
5.17
9.60
3.16
7.04
7.08
5.23
6.82
5.94
7.06
7.22
8.48
7.20
0.39
–3.04
–2.90
0.28
–2.87
1.99
1.71
1.84
3.12
1.81
1.47
1.99
2.13
3.27
3.39
5.78
9.47
9.47
5.15
9.52
–0.01
–0.11
–0.11
–0.02
–0.09
J HANCOCK INCOME;A
J HANCOCK TOT BD MKT;I
JNS HNDSN FLEX BOND;T
JNS HNDSN HIGH-YIELD;T
JPMORGAN CORE BOND;A
MSI
IID
CPB
HY
IID
467.6
298.9
306.3
261.4
2102.6
5.90
8.99
9.45
7.23
10.30
6.34
6.57
7.37
6.69
6.26
7.07
5.35
5.53
11.48
5.42
–1.45
–3.64
–3.43
0.03
–3.12
2.52
0.76
1.77
4.01
1.16
2.08
1.54
1.83
3.44
1.69
5.85
8.91
9.37
7.16
10.23
–0.06
–0.09
–0.09
–0.08
–0.09
MORG STAN P CORE FI
NATIONWIDE BOND IDX;A
NATIXIS CORE +;A
NEUBERGER CORE BD;INST r
NEUBERGER FLOAT RT INC;I r
IID
BBB
CPB
IID
LP
1897.2
258.8
399.2
575.4
428.2
6.94
9.69
11.60
8.97
9.40
7.43
6.46
7.28
7.02
2.98
5.89
4.91
5.91
6.09
12.82
–3.89
–3.97
–3.22
–3.22
5.13
1.15
0.40
1.69
1.66
5.60
1.82
1.12
2.12
1.97
3.90
6.86
9.60
11.49
8.88
9.40
–0.10
–0.11
–0.12
–0.10
+0.00
JPMORGAN CORE BOND;I r
JPMORGAN CORE BOND;R6 r
JPMORGAN CORE PL BD;A
JPMORGAN CORE PL BD;I r
JPMORGAN CORE PL BD;R6 r
IID 18998.4
IID 21779.0
CPB 1411.4
CPB 4764.6
CPB 11613.3
10.30
10.31
7.26
7.26
7.26
6.33
6.37
6.62
6.85
6.72
5.79
5.85
5.93
6.23
6.31
–2.85
–2.72
–2.86
–2.57
–2.50
1.44
1.60
1.35
1.65
1.72
1.93
2.10
2.01
2.26
2.37
10.22
10.24
7.20
7.20
7.20
–0.09
–0.09
–0.07
–0.07
–0.07
NEUBERGER HI INC B;INST r
NEUBERGER STR INC;INST r
NEUBERGER STR INC;R6 r
NEW COVENANT INCOME
NORTHERN FDS BOND INDEX
HY
MSI
MSI
IID
IID
519.1
3209.5
453.3
344.0
2355.4
7.57
9.83
9.82
20.93
9.30
6.41
6.94
6.97
5.46
6.87
11.49
10.02
10.14
5.13
5.46
0.96
0.41
0.50
–2.66
–3.36
4.52
3.81
3.91
0.88
1.02
3.55
3.22
3.31
1.38
1.71
7.49
9.75
9.74
20.78
9.20
–0.08
–0.09
–0.09
–0.16
–0.10
JPMORGAN GOVT BD;I r
JPMORGAN HIGH YIELD;A
JPMORGAN HIGH YIELD;I r
JPMORGAN HIGH YIELD;R6 r
JPMORGAN MTGE SECS;I r
GUS
HY
HY
HY
USM
864.6
439.7
797.9
3805.4
1889.8
9.55
6.37
6.42
6.43
10.17
5.79
6.21
6.40
6.43
6.47
4.38
11.61
11.79
12.12
5.93
–3.43
2.06
2.29
2.50
–1.81
0.53
4.29
4.55
4.74
1.28
1.38
3.48
3.73
3.89
2.02
9.48
6.32
6.37
6.37
10.10
–0.08
–0.05
–0.05
–0.06
–0.08
NORTHERN FDS FXD INCOME
NORTHERN FDS HY FXD INC
NORTHERN FDS SHORT BD
NUVEEN STRAT INC;I r
OLD WESTBURY CREDIT INC
IID
HY
SID
MSI
MSI
369.2
2632.3
292.0
353.8
2255.6
9.01
5.99
18.13
9.79
8.11
7.11
6.93
2.82
6.58
7.31
6.00
13.82
5.06
9.10
6.41
–3.04
1.97
0.06
–0.36
–2.86
1.73
5.43
1.76
3.95
I
1.97
4.04
1.34
3.21
I
8.91
5.92
18.09
9.72
8.02
–0.10
–0.07
–0.03
–0.08
–0.10
JPMORGAN MTGE SECS;R6 r
JPMORGAN SH DUR BD;A
JPMORGAN SH DUR BD;I r
JPMORGAN SH DUR BD;R6 r
LKCM FIXED INCOME;INST r
USM
SID
SID
SID
SII
2307.7
635.8
1479.8
4448.4
286.1
10.17
10.69
10.70
10.70
10.36
6.62
2.93
2.99
3.01
4.05
6.09
5.24
5.40
5.46
4.98
–1.66
0.25
0.47
0.53
–0.83
1.44
1.79
2.02
2.12
1.65
2.18
1.18
1.42
1.59
1.59
10.10
10.66
10.68
10.68
10.31
–0.08
–0.02
–0.01
–0.01
–0.04
OLD WESTBURY FXD INC
OPTIMUM FXD INC;INST r
OSTERWEIS STRAT INCOME
PACE STR FX;P r
PALMER SQUARE INC + r
SII
CPB
MSI
CPB
LP
1438.3
2706.0
5051.2
446.1
835.9
10.19
8.20
10.94
11.87
9.94
5.02
7.10
5.14
7.26
2.86
4.81
5.89
12.30
8.03
8.78
–1.97
–3.63
3.67
–2.60
2.98
1.18
1.21
5.06
2.21
3.57
1.08
1.66
4.14
2.51
I
10.13
8.12
10.89
11.77
9.93
–0.06
–0.09
–0.07
–0.11
+0.00
LOOMIS SAYLES BOND;INST r
LOOMIS SAYLES BOND;RTL
LOOMIS SAYLES FX IN;INST r
LOOMIS SAYLES INST HI;I r
LOOMIS SAYLES INV GB;A
GB
GB
MSI
HY
BBB
3389.1
741.4
450.2
329.4
717.8
11.64
11.57
11.52
5.45
9.92
7.34
7.32
7.62
6.15
7.27
8.05
7.83
8.20
9.98
7.34
–0.81
–1.06
–0.59
1.69
–1.72
2.15
1.90
3.29
3.76
2.84
2.10
1.83
2.93
3.51
2.50
11.52
11.45
11.41
5.40
9.83
–0.13
–0.13
–0.12
–0.05
–0.09
PAYDEN EM MKT BD;INV
PAYDEN LOW DUR;INV
PAYDEN LTD MAT;INV
PERF TR TOT RTN BD;INST r
PGIM CORE BOND;Z r
EMD
SID
USO
GB
IID
304.8
550.7
650.8
6106.6
404.6
10.37
9.71
9.51
19.68
8.79
10.18
2.80
1.86
6.72
7.08
12.34
5.65
6.20
7.48
6.61
–3.24
0.66
2.32
–1.59
–3.44
2.28
1.90
2.43
1.58
1.26
3.10
1.49
1.78
3.37
1.47
10.19
9.68
9.51
19.56
8.70
–0.18
–0.02
+0.00
–0.14
–0.10
LOOMIS SAYLES INV GB;Y r
LOOMIS SAYLES STR IN;A
LORD ABBETT BOND DEB;A
LORD ABBETT BOND DEB;C
LORD ABBETT BOND DEB;F r
BBB
FLX
MSI
MSI
MSI
7934.7
947.8
4711.5
694.0
582.4
9.92
11.91
7.08
7.10
7.07
7.34
7.62
6.37
6.19
6.40
7.50
8.02
6.85
6.19
6.96
–1.50
–0.73
–1.24
–1.85
–1.11
3.08
1.86
3.28
2.63
3.41
2.74
1.88
3.60
2.95
3.71
9.84
11.78
7.00
7.02
6.99
–0.09
–0.14
–0.09
–0.08
–0.08
PGIM HIGH YIELD;A
PGIM HIGH YIELD;Z r
PGIM SHT-TM CORP BD;A
PGIM TOT RTN BOND;A
PGIM TOT RTN BOND;C
HY
HY
SII
CPB
CPB
1401.8
8024.5
1137.5
2014.1
333.0
4.74
4.75
10.47
12.09
12.08
6.81
6.86
4.19
7.14
6.95
11.89
12.15
6.60
7.37
6.59
1.51
1.76
–0.37
–3.56
–4.24
4.99
5.25
2.05
1.36
0.63
4.45
4.73
1.72
2.29
1.54
4.69
4.70
10.42
11.97
11.96
–0.04
–0.04
–0.04
–0.13
–0.13
LORD ABBETT BOND DEB;I r
LORD ABBETT CORE FI;A
LORD ABBETT FLT RTE;A
LORD ABBETT FLT RTE;C
LORD ABBETT FLT RTE;I r
MSI
IID
LP
LP
LP
9019.6
656.4
1584.6
325.1
2540.8
7.04
9.37
8.14
8.15
8.15
6.29
6.53
2.83
2.67
2.88
7.08
5.61
12.66
12.10
13.02
–1.03
–3.31
5.16
4.55
5.41
3.51
1.02
4.18
3.55
4.41
3.81
1.60
3.53
2.88
3.74
6.96
9.29
8.14
8.15
8.15
–0.09
–0.10
+0.00
+0.00
+0.00
PGIM TOT RTN BOND;Z r
PIMCO DIV INCOME;INST r
PIMCO DYNMC BD;INST r
PIMCO EM FULLSPECBD;INST r
PIMCO EM MKTS BD;I-2 r
CPB 20521.6
MSI
2949.6
ARB 1903.0
EMD
265.0
EMD
444.7
12.05
9.56
9.77
6.20
8.39
7.23
7.80
4.47
8.65
10.07
7.67
10.39
7.35
11.67
11.98
–3.28
–1.51
0.10
–1.99
–2.88
1.65
2.77
2.07
2.48
2.27
2.57
3.60
2.48
1.43
2.90
11.93
9.46
9.74
6.12
8.26
–0.13
–0.11
–0.02
–0.08
–0.14
LORD ABBETT HIGH YLD;A
LORD ABBETT HIGH YLD;I r
LORD ABBETT INCOME;A
LORD ABBETT SH DUR;A
LORD ABBETT SH DUR;C
HY
HY
BBB
SID
SID
722.4
1648.7
1063.7
7654.8
1571.0
6.32
6.35
2.46
3.86
3.88
6.82
6.85
7.94
2.80
2.63
10.46
10.84
8.66
5.17
4.53
0.37
0.60
–2.38
0.43
–0.26
3.99
4.20
2.55
1.92
1.23
3.90
4.11
2.92
1.92
1.26
6.25
6.28
2.43
3.85
3.87
–0.07
–0.07
–0.03
–0.01
–0.01
PIMCO EM MKTS BD;INST r
PIMCO EMC & STI;INST r
PIMCO EXTEND DUR;INST r
PIMCO GL ADV STR B;INS r
PIMCO GL BO (DH);INST r
EMD
CRX
BBB
GLI
GLI
926.8
460.2
612.0
295.4
873.6
8.39
7.53
14.81
10.10
9.51
10.09
5.96
18.66
6.26
5.82
12.09
9.67
2.65
7.90
7.20
–2.78
0.95
–16.29
–1.12
0.31
2.37
2.24
–2.79
2.56
2.95
3.00
0.96
3.00
1.91
3.41
8.26
7.47
14.49
10.02
9.46
–0.14
–0.07
–0.54
–0.10
–0.06
LORD ABBETT SH DUR;F r
LORD ABBETT SH DUR;I r
LORD ABBETT TOT RTN;A
LORD ABBETT TOT RTN;I r
MAINSTAY FLT RATE;A
SID
SID
IID
IID
LP
1384.3
26122.7
983.7
1130.0
645.1
3.86
3.85
8.83
8.84
8.88
2.83
2.59
6.64
6.70
2.85
5.55
5.39
6.30
6.43
11.90
0.53
0.55
–3.01
–2.80
4.44
2.02
2.07
1.19
1.42
4.75
2.02
2.10
1.82
2.04
3.49
3.85
3.85
8.75
8.76
8.88
–0.01
+0.00
–0.09
–0.09
+0.00
PIMCO GNMA & GS;I-2 r
PIMCO GNMA & GS;INST r
PIMCO HIGH YIELD;A
PIMCO HIGH YIELD;ADMN r
PIMCO HIGH YIELD;I-2 r
GNM
GNM
HY
HY
HY
468.8
597.3
484.0
310.1
321.2
9.45
9.45
7.99
7.99
7.99
7.06
7.08
7.35
7.38
7.42
6.22
6.32
12.36
12.48
12.64
–2.85
–2.75
1.18
1.29
1.44
0.62
0.72
4.49
4.59
4.75
1.44
1.55
3.85
3.95
4.11
9.36
9.36
7.89
7.89
7.89
–0.10
–0.10
–0.10
–0.10
–0.10
MAINSTAY MK HY CB;A
MASSMUTUAL P HY;I r
MASSMUTUAL S ST BD;I r
MASSMUTUAL S TR BD;I r
MASSMUTUAL CR B;I r
HY
HY
CPB
IID
IID
2996.0
267.9
297.4
680.8
527.3
5.16
7.89
8.72
8.51
9.05
5.71
6.59
8.77
7.58
7.32
11.27
13.12
6.73
5.78
6.72
2.41
2.70
–3.79
–3.54
–3.05
4.89
5.22
1.70
1.36
1.65
4.32
4.68
I
1.80
2.08
5.12
7.82
NA
8.41
8.97
–0.04
–0.07
NA
–0.10
–0.09
PIMCO HIGH YIELD;INST r
PIMCO INCOME;A
PIMCO INCOME;ADMN r
PIMCO INCOME;C
PIMCO INCOME;I-2 r
HY
MSI
MSI
MSI
MSI
7240.1
13437.2
264.1
3778.3
35987.2
7.99
10.62
10.62
10.62
10.62
7.44
5.79
5.83
5.60
5.87
12.75
8.88
9.05
8.08
9.21
1.55
0.72
0.87
–0.03
1.02
4.85
3.00
3.15
2.23
3.30
4.21
4.04
4.19
3.27
4.34
7.89
10.54
10.54
10.54
10.54
–0.10
–0.08
–0.08
–0.08
–0.08
January 8, 2024
BARRON’S
•
L25
Funds Quarterly
Taxable Bond Funds
s Copyright Lipper
For personal non-commercial use only. Do not edit or alter. Reproductions not permitted.
To reprint or license content, please contact Barron's reprints department at 800-843-0008 or www.djreprints.com
NAME
OBJ
LATEST
REPORTED
NAV
ASSETS
($ SHR)
($MIL)
12/29/23
QTR
RETURN THROUGH 12/29
1YR
3 YRS
5 YRS
(Annualized)
10YRS
LATEST WK’S DATA
(as of Thursday)
CLOSE
WK’S
NAV
CHG
NAME
Data provided by
OBJ
LATEST
REPORTED
NAV
ASSETS
($ SHR)
($MIL)
12/29/23
QTR
RETURN THROUGH 12/29
1YR
3 YRS
5 YRS
(Annualized)
10YRS
LATEST WK’S DATA
(as of Thursday)
CLOSE
WK’S
NAV
CHG
PIMCO INCOME;INST r
PIMCO INCOME;R r
PIMCO INTL BD (DH);A
PIMCO INTL BD (DH);I-2 r
PIMCO INTL BD (DH);INST r
MSI
MSI
INI
INI
INI
81925.1
463.4
635.7
3685.8
9537.6
10.62
10.62
9.87
9.87
9.87
5.89
5.73
5.87
5.95
5.98
9.32
8.61
9.05
9.38
9.49
1.12
0.47
–1.38
–1.09
–0.99
3.41
2.74
1.63
1.94
2.04
4.45
3.78
3.04
3.35
3.45
10.54
10.54
9.83
9.83
9.83
–0.08
–0.08
–0.07
–0.07
–0.07
S BERNSTEIN II INTM DUR r
SB&H TRUST PLUS BND;RTL
SCHWAB INV TRS INFL PSI
SEI DAILY SHT-DUR GOVT;F r
SEI INST INTL EM DEBT;F r
IID
CPB
IUT
SUS
EMD
715.3
292.6
2596.8
534.7
1159.6
13.04
9.46
10.24
9.95
8.70
7.02
7.24
4.45
2.70
9.59
5.49
7.47
3.78
4.12
13.55
–3.34
–2.46
–1.13
–0.47
–3.30
1.14
1.84
3.04
1.06
1.47
2.05
2.33
2.30
0.87
0.98
12.92
9.37
10.20
9.93
8.56
–0.13
–0.10
–0.06
–0.02
–0.15
PIMCO INTL BD (UH);I-2 r
PIMCO INTL BD (UH);INST r
PIMCO INV GRD CR;A
PIMCO INV GRD CR;I-2 r
PIMCO INV GRD CR;INST r
INI
INI
BBB
BBB
BBB
253.6
426.5
793.7
5773.5
5345.9
7.79
7.79
8.99
8.99
8.99
9.96
9.99
7.74
7.82
7.85
6.58
6.69
7.92
8.24
8.35
–6.97
–6.88
–3.74
–3.45
–3.35
–0.68
–0.58
1.76
2.07
2.17
0.03
0.13
2.82
3.13
3.23
7.66
7.66
8.90
8.90
8.90
–0.16
–0.16
–0.11
–0.11
–0.11
SEI INST INTL INTL FI;F r
SEI INST CORE FXD INC;F r
SEI INST HIGH YIELD;F r
STATE FARM INTERIM r
STERLING TOT RTN BD;INST r
INI
IID
HY
SUT
IID
395.5
3082.7
1137.5
313.6
1010.5
8.71
9.68
5.38
9.59
9.38
5.83
7.29
5.48
3.16
6.67
7.13
5.92
12.56
4.14
5.86
–1.65
–4.03
2.96
–1.07
–3.19
0.86
1.03
5.42
0.98
1.60
2.06
1.88
4.47
1.00
2.21
8.66
9.58
5.33
9.55
9.29
–0.07
–0.12
–0.05
–0.03
–0.10
PIMCO LNG-TM CR BD;INST r
PIMCO LNG-TM GOVT;INST r
PIMCO LONG DUR TR;INST r
PIMCO LOW DUR ESG;INST r
PIMCO LOW DUR II;INST r
GB
GUS
BBB
SID
SID
3090.3
970.1
2778.0
255.2
332.2
9.14
14.98
7.40
8.99
9.21
13.09
12.21
12.79
3.00
2.71
10.01
3.38
7.58
5.09
4.57
–6.96
–11.16
–8.45
–0.47
–0.48
2.58
–1.28
1.39
1.21
1.14
4.37
2.16
3.64
1.10
1.10
8.98
14.77
7.28
8.97
9.19
–0.21
–0.35
–0.17
–0.01
–0.01
T ROWE PRC TRS LTI
T ROWE PRICE GL MSB
T ROWE PRICE GNMA
T ROWE PRICE HY
T ROWE PRICE I EMB
GUT
GLI
GNM
GHY
EMD
255.6
699.1
252.9
1194.5
377.9
7.89
10.03
8.18
5.92
9.12
12.48
7.48
7.13
6.91
11.26
2.38
12.18
5.13
13.65
13.26
–12.10
–1.67
–2.91
2.03
–2.97
–1.74
2.56
0.06
5.03
1.25
1.74
3.06
1.00
4.13
2.50
7.74
9.96
8.09
5.85
8.97
–0.19
–0.08
–0.09
–0.07
–0.15
PIMCO LOW DUR INC;A
PIMCO LOW DUR INC;I-2 r
PIMCO LOW DUR INC;INST r
PIMCO LOW DUR;A
PIMCO LOW DUR;I-2 r
SID
SID
SID
SID
SID
1622.9
4272.2
3077.2
581.1
573.7
7.94
7.94
7.94
9.20
9.20
3.63
3.71
3.74
2.87
2.92
7.26
7.58
7.68
5.01
5.20
1.37
1.67
1.78
–0.56
–0.37
2.92
3.23
3.33
1.10
1.29
2.83
3.14
3.24
0.95
1.16
7.91
7.91
7.91
9.18
9.18
–0.03
–0.03
–0.03
–0.01
–0.01
T ROWE PRICE I FR r
T ROWE PRICE I FR;F
T ROWE PRICE IN HY r
T ROWE PRICE INS EM BD r
T ROWE PRICE NEW INC
LP
LP
GHY
EMD
IID
3670.6
297.6
1753.2
350.5
769.4
9.46
9.45
7.84
6.69
8.11
3.15
3.12
6.90
10.91
6.29
12.46
12.33
13.92
12.73
4.72
5.37
5.25
2.18
–3.01
–3.74
5.44
5.31
5.16
1.54
0.60
4.23
4.10
4.34
3.09
1.48
9.46
9.45
7.75
6.58
8.03
+0.00
+0.00
–0.09
–0.11
–0.08
PIMCO LOW DUR;INST r
PIMCO LT RL RTN;INST r
PIMCO MOD DUR;INST r
PIMCO MTG OPP & BD;INST r
PIMCO REAL RETURN;A
SID
IUT
SII
ARB
IUT
4765.8
411.4
1356.4
6103.6
1172.0
9.20
12.64
9.25
9.40
10.03
2.94
9.21
4.84
4.17
4.46
5.31
0.09
5.87
6.94
3.33
–0.27
–10.12
–1.54
0.57
–1.53
1.39
1.58
1.86
2.41
2.87
1.27
2.07
1.91
3.19
1.97
9.18
12.53
9.20
9.36
10.00
–0.01
–0.28
–0.05
–0.05
–0.06
T ROWE PRICE QM US BD
T ROWE PRICE SHTM BD
T ROWE PRICE SPEC INC
T ROWE PRICE TRS IN ID
TCW CORE FIXED INCOME;I
IID
SID
MSI
GUT
IID
606.1
1413.4
1862.9
680.0
734.4
9.72
4.56
11.30
5.12
9.84
6.55
2.72
6.88
5.26
7.33
5.46
5.08
7.89
2.98
5.60
–3.54
0.03
–0.34
–4.33
–3.66
1.05
1.77
3.21
0.17
1.13
1.80
1.43
3.00
0.92
1.68
9.64
4.55
11.20
5.08
9.74
–0.09
–0.01
–0.11
–0.04
–0.11
PIMCO REAL RETURN;ADMN r
PIMCO REAL RETURN;I-2 r
PIMCO REAL RETURN;INST r
PIMCO SHORT-TERM;A
PIMCO SHORT-TERM;I-2 r
IUT
IUT
IUT
USO
USO
363.4
776.5
5743.4
787.5
2084.2
10.03
10.03
10.03
9.58
9.58
4.50
4.54
4.56
1.36
1.39
3.48
3.64
3.74
5.82
5.98
–1.39
–1.24
–1.14
1.70
1.86
3.03
3.18
3.28
2.01
2.17
2.12
2.27
2.37
1.76
1.91
10.00
10.00
10.00
9.58
9.58
–0.06
–0.06
–0.06
+0.00
+0.00
TCW EM MKTS INCOME;I
TCW TOTAL RETURN BD;I
TCW TOTAL RETURN BD;N
TEMPLETON GL BOND;A
TEMPLETON GL BOND;ADV r
EMD
USM
USM
GLI
GLI
2158.2
2140.6
400.1
2041.1
1761.1
6.43
8.07
8.33
7.77
7.73
10.30
7.85
7.87
9.46
9.58
12.09
5.04
4.85
2.43
2.71
–4.26
–4.65
–4.82
–3.00
–2.74
1.33
0.15
–0.06
–2.57
–2.32
2.29
1.32
1.05
–0.62
–0.36
6.30
7.97
8.23
7.61
7.57
–0.13
–0.11
–0.10
–0.16
–0.16
PIMCO SHORT-TERM;INST r
PIMCO SHT ASST INV;INST r
PIMCO TOT RTN ESG;INST r
PIMCO TOT RTN II;INST r
PIMCO TOT RTN IV;INST r
USO
USO
CPB
CPB
CPB
7238.2
2204.7
1648.6
589.1
251.8
9.58
9.90
7.67
8.27
9.51
1.42
1.39
6.94
6.75
6.90
6.08
5.66
5.79
6.42
6.47
1.96
2.01
–4.05
–3.45
–3.00
2.27
1.98
0.96
1.14
1.44
2.01
1.68
1.62
1.81
1.79
9.58
9.90
7.61
8.21
9.43
+0.00
+0.00
–0.07
–0.08
–0.09
TEMPLETON GL BOND;R6 r
THOMPSON BOND
THORNBURG LTD INC;A
THORNBURG LTD INC;I r
THRIVENT FDS HY;A n
GLI
SII
SII
SII
HY
538.6
1226.3
515.0
5486.6
328.3
7.72
9.83
12.82
12.82
4.19
9.47
3.73
4.37
4.44
6.05
2.72
6.98
6.27
6.49
11.38
–2.62
1.61
–0.87
–0.59
1.28
–2.20
1.71
1.97
2.25
3.97
–0.23
2.31
2.01
2.32
3.33
7.56
9.82
12.77
12.77
4.15
–0.17
+0.01
–0.05
–0.06
–0.05
PIMCO TOT RTN;A
PIMCO TOT RTN;ADMN r
PIMCO TOT RTN;I-2 r
PIMCO TOT RTN;INST r
PIMCO TOT RTN;R r
CPB 4737.7
CPB
778.2
CPB 4785.0
CPB 43787.2
CPB
398.5
8.65
8.65
8.65
8.65
8.65
6.84
6.86
6.90
6.93
6.77
5.94
6.04
6.20
6.30
5.69
–3.58
–3.49
–3.34
–3.25
–3.82
0.97
1.06
1.21
1.31
0.72
1.57
1.68
1.83
1.93
1.31
8.58
8.58
8.58
8.58
8.58
–0.08
–0.08
–0.08
–0.08
–0.08
THRIVENT FDS OPP I+;S
TIAA-CREF BOND INDX;INST r
TIAA-CREF CORE BOND;INST r
TIAA-CREF CORE+ BD;INST r
TIAA-CREF CORE+ BD;RET r
MSI
IID
IID
CPB
CPB
549.3
9733.7
4920.6
1506.3
280.4
9.01
9.68
9.18
9.21
9.22
6.11
6.64
6.74
6.77
6.71
8.84
5.64
6.34
7.02
6.77
–0.24
–3.45
–2.96
–2.58
–2.81
2.30
0.95
1.51
1.80
1.53
2.56
1.68
2.23
2.45
2.19
8.93
9.60
9.11
9.13
9.14
–0.09
–0.10
–0.09
–0.10
–0.10
PIONEER BOND;A
PIONEER BOND;Y r
PIONEER HIGH YLD;A
PIONEER SHT TRM INC;Y r
PIONEER STRAT INCOME;A
A
A
HY
SID
MSI
523.6
2318.7
390.1
343.1
580.5
8.38
8.29
8.53
8.82
9.47
7.21
7.26
5.65
3.07
7.33
6.66
6.97
10.46
7.26
8.12
–2.94
–2.60
1.36
1.79
–1.36
1.57
1.91
4.14
2.37
2.57
2.10
2.42
3.29
1.93
2.66
8.30
8.21
8.47
8.81
9.38
–0.09
–0.09
–0.07
–0.01
–0.10
TIAA-CREF HI-YLD;INST r
TIAA-CREF INFL BOND;INST r
TIAA-CREF SH-TM BD;INST r
TOUCHSTONE FLEX INC;Y r
TOUCHSTONE IMP BOND;INST r
HY
IUT
SID
FLX
IID
1106.5
575.0
511.2
964.5
253.2
8.69
10.49
9.99
10.22
9.07
7.30
3.61
2.88
4.89
6.75
13.02
4.36
5.41
7.96
5.54
2.21
0.64
0.84
0.77
–3.13
4.87
3.27
2.06
3.77
0.96
4.13
2.29
1.77
3.77
1.87
8.59
10.46
9.97
10.18
9.00
–0.11
–0.04
–0.02
–0.04
–0.07
PIONEER STRAT INCOME;Y r
PRINCIPAL CORE+ BD;INST r
PRINCIPAL HI IN;INST r
PRINCIPAL HI YLD;A
PRINCIPAL INFL PRT;INST r
MSI
CPB
HY
HY
IUT
2104.9
357.2
3396.5
417.2
1507.0
9.47
9.23
8.23
6.74
7.66
7.43
7.32
6.42
6.80
4.44
8.52
5.40
13.02
12.36
3.49
–1.00
–3.52
1.86
2.69
–1.40
2.92
1.59
4.48
5.41
2.75
2.99
1.97
3.60
4.26
1.99
9.38
9.15
8.16
6.67
7.63
–0.10
–0.09
–0.08
–0.07
–0.05
TOUCHSTONE IMP BOND;Y r
VALIC CO I INFL PROTECT
VANGUARD EXT DUR T;INST r
VANGUARD GNMA;ADM
VANGUARD GNMA;INV
IID
IUT
GUT
GNM
GNM
251.8
405.6
551.0
9924.5
5056.7
9.07
9.62
24.47
9.35
9.35
6.72
4.57
18.72
7.07
7.05
5.32
4.09
2.09
5.26
5.15
–3.23
–0.58
–16.67
–2.39
–2.49
0.86
3.05
–3.06
0.46
0.35
1.75
2.13
2.86
1.52
1.42
9.00
9.57
23.79
9.24
9.24
–0.07
–0.07
–0.87
–0.11
–0.11
PRINCIPAL SH-TM INC;A
PRINCIPAL SP PRF SI;INST r
PUTNAM CORE BOND;Y r
PUTNAM HIGH YIELD;A
PUTNAM INCOME;A
SID
FLX
IID
HY
IID
317.0
4066.1
263.4
614.2
435.5
11.84
8.82
8.26
5.29
5.29
2.90
5.44
6.73
6.45
6.96
5.75
6.46
4.79
11.94
4.79
0.20
–0.68
0.22
1.14
–4.31
1.77
3.77
2.11
4.47
0.85
1.56
4.43
1.92
3.59
1.57
11.82
8.80
8.19
5.24
5.25
–0.02
–0.03
–0.08
–0.06
–0.04
VANGUARD HY CORP;ADM
VANGUARD HY CORP;INV
VANGUARD INFL-PROT;ADM
VANGUARD INFL-PROT;INST r
VANGUARD INFL-PROT;INV
HY
HY
IUT
IUT
IUT
20021.9
2980.4
14678.1
11338.7
2624.6
5.42
5.42
23.03
9.38
11.73
7.30
7.27
4.59
4.64
4.60
11.74
11.63
3.79
3.85
3.65
1.82
1.72
–1.12
–1.11
–1.23
5.21
5.11
3.02
3.05
2.92
4.43
4.33
2.33
2.36
2.22
5.36
5.36
22.91
9.33
11.67
–0.06
–0.06
–0.13
–0.06
–0.07
PUTNAM INCOME;Y r
PUTNAM MTGE SECS;A
PUTNAM SHT DUR BD;A
PUTNAM SHT DUR BD;Y r
PUTNAM ULT SHT DUR I;A
IID
USM
SID
SID
USO
606.9
390.4
463.4
725.3
2930.3
5.42
8.65
9.73
9.75
10.09
6.85
7.39
3.07
3.24
1.81
5.10
3.66
6.19
6.56
5.96
–4.06
–3.98
0.64
0.92
2.27
1.11
–0.24
1.94
2.19
2.19
1.83
0.45
1.71
1.98
1.58
5.38
8.57
9.71
9.72
10.08
–0.04
–0.07
–0.02
–0.02
–0.01
VANGUARD INT CRP BD;ADM
VANGUARD INT CRP BD;INST r
VANGUARD INT TRS;ADM
VANGUARD INT TRS;INST r
VANGUARD INT-T B;ADM
BBB 1166.1
BBB
311.0
IUG
3571.9
IUG
2313.5
IID 16373.6
21.91
27.07
20.04
24.88
10.36
8.31
8.33
4.95
5.00
6.87
8.87
8.87
4.39
4.43
6.07
–2.69
–2.67
–3.17
–3.13
–3.52
2.84
2.85
0.76
0.79
1.68
3.13
3.15
1.36
1.39
2.29
21.67
26.78
19.92
24.73
10.27
–0.26
–0.32
–0.12
–0.14
–0.10
PUTNAM ULT SHT DUR I;Y r
RBC BLUEBAY AC CAP IN;I r
RIVERNORTH STRAT INC;I r
RUSS INV INV GRD BD;S r
RUSS INV STRAT BOND;S r
USO
USM
GB
IID
BBB
6615.4
608.2
1142.4
742.1
1506.8
10.10
7.71
8.71
18.44
9.31
1.84
7.15
7.26
6.47
6.62
6.06
4.76
9.05
5.02
4.38
2.37
–2.94
–0.43
–4.09
–4.18
2.29
0.16
3.22
0.92
0.95
1.67
1.06
3.55
1.61
1.70
10.09
NA
8.68
18.28
9.22
–0.01
NA
–0.04
–0.18
–0.09
VANGUARD INT-T B;INST r
VANGUARD INT-T B;INST+ r
VANGUARD INT-TM INV;ADM
VANGUARD INT-TM INV;INV
VANGUARD INT-TM TRS;ADM
IID
2827.9
IID
908.7
IID 29662.4
IID
1569.4
GUT 5211.9
10.36
10.36
8.68
8.68
9.99
6.87
6.88
8.20
8.17
5.18
6.09
6.10
8.61
8.50
4.18
–3.50
–3.49
–2.54
–2.64
–2.97
1.70
1.71
2.46
2.36
1.03
2.32
2.33
2.74
2.64
1.52
10.27
10.27
8.58
8.58
9.93
–0.10
–0.10
–0.11
–0.11
–0.07
L26
BARRON’S
•
Funds Quarterly
January 8, 2024
Taxable Bond Funds
s Copyright Lipper
For personal non-commercial use only. Do not edit or alter. Reproductions not permitted.
To reprint or license content, please contact Barron's reprints department at 800-843-0008 or www.djreprints.com
NAME
OBJ
LATEST
REPORTED
NAV
ASSETS
($ SHR)
($MIL)
12/29/23
QTR
RETURN THROUGH 12/29
1YR
3 YRS
5 YRS
(Annualized)
10YRS
LATEST WK’S DATA
(as of Thursday)
CLOSE
WK’S
NAV
CHG
Data provided by
NAME
OBJ
LATEST
REPORTED
NAV
ASSETS
($ SHR)
($MIL)
12/29/23
QTR
RETURN THROUGH 12/29
1YR
3 YRS
5 YRS
(Annualized)
10YRS
LATEST WK’S DATA
(as of Thursday)
CLOSE
WK’S
NAV
CHG
VANGUARD INT-TM TRS;INV
VANGUARD LG-TM BD;INST r
VANGUARD LG-TM BD;INST+ r
VANGUARD LG-TM INV;ADM n
VANGUARD LG-TM INV;INV n
GUT
581.1
A
864.6
A
352.8
A
11412.6
A
3850.9
9.99
11.33
11.33
8.13
8.13
5.16
13.12
13.12
13.10
13.07
4.07
7.54
7.55
9.38
9.27
–3.07
–8.65
–8.64
–7.33
–7.43
0.93
1.09
1.10
2.06
1.96
1.42
3.27
3.29
3.86
3.75
9.93
11.10
11.10
7.96
7.96
–0.07
–0.28
–0.28
–0.22
–0.22
WA INTERMEDIATE BOND;IS r
WA MTGE TOTL RET;A
WA SH DUR HI INC;A
WA SHORT-TERM BOND;IS r
WA SMASH SERIES C
CPB
USM
SHY
SID
GB
342.2
364.2
293.0
290.7
1177.3
9.68
8.30
4.78
3.66
9.40
4.97
6.96
3.60
2.99
11.17
5.87
3.88
10.45
5.29
12.95
–2.67
–3.38
3.11
0.02
3.48
1.39
–0.45
4.77
1.77
5.59
2.00
1.37
3.05
1.69
4.73
9.62
8.23
4.75
3.65
9.24
–0.07
–0.08
–0.03
–0.01
–0.19
VANGUARD LG-TM TRS;ADM
VANGUARD LG-TM TRS;INV
VANGUARD LT CORP BD;ADM
VANGUARD LT CORP BD;INST r
VANGUARD LT TRS;ADM
GUT
GUT
BBB
BBB
GUT
2321.0
605.3
329.0
416.6
1114.4
8.76
8.76
21.52
26.70
20.74
12.67
12.64
13.80
13.81
12.64
3.41
3.31
11.03
11.05
3.65
–11.41
–11.50
–6.59
–6.59
–11.46
–1.22
–1.32
2.68
2.69
–1.36
2.31
2.21
3.93
3.95
2.23
8.60
8.60
21.07
26.15
20.36
–0.20
–0.20
–0.55
–0.68
–0.48
WA SMASH SERIES CPCOM
WA SMASH SERIES M
WEITZ CORE PLUS INC;INST r
WEITZ SH DUR INCOME;INST r
WILMINGTON BRD MKT;INST r
GLI
GLI
CPB
SID
A
2457.4
1361.3
1185.3
811.2
571.9
6.31
7.92
9.73
11.87
8.81
9.61
9.51
5.82
2.48
6.49
7.38
5.15
7.05
6.32
5.68
–8.62
–8.06
–0.63
1.48
–3.01
–1.53
–1.13
3.09
2.39
1.27
1.61
1.90
I
1.99
1.76
6.21
7.80
9.68
11.85
8.73
–0.11
–0.11
–0.07
–0.02
–0.09
VANGUARD LT TRS;INST r
VANGUARD MTG-BK IDX;ADM
VANGUARD MTG-BK IDX;INST r
VANGUARD SH-TM B;ADM
VANGUARD SH-TM B;INST r
GUT 2982.5
USM 1182.0
USM
268.8
SID 13195.5
SID
5310.7
26.33
18.55
25.14
10.10
10.10
12.64
7.30
7.34
3.39
3.40
3.70
4.99
5.01
4.87
4.88
–11.43
–2.88
–2.86
–0.68
–0.66
–1.34
0.17
0.20
1.47
1.49
2.26
1.26
1.29
1.35
1.38
25.85
18.34
24.85
10.07
10.07
–0.60
–0.20
–0.27
–0.03
–0.03
VANGUARD SH-TM B;INST+ r
VANGUARD SH-TM FED;ADM
VANGUARD SH-TM FED;INV
VANGUARD SH-TM INV;ADM
VANGUARD SH-TM INV;INST r
SID
6732.3
SUS 4477.2
SUS
428.3
SID 37417.5
SID 11080.8
10.10
10.09
10.09
10.23
10.23
3.40
3.05
3.03
3.95
3.96
4.90
3.91
3.81
6.17
6.20
–0.65
–0.67
–0.77
–0.09
–0.06
1.50
1.30
1.20
2.13
2.16
1.39
1.20
1.10
1.95
1.98
10.07
10.06
10.06
10.19
10.19
–0.03
–0.03
–0.03
–0.04
–0.04
VANGUARD SH-TM INV;INV
VANGUARD SH-TM TRS;ADM
VANGUARD SH-TM TRS;INV
VANGUARD ST CORP BD;ADM
VANGUARD ST CORP BD;INST r
SID
SUT
SUT
SII
SII
6271.1
5708.0
535.8
3982.8
2258.2
10.23
9.88
9.88
21.05
25.77
3.93
2.87
2.84
4.05
4.08
6.06
3.61
3.51
6.15
6.21
–0.19
–0.65
–0.75
–0.12
–0.09
2.02
1.14
1.04
2.26
2.28
1.85
1.01
0.91
2.05
2.07
10.19
9.85
9.85
20.97
25.67
–0.04
–0.03
–0.03
–0.07
–0.09
VANGUARD ST IPSI;ADM
VANGUARD ST IPSI;INS r
VANGUARD ST TRS;ADM
VANGUARD ST TRS;INST r
VANGUARD TOT BD II;INST r
IUT 19640.5
IUT 19274.7
SUS 2780.2
SUS 1541.2
IID 132024.3
23.81
23.83
19.45
24.43
9.59
2.50
2.55
2.56
2.53
6.66
4.59
4.61
4.28
4.28
5.66
2.27
2.31
–0.15
–0.14
–3.36
3.32
3.34
1.21
1.23
1.05
1.92
1.95
0.97
0.99
1.75
23.77
23.79
19.41
24.38
9.50
–0.03
–0.02
–0.02
–0.03
–0.10
VANGUARD TOT BD II;INV r
VANGUARD TOT BD;ADM
VANGUARD TOT BD;INST r
VANGUARD TOT BD;INST+ r
VANGUARD TOT BD;INV nr
IID
IID
IID
IID
IID
127943.8
95981.1
41732.6
31750.4
659.4
9.59
9.71
9.71
9.71
9.71
6.64
6.69
6.69
6.70
6.66
5.58
5.70
5.72
5.72
5.60
–3.42
–3.36
–3.34
–3.34
–3.45
0.98
1.12
1.13
1.14
1.01
1.68
1.79
1.80
1.81
1.68
9.50
9.61
9.61
9.61
9.61
–0.10
–0.10
–0.10
–0.10
–0.10
VANGUARD TOT ITL BI;ADM
VANGUARD TOT ITL BI;INST r
VICTORY CORE+ INTM BD;FD
VICTORY CORE+ INTM BD;I r
VICTORY CORE+ INTM BD;R6 r
INI 23699.6
INI 12018.5
CPB 1408.8
CPB 1898.3
CPB
427.2
19.73
29.60
9.22
9.22
9.23
6.51
6.54
6.34
6.24
6.40
8.83
8.85
7.17
7.26
7.54
–2.51
–2.48
–1.89
–1.82
–1.62
0.88
0.91
2.78
2.85
3.03
2.40
2.45
2.86
2.94
I
19.59
29.40
9.16
9.16
9.16
–0.20
–0.29
–0.08
–0.08
–0.08
VICTORY GOVT SEC;FUND
VICTORY GOVT SEC;INST r
VICTORY HIGH INCOME;FUND
VICTORY HIGH INCOME;INST r
VICTORY INCOME;FUND
IUG
IUG
HY
HY
A
250.2
716.1
763.7
287.7
2139.2
8.88
8.88
6.93
6.92
11.46
5.27
5.32
6.62
6.65
7.14
4.45
4.59
13.06
13.19
7.13
–1.69
–1.60
2.07
2.18
–2.34
1.10
1.19
4.53
4.63
2.28
1.42
I
3.71
3.80
2.60
8.82
8.82
6.87
6.86
11.38
–0.06
–0.07
–0.07
–0.07
–0.10
VICTORY INCOME;INST r
VICTORY SHRT-TM BD;FUND
VICTORY SHRT-TM BD;INST r
VICTORY FL RATE;Y r
VIRTUS SH EM MKTS DI;I r
A
SID
SID
LP
EMD
2477.0
791.0
1373.7
516.3
342.3
11.45
8.93
8.92
8.11
7.22
7.16
3.30
3.33
3.12
11.11
7.19
6.27
6.37
9.28
14.82
–2.30
1.42
1.47
1.98
–3.50
2.33
2.74
2.81
4.06
2.08
2.65
2.19
2.28
3.32
2.79
11.37
8.91
8.90
8.12
7.09
–0.10
–0.01
–0.02
+0.00
–0.13
VIRTUS NEWFLEET LDCPB;I r
VIRTUS NEWFLEET MS IB;I r
VIRTUS NWFLEET MSSTB;A
VIRTUS NWFLEET MSSTB;I r
VOYA GNMA INCOME;A
SID
MSI
SII
SII
GNM
315.5
376.2
648.1
3584.4
332.8
10.44
9.14
4.47
4.48
7.43
3.22
5.90
3.40
3.70
6.85
6.89
9.15
7.22
7.45
4.80
0.62
0.25
0.45
0.69
–2.45
2.25
3.58
2.33
2.58
0.27
2.05
3.20
2.05
2.33
1.18
10.42
9.07
4.46
4.47
7.35
–0.02
–0.07
–0.01
–0.01
–0.08
VOYA INTMDT BD;I r
WA CORE BOND;A
WA CORE BOND;I r
WA CORE BOND;IS r
WA CORE PLUS BOND;A
IID
5486.1
IID
656.5
IID 10026.9
IID
3683.3
CPB 1358.4
8.78
10.79
10.79
10.80
9.57
7.11
7.95
7.94
7.94
9.30
7.01
5.53
5.91
5.84
6.39
–3.15
–5.12
–4.77
–4.76
–5.60
1.56
0.43
0.80
0.83
0.51
2.37
1.72
2.10
2.13
1.94
8.70
10.66
10.66
10.68
9.43
–0.10
–0.14
–0.15
–0.14
–0.15
WA CORE PLUS BOND;I r
WA CORE PLUS BOND;IS r
WA CORPORATE BOND;A
WA INCOME;A
WA INTERMEDIATE BOND;I r
CPB 12867.5
CPB 7599.4
BBB
262.4
MSI
263.9
CPB
349.1
9.58
9.58
10.78
5.10
9.68
9.39
9.40
8.81
6.49
4.94
6.78
6.93
7.41
9.69
5.88
–5.25
–5.22
–3.93
–0.67
–2.75
0.88
0.93
2.36
2.70
1.30
2.33
2.36
3.00
2.68
1.92
9.44
9.44
10.66
5.06
9.62
–0.15
–0.15
–0.14
–0.04
–0.07
Quarterly Earnings: Dow Jones Transportation Average
This table lists the latest reported diluted quarterly earnings of the Dow Jones Averages component stocks based upon generally accepted accounting principles. The total is then
adjusted by the Dow Divisor in effect at the end of the quarter.
Company (Symbol)
Alaska Air Group (ALK)
American Airlines (AAL)
Avis Car Rental (CAR)
C.H. Robinson WW (CHRW)
CSX Corp (CSX)
Delta Air Lines (DAL)
Expeditors Int'l (EXPD)
FedEx (FDX)
Hunt JB (JBHT)
JetBlue Air (JBLU)
Old Dominion (ODFL)
Kirby Corp (KEX)
Landstar Sys (LSTR)
Matson Inc (MATX)
Norf Sthn (NSC)
Ryder System (R)
Swest Airl (LUV)
United Parcel Ser (UPS)
Union Pac (UNP)
United Airlines (UAL)
Total Earnings
DJTA Divisor
DJTA Average
DJTA Qtr. Earn
DJTA 4-Qtr. Earn
DJTA P/E Ratio
2023
Sep.
2023
June
2023
Mar.
2022
Dec.
2022
Sep.
1.08
– .83
16.78
.68
.42
1.72
1.16
3.55
1.80
– .46
3.09
1.05
1.71
3.40
2.10
3.44
.31
1.31
2.51
3.42
48.24
0.16343894576034
14968.77
295.16
1038.86
14.4
1.86
1.88
11.01
.81
.49
2.84
1.30
4.23
1.81
.41
2.65
.95
1.85
2.26
1.56
– .40
1.08
2.42
2.57
3.24
44.82
0.16343894576034
15529.77
274.23
1149.36
13.5
– 1.11
.02
7.72
.96
.48
– .57
1.45
6.05
1.89
– .58
2.58
.68
2.17
.94
2.04
2.95
– .27
2.19
2.67
– .59
31.67
0.16343894576034
14438.66
193.77
1255.21
11.5
.17
1.14
10.10
.80
.49
1.29
1.38
3.05
1.92
.07
2.92
.62
2.60
2.10
3.42
4.18
– .37
3.96
2.67
2.55
45.06
0.16343894576034
13391.91
275.70
1271.42
10.5
.31
.69
21.67
1.78
.52
1.08
2.54
3.07
2.57
.18
3.36
.65
2.76
6.89
4.10
4.82
.44
2.96
3.05
2.86
66.30
0.16343894576034
12058.26
405.66
1248.78
9.7
Fiscal Year: Federal Express FY May. r-revised.
Cash Track
Attracting Interest: Cash flows spurned stocks, in favor of bonds and money market funds. New redemptions shrank the last month’s average weekly inflow at equity funds to $1.3 billion. Withdrawals from
muni-bond funds swelled their average outflow to $300 million a week. But intakes at taxable-bond funds
shrank their average weekly outflow to near zero. Money-market fund inflows rose to an average $6.3 billion.
Equity Funds
Nov
5000
Dec
Money Market Funds
Nov
0
2500
-250
0
-500
-2500
-750
-5000
-1000
Jan
Nov
40200
Dec
Municipal Bond Funds
Dec
Jan
Taxable Bond Funds
2400
26200
800
12200
-800
-1800
-2400
-15800
Jan
-4000
Nov
A red chart indicates a lower value than the starting period. Green means it's higher than the starting period.
The charts above show four-week moving averages of net cash flow in millions of dollars.
Dec
Jan
BARRON'S • Lipper FMI
January 8, 2024
BARRON’S
•
L27
Funds Quarterly
Municipal Bond Funds
s Copyright Lipper
For personal non-commercial use only. Do not edit or alter. Reproductions not permitted.
To reprint or license content, please contact Barron's reprints department at 800-843-0008 or www.djreprints.com
NAME
OBJ
LATEST
REPORTED
NAV
ASSETS
($ SHR)
($MIL)
12/29/23
QTR
RETURN THROUGH 12/29
1YR
3 YRS
5 YRS
(Annualized)
10YRS
LATEST WK’S DATA
(as of Thursday)
CLOSE
WK’S
NAV
CHG
AB HI INC MUNI;Z r
AB IMPACT MUNICIPAL INC r
AB INTERM DVSFD MUNI;ADV r
AB MUNI BD INF STR;1 r
AB MUNI BD INF STR;2 r
HM
HM
IMD
IMD
IMD
282.9
576.9
492.6
513.3
263.1
10.28
9.83
13.94
10.64
10.65
10.33
10.33
4.94
4.15
4.28
6.60
8.90
5.13
5.02
5.12
–1.22
–0.14
0.18
2.28
2.41
2.37
3.14
2.07
3.48
3.60
I
I
I
2.44
2.55
10.26
9.82
13.94
10.67
10.68
–0.02
–0.01
+0.00
+0.02
+0.03
AB MUNI BD INF STR;ADV r
AB MUNI CA;A
AB MUNI CA;ADV r
AB MUNI NATL;A
AB MUNI NATL;ADV r
IMD
CAG
CAG
GM
GM
592.4
467.2
618.9
427.7
1367.5
10.72
10.57
10.57
9.73
9.73
4.25
6.96
7.02
6.97
7.04
5.16
6.65
6.92
6.04
6.30
2.40
–0.21
0.04
–0.67
–0.42
3.61
2.16
2.41
1.90
2.15
2.55
2.94
3.20
2.84
3.10
10.75
10.56
10.56
9.73
9.73
+0.03
–0.01
–0.01
+0.00
+0.00
AB MUNI NY;A
AB MUNICIPAL INC r
AB TA FXD INC OPP;ADV r
ABRDN ULTRA SHT MUN I;IN r
AMER CENT CA HY;I r
NY
320.9
HM 10905.3
GM
478.9
SMD
520.9
CAG
591.8
9.28
11.13
10.59
10.03
9.80
6.36
9.27
7.59
1.12
8.81
5.26
7.42
6.99
3.94
6.76
–0.67
0.34
0.72
1.63
–0.64
1.63
3.59
3.12
1.44
2.33
2.48
5.32
3.25
1.14
4.03
9.28
11.11
10.58
10.03
9.79
+0.00
–0.02
–0.01
+0.00
–0.01
AMER CENT CA HY;INV
AMER CENT CA INT TF;I r
AMER CENT CA INT TF;INV
AMER CENT CA INT TF;Y r
AMER CENT HY MUNI;I r
CAG
CAT
CAT
CAT
HM
679.1
1003.5
663.7
317.6
274.0
9.81
11.30
11.30
11.30
8.77
8.75
5.84
5.78
5.84
7.91
6.66
4.94
4.73
4.97
6.09
–0.80
–0.23
–0.40
–0.20
–0.68
2.15
1.95
1.74
1.98
2.41
3.83
2.45
2.25
I
4.11
9.80
11.30
11.29
11.30
8.76
–0.01
+0.00
–0.01
+0.00
–0.01
AMER CENT INT TF BD;I r
AMER CENT INT TF BD;INV
AMER CENT INT TF BD;Y r
AMERICAN FUNDS LT TE;A
AMERICAN FUNDS MUNI;A
IMD
IMD
IMD
SIM
HM
1758.0
551.2
1362.5
3279.3
4689.3
10.88
10.88
10.87
15.35
14.96
6.63
6.58
6.55
4.70
7.92
5.64
5.43
5.67
4.01
7.94
–0.12
–0.32
–0.09
–0.32
0.12
2.27
2.06
2.28
1.51
2.67
2.58
2.38
I
1.59
4.28
10.88
10.87
10.87
15.35
14.95
+0.00
–0.01
+0.00
+0.00
–0.02
AMERICAN FUNDS ST TE;A
AMERICAN FUNDS TE BD;A
AMERICAN FUNDS TE CA;A
AMG GW&K MUNI BOND;I r
AQUILA TF TR OF OREGON;A
SMD 1173.1
GM 11393.6
CAG 1428.1
IMD 1015.8
OTH
250.8
9.94
12.47
16.76
11.60
10.45
3.61
7.32
7.63
7.85
4.84
3.30
6.49
6.27
6.04
3.34
–0.01
–0.44
–0.53
–0.49
–1.26
1.19
2.07
1.98
2.11
1.07
0.98
2.95
3.01
2.71
1.81
9.93
12.46
16.75
11.60
10.45
–0.01
–0.02
–0.01
+0.00
+0.00
BAIRD QUAL INTM MB;INST r
BLACKROCK CA MU OPP;A
BLACKROCK CA MU OPP;I r
BLACKROCK HY MUNI;I r
BLACKROCK NAT MUNI;A
IMD
CAG
CAG
HM
GM
1052.6
590.1
1471.3
711.5
2301.2
11.13
11.98
11.99
8.93
10.21
5.28
6.34
6.40
10.64
5.75
4.29
5.01
5.27
7.10
5.86
–0.48
0.17
0.41
–0.34
–1.10
1.69
1.55
1.80
2.63
1.51
1.90
3.22
3.46
4.77
2.62
11.13
11.97
11.98
8.89
10.20
+0.00
–0.01
–0.01
–0.05
–0.01
BLACKROCK NAT MUNI;I r
BLACKROCK NY MU OPP;A
BLACKROCK NY MU OPP;I r
BLACKROCK ST MUNI O;A
BLACKROCK ST MUNI O;I r
GM
NY
NY
GM
GM
3817.8
506.3
594.7
782.1
3109.9
10.21
10.67
10.66
10.55
10.55
5.93
8.06
8.13
7.73
7.68
6.23
6.66
6.82
4.96
5.17
–0.82
0.84
1.09
–0.69
–0.52
1.78
1.83
2.08
0.90
1.10
2.86
3.48
3.72
2.62
2.83
10.19
10.66
10.65
10.54
10.55
–0.01
–0.01
–0.01
–0.02
–0.01
BLACKROCK ST MUNI;I r
BLACKROCK STR INC OPP;A
BLACKROCK STR INC OPP;I r
BNY MELLON NAT INT;M r
BNY MELLON NAT SH-TM;M r
SMD
275.2
ACF
1000.3
ACF 23785.9
IMD 1858.3
SMD
408.0
9.89
9.43
9.43
13.10
12.59
3.23
5.44
5.51
6.62
2.58
4.48
7.00
7.26
5.67
3.55
0.54
0.45
0.72
–0.30
0.33
1.09
3.08
3.34
2.12
1.14
0.84
2.53
2.82
2.41
0.92
9.89
9.36
9.37
13.10
12.59
+0.00
–0.08
–0.07
+0.00
+0.00
BNYM AMT-FR M BD;A
BNYM CA AMT-FREE MUNI;Z
BNYM INTMDT MUNI BOND
BNYM MUNICIPAL BOND
BNYM NY TAX EX BOND n
GM
CAG
IMD
GM
NY
443.2
481.7
422.1
928.9
754.3
13.43
13.62
12.81
10.89
13.65
7.27
7.43
6.35
7.24
6.58
6.26
6.05
5.33
6.37
6.00
–0.88
–1.06
–0.54
–0.79
–0.89
1.86
1.54
1.87
1.95
1.60
2.84
2.78
2.44
2.93
2.54
13.43
13.61
12.80
10.89
13.64
+0.00
–0.01
–0.01
+0.00
–0.01
BRIDGE BLDR MUNI BOND r
CO BDSHS-A TX-EX
COLUMBIA INTDUMU B;A
COLUMBIA INTDUMU B;I r
COLUMBIA MN TX-EX;A
GM 10967.9
OTH 1725.9
IMD
372.8
IMD
325.0
MN
279.2
10.00
8.78
9.57
9.57
19.66
6.23
5.72
5.23
5.28
8.90
6.35
7.65
5.13
5.23
5.02
0.05
2.53
–0.43
–0.26
–2.15
2.24
3.79
1.75
1.95
0.96
I
4.32
2.24
2.44
2.31
10.00
NA
9.57
9.57
19.65
+0.00
NA
+0.00
+0.00
–0.02
COLUMBIA STR MU INC;A
COLUMBIA TAX-EXEMPT;A
COLUMBIA TAX-EXEMPT;I r
COMMERCE NATL TF INTM BD
DELAWARE NATL HY;A
GM
GM
GM
IMD
HM
635.6
1649.9
303.9
369.4
641.7
14.74
11.89
11.90
18.87
10.14
10.20
8.88
8.92
7.21
11.09
8.24
6.92
7.22
4.81
8.72
–1.66
–1.18
–0.95
–0.76
–0.06
1.63
1.48
1.69
1.75
3.08
3.20
2.75
2.97
2.32
4.58
14.72
11.88
11.89
18.86
10.12
–0.03
–0.02
–0.01
+0.00
–0.03
DELAWARE TF USA INT;A
DELAWARE TF USA;A
DELAWARE TX-FR MN;A
DELAWARE TX-FR PA;A
DFA CA INT-TRM MUNI BD;I r
IMD
GM
MN
PA
CAT
405.5
705.0
267.0
313.7
443.0
11.10
10.68
11.25
7.40
10.40
8.56
13.67
7.86
10.77
4.98
7.64
11.15
4.51
8.83
3.73
–0.82
–0.69
–1.26
0.06
–0.23
2.04
2.78
1.26
2.41
1.22
2.42
3.42
2.33
3.25
1.76
11.09
10.64
11.26
7.39
10.39
–0.02
–0.04
+0.00
–0.02
–0.01
DFA CA SH-TRM MUNI BD;I r
DFA INT-TRM MUNI BD;INST r
CAS
IMD
715.2
1463.8
10.17
10.13
1.35
5.24
2.73
4.29
0.60
–0.02
0.81
1.62
0.82
1.94
10.18
10.13
+0.01
+0.00
NAME
OBJ
Data provided by
LATEST
REPORTED
NAV
ASSETS
($ SHR)
($MIL)
12/29/23
QTR
RETURN THROUGH 12/29
1YR
3 YRS
5 YRS
(Annualized)
10YRS
LATEST WK’S DATA
(as of Thursday)
CLOSE
WK’S
NAV
CHG
DFA SH-TRM MUNI BOND;I r
DUPREE KY TX-FR INC
DWS INTERM TAX-FREE;S
SMD
OTH
IMD
1648.7
767.9
250.5
10.15
7.31
11.05
1.36
7.57
6.35
2.98
5.13
5.88
0.83
–0.55
–0.16
0.99
1.83
2.17
0.91
2.45
2.46
10.15
7.31
11.04
+0.01
+0.00
+0.00
DWS MGD MUNI B;A
DWS MGD MUNI B;S
EATON VANCE HY MU I;A
EATON VANCE NAT MU I;A
EATON VANCE NAT MU I;I r
GM
GM
HM
GM
GM
793.9
1088.1
296.6
1194.7
2723.9
8.18
8.19
8.15
9.38
9.38
8.04
8.10
8.54
8.25
8.32
7.37
7.62
7.71
7.70
7.97
–1.16
–0.92
–0.62
–0.53
–0.28
1.60
1.80
2.20
2.35
2.60
2.68
2.89
4.33
3.84
4.09
8.18
8.19
8.14
9.38
9.38
–0.01
–0.01
–0.01
–0.01
+0.00
ELFUN TAX-EX INCOME FUND r
FEDERATED HRMS MU U-S;IS r
FEDERATED HRMS S-I M;IS r
FIDELITY ADV INT MUN;I r
FIDELITY ADV INT MUN;Z r
GM
SMD
SMD
IMD
IMD
1008.1
792.1
257.3
1584.3
5104.4
10.26
9.97
9.96
10.21
10.21
6.84
1.75
3.60
6.03
6.07
5.31
3.97
4.30
5.53
5.56
–0.74
1.23
0.17
–0.03
0.06
1.88
1.39
1.15
2.11
2.24
2.82
1.12
1.17
2.46
I
10.26
NA
NA
10.20
10.21
+0.00
NA
NA
+0.00
+0.00
FIDELITY ADV LTMINC;I r
FIDELITY ADV LTMINC;Z r
FIDELITY ADV MUNI INC;A
FIDELITY ADV MUNI INC;I r
FIDELITY ADV MUNI INC;Z r
SIM
SIM
GM
GM
GM
293.4
352.9
285.1
1153.8
353.8
10.37
10.37
12.34
12.34
12.34
3.88
3.89
7.94
8.00
8.04
3.93
3.99
6.78
7.04
7.17
–0.15
–0.06
–0.68
–0.43
–0.34
1.39
1.45
2.00
2.25
2.37
1.31
I
I
I
I
10.37
10.36
12.33
12.33
12.34
+0.00
–0.01
–0.01
–0.01
+0.00
FIDELITY CA LTD TM TFBD
FIDELITY CA MUNI INC
FIDELITY CSV IN MUNI BD
FIDELITY CT MUNI INC
FIDELITY FLEX MUNI INC r
CAS
CAG
SMD
OTH
GM
509.9
1503.1
2537.9
302.4
703.4
10.34
12.28
10.04
11.06
9.87
4.10
7.27
1.54
7.57
7.57
3.51
6.51
3.66
6.28
7.25
–0.26
–0.41
1.31
–0.22
0.09
1.22
2.12
1.36
2.27
2.41
1.41
3.06
1.07
2.77
I
10.34
12.27
10.04
11.05
9.87
+0.00
+0.00
+0.00
–0.01
+0.00
FIDELITY INT MUNI INC
FIDELITY LT MUNI INC
FIDELITY MA MUNI INC
FIDELITY MI MUNI INC
FIDELITY MN MUNI INC
IMD
SIM
MA
OTH
MN
4689.2
1871.7
1849.0
470.3
558.2
10.19
10.36
11.49
11.59
11.16
6.06
3.78
6.91
7.53
6.85
5.51
3.84
5.75
6.00
5.02
0.01
–0.14
–0.82
–0.76
–0.72
2.18
1.40
1.76
1.94
1.87
2.54
1.35
2.73
2.85
2.43
10.19
10.36
11.49
11.58
11.16
+0.00
+0.00
+0.00
–0.01
+0.00
FIDELITY MUNI INCOME
FIDELITY NJ MUNI INC
FIDELITY NY MUNI INC
FIDELITY OH MUNI INC
FIDELITY PA MUNI INC
GM
NJ
NY
OH
PA
2780.0
527.2
1127.9
505.4
404.3
12.35
11.70
12.46
11.45
10.58
8.11
8.03
8.36
6.96
7.97
7.12
8.07
7.50
5.43
6.38
–0.35
0.15
–0.35
–0.73
–0.56
2.35
2.79
2.11
1.78
2.02
3.27
3.35
2.93
2.96
2.90
12.34
11.70
12.46
11.45
10.57
–0.01
+0.00
+0.00
+0.00
–0.01
FIDELITY SAI MUNI INC nr
FIDELITY SAI TAX-FREE BD r
FIDELITY TAX-FREE BOND
FPA NEW INCOME n
FRANKLIN CA TF INC;A1 n
GM
GM
GM
ACF
CAG
1921.4
2598.5
3141.8
8231.5
7639.3
9.99
10.15
11.08
9.76
6.92
8.19
8.35
8.20
3.79
8.46
7.55
7.65
7.50
7.51
6.62
–0.30
–0.05
–0.28
1.65
–0.90
2.32
2.35
2.48
2.25
2.27
I
I
3.36
2.02
3.51
9.98
10.15
11.07
9.74
6.91
–0.01
+0.00
–0.01
–0.02
–0.01
FRANKLIN CA TF INC;ADV r
FRANKLIN CA TF INC;C
FRANKLIN CA TF INT;A1 n
FRANKLIN CA TF INT;ADV r
FRANKLIN FED TF INC;A1 n
CAG
CAG
CAT
CAT
GM
2272.5
399.8
380.4
522.8
4816.4
6.90
6.90
11.09
11.12
10.87
8.35
8.17
5.33
5.34
8.19
6.59
6.06
4.87
4.96
7.04
–0.81
–1.46
–0.69
–0.59
–1.04
2.34
1.68
1.34
1.43
1.81
3.59
2.92
2.22
2.33
2.72
6.90
6.90
11.09
11.12
10.87
+0.00
+0.00
+0.00
+0.00
+0.00
FRANKLIN FED TF INC;ADV r
FRANKLIN MUNI CA HY;A1 n
FRANKLIN MUNI CA HY;AV r
FRANKLIN NY TF INC;A1 n
FRANKLIN NY TF INC;ADV r
GM
CAG
CAG
NY
NY
1139.0
789.4
877.0
1886.8
477.5
10.88
9.83
9.85
10.07
10.08
8.21
8.24
8.25
8.14
8.27
7.14
5.29
5.38
7.25
7.35
–0.94
–1.26
–1.16
–1.31
–1.18
1.89
2.00
2.08
1.51
1.61
2.82
3.83
3.93
2.18
2.29
10.88
9.82
9.84
10.07
10.07
–0.01
–0.01
–0.01
–0.01
–0.01
FRANKLIN TF AZ;A1 n
FRANKLIN TF CO;A1 n
FRANKLIN TF FED ITM;A1 n
FRANKLIN TF FED ITM;ADV r
FRANKLIN TF FED L-T;A1 n
OTH
OTH
IMD
IMD
SMD
359.2
257.1
758.9
634.8
265.5
9.86
10.58
11.29
11.32
10.22
7.70
8.26
6.30
6.41
3.49
6.15
6.25
5.63
5.72
4.09
–1.14
–1.28
–0.69
–0.59
0.05
1.56
1.48
1.38
1.48
1.29
2.61
2.52
1.96
2.06
0.98
9.86
10.58
11.29
11.32
10.22
+0.00
+0.00
+0.00
+0.00
+0.00
FRANKLIN TF HI YLD;A1 n
FRANKLIN TF HI YLD;ADV r
FRANKLIN TF MI;A1 n
FRANKLIN TF MN;A1 n
FRANKLIN TF MO;A1 n
HM
HM
OTH
MN
OTH
2333.9
763.6
462.7
338.1
402.6
8.79
8.83
10.57
11.34
10.51
7.99
7.98
7.43
9.13
7.98
6.44
6.51
5.88
5.63
5.96
–1.34
–1.24
–1.48
–1.72
–1.50
1.82
1.91
1.53
1.28
1.28
3.24
3.34
2.44
2.10
2.25
8.79
8.83
10.57
11.33
10.51
–0.01
–0.01
+0.00
–0.01
+0.00
FRANKLIN TF NC;A1 n
FRANKLIN TF NJ;A1 n
FRANKLIN TF OH;A1 n
FRANKLIN TF OR;A1 n
FRANKLIN TF PA;A1 n
OTH
NJ
OH
OTH
PA
299.7
349.2
569.9
517.7
454.6
10.55
10.39
11.56
10.58
8.91
7.77
7.53
7.92
7.74
8.48
6.04
6.52
5.70
5.53
6.46
–1.41
–0.87
–1.74
–1.49
–1.41
1.19
1.54
1.24
1.30
1.06
1.99
2.35
2.56
2.37
2.30
10.55
10.39
11.55
10.58
8.90
+0.00
+0.00
–0.02
+0.00
–0.01
GLENMEDE MUNI INTMDT
GOLDMAN DYN MUNI INC;A
GOLDMAN DYN MUNI INC;I r
GOLDMAN HI YLD MUN;A
SIM
GM
GM
HM
316.8
956.6
4143.9
425.4
10.61
15.36
15.35
9.16
5.18
6.83
6.92
8.94
4.47
6.68
7.03
7.85
–0.24
–0.15
0.18
–0.81
1.73
2.05
2.38
2.49
1.86
3.11
3.46
4.75
10.61
15.35
15.34
9.14
+0.00
–0.01
–0.01
–0.02
L28
BARRON’S
•
Funds Quarterly
January 8, 2024
Municipal Bond Funds
s Copyright Lipper
For personal non-commercial use only. Do not edit or alter. Reproductions not permitted.
To reprint or license content, please contact Barron's reprints department at 800-843-0008 or www.djreprints.com
NAME
OBJ
LATEST
REPORTED
NAV
ASSETS
($ SHR)
($MIL)
12/29/23
QTR
RETURN THROUGH 12/29
1YR
3 YRS
5 YRS
(Annualized)
10YRS
LATEST WK’S DATA
(as of Thursday)
CLOSE
WK’S
NAV
CHG
GOLDMAN HI YLD MUN;I r
HM
1781.3
9.16
9.02
8.18
–0.51
2.81
5.05
9.15
–0.01
GOLDMAN SHDUR TXFR;I r
GUGGENHEIM MACRO OP;A
GUGGENHEIM MACRO OP;INST r
HARTFD MUNI OPPS;A
HARTFD MUNI OPPS;I r
SMD
ACF
ACF
IMD
IMD
700.5
279.3
5519.6
392.6
1039.2
10.35
24.25
24.29
8.37
8.37
3.14
4.63
4.77
6.46
6.52
3.96
9.17
9.65
6.37
6.47
0.23
0.57
0.98
–0.61
–0.42
1.34
2.85
3.27
1.92
2.15
1.38
3.28
3.68
2.70
2.95
10.34
24.15
24.18
8.37
8.37
–0.01
–0.12
–0.12
+0.00
+0.00
HAWAIIAN TXFR;A
INVESCO AMT-FR MUN IN;A
INVESCO CA MUNI;A
INVESCO HY MUN;A n
INVESCO HY MUN;C n
OTH
GM
CAG
HM
HM
423.5
1276.9
1197.6
4846.0
295.0
10.61
6.99
8.17
8.55
8.53
5.80
8.56
9.28
8.98
8.94
3.19
7.28
7.59
5.22
4.57
–1.26
–0.45
–0.49
–1.27
–1.95
0.83
3.51
2.83
1.74
1.03
1.43
5.37
4.66
4.23
3.47
10.61
6.99
8.16
8.54
8.51
+0.00
–0.01
–0.01
–0.03
–0.03
INVESCO INT MUNI;A
INVESCO LT MUNI INC;A
INVESCO LTD TM CA M;A
INVESCO MUNI INCOME;A
INVESCO PA MUNI;A
IMD
SIM
CAS
GM
PA
1306.0
1219.2
261.6
2234.1
537.8
10.44
11.07
3.13
12.08
10.41
5.86
4.02
3.72
8.34
8.35
5.63
4.09
3.78
7.17
6.34
–0.46
0.47
–0.23
–0.95
0.02
1.77
1.78
2.04
1.97
3.27
2.52
1.74
2.60
3.07
4.92
10.44
11.07
3.13
12.07
10.41
–0.01
+0.00
+0.00
–0.02
–0.01
INVESCO RO AMTF NY MU;A
INVESCO RO LT NY MUN;A
INVESCO RO MUNI OPP;A
INVESCO RO MUNI OPP;C
INVESCO RO NY MUN;A
NY
OSS
HM
HM
NY
578.0
1179.9
4098.5
543.6
3610.2
10.68
2.80
6.90
6.87
15.45
9.22
4.54
9.75
9.62
11.00
7.93
4.26
8.53
7.69
9.82
–0.63
–0.22
–0.19
–0.86
0.05
2.33
1.93
3.69
3.01
3.66
4.16
2.36
5.97
5.25
5.32
10.66
2.81
6.89
6.86
15.44
–0.02
+0.00
–0.01
–0.02
–0.03
INVESCO RO NY MUN;Y r
J HANCOCK MUNI OPPS;A
JPMORGAN NATL MU INC;A
JPMORGAN NATL MU INC;I r
JPMORGAN TA RR;I r
NY
GM
IMD
IMD
IMD
783.6
507.3
374.7
621.4
295.6
15.46
9.08
10.28
10.07
9.45
11.14
7.36
6.22
6.31
5.25
10.15
6.26
4.78
5.05
4.93
0.32
–0.32
–1.01
–0.77
2.38
3.93
2.15
1.49
1.74
3.04
5.55
2.93
1.80
2.06
2.07
15.44
9.08
10.29
10.07
9.45
–0.04
+0.00
+0.01
+0.00
+0.00
LORD ABBETT CA TXFR;A
LORD ABBETT HI MUNI;A
LORD ABBETT INT TXFR;A
LORD ABBETT NATL TF;A
LORD ABBETT NY TXFR;A
CAG
HM
IMD
GM
NY
373.8
1772.5
1974.8
2510.0
340.7
10.24
10.75
10.29
10.54
10.77
8.12
7.43
6.23
7.97
8.66
6.94
7.25
6.15
7.47
8.17
–1.65
–1.61
–0.87
–1.40
–0.99
1.70
1.90
1.77
1.90
1.88
3.21
4.08
2.54
3.32
2.98
10.24
10.74
10.28
10.54
10.76
+0.00
–0.01
–0.01
–0.01
–0.01
LORD ABBETT SH DR TF;A
MAINSTAY MK SHTM MUN;I r
MAINSTAY MK TX FR BD;A
MFS MUNI HIGH INC;A
MFS MUNI INCOME;A
SMD
SMD
GM
HM
GM
772.0
483.8
1290.1
1496.7
2009.0
15.07
9.31
9.51
7.31
8.22
2.49
3.38
7.59
8.26
8.40
3.19
3.96
6.25
6.14
6.72
–0.28
0.32
–0.98
–1.25
–0.76
1.04
1.20
2.09
1.76
1.92
0.95
1.14
3.38
3.93
3.13
15.07
9.30
9.51
7.30
8.21
+0.01
–0.01
–0.01
–0.01
–0.01
MFS MUNI LTD MAT;A
NORTHERN FDS CA INT TXEX
NORTHERN FDS HY MUNI
NORTHERN FDS INTMDT TXEX
NORTHERN FDS LTD TM TXEX
SIM
CAT
HM
IMD
SIM
1157.2
256.1
293.2
1272.1
464.5
7.95
9.93
7.37
9.88
9.94
4.07
5.89
7.47
5.74
3.45
4.35
4.88
5.87
5.01
3.23
–0.15
–1.38
–2.55
–1.03
–0.04
1.60
1.29
1.00
1.57
1.45
1.74
2.23
2.84
2.20
1.21
7.95
9.93
7.37
9.87
9.94
+0.00
+0.00
–0.01
–0.01
+0.00
NORTHERN FDS TAX-EXEMPT
NUVEEN ALL-AM MUNI;A
NUVEEN CA MUNI;A
NUVEEN CA MUNI;I r
NUVEEN HY MUNI;A
GM
GM
CAG
CAG
HM
774.5
2089.6
783.0
898.2
6603.3
9.69
10.23
10.15
10.15
14.82
6.85
7.02
6.83
6.78
9.15
5.87
6.50
5.55
5.70
4.97
–1.62
–2.56
–1.87
–1.68
–0.79
1.49
1.21
1.40
1.60
2.40
2.71
3.12
3.18
3.38
4.95
9.69
10.22
10.14
10.14
14.80
+0.00
–0.01
–0.01
–0.01
–0.03
NUVEEN HY MUNI;I r
NUVEEN INT DUR MUNI;A
NUVEEN INT DUR MUNI;I r
NUVEEN LTD TRM MUNI;A
NUVEEN LTD TRM MUNI;I r
HM
IMD
IMD
SIM
SIM
7766.8
783.5
6634.5
976.7
4364.9
14.83
8.88
8.91
10.97
10.93
9.20
6.08
6.24
4.15
4.32
5.25
5.51
5.83
4.06
4.30
–0.56
–0.51
–0.31
0.15
0.37
2.61
1.87
2.09
1.72
1.94
5.16
2.61
2.82
1.71
1.92
14.80
8.88
8.90
10.97
10.92
–0.04
+0.00
–0.01
+0.00
–0.01
NUVEEN MA MUNI;A
NUVEEN MA MUNI;I r
NUVEEN MN MUNI;I r
NUVEEN MO MUNI;A
NUVEEN NC MUNI;I r
MA
MA
MN
OTH
OTH
274.4
317.5
365.1
275.9
330.0
9.39
9.39
10.83
10.63
10.21
6.54
6.47
7.26
7.53
7.56
5.51
5.60
5.58
6.16
5.51
–1.72
–1.54
–1.01
–0.50
–1.61
1.32
1.51
1.73
1.96
1.44
2.57
2.77
3.10
3.09
2.57
9.39
9.39
10.84
10.64
10.21
+0.00
–0.01
+0.01
+0.00
+0.00
NUVEEN NY MUNI;A
NUVEEN NY MUNI;I r
NUVEEN OH MUNI;A
NUVEEN OH MUNI;I r
NUVEEN PA MUNI;I r
NY
NY
OH
OH
PA
492.4
548.5
270.4
299.4
252.7
9.94
9.94
11.06
11.02
10.33
7.83
7.88
7.06
7.14
8.09
7.10
7.30
4.90
5.13
5.86
–1.16
–0.99
–0.49
–0.26
–0.61
1.51
1.70
2.04
2.26
2.10
2.83
3.03
3.02
3.23
3.27
9.93
9.94
11.06
11.01
10.33
–0.01
–0.01
–0.01
–0.01
+0.00
NUVEEN ST MUNI BD;I r
NUVEEN VA MUNI;I r
OLD WESTBURY CA MUNI BD
OLD WESTBURY MUNI BD
OLD WESTBURY NY MUNI BD
SMD
VA
CAG
SIM
NY
293.6
295.1
351.9
3920.9
561.2
9.85
10.40
9.87
11.65
9.97
2.74
7.95
5.48
5.56
5.53
3.40
6.92
4.75
4.02
4.24
0.17
–1.02
–0.42
–0.74
–0.44
1.22
1.89
1.39
1.39
1.45
1.08
3.06
I
1.41
I
9.85
10.39
9.86
11.64
9.96
+0.00
–0.02
+0.00
–0.01
–0.01
PERF TR MUNI BD;INST r
GM
631.0
23.22
10.68
8.67
–0.77
2.45
3.66
23.23
+0.00
NAME
Data provided by
OBJ
LATEST
REPORTED
NAV
ASSETS
($ SHR)
($MIL)
12/29/23
QTR
RETURN THROUGH 12/29
1YR
3 YRS
5 YRS
(Annualized)
10YRS
LATEST WK’S DATA
(as of Thursday)
CLOSE
WK’S
NAV
CHG
PGIM MUNI HIGH INCOME;A
PGIM NATIONAL MUNI;A
PIMCO HY MUNI BD;A
PIMCO HY MUNI BD;I-2 r
HM
IMD
HM
HM
336.7
532.3
875.1
1017.1
9.39
14.06
8.48
8.48
8.61
5.57
8.19
8.24
8.74
5.56
8.61
8.83
–0.77
–0.68
–0.29
–0.09
2.17
1.83
2.93
3.14
3.87
2.73
4.56
4.77
9.35
14.04
8.46
8.46
–0.04
–0.02
–0.02
–0.02
PIMCO HY MUNI BD;INST r
PIMCO MUNI BD;A
PIMCO MUNI BD;I-2 r
PIMCO MUNI BD;INST r
PIMCO NY MUNI BD;A
HM
GM
GM
GM
NY
1735.7
621.8
845.4
1005.7
275.8
8.48
9.50
9.50
9.50
10.93
8.27
7.75
7.81
7.83
7.66
8.93
8.06
8.29
8.40
7.76
0.01
–0.52
–0.31
–0.21
–0.26
3.24
2.34
2.55
2.66
2.12
4.88
3.38
3.59
3.70
2.91
8.46
9.50
9.50
9.50
10.92
–0.02
–0.01
–0.01
–0.01
–0.02
PIONEER AMT-FREE MUN;A
PIONEER AMT-FREE MUN;Y r
PIONEER HI INC MUNI;A
PRINCIPAL CA MUNI;A
PRINCIPAL TAX-EX BD;A
GM
GM
HM
CAG
GM
469.9
427.9
422.2
314.6
266.5
13.28
13.22
6.22
9.90
6.80
13.22
13.37
7.62
5.67
6.34
8.01
8.36
3.28
5.55
6.66
–3.13
–2.88
–1.44
–1.31
–1.12
1.23
1.47
1.17
1.77
1.97
2.97
3.23
3.51
3.29
3.11
13.27
13.21
6.21
9.90
6.80
–0.01
–0.01
–0.01
+0.00
+0.00
PUTNAM CA TXEX INC;A
PUTNAM DVSFD INCOME;A
PUTNAM NY TXEX INC;A
PUTNAM TF HIGH YLD;A
PUTNAM TXEX INC;A
CAG
ACF
NY
HM
GM
684.5
550.4
584.9
487.9
544.6
7.39
5.53
8.05
11.42
7.87
8.64
6.52
8.92
8.80
9.00
7.18
4.55
7.60
8.00
7.31
–0.76
–2.00
–0.61
–0.37
–0.67
2.18
1.06
1.89
2.46
2.06
3.11
1.33
2.72
3.99
2.95
7.39
5.48
8.05
11.41
7.87
+0.00
–0.05
+0.00
–0.01
+0.00
RUSS INV TAX EX BOND;S r
S BERNSTEIN CA MUNI;CM
S BERNSTEIN DIV MUNI;DM
S BERNSTEIN NY MUNI;NY
SCHWAB INV CA TXFR BD
IMD
CAT
IMD
NYT
CAT
3556.5
839.8
3879.5
1229.7
432.4
22.12
13.91
13.95
13.51
11.20
6.13
4.85
4.92
4.92
5.55
6.11
5.05
5.07
5.16
5.20
0.07
0.29
0.12
0.25
–0.69
2.23
1.88
2.00
1.80
1.56
2.64
1.91
1.97
1.91
2.28
22.12
13.90
13.95
13.51
11.19
+0.01
–0.01
+0.00
+0.00
–0.01
SCHWAB INV TX FR BD
SEI TX EX INT-TM MUNI;F r
SIT MN TAX-FREE INCOME
STATE FARM MUNI BOND r
T ROWE PRICE CA TXFR B
IMD
IMD
MN
IMD
CAG
597.7
1415.9
400.8
566.6
382.5
11.10
11.17
9.43
8.24
10.89
6.21
6.31
5.17
6.33
7.75
5.67
5.49
4.24
4.61
7.11
–0.69
–0.59
–1.46
–0.39
–0.07
1.77
1.96
1.12
2.04
2.25
2.28
2.40
2.57
2.54
3.24
11.10
11.16
9.46
8.24
10.88
–0.01
–0.01
+0.03
+0.00
–0.01
T ROWE PRICE MD TF BD
T ROWE PRICE SUM MIC
T ROWE PRICE SUM MIT
T ROWE PRICE TF INC
T ROWE PRICE TX-FR HY
MD
GM
IMD
GM
HM
999.0
1044.9
2228.7
785.6
1897.2
10.12
11.30
11.45
9.49
10.89
7.87
7.57
5.94
7.99
7.79
6.67
7.28
5.49
7.01
7.02
–0.25
–0.52
–0.34
–0.34
–0.63
1.99
2.10
1.95
2.16
2.03
2.89
3.18
2.44
3.03
3.76
10.12
11.30
11.45
9.49
10.88
+0.00
–0.01
+0.00
+0.00
–0.02
T ROWE PRICE TX-FR VAB
T ROWE PRICE TXFR SI
THORNBURG INT MUNI;A
THORNBURG LTD MUNI;A
THORNBURG LTD MUNI;I r
VA
SIM
IMD
SIM
SIM
650.2
761.4
269.0
590.3
2039.4
11.29
5.49
13.33
13.70
13.70
8.39
3.78
5.69
4.61
4.68
6.61
3.95
5.45
4.29
4.46
–0.71
0.02
–0.11
–0.41
–0.18
1.90
1.39
1.79
1.09
1.32
2.85
1.24
2.11
1.24
1.51
11.28
5.48
13.32
13.68
13.68
–0.01
+0.00
–0.02
–0.02
–0.02
THRIVENT FDS MUN BD;A n
VANGUARD CA INTM-TRM;ADM
VANGUARD CA INTM-TRM;INV
VANGUARD CA LNG-TM;ADM
VANGUARD CA LNG-TM;INV
GM
895.1
CAT 13537.4
CAT
1270.1
CAG 4401.3
CAG
530.4
10.36
11.47
11.47
11.58
11.58
8.72
6.45
6.43
8.82
8.80
6.77
5.80
5.72
7.59
7.51
–1.02
–0.13
–0.21
–0.41
–0.49
1.71
2.20
2.12
2.53
2.45
2.55
2.83
2.74
3.63
3.55
10.35
11.47
11.47
11.57
11.57
–0.01
+0.00
+0.00
–0.01
–0.01
VANGUARD HI YLD TXEX;ADM
VANGUARD HI YLD TXEX;INV
VANGUARD INT-TM TXEX;ADM
VANGUARD INT-TM TXEX;INV
VANGUARD LG-TM TX-EX;ADM
GM 13081.8
GM
1710.6
IMD 67500.3
IMD 2348.1
GM 15202.7
10.71
10.71
13.75
13.75
11.00
8.91
8.88
6.64
6.62
8.99
8.44
8.35
5.90
5.82
7.64
–0.16
–0.24
–0.06
–0.14
–0.42
2.78
2.70
2.34
2.26
2.65
3.96
3.87
2.79
2.71
3.63
10.71
10.71
13.75
13.75
11.00
+0.00
+0.00
+0.00
+0.00
+0.00
VANGUARD LG-TM TX-EX;INV
VANGUARD LTD-TM TXEX;ADM
VANGUARD LTD-TM TXEX;INV
VANGUARD MA TAX-EX;INV
VANGUARD NJ LNG-TRM;ADM
GM
SIM
SIM
MA
NJ
763.9
28492.5
859.5
2516.6
2102.2
11.00
10.86
10.86
10.26
11.51
8.96
3.81
3.79
8.55
8.83
7.55
4.27
4.18
7.18
8.09
–0.50
0.57
0.49
–0.82
0.03
2.57
1.81
1.73
2.45
2.98
3.54
1.60
1.52
3.25
3.83
11.00
10.86
10.86
10.26
11.51
+0.00
+0.00
+0.00
+0.00
+0.00
VANGUARD NJ LNG-TRM;INV
VANGUARD NY LNG-TRM;ADM
VANGUARD NY LNG-TRM;INV
VANGUARD OH LT TX-EX;INV
VANGUARD PA LNG-TRM;ADM
NJ
NY
NY
OH
PA
267.8
4009.4
447.4
1252.2
3194.5
11.51
11.00
11.00
11.78
10.93
8.81
9.42
9.40
9.37
8.86
8.01
8.37
8.28
7.03
7.33
–0.05
–0.32
–0.40
–0.92
–0.38
2.90
2.53
2.45
2.39
2.65
3.74
3.45
3.36
3.52
3.65
11.51
11.00
11.00
11.77
10.92
+0.00
+0.00
+0.00
–0.01
–0.01
VANGUARD PA LNG-TRM;INV
VANGUARD UL-SH-TM TE;ADM
VANGUARD UL-SH-TM TE;INV
VICTORY CA BOND;FUND
VICTORY TAX-EX IT;FUND
PA
287.1
SMD 15560.5
SMD
545.8
CAG
502.1
IMD 2726.8
10.93
15.78
15.78
10.51
12.63
8.84
2.51
2.48
8.59
6.23
7.24
3.95
3.87
6.68
5.61
–0.46
1.14
1.05
–0.50
–0.30
2.57
1.55
1.47
2.06
2.12
3.56
1.22
1.14
3.30
2.68
10.92
15.77
15.77
10.50
12.62
–0.01
–0.01
–0.01
–0.01
–0.01
VICTORY TAX-EX IT;INST r
VICTORY TAX-EX LT;FUND
VICTORY TAX-EX ST;FUND
IMD
GM
SMD
12.63
12.18
10.15
6.23
9.80
3.51
5.64
7.27
4.39
–0.24
–0.89
0.44
I
1.94
1.27
I
3.04
1.17
12.62
12.14
10.15
–0.01
–0.04
+0.00
621.6
1765.3
680.9
January 8, 2024
BARRON’S
•
L29
Funds Quarterly
Municipal Bond Funds
NAME
OBJ
LATEST
REPORTED
NAV
ASSETS
($ SHR)
($MIL)
12/29/23
QTR
RETURN THROUGH 12/29
1YR
3 YRS
5 YRS
(Annualized)
10YRS
LATEST WK’S DATA
(as of Thursday)
CLOSE
WK’S
NAV
CHG
VICTORY VA BOND;FUND
WA INT-TERM MUNI;A
VA
IMD
503.5
794.7
10.56
6.10
9.64
6.17
6.46
5.92
–0.69
0.08
1.66
2.03
2.77
2.43
10.53
6.09
–0.03
–0.01
WA INT-TERM MUNI;I r
WA MANAGED MUNI;A
WA MANAGED MUNI;I r
WA NY MUNI;A
WA SH DUR MUNI INC;A
IMD
GM
GM
NY
SMD
1103.1
2025.1
711.2
272.0
254.6
6.09
15.09
15.12
12.04
5.00
6.22
7.13
7.24
7.29
3.42
5.91
6.63
6.89
6.09
3.64
0.24
–0.37
–0.15
–1.33
0.14
2.16
2.02
2.21
1.47
1.23
2.58
2.94
3.10
2.45
1.04
6.09
15.10
15.12
12.03
5.00
+0.00
+0.00
+0.00
–0.01
+0.00
WILMINGTON MUNI BD;INST r
IMD
302.6
12.42
6.53
5.41
–0.60
1.57
2.14
12.41
–0.01
Quarterly Dividends: Dow Jones Industrial Average
This table lists the dividends of the Dow Jones Industrial Averages component stocks based on the record date and adjusted by the Dow Divisor in effect at the end of the quarter.
2023
Dec.
2023
Sep.
2023
June
2023
Mar.
2022
Dec.
.60
.24
SUSP.
1.30
1.51
.39
.46
SUSP.
.70
Nil
2.75
2.09
1.66
.125
1.19
1.05
1.67
.77
.75
.37
2.13
.9407
1.50
1.00
1.88
1.08
.665
.52
.48
.57
28.3907
0.15172752595384
37689.54
187.12
732.88
1.94
.60
.24
SUSP.
1.30
1.51
.39
.46
SUSP.
.70
Nil
2.75
2.09
1.66
.125
1.19
1.00
1.52
.73
.68
.34
2.13
.9407
1.50
1.00
1.88
1.03
.6525
.45
.48
.57
27.9182
0.15172752595384
33507.50
184.00
722.40
2.16
.60
.24
SUSP.
1.20
1.51
.39
.46
SUSP.
.70
Nil
2.50
2.09
1.66
.125
1.19
1.00
1.52
.73
.68
.34
2.13
.9407
1.50
1.00
1.88
1.03
.6525
.45
.48
.57
27.5682
0.15172752595384
34407.60
181.70
712.32
2.07
.52
.23
SUSP.
1.20
1.51
.39
.46
SUSP.
.70
Nil
2.50
2.09
1.65
.365
1.13
1.00
1.52
.73
.68
.34
2.13
.9133
1.50
.93
1.65
1.03
.6525
.45
.48
.57
27.3208
0.15172752595384
33274.15
180.06
700.63
2.11
.52
.23
SUSP.
1.20
1.42
.38
.44
SUSP.
.70
Nil
2.50
1.90
1.65
.365
1.13
1.00
1.52
.73
.68
.34
1.94
.9133
1.49
.93
1.65
1.03
.6525
.45
.48
.56
26.8008
0.15172752595384
33147.25
176.64
687.46
2.07
Am Exp (AXP)
Apple Inc (AAPL)
Boeing (BA)
Caterpillar (CAT)
Chevron Corp (CVX)
Cisco Sys (CSCO)
Coca-Cola (KO)
Disney, Walt (DIS)
Dow (DOW)
Saleforce.com (CRM)
Goldman Sachs (GS)
Home Depot (HD)
IBM (IBM)
Intel (INTC)
JohnsonJ (JNJ)
JP MorgCh (JPM)
McDonalds (MCD)
Merck (MRK)
Microsoft (MSFT)
Nike Inc (NKE)
Amgen (AMGN)
Proc Gamble (PG)
3M Co. (MMM)
Travelers Cos (TRV)
UntdHlth Grp (UNH)
Honeywell (HON)
Verizon (VZ)
Visa (V)
Walgreens (WBA)
Wal-Mart (WMT)
Total Dividends
DJIA Divisor
DJIA Average
DJIA Qtr. Divs
DJIA 4-Qtr. Divs
DJIA Div. Yield, %
Quarterly Dow Jones Industrial Average
This table lists the earnings of the Dow Jones Industrial Average component stocks based upon generally accepted accounting principles. Earnings include discontinued and nonrecurring items but exclude extraordinary items and accounting changes as reported by the company and adjusted by the Dow Divisor in effect at quarter-end. The total dividends
of the component stocks are based upon the record date and adjusted by the Dow Divisor in effect at quarter end. The payout ratio is the latest 12-months dividends divided by the
latest 12-months earnings. r- Revised to correct Microsofts Q4 earnings released on Jan. 24, 2013.
Year
Ended
2023
2022
Quarter
Ended
Dec.
Sep.
June
Mar.
Dec.
Clos.
Avg.
29
29
30
31
30
37689.54
33507.50
34407.60
33274.15
33147.25
Qtrly
Chg.
+
—
+
+
+
%
Chg.
4182.04
900.10
1133.45
126.90
4421.74
+
—
+
+
+
12.48
2.62
3.41
0.38
15.39
Qtrly
Earns
NA
367.37
284.66
401.71
396.10
12-Mo.
Earns
NA
1449.84
1423.87
1534.33
1578.15
Quarterly Dividends: Dow Jones Utility Average
P/E
Ratio
NA
23.1
24.2
21.7
21.0
Qtrly
Divs
187.12
184.00
181.70
180.06
176.64
12-Mo.
Divs
732.88
722.40
712.32
700.63
687.46
Divs
Yield
1.94
2.16
2.07
2.11
2.07
Payout
Ratio
NA
0.4983
0.5003
0.4566
0.4356
This table list the dividends of the Dow Jones Utility Average component stocks based upon the record date and adjusted by the Dow Divisor in effect at the end of the quarter.
Company
s Copyright Lipper
For personal non-commercial use only. Do not edit or alter. Reproductions not permitted.
To reprint or license content, please contact Barron's reprints department at 800-843-0008 or www.djreprints.com
Company
AES (AES)
Am El Pwr (AEP)
Amer Water (AWK)
Atmos Energy (ATO)
Con Ed (ED)
Dominion Energy (D)
Duke En (DUK)
Edison Int'l (EIX)
Exelon (EXC)
FirstEnergy (FE)
NextEra Energy (NEE)
Xcel Energy (XEL)
Sempra Energy (SRE)
PubSvcEn (PEG)
Southern Co (SO)
Total Dividends
DJUA Divisor
DJUA Average
DJUA Qtr. Divs.
DJUA 4-Qtr Divs.
DJUA Div. Yield, %
2023
Dec.
2023
Sep.
2023
June
2023
Mar.
2022
Dec.
.1659
.88
.7075
.81
.81
.67
1.025
.7800
.36
.41
.47
.52
.60
.57
.70
9.46
1.1978034655451
881.67
7.90
31.01
3.52
.1659
.83
.7075
.74
.81
.67
1.025
.7375
.36
.39
.47
.52
.60
.57
.70
9.29
1.1978034655451
816.55
7.75
30.61
3.75
.1659
.83
.7075
.74
.81
.67
1.005
.7375
.36
.39
.47
.52
1.19
.57
.70
9.86
1.2792490616772
906.66
7.71
30.24
3.34
.1659
.83
.6550
.740
.810
.67
1.005
.7375
.3600
.39
.47
.52
1.19
.57
.68
8.60
1.2792490616772
939.79
6.72
28.96
3.08
.1580
.83
.6550
.740
.790
.67
1.005
.7375
.3375
.39
.43
.4875
1.15
.54
.68
9.59
1.2792490616772
967.40
7.50
29.55
3.05
Data provided by
LIPPER MUTUAL FUND INVESTMENT PERFORMANCE AVERAGES
Special Quarterly Summary Report: Wednesday, January 3, 2024
Annualized Total Reinvestment Performance
NAV
No.
Mil.$ Funds
12/31/08-
12/31/13-
12/31/18-
12/31/22-
12/31/23
9/30/2312/31/23
Specialty Dvsfd Eq
S&P 500
Mid-Cap Value
Small-Cap Value
Large-Cap Value
Mid-Cap Core
Mid-Cap Growth
Multi-Cap Growth
Equity Income
Small-Cap Growth
Multi-Cap Core
Multi-Cap Value
Large-Cap Core
Large-Cap Growth
Small-Cap Core
General Equity
+12.77%
+13.41
+11.59
+11.35
+11.49
+11.98
+13.17
+13.80
+10.67
+12.60
+12.42
+11.02
+13.03
+14.88
+11.40
+12.46
+6.10%
+11.51
+7.34
+6.65
+8.77
+8.04
+9.18
+10.82
+8.27
+7.93
+9.57
+8.05
+10.86
+12.57
+7.11
+9.03
+9.95%
+15.18
+11.40
+12.04
+11.92
+12.01
+12.22
+14.01
+10.96
+10.73
+13.31
+11.39
+14.63
+16.41
+10.84
+12.46
+24.65%
+25.66
+12.42
+16.36
+13.48
+14.71
+21.17
+32.89
+11.39
+16.76
+21.27
+12.37
+24.33
+40.51
+15.60
+21.12
+11.86%
+11.55
+10.72
+13.45
+9.83
+11.61
+12.39
+13.90
+9.69
+11.35
+11.50
+9.73
+11.53
+14.19
+12.39
+11.83
Pacific Region
Latin American
Japanese
Telecommunication
Pacific Ex Japan
Intl Sm/Mid-Cap Value
Intl Sm/Mid-Cap Core
Equity Mkt Neutral
Global Large Cap Value
Natural Resources
Utility
Precious Metal
Financial Services
Intl Large-Cap Value
European Region
China Region
Global Large Cap Core
Health/Biotechnology
Global Multi-Cap Core
Global Multi-Cap Value
Dedicated Short Bias
Global Multi-Cap Growth
Intl Sm/Mid-Cap Growth
Science & Technology
Global Large Cap Growth
Intl Multi-Cap Growth
Long/Short Equity
Intl Large-Cap Core
Real Estate
Intl Multi-Cap Value
Intl Multi-Cap Core
Intl Large-Cap Growth
Emerging Markets
World Equity
Equity - EFPA
+7.16%
+5.57
+7.16
+8.28
+8.26
+10.29
+9.24
+3.39
+9.60
+3.98
+8.92
+1.05
+9.47
+6.33
+7.45
+5.75
+9.58
+13.30
+9.80
+9.17
-25.62
+11.40
+9.22
+17.84
+11.52
+7.34
+6.71
+6.65
+9.98
+6.08
+6.65
+7.55
+6.48
+7.80
+10.05
+3.04%
+1.65
+5.82
+4.51
+3.56
+4.94
+4.73
+2.64
+6.42
-1.47
+6.99
+3.98
+7.12
+3.55
+4.05
+1.30
+7.39
+9.09
+7.46
+6.28
-22.89
+8.42
+4.38
+15.36
+8.78
+4.53
+4.27
+3.57
+6.87
+3.28
+3.90
+4.64
+2.50
+4.58
+6.70
+4.39%
+6.12
+7.10
+6.62
+3.62
+8.08
+7.15
+3.76
+9.85
+10.62
+6.53
+8.55
+9.45
+8.14
+8.98
+.26
+11.26
+8.96
+11.03
+9.91
-28.18
+11.76
+6.94
+19.00
+12.55
+7.57
+6.95
+8.13
+7.00
+7.14
+7.22
+8.81
+4.43
+7.66
+9.83
+8.41%
+30.44
+19.65
+23.21
+2.43
+18.43
+16.88
+7.46
+16.78
+2.67
-4.18
+5.42
+10.90
+16.75
+19.28
-14.75
+19.83
+4.65
+18.09
+15.56
-25.48
+23.92
+13.14
+50.75
+26.74
+15.43
+10.69
+16.36
+12.20
+17.54
+16.33
+15.97
+11.75
+15.38
+17.29
+8.40%
+15.62
+7.28
+11.04
+5.46
+9.81
+10.69
+1.52
+9.60
-4.68
+8.72
+14.33
+17.49
+7.60
+12.65
-3.38
+11.25
+9.70
+10.99
+9.10
-15.73
+13.07
+11.82
+17.76
+12.65
+11.71
+5.33
+10.05
+15.59
+8.48
+9.48
+11.43
+7.82
+9.65
+10.26
12/31/23
12/31/23
12/31/23
General Equity
2,293.9
2,744,802.7
120,727.2
70,731.3
750,394.6
397,877.7
310,195.0
339,775.8
723,271.3
346,468.5
2,213,285.5
637,723.7
1,219,288.8
1,794,125.0
663,689.6
12,621,593.4
12
117
143
161
340
376
389
429
497
651
656
695
705
708
1,015
7,498
Other Equity
15,402.8
21
11,444.9
29
32,269.6
37
29,036.5
37
19,942.6
40
20,539.6
40
28,348.8
42
27,021.0
44
21,880.4
48
67,411.2
58
39,322.8
61
32,385.4
73
64,388.3
86
131,403.6
101
60,767.7
105
22,552.1
107
146,997.0
115
141,216.1
126
88,766.6
127
47,512.6
152
14,690.7
159
64,479.5
179
71,524.4
192
293,778.4
194
183,320.0
204
187,344.1
207
45,958.7
228
364,041.0
243
149,441.6
245
176,782.3
246
912,891.7
300
426,953.4
381
613,117.6
810
3,918,973.0 4,130
18,129,194.7 14,698
Other
14,553.5
73
17,919.2
82
16,163.1
118
108,845.2
147
241,937.1
208
269,370.8
215
102,512.7
330
261,918.7
473
712,990.2
475
305,583.4
578
476,451.9
888
4,662,000.7 4,394
3,169,898.5 4,691
27,224,081.0 26,328
Global Flexible Port
Long-Term Median
with a % Change
Specialty & Misc
Convertible Securities
Mixed-Asset Target 2010
Mixed-Asset Target 2020
Mixed-Asset Target 2030+
Mixed-Asset Target 2030
Mixed-Asset Target Alloc Cons
Flexible Portfolio
Mixed-Asset Target Alloc Gro
Mixed-Asset Target Alloc Mod
World Income
Domestic L-T Fixed Inc
Mixed Equity
L-T Equity and Fixed Tax Inc
+9.14%
+9,266
+7.57
+10.01
+6.55
+7.78
+9.34
+8.80
+5.65
+7.48
+9.02
+7.34
+3.74
+3.75
+8.03
+8.50
+5.54%
+13,775
+.19
+7.28
+4.35
+4.91
+6.56
+5.80
+3.51
+4.63
+6.62
+5.05
+1.44
+2.08
+5.55
+5.51
+8.21%
+19,750
+5.05
+10.41
+5.16
+6.20
+9.03
+7.80
+4.32
+6.65
+9.05
+6.88
+1.55
+2.25
+7.81
+7.84
+13.10%
+23,483
+13.07
+8.90
+9.81
+11.53
+16.01
+13.77
+9.30
+11.84
+15.58
+12.30
+10.00
+7.13
+14.12
+14.68
+9.38%
+24,194
+8.74
+6.09
+7.14
+8.05
+9.82
+9.08
+7.53
+8.16
+9.59
+8.54
+7.91
+5.43
+9.08
+9.13
Securities Markets Indexes
Value
16,852.8
4,769.8
5,037.7
6,828.9
37,689.5
16,751.6
7,733.2
33,464.1
U.S. Equities
NYSE Composite P
S&P 500 Index P
Russell 2000 IX P
S&P Industrials P
Dow Jones Ind. Average P
International Equities
DAX:Dm IX Tr
FT S-E 100: Pd IX P
Nikkei 225 Average: Yen P
+7.42%
+11.73
+9.79
+12.61
+10.20
+4.95%
+9.94
+5.71
+10.73
+8.56
+8.18%
+13.73
+8.49
+15.14
+10.07
+10.99%
+24.23
+15.09
+28.55
+13.70
+9.45%
+11.24
+13.56
+10.87
+12.48
+8.67%
+3.78
+9.26
+5.78%
+1.37
+7.46
+9.67%
+2.82
+10.83
+20.31%
+3.78
+28.24
+8.87%
+1.65
+5.04
+12.03%
+11.06
+15.69%
+12.49
+26.29%
+16.14
+11.69%
+12.88
Annualized Performance With Dividends Reinvested
Value
10,327.8
37,689.5
S & P 500 Daily Reinv
Dow Jones Ind Mth Reinv
P-Price only index. Calculated without reinvestment of dividends.
+13.97%
+12.91
Source: Lipper
L30
BARRON’S
•
Funds Quarterly
January 8, 2024
ETF Score Card
Data provided by
( A performance review of exchange-traded funds, which are similar to mutual funds, but can be sold or bought throughout the trading day.
For personal non-commercial use only. Do not edit or alter. Reproductions not permitted.
To reprint or license content, please contact Barron's reprints department at 800-843-0008 or www.djreprints.com
Fund
3D Printing
AAM B&G S/M Cp Inc Gro
AAM Low Dur Pref & IS
AAM S&P 500 High Div Val
AAM S&P Dv Mk Hi Div Val
AAM S&P Em Mk Hi Div Val
AAM Transformers
AB Disruptors
AB High Yield
AB Tax-Aware Sh Dur Mn
AB Ultra Short Income
AB US High Dividend
AB US Low Volatility Eqt
AB US Lrg Cp Strat Eqty
abrdn:Bbg AC Str K1 Free
abrdn:Bbg IMS K1 Free
abrdn:Bl AC LDS K1 Fr
abrdn:P Silver Shs
abrdn:Phy Gold Shs
abrdn:Physical Palladium
abrdn:Physical Platinum
abrdn:Physical PM Bk Shs
Absolute Select Value
Acquirers Fund
ActivePassive Core Bond
ActivePassive Int Mun Bd
ActivePassive Intl Eqty
ActivePassive US Equity
Adaptiv Select
Adaptive Alpha Opps
Adaptive Core ETF
Adptv Hdgd Mlt-Asst Inc
AdvsrShs DW ADR ETF
AdvsrShs DW FSM ACW
AdvsrShs DW FSM US Core
AdvsrShs DW Short ETF
AdvsrShs Focused Equity
AdvsrShs Gerber Kawasaki
AdvsrShs Hotel ETF
AdvsrShs Insider Advntg
AdvsrShs MSOS 2x Daily
AdvsrShs Psychedelics
AdvsrShs Pure Cannabis
AdvsrShs Pure USCannabis
AdvsrShs Q Dynamic Gro
AdvsrShs Ranger Eqty Br
AdvsrShs Restaurant ETF
AdvsrShs STAR Gl Buy-Wrt
AdvsrShs Vice ETF
Affinity World Ldrs Eqty
AGF:AGF Global Infra
AGF:AGF US Mk Neu A-Bt
AI Powered Equity
Akros Monthly Payout ETF
Alexis Practical Tact
Alger 35
Alger Mid Cap 40
Alger Weatherbie EG
AllianzIM US LC B10 Apr
AllianzIM US LC B10 Aug
AllianzIM US LC B10 Dec
AllianzIM US LC B10 Feb
AllianzIM US LC B10 Jan
AllianzIM US LC B10 Jul
AllianzIM US LC B10 Jun
AllianzIM US LC B10 Mar
AllianzIM US LC B10 May
AllianzIM US LC B10 Nov
AllianzIM US LC B10 Oct
AllianzIM US LC B10 Sep
AllianzIM US LC B20 Apr
AllianzIM US LC B20 Aug
AllianzIM US LC B20 Dec
AllianzIM US LC B20 Feb
AllianzIM US LC B20 Jan
AllianzIM US LC B20 Jul
AllianzIM US LC B20 Jun
AllianzIM US LC B20 Mar
AllianzIM US LC B20 May
AllianzIM US LC B20 Nov
AllianzIM US LC B20 Oct
AllianzIM US LC B20 Sep
AllianzIM USLC 6MB10 A/O
AllianzIM USLC 6MB10 J/J
Alp Arc Hi Inf and Def
Alp Arc Intl Quant Value
Alp Arc Itl Quant Moment
Description
ETF
Symbols
Global Science/Technology Fds
Equity Income
Flexible Income
Multi-Cap Value
Intl Equity Income Fds
Emerging Markets
Science & Technology
Global Multi-Cap Growth Fds
High Yield
Short Municipal Debt
Ultra-Short Obligations
Equity Income
Large-Cap Core
Large-Cap Core
Commodities General
Commodities Base Metals Fds
Commodities General
Commodities Prec Metals Fds
Commodities Prec Metals Fds
Commodities Prec Metals Fds
Commodities Prec Metals Fds
Commodities Prec Metals Fds
Absolute Return
Alternative Act Extension Fds
Core Plus Bond
General & Insured Municipal Debt
Intl Large-Cp Core Fds
Large-Cap Core
Large-Cap Core
Global Multi-Cap Core Fds
Flexible Portfolio
General Bond
Intl Multi-Cp Gro Fds
Global Multi-Cap Core Fds
Large-Cap Core
Dedicated Short Bias
Multi-Cap Core
Multi-Cap Growth
Consumer Services
Multi-Cap Value
Equity Leverage
Global Health/Biotechnology Fds
Specialty/Miscellaneous
Specialty/Miscellaneous
Flexible Portfolio
Dedicated Short Bias
Consumer Services
Alternative Long/Short Eqty Fds
Specialty/Miscellaneous
Global Multi-Cap Value Fds
Global Infrastructure
Alternative Eq Mrkt Neutral Fds
Multi-Cap Core
Flexible Portfolio
Flexible Portfolio
Multi-Cap Growth
Mid-Cap Growth
Mid-Cap Growth
Options Arbitrage/Opt Strat Fds
Options Arbitrage/Opt Strat Fds
Options Arbitrage/Opt Strat Fds
Options Arbitrage/Opt Strat Fds
Options Arbitrage/Opt Strat Fds
Options Arbitrage/Opt Strat Fds
Options Arbitrage/Opt Strat Fds
Options Arbitrage/Opt Strat Fds
Options Arbitrage/Opt Strat Fds
Options Arbitrage/Opt Strat Fds
Options Arbitrage/Opt Strat Fds
Options Arbitrage/Opt Strat Fds
Options Arbitrage/Opt Strat Fds
Options Arbitrage/Opt Strat Fds
Options Arbitrage/Opt Strat Fds
Options Arbitrage/Opt Strat Fds
Options Arbitrage/Opt Strat Fds
Options Arbitrage/Opt Strat Fds
Options Arbitrage/Opt Strat Fds
Options Arbitrage/Opt Strat Fds
Options Arbitrage/Opt Strat Fds
Options Arbitrage/Opt Strat Fds
Options Arbitrage/Opt Strat Fds
Options Arbitrage/Opt Strat Fds
Options Arbitrage/Opt Strat Fds
Options Arbitrage/Opt Strat Fds
Absolute Return
Intl Multi-Cp Val Fds
Intl Multi-Cp Gro Fds
PRNT
SMIG
PFLD
SPDV
DMDV
EEMD
TRFM
FWD
HYFI
TAFI
YEAR
HIDV
LOWV
LRGC
BCI
BCIM
BCD
SIVR
SGOL
PALL
PPLT
GLTR
ABEQ
ZIG
APCB
APMU
APIE
APUE
ADPV
AGOX
RULE
AMAX
AADR
DWAW
DWUS
DWSH
CWS
GK
BEDZ
SURE
MSOX
PSIL
YOLO
MSOS
QPX
HDGE
EATZ
VEGA
VICE
WLDR
GLIF
BTAL
AIEQ
MPAY
LEXI
ATFV
FRTY
AWEG
APRT
AUGT
DECT
FEBT
JANT
JULT
JUNT
MART
MAYT
NVBT
OCTT
SEPT
APRW
AUGW
DECW
FEBW
JANW
JULW
JUNW
MARW
MAYW
NVBW
OCTW
SEPW
SIXO
SIXJ
HIDE
IVAL
IMOM
NAV
$23.34
25.17
20.76
29.50
22.77
19.19
31.64
62.27
36.53
25.16
50.25
58.55
59.04
54.11
19.38
21.61
30.66
22.78
19.88
104.44
91.93
91.76
28.36
34.77
29.86
24.96
26.52
29.09
24.89
24.29
20.39
7.62
56.01
33.89
40.04
7.03
59.15
18.12
27.89
104.54
3.64
1.40
3.06
6.95
30.60
19.14
22.73
39.05
27.06
27.36
26.00
16.99
35.63
22.97
26.44
17.30
13.60
22.07
33.50
25.95
28.61
28.90
31.06
33.56
27.85
29.15
28.03
29.19
34.18
26.26
29.56
25.85
28.37
27.89
30.26
31.26
27.02
27.93
27.16
28.42
32.79
26.04
28.84
26.53
23.13
25.11
26.38
Net Assets
(MIL)
145.9
356.3
208.4
59.4
1.9
7.5
25.5
178.4
77.0
290.1
586.5
6.7
15.0
37.4
852.8
23.6
249.1
1125.1
2768.3
193.3
930.8
973.8
78.0
36.9
108.8
33.3
87.7
202.8
49.4
232.1
40.9
35.6
25.5
68.0
90.9
20.1
77.7
17.5
3.7
43.1
25.4
5.7
38.3
555.3
18.3
99.2
2.6
52.6
7.7
27.5
3.8
317.7
106.0
2.0
69.3
12.1
27.5
4.0
26.8
67.7
11.8
29.9
23.9
96.5
31.7
8.5
46.8
12.1
38.2
15.2
131.0
181.3
66.0
52.0
102.1
231.1
72.3
25.5
84.0
33.5
132.7
37.5
44.0
126.1
19.5
147.3
79.2
4th Qtr
Total Return
1 Year 3 Years*
14.87%
11.20
2.20
9.45
11.21
9.86
17.35
16.17
7.36
3.51
1.95
11.33
10.28
12.10
-4.68
-0.01
-3.13
3.02
11.07
-12.00
8.18
6.74
4.93
11.88
6.29
5.13
9.04
11.76
2.80
7.71
10.81
6.81
14.62
13.67
12.80
-15.50
13.96
10.81
15.81
11.48
-35.36
-9.94
-10.81
-12.79
11.76
-10.52
20.41
8.99
7.12
8.63
10.86
-8.83
19.73
7.66
10.92
19.90
12.58
12.48
8.70
8.58
8.91
9.80
10.42
8.68
8.45
8.49
8.73
6.03
8.03
8.60
5.57
6.47
7.91
6.41
4.89
6.44
5.71
5.28
5.80
3.31
5.64
6.46
5.83
8.07
1.62
7.75
11.03
13.77%
13.39
8.21
5.48
19.19
19.20
44.62
N/A
13.07
4.20
5.96
N/A
N/A
N/A
-8.35
-9.61
-7.36
-0.94
14.40
-36.38
-3.59
3.37
4.59
36.47
N/A
N/A
N/A
N/A
-0.46
18.27
6.39
6.52
18.42
11.04
20.35
-22.10
25.27
21.38
23.97
23.44
-39.27
-24.49
-14.61
-1.82
44.52
-27.06
25.37
15.49
3.10
18.67
6.47
-14.83
26.39
11.88
16.62
32.38
16.34
N/A
22.00
N/A
19.41
N/A
22.57
20.98
N/A
N/A
N/A
16.62
21.12
N/A
12.44
N/A
16.37
N/A
14.71
16.04
N/A
N/A
N/A
12.69
18.03
N/A
17.38
17.96
2.65
20.12
9.16
-9.43%
N/A
-0.60
10.10
6.63
3.46
N/A
N/A
2.06
N/A
N/A
N/A
N/A
N/A
10.04
N/A
13.22
-3.80
3.09
-21.90
-2.75
-2.13
5.23
15.80
N/A
N/A
N/A
N/A
N/A
3.49
N/A
-2.05
-1.05
-1.81
5.91
-12.27
11.19
N/A
N/A
10.44
N/A
N/A
-42.55
-42.32
6.99
-11.58
N/A
3.18
-2.90
10.23
5.55
-1.55
1.10
N/A
N/A
N/A
N/A
N/A
8.59
N/A
N/A
N/A
7.50
7.91
N/A
N/A
N/A
N/A
8.49
N/A
4.94
N/A
N/A
N/A
6.57
6.43
N/A
N/A
N/A
N/A
8.14
N/A
N/A
N/A
N/A
2.80
-5.53
Fund
Alp Arc Tail Risk
Alp Arc US Quant Moment
Alp Arc US Quant Value
Alp Arc Val Moment Trend
Alp Arch 1-3 Month Box
Alpha Dog ETF
AlphaMark Act Mgd SC
ALPS Active Eqty Opp
ALPS Active REIT
ALPS Alerian Energy Infr
Alps Alerian MLP ETF
ALPS Barron's 400 ETF
ALPS Clean Energy
ALPS Disruptive Tech
Alps Emerg Sec Div Dogs
Alps Equal Sect Wght ETF
ALPS Glbl Travel Bnfcrs
Alps Intl Sec Div Dogs
ALPS Intmdt Muni Bd
ALPS Medical Break
ALPS O'Shs Eur Qlty Dv
ALPS O'Shs Glbl Int Gnts
ALPS O'Shs US Qlty Dv
ALPS O'Shs US SC Qlty Dv
ALPS REIT Dividend Dogs
ALPS RiverFront Str Inc
Alps Sect Div Dogs ETF
Altrius Global Dividend
AltShs:Event-Driven
AltShs:Merger Arbitrage
Am Beacon Sel:AHL Trend
Amer Cent:Dvsfd Corp Bd
Amer Cent:Dvsfd Muni Bd
Amer Cent:Emerg Mkts Bd
Amer Cent:Focused Dyn Gr
Amer Cent:Focused LC Val
Amer Cent:Low Volatility
Amer Cent:MC Gro Impact
Amer Cent:Multisec F Inc
Amer Cent:Multisect Inc
Amer Cent:Qlt Dvsfd Intl
Amer Cent:Qlty Conv Secs
Amer Cent:Qlty Preferred
Amer Cent:Sel High Yld
Amer Cent:Sht Dur St Inc
Amer Cent:Sustainable Eq
Amer Cent:Sustainable Gr
Amer Cent:US Qlt Grwt
Amer Cent:US Qlt Val
Amer Consv Values
Amplify BlackSwan ISWN
Amplify BSwn Gr & Trs Cr
Amplify BSwn Tech & Trs
Amplify Cash Flow Dv Ldr
Amplify Cash Flow Hg Inc
Amplify CWP Enh Div Inc
Amplify Emg Mkts FinTech
Amplify High Income
Amplify Inflation Fghtr
Amplify Intl Enh Div Inc
Amplify Li & Batt Tech
Amplify Nat Res Div Incm
Amplify Online Retail
Amplify Seymour Cannabis
Amplify Thematic All-Str
Amplify Trans Data Shrng
Anfield Diversified Alt
Anfield Dynamic Fxd Inc
Anfield Univ Fxd Inc
Anfield US Eq Sec Rot
Angel Oak Inc
Angel Oak UltSh Inc
AOT Growth & Innovation
Appl Fin Valuation LC
Aptus Collared Inv Oppty
Aptus Defined Risk
Aptus Drawdown Managed E
Aptus Enhanced Yield
Aptus Intrntl Enhnc Yd
Aptus Large Cap Enhd Yd
Argent Mid Cap
ARK Autonomous Tch & Rob
ARK Fintech Innovation
ARK Genomic Revolution
ARK Innovation
ARK Israel Innov Tech
ARK Next Gen Int ETF
ARK Space Expl & Innov
Arrow DJ Gl Yld
Description
ETF
Symbols
Absolute Return
Mid-Cap Growth
Mid-Cap Core
Global Multi-Cap Value Fds
Short U.S. Treasury
Large-Cap Growth
Small-Cap Growth
Multi-Cap Core
Real Estate
Energy MLP
Energy MLP
Mid-Cap Core
Alternative Energy
Global Science/Technology Fds
Global Equity Income
Large-Cap Core
Consumer Services
Intl Equity Income Fds
Interm. Municipal Debt
Health/Biotechnology
Intl Equity Income Fds
Global Science/Technology Fds
Equity Income
Equity Income
Real Estate
Multi-Sector Income
Equity Income
Global Equity Income
Alternative Long/Short Eqty Fds
Alternative Event Driven
Alternative Managed Futures Fds
Core Plus Bond
General & Insured Municipal Debt
Emerging Mrkts Hard Currency Debt
Large-Cap Growth
Large-Cap Value
Large-Cap Core
Multi-Cap Growth
Loan Participation
Multi-Sector Income
Intl Multi-Cp Core Fds
Convertible Securities
Flexible Income
High Yield
Short-Intmdt Inv. Grade Debt
Large-Cap Core
Large-Cap Core
Multi-Cap Growth
Multi-Cap Value
Large-Cap Core
General U.S. Treasury
Options Arbitrage/Opt Strat Fds
Options Arbitrage/Opt Strat Fds
Equity Income
Equity Income
Equity Income
Global Science/Technology Fds
Flexible Portfolio
Real Return
Options Arbitrage/Opt Strat Fds
Basic Materials
Global Equity Income
Consumer Services
Specialty/Miscellaneous
Global Multi-Cap Growth Fds
Science & Technology
Alternative Multi-Strategy
Multi-Sector Income
Multi-Sector Income
Large-Cap Core
U.S. Mortgage
Short Inv. Grade Debt
Multi-Cap Growth
Large-Cap Core
Options Arbitrage/Opt Strat Fds
Flexible Income
Large-Cap Core
General U.S. Treasury
Intl Multi-Cp Core Fds
Large-Cap Core
Mid-Cap Growth
Industrials
Global Science/Technology Fds
Health/Biotechnology
Science & Technology
Global Science/Technology Fds
Science & Technology
Industrials
Flexible Portfolio
CAOS
QMOM
QVAL
VMOT
BOXX
RUFF
SMCP
RFFC
REIT
ENFR
AMLP
BFOR
ACES
DTEC
EDOG
EQL
JRNY
IDOG
MNBD
SBIO
OEUR
OGIG
OUSA
OUSM
RDOG
RIGS
SDOG
DIVD
EVNT
ARB
AHLT
KORP
TAXF
AEMB
FDG
FLV
LVOL
MID
FUSI
MUSI
QINT
QCON
QPFF
AHYB
SDSI
ESGA
ESGY
QGRO
VALQ
ACVF
ISWN
SWAN
QSWN
COWS
HCOW
DIVO
EMFQ
YYY
IWIN
IDVO
BATT
NDIV
IBUY
CNBS
MVPS
BLOK
DALT
ADFI
AFIF
AESR
CARY
UYLD
AOTG
VSLU
ACIO
DRSK
ADME
JUCY
IDUB
DUBS
AMID
ARKQ
ARKF
ARKG
ARKK
IZRL
ARKW
ARKX
GYLD
NAV
83.11
49.81
40.44
23.28
105.03
22.31
29.12
47.43
26.20
23.05
42.56
62.22
35.88
41.52
21.69
109.58
23.95
29.79
25.85
32.91
28.29
36.46
46.04
39.16
38.67
23.15
51.21
31.66
10.14
26.77
22.16
46.45
50.82
38.25
71.22
61.12
47.89
50.62
50.40
43.58
46.54
41.62
35.75
45.44
50.83
59.37
45.70
76.05
53.13
36.49
19.21
26.60
19.96
27.12
25.76
36.51
21.22
11.60
26.60
28.73
10.61
27.60
53.83
4.30
20.81
29.92
8.62
8.60
9.04
13.84
20.47
50.57
33.74
29.72
33.15
25.19
38.46
23.68
20.04
26.73
30.28
57.76
27.58
32.79
52.40
19.51
75.94
15.42
13.56
Net Assets
(MIL)
170.2
189.6
301.3
37.8
622.5
54.2
26.0
23.8
18.0
132.3
7493.2
132.0
268.0
97.1
30.2
324.3
6.1
236.7
31.1
83.7
36.4
136.3
656.2
388.3
11.7
111.5
1096.6
6.6
3.1
67.3
33.4
225.1
358.9
33.3
181.6
234.4
10.4
46.7
20.2
174.1
218.9
24.1
45.7
31.1
35.4
167.0
11.9
822.1
223.2
66.3
39.3
172.4
2.4
6.1
2.9
2925.0
2.2
382.3
9.0
62.4
113.7
9.5
189.3
26.7
2.8
510.8
40.1
22.4
106.9
93.0
90.5
106.5
27.7
66.9
572.2
374.0
152.0
423.1
109.1
109.4
39.1
977.0
975.1
1757.4
7997.5
90.7
1516.7
260.7
21.3
4th Qtr
Total Return
1 Year 3 Years*
2.23
16.53
9.39
7.81
1.37
15.44
17.23
11.47
16.13
5.70
3.12
11.74
-1.61
17.28
7.97
9.86
12.55
10.21
6.51
20.98
12.63
17.76
10.31
12.10
17.76
5.83
10.07
8.79
5.60
2.10
-9.70
6.14
7.33
8.87
12.83
7.85
10.74
13.24
1.83
6.58
9.97
6.27
5.58
6.54
3.32
11.91
14.09
13.04
9.70
10.82
10.05
12.05
12.78
10.54
6.48
6.59
9.63
8.16
17.46
8.85
-3.93
5.72
21.32
-11.01
17.88
51.69
3.55
5.81
3.47
13.38
3.86
2.04
16.10
11.73
9.18
9.41
9.82
0.14
7.04
9.29
17.31
10.04
42.35
17.81
32.14
5.15
40.09
11.73
10.45
13.30
9.45
28.16
-0.30
4.99
27.61
23.10
19.56
13.76
15.10
21.59
18.21
-20.33
24.88
11.32
16.87
20.02
22.63
6.47
8.18
24.94
49.65
13.23
18.82
10.37
6.25
4.10
13.99
13.21
4.04
N/A
7.21
6.52
7.70
37.16
6.08
14.90
22.22
N/A
7.71
20.81
9.32
11.27
12.27
6.02
24.72
43.14
32.29
13.82
23.84
7.48
11.80
23.19
N/A
N/A
6.98
12.28
12.77
34.53
17.44
-6.75
15.49
37.72
-16.43
40.29
98.09
6.54
6.47
9.58
21.08
9.05
6.94
54.28
26.63
15.81
2.00
15.49
3.50
9.22
N/A
31.27
40.69
92.86
16.21
67.82
11.20
97.00
24.18
11.38
0.01
-0.78
14.99
-1.39
N/A
N/A
4.21
7.71
N/A
23.89
28.51
9.12
-22.69
-3.30
3.73
10.55
N/A
9.33
N/A
-13.66
7.54
-12.41
8.33
9.98
3.66
0.54
8.95
N/A
0.11
3.28
N/A
-1.31
-0.14
N/A
-1.42
7.99
N/A
-0.68
N/A
N/A
1.76
N/A
N/A
N/A
N/A
9.10
N/A
7.54
10.17
10.42
N/A
-3.59
N/A
N/A
N/A
8.98
-24.28
0.29
N/A
N/A
-9.47
N/A
-22.20
-37.26
N/A
-0.22
-0.71
-3.10
1.13
7.80
N/A
N/A
N/A
N/A
7.10
-2.36
2.83
N/A
N/A
N/A
N/A
-8.58
-17.78
-29.27
-24.84
-12.81
-18.89
N/A
6.40
January 8, 2024
BARRON’S
•
L31
Funds Quarterly
ETF Score Card
For personal non-commercial use only. Do not edit or alter. Reproductions not permitted.
To reprint or license content, please contact Barron's reprints department at 800-843-0008 or www.djreprints.com
Fund
Arrow DWA Tct:Intl
Arrow DWA Tct:Macro
Arrow Reserve Cap Mgmt
Arrow Reverse Cap 500
Astoria US Quality Kings
Avantis All Eqty Mkt Val
Avantis All Equity Mkts
Avantis All Int Mkt Eqty
Avantis All Int Mkt Val
Avantis Core Fxd Inc
Avantis Core Mun Fxd Inc
Avantis Emg Mkts Eq
Avantis Emg Mkts Val
Avantis Inflation Foc Eq
Avantis Internatl SmCp E
Avantis Intl Equity
Avantis Intl Lg Cap Val
Avantis Intl SC Val
Avantis Moderate Alloc
Avantis Real Estate ETF
Avantis Resp EmgMkts Eq
Avantis Resp Intl Eqty
Avantis Resp US Eqty
Avantis Sh-Tm Fxd Income
Avantis US Equity
Avantis US Lg Cap Value
Avantis US Lg Cp Eqty
Avantis US Sm Cap Eqty
Avantis US Sm Cap Val
AXS 1.25X NVDA Bear Dly
AXS 2X Innovation
AXS Astoria Infl Senstv
AXS Cannabis
AXS Change Finance ESG
AXS Esoterica NextG Econ
AXS First Priority CLO B
AXS Green Alpha
AXS Real Estate Income
AXS Short Innovation Dly
AXS TSLA Bear Daily
Bahl & Gaynor Inc Grwth
Ballast Small/Mid Cap
Barclays iPath Sel MLP
BdywnGL Dy US LCap Value
Beacon Selective Risk
Beacon Tactical Risk
BFT:Bitwise B&E EWS
BFT:Bitwise Btc Str OR
BFT:Bitwise Ethereum Str
BFT:Bitwise Web3
Bitwise Crypto Ind Innov
BlackRock:AAA CLO
BlackRock:Adv LgCp Inc
BlackRock:Flexible Inc
BlackRock:Floating Rt Ln
BlackRock:Ft Clim Sust E
BlackRock:Ftr Fin & Tech
BlackRock:Futr US Themes
Blackrock:Future Health
BlackRock:Future Tech
BlackRock:HY Mun Inc Bd
BlackRock:Int Mun Inc Bd
Blackrock:iShares LCD Bf
Blackrock:iShares LCM Bf
BlackRock:Large Cap Val
BlackRock:ShTm Cal Mu Bd
BlackRock:US Carbon TR
Blackrock:US Eq Fac Rot
BlackRock:World xUS CTR
Blue Horizon BNE
Blueprint Chesapeake MAT
BlueStar Israel Tech
BNYM ETF:Conc Intl
BNYM ETF:Core Bond
BNYM ETF:Emg Mkts Equity
BNYM ETF:Global Infra In
BNYM ETF:High Yield Beta
BNYM ETF:Innovators
BNYM ETF:Intl Equity
BNYM ETF:Resp Hrz CpBd
BNYM ETF:Sust Glbl EM
BNYM ETF:Sust Intl Eqty
BNYM ETF:Sust US Eqty
BNYM ETF:Ultra Short Inc
BNYM ETF:US LC Core Eqty
BNYM ETF:US MC Core Eqty
BNYM ETF:US SC Core Eqty
BNYM ETF:Women's Opps
BondBloxx:B USD HY CB
BondBloxx:BB USD HY CB
BondBloxx:Blm 10Y TD UST
BondBloxx:Blm 1Y TD UST
Description
ETF
Symbols
Intl Multi-Cp Gro Fds
Flexible Portfolio
Short Inv. Grade Debt
Mid-Cap Core
Large-Cap Core
Global Multi-Cap Value Fds
Global Multi-Cap Core Fds
Intl Multi-Cp Core Fds
Intl Multi-Cp Val Fds
General Bond
General & Insured Municipal Debt
Emerging Markets
Emerging Markets
Multi-Cap Value
Intl Sm/Md-Cp Val Fds
Intl Multi-Cp Val Fds
Intl Multi-Cp Val Fds
Intl Sm/Md-Cp Val Fds
Mixed-Asset Trgt Alloc Mod Fds
Global Real Estate
Emerging Markets
Intl Multi-Cp Core Fds
Multi-Cap Core
Short Inv. Grade Debt
Multi-Cap Core
Multi-Cap Value
Large-Cap Value
Small-Cap Core
Small-Cap Core
Dedicated Short Bias
Equity Leverage
Real Return
Specialty/Miscellaneous
Multi-Cap Core
Global Science/Technology Fds
Loan Participation
Multi-Cap Core
Real Estate
Dedicated Short Bias
Dedicated Short Bias
Equity Income
Small-Cap Core
Energy MLP
Multi-Cap Value
Flexible Portfolio
Flexible Portfolio
Alternative Currency Strategies
Alternative Managed Futures Fds
Alternative Currency Strategies
Science & Technology
Specialty/Miscellaneous
Loan Participation
Alternative Long/Short Eqty Fds
Flexible Income
Loan Participation
Alternative Energy
Global Science/Technology Fds
Multi-Cap Core
Global Health/Biotechnology Fds
Global Science/Technology Fds
High Yield Municipal Debt
Interm. Municipal Debt
Options Arbitrage/Opt Strat Fds
Options Arbitrage/Opt Strat Fds
Large-Cap Value
California Municipal Debt
Multi-Cap Core
Large-Cap Core
Intl Large-Cp Core Fds
Alternative Energy
Flexible Portfolio
Global Science/Technology Fds
Intl Large-Cp Gro Fds
Core Bond
Emerging Markets
Global Infrastructure
High Yield
Multi-Cap Growth
Intl Large-Cp Core Fds
Corporate Debt BBB-Rated
Emerging Markets
Intl Large-Cp Gro Fds
Large-Cap Core
Ultra-Short Obligations
Large-Cap Core
Mid-Cap Core
Small-Cap Core
Multi-Cap Core
High Yield
High Yield
General U.S. Treasury
Short U.S. Treasury
DWCR
DWAT
ARCM
YPS
ROE
AVGV
AVGE
AVNM
AVNV
AVIG
AVMU
AVEM
AVES
AVIE
AVDS
AVDE
AVIV
AVDV
AVMA
AVRE
AVSE
AVSD
AVSU
AVSF
AVUS
AVLV
AVLC
AVSC
AVUV
NVDS
TARK
PPI
THCX
CHGX
WUGI
AAA
NXTE
RINC
SARK
TSLQ
BGIG
MGMT
ATMP
DVAL
BSR
BTR
BTOP
BITC
AETH
BWEB
BITQ
CLOA
BALI
BINC
BRLN
BECO
BPAY
BTHM
BMED
BTEK
HYMU
INMU
IVVB
IVVM
BLCV
CALY
LCTU
DYNF
LCTD
BNE
TFPN
ITEQ
BKCI
BKAG
BKEM
BKGI
BKHY
BKIV
BKIE
RHCB
BKES
BKIS
BKUS
BKUI
BKLC
BKMC
BKSE
BKWO
XB
XBB
XTEN
XONE
NAV
29.48
10.21
100.04
22.58
26.00
56.08
64.72
53.71
54.27
41.79
46.81
56.32
45.91
57.68
51.64
60.38
51.45
62.41
54.07
43.21
47.88
53.86
56.12
46.36
81.50
57.72
55.63
51.02
89.70
29.09
92.10
27.48
17.00
33.23
51.43
24.87
32.92
25.77
25.97
27.97
25.65
36.80
21.41
12.31
25.92
23.08
34.14
33.34
32.25
43.46
11.61
51.18
26.58
52.00
51.96
21.16
22.78
25.61
24.52
23.23
22.07
23.79
25.96
26.53
28.50
50.29
52.27
39.63
43.67
23.19
24.14
46.22
49.01
42.48
56.33
27.95
47.45
29.21
71.29
46.28
40.35
44.72
48.14
49.46
90.32
90.67
93.46
28.62
39.54
40.12
47.82
49.75
Net Assets
(MIL)
8.5
3.0
51.0
8.6
64.7
35.6
252.0
4.4
1.2
620.9
129.2
4347.4
317.7
3.4
5.8
3462.7
284.6
4608.6
3.9
363.0
61.2
123.0
197.7
257.6
5112.5
1761.8
170.6
488.4
7467.6
74.0
69.8
57.3
14.3
126.4
23.1
10.0
76.5
59.1
158.0
74.9
108.0
114.0
297.5
144.2
26.4
24.5
2.4
2.4
1.5
0.9
99.7
61.6
19.8
378.4
20.8
4.0
4.2
4.9
3.6
13.2
60.1
23.4
11.3
11.5
6.5
20.1
1434.9
46.0
422.4
4.8
66.1
84.1
77.6
577.9
92.9
15.2
62.4
10.3
509.1
22.4
9.7
8.6
9.3
32.1
1882.6
464.0
104.4
10.9
13.5
53.0
47.3
575.5
4th Qtr
Total Return
1 Year 3 Years*
11.50
4.62
1.61
12.42
11.76
10.85
11.29
9.39
8.96
7.00
6.62
8.88
8.93
2.34
11.12
10.11
8.85
9.61
9.58
16.59
9.38
11.37
13.68
3.28
11.75
10.19
12.41
15.75
15.72
-15.85
63.68
7.35
-5.38
13.29
15.42
2.10
17.18
9.77
-26.07
-1.96
9.00
8.12
3.43
7.37
4.29
-1.52
44.35
52.33
37.57
42.39
76.04
2.22
9.82
5.67
3.09
9.93
14.15
10.12
9.23
13.58
9.24
6.26
6.33
6.09
12.43
1.98
11.53
13.60
10.46
5.09
-2.30
12.04
13.73
6.80
7.30
9.56
7.08
17.88
10.48
8.24
7.00
11.16
12.20
1.96
12.47
14.05
15.66
12.88
6.70
7.29
8.95
1.85
8.18
-1.03
5.03
11.83
N/A
N/A
19.17
N/A
N/A
6.25
5.23
15.13
16.85
4.19
N/A
17.13
18.56
16.66
N/A
8.96
16.18
17.79
24.37
5.17
21.69
17.37
N/A
19.40
22.65
-83.11
119.86
11.77
-34.00
23.69
61.37
8.33
13.45
N/A
-46.26
-59.96
N/A
17.28
22.25
8.78
N/A
N/A
N/A
N/A
N/A
98.14
245.36
N/A
N/A
N/A
12.46
6.12
13.26
24.35
5.67
33.09
9.70
5.78
N/A
N/A
N/A
N/A
25.15
36.20
16.81
1.31
N/A
4.91
17.75
5.50
9.36
9.31
13.06
N/A
18.31
8.73
4.41
12.96
23.87
5.75
30.69
17.45
22.36
N/A
13.53
11.00
3.73
4.73
0.31
3.51
1.72
8.23
N/A
N/A
N/A
N/A
N/A
-3.57
-0.75
-0.29
N/A
N/A
N/A
4.78
N/A
6.19
N/A
N/A
N/A
N/A
N/A
-0.57
10.51
N/A
N/A
N/A
18.43
N/A
N/A
N/A
-47.90
5.91
0.77
3.22
N/A
N/A
N/A
N/A
N/A
12.20
29.85
9.56
N/A
N/A
N/A
N/A
N/A
N/A
N/A
N/A
N/A
N/A
N/A
N/A
N/A
N/A
-6.52
-12.46
N/A
N/A
N/A
N/A
N/A
N/A
N/A
10.75
N/A
-5.34
N/A
-12.31
N/A
-3.37
-5.51
N/A
1.77
N/A
5.01
N/A
N/A
N/A
N/A
N/A
9.78
6.89
5.10
N/A
N/A
N/A
N/A
N/A
Fund
BondBloxx:Blm 20Y TD UST
BondBloxx:Blm 2Y TD UST
BondBloxx:Blm 3Y TD UST
BondBloxx:Blm 5Y TD UST
BondBloxx:Blm 6Mo TD UST
BondBloxx:Blm 7Y TD UST
BondBloxx:CCC USD HY CB
BondBloxx:JPM USD EM1-10
Bondbloxx:USD HY Bd SR
BondBloxx:USD HYB CC S
BondBloxx:USD HYB CNC S
BondBloxx:USD HYB Enrg S
BondBloxx:USD HYB F&R S
BondBloxx:USD HYB HlCr S
BondBloxx:USD HYB Ind S
BondBloxx:USD HYB TM&T S
Bridges Capital Tactical
Brookstone Active
Brookstone Dvdnd Stk
Brookstone Grwth Stck
Brookstone Intrmdt Bd
Brookstone Opportunities
Brookstone Ult-Shrt Bd
Brookstone Val Stck
Brookstone Yield
BTD Capital
Build Bond Innovation
Burney US Factor Rotatn
Bushido Capital US Eqty
Cabana Tgt Drawdown 10
Cabana Tgt Drawdown 13
Cabana Tgt Drawdown 16
Cabana Tgt Drawdown 7
Cabana Tgt Ld Sec Aggr
Cabana Tgt Ld Sec Cons
Cabana Tgt Ld Sec Mod
Calamos:AntetokounmpoGSE
Calvert Intl Resp Idx
Calvert Ultra-Sh Inv Gr
Calvert US LC Cr Resp Id
Calvert US LC DEI Id
Calvert US MC Cr Res Id
Calvert US Select Eqty
Cambiar Aggrssv Value
Cambria Cannabis
Cambria Emg Shrhldr Yld
Cambria For ShHolder Yld
Cambria Glbl Asset Alloc
Cambria Global Mom ETF
Cambria Global Real Est
Cambria Global Tail Risk
Cambria Global Value ETF
Cambria Shrhldr Yld ETF
Cambria Tail Risk
Cambria Trinity ETF
Cambria Val and Momentum
Cap Grp Core Eqty
Cap Grp Core Plus Income
Cap Grp Dividend Growers
Cap Grp Dividend Value
Cap Grp Glbl Growth Eqty
Cap Grp Growth
Cap Grp Intl Foc Eqty
Cap Grp Municipal Inc
Cap Grp Shrt Dur Inc
Cap Grp Shrt Dur Mun Inc
Cap Grp US MS Inc
Cap Link Gl Fintech Ldrs
Capital Group Core Bal
Capital Group Core Bond
Capital Group Intl Eqty
Carbon Cllctv CS US Eq
Carbon Strategy
Cboe Vld S&P 500 D PW Id
ClearBridge AC Grw ESG
ClearBridge Div Str ESG
ClearBridge Foc Val ESG
ClearBridge LC Gr ESG
ClearShares OCIO
ClearShares Piton Int FI
ClearShares Ult-Sht Mat
Clockwise Cap Eq & Innov
Clough Long/Short Equity
Clough Select Equity
CNIC ICE US Cb Ntrl PFI
Columbia:Dvsd FI All ETF
Columbia:EM Consumer ETF
Columbia:EM Cre ex-China
Columbia:India Consumer
Columbia:Intl ESG Eq ETF
Columbia:Mlt-Sec Mun Inc
Columbia:Research Enh Cr
Data provided by
Description
ETF
Symbols
General U.S. Treasury
Short U.S. Treasury
Short-Interm. U.S. Government
Interm. U.S. Government
Short U.S. Treasury
Interm. U.S. Government
High Yield
Emerging Mrkts Hard Currency Debt
High Yield
High Yield
High Yield
High Yield
High Yield
High Yield
High Yield
High Yield
Flexible Portfolio
Mixed-Asset Trgt Alloc Gro Fds
Equity Income
Large-Cap Growth
Short Inv. Grade Debt
Flexible Portfolio
Ultra-Short Obligations
Mid-Cap Value
Flexible Portfolio
Multi-Cap Core
Flexible Portfolio
Multi-Cap Core
Large-Cap Value
Flexible Portfolio
Flexible Portfolio
Flexible Portfolio
Flexible Portfolio
Mixed-Asset Trgt All Agg Gr Fds
Mixed-Asset Trgt Alloc Con Fds
Mixed-Asset Trgt Alloc Mod Fds
Global Multi-Cap Growth Fds
Intl Large-Cp Core Fds
Ultra-Short Obligations
Multi-Cap Core
Large-Cap Core
Mid-Cap Core
Multi-Cap Core
Global Multi-Cap Value Fds
Specialty/Miscellaneous
Emerging Markets
Intl Equity Income Fds
Flexible Portfolio
Global Multi-Cap Core Fds
Global Real Estate
Global Income
Intl Multi-Cp Val Fds
Equity Income
Absolute Return
Absolute Return
Small-Cap Core
Large-Cap Core
Core Plus Bond
Global Equity Income
Equity Income
Global Large-Cap Growth Fds
Multi-Cap Growth
Intl Large-Cp Gro Fds
General & Insured Municipal Debt
Short Inv. Grade Debt
Short Municipal Debt
Multi-Sector Income
Global Science/Technology Fds
Mixed-Asset Trgt Alloc Gro Fds
Core Bond
Intl Multi-Cp Gro Fds
Specialty/Miscellaneous
Commodities Energy
Options Arbitrage/Opt Strat Fds
Large-Cap Growth
Equity Income
Large-Cap Value
Large-Cap Growth
Mixed-Asset Trgt Alloc Mod Fds
Core Bond
Ultra-Short Obligations
Science & Technology
Alternative Long/Short Eqty Fds
Small-Cap Growth
Alternative Managed Futures Fds
Multi-Sector Income
Emerging Markets
Emerging Markets
India Region
Intl Equity Income Fds
General & Insured Municipal Debt
Large-Cap Core
XTWY
XTWO
XTRE
XFIV
XHLF
XSVN
XCCC
XEMD
HYSA
XHYC
XHYD
XHYE
XHYF
XHYH
XHYI
XHYT
BDGS
BAMA
BAMD
BAMG
BAMB
BAMO
BAMU
BAMV
BAMY
DIP
BFIX
BRNY
SMRI
TDSC
TDSD
TDSE
TDSB
CLSA
CLSC
CLSM
SROI
CVIE
CVSB
CVLC
CDEI
CVMC
CVSE
CAMX
TOKE
EYLD
FYLD
GAA
GMOM
BLDG
FAIL
GVAL
SYLD
TAIL
TRTY
VAMO
CGUS
CGCP
CGDG
CGDV
CGGO
CGGR
CGXU
CGMU
CGSD
CGSM
CGMS
KOIN
CGBL
CGCB
CGIE
CCSO
KARB
PUTD
CACG
YLDE
CFCV
LRGE
OCIO
PIFI
OPER
TIME
CBLS
CBSE
AMPD
DIAL
ECON
XCEM
INCO
ESGN
MUST
RECS
NAV
45.00
49.40
49.33
49.16
50.17
48.43
38.54
40.79
15.00
37.01
37.68
38.54
36.93
33.95
37.71
34.97
26.94
27.01
27.52
27.99
25.53
26.93
25.11
28.22
25.93
25.90
22.99
32.27
26.42
23.26
22.98
23.24
21.64
19.42
19.39
20.39
26.58
53.78
50.22
59.71
61.25
53.45
57.49
26.41
5.87
31.21
25.76
28.05
27.55
25.29
17.95
21.34
67.50
12.84
25.15
28.26
28.27
22.66
27.10
29.81
25.69
28.22
23.85
27.00
25.41
25.78
26.91
31.14
27.29
26.38
27.59
19.53
32.48
21.06
47.09
44.34
35.87
59.63
30.71
92.49
100.06
21.02
20.50
25.14
22.61
18.04
20.95
30.26
58.61
28.66
20.80
27.66
Net Assets
(MIL)
28.3
100.9
32.7
38.5
1144.2
65.3
22.3
201.8
29.6
23.5
11.1
21.1
30.7
11.5
42.4
30.5
19.6
29.4
55.8
55.1
47.2
27.5
57.2
58.0
28.1
3.5
17.5
214.5
271.8
292.5
69.3
47.9
95.5
39.9
25.9
103.7
10.2
71.7
46.4
236.0
29.4
27.2
25.3
49.5
9.8
243.8
206.1
51.6
145.3
22.3
2.7
112.6
928.7
111.8
113.6
62.0
1581.0
1314.2
74.0
4831.0
2257.3
3401.7
1734.8
417.0
295.2
46.0
292.2
12.9
59.1
52.1
41.3
20.1
0.7
29.6
107.2
34.4
3.3
175.2
128.5
93.4
235.4
18.0
7.8
6.1
4.8
382.4
65.6
609.4
140.3
7.0
388.9
259.7
4th Qtr
Total Return
1 Year 3 Years*
15.70
2.65
3.49
5.09
1.54
6.43
6.98
7.02
7.01
7.06
7.45
5.01
7.78
8.01
6.58
7.41
6.99
8.27
10.51
10.99
2.82
7.98
1.20
13.51
5.22
8.16
3.82
13.73
8.92
8.22
8.83
8.96
6.03
9.82
4.35
6.33
11.79
11.65
1.94
12.85
13.55
12.63
13.09
8.08
2.27
9.29
8.26
7.66
3.33
10.99
-3.75
11.65
9.30
0.01
4.25
6.09
13.08
7.05
9.66
13.33
12.44
15.53
9.95
6.41
2.87
4.00
7.21
11.13
10.03
6.65
11.06
7.22
1.55
7.01
16.26
10.24
12.97
15.31
7.56
4.23
1.35
15.26
8.18
13.22
-8.65
8.52
5.37
11.99
14.45
8.04
7.61
11.31
2.38
4.23
4.33
4.42
4.91
3.73
19.24
9.96
N/A
15.36
12.19
12.12
13.77
13.21
12.31
11.69
N/A
N/A
N/A
N/A
N/A
N/A
N/A
N/A
N/A
9.76
5.21
22.33
N/A
7.59
11.14
9.01
4.10
10.26
1.77
3.90
N/A
N/A
N/A
N/A
N/A
N/A
N/A
20.33
-9.89
17.97
12.95
8.66
0.93
2.54
-9.97
13.78
16.47
-12.98
4.53
5.65
27.64
7.25
N/A
28.83
23.30
42.13
15.38
6.78
5.14
N/A
11.39
17.52
N/A
N/A
N/A
13.97
7.53
N/A
43.08
15.56
20.94
45.98
12.10
4.56
5.11
57.81
-2.78
16.90
N/A
8.48
7.34
20.30
34.12
21.09
5.98
22.91
N/A
N/A
N/A
N/A
N/A
N/A
N/A
N/A
N/A
N/A
N/A
N/A
N/A
N/A
N/A
N/A
N/A
N/A
N/A
N/A
N/A
N/A
N/A
N/A
N/A
N/A
N/A
N/A
N/A
-0.30
-1.20
-0.66
-2.08
N/A
N/A
N/A
N/A
N/A
N/A
N/A
N/A
N/A
N/A
8.15
-24.09
3.89
8.03
3.11
5.12
2.12
-11.58
4.92
17.46
-12.98
5.16
14.88
N/A
N/A
N/A
N/A
N/A
N/A
N/A
N/A
N/A
N/A
N/A
1.70
N/A
N/A
N/A
N/A
N/A
N/A
5.86
8.91
9.70
7.22
3.59
-1.36
2.39
N/A
-3.97
2.50
N/A
-3.31
-8.16
2.12
14.13
8.08
-0.28
11.93
L32
BARRON’S
•
Funds Quarterly
January 8, 2024
ETF Score Card
For personal non-commercial use only. Do not edit or alter. Reproductions not permitted.
To reprint or license content, please contact Barron's reprints department at 800-843-0008 or www.djreprints.com
Fund
Columbia:Research Enh Va
Columbia:Rsrch Enh Rl E
Columbia:Sel Smcn & Tech
Columbia:Short Dur Bond
Columbia:US ESG Eq ETF
Conductor Glbl Eqty Val
Congress LC Growth
Congress SMid Growth
Convergence L/S Equity
Core Alternative
CornerCap Fundamtrcs LC
CP High Yield Trend ETF
Crdt Suis Gld Shs Cvrd
Crdt Suis Slvr Shs Cvrd
Crdt Suis XL Cru Oil SCC
CrsBdg Pre-Merger SPAC
Cultivar
Davis:Sel Financial ETF
Davis:Sel Internatl ETF
Davis:Sel US Equity ETF
Davis:Sel Worldwide ETF
Day Hagan/NDR SS Fxd Inc
Day Hagan/Ned D RSS Intl
Day Hagan/Ned Dvs RSS
DB Agri Double Long ETN
DB Agriculture DS ETN
DB Agriculture Long ETN
DB Agriculture Short ETN
DB Base Met Db Long ETN
DB Base Metals Db Sh ETN
DB Base Metals Short ETN
DB Commodity Db Lng ETN
DB Commodity Db Sht ETN
DB Commodity Long ETN
DB Commodity Short ETN
DB Crude Oil Long ETN
DB Crude Oil Short ETN
DB Gold Double Long ETN
DB Gold Double Short ETN
DB Gold Short ETN
Defiance Htl Air Cr
Defiance Nasdaq 100 EOI
Defiance Next Gen Conn
Defiance Next Gen H2
Defiance Pure EV
Defiance Quantum
Defiance S&P 500 EOI
Democracy Intl
Democratic Lg Cap Core
DFA Cali Mun Bd
DFA Core Fixed Income
DFA Em Core Eqty Mkt
DFA Em Mkts Core Eqty 2
DFA Em Mkts High Prof
DFA Em Mkts Sust Core 1
DFA Em Mkts Value
DFA Glbl Sust Fx Inc
DFA Global Real Estate
DFA Infl-Protected Secs
DFA Intl Value
DFA Intl Core Eqty Mkt
DFA Intl Core Equity 2
DFA Intl High Profit
DFA Intl Small Cap
DFA Intl Small Cap Value
DFA Intl Sustn Core 1
DFA National Muni Bd
DFA Short-Durtn Fxd Inc
DFA Ultrashort Fixed Inc
DFA US Core Eq 1
DFA US Core Eqty Mkt
DFA US Core Equity 2
DFA US Equity
DFA US High Profit
DFA US Large Cap Value
DFA US Marketwide Value
DFA US Real Estate
DFA US Sm Cap Value
DFA US Small Cap
DFA US Sustain Core 1
DFA US Tgt Value
DFA World Equity
DFA World Ex US Cr Eq 2
DGA Absolute Return
Direxion:20+Y Trs Br 3X
Direxion:7-10Y Trs Bl 3X
Direxion:7-10Y Trs Br 3X
Direxion:AAPL Bear 1X
Direxion:AAPL Bull 1.5X
Direxion:Aero & Def Bl3X
Direxion:AMZN Bear 1X
Direxion:AMZN Bull 1.5X
Description
ETF
Symbols
Multi-Cap Value
Real Estate
Science & Technology
Short Inv. Grade Debt
Equity Income
Global Small-/Mid-Cap
Large-Cap Growth
Mid-Cap Growth
Alternative Act Extension Fds
Equity Income
Multi-Cap Value
High Yield
Commodities Prec Metals Fds
Commodities Prec Metals Fds
Commodities Energy
Alternative Event Driven
Multi-Cap Value
Financial Services
Intl Multi-Cp Core Fds
Large-Cap Value
Global Multi-Cap Value Fds
Absolute Return Bond
Intl Multi-Cp Core Fds
Large-Cap Core
Commodities Specialty
Commodities Specialty
Commodities Agriculture
Commodities Specialty
Commodities Specialty
Commodities Specialty
Commodities Specialty
Commodities Specialty
Commodities Specialty
Commodities General
Commodities Specialty
Commodities Energy
Commodities Specialty
Commodities Specialty
Commodities Specialty
Commodities Specialty
Consumer Services
Options Arbitrage/Opt Strat Fds
Telecommunication
Alternative Energy
Absolute Return
Global Science/Technology Fds
Options Arbitrage/Opt Strat Fds
Intl Large-Cp Core Fds
Multi-Cap Core
California Municipal Debt
Corporate Debt BBB-Rated
Emerging Markets
Emerging Markets
Emerging Markets
Emerging Markets
Emerging Markets
Global Income
Global Real Estate
Inflation Protected Bond
Intl Multi-Cp Val Fds
Intl Multi-Cp Core Fds
Intl Multi-Cp Core Fds
Intl Multi-Cp Gro Fds
Intl Sm/Md-Cp Core Fds
Intl Sm/Md-Cp Val Fds
Intl Multi-Cp Core Fds
Interm. Municipal Debt
Short Inv. Grade Debt
Ultra-Short Obligations
Small-Cap Core
Multi-Cap Core
Multi-Cap Core
Large-Cap Core
Large-Cap Core
Multi-Cap Value
Multi-Cap Value
Real Estate
Small-Cap Value
Small-Cap Core
Multi-Cap Core
Small-Cap Value
Global Multi-Cap Core Fds
Intl Multi-Cp Val Fds
Absolute Return
Specialty Fixed Income
Specialty Fixed Income
Specialty Fixed Income
Dedicated Short Bias
Equity Leverage
Equity Leverage
Dedicated Short Bias
Equity Leverage
REVS
CRED
SEMI
SBND
ESGS
CGV
CAML
CSMD
CLSE
CCOR
FUNL
HYTR
GLDI
SLVO
USOI
SPC
CVAR
DFNL
DINT
DUSA
DWLD
SSFI
SSXU
SSUS
DGP
DZZ
DGZ
CRUZ
QQQY
FIVG
HDRO
EVXX
QTUM
JEPY
DMCY
DEMZ
DFCA
DFCF
DFAE
DFEM
DEHP
DFSE
DFEV
DFSB
DFGR
DFIP
DFIV
DFAI
DFIC
DIHP
DFIS
DISV
DFSI
DFNM
DFSD
DUSB
DCOR
DFAU
DFAC
DFUS
DUHP
DFLV
DFUV
DFAR
DFSV
DFAS
DFSU
DFAT
DFAW
DFAX
HF
TMV
TYD
TYO
AAPD
AAPU
DFEN
AMZD
AMZU
NAV
21.66
21.54
22.36
18.35
40.66
13.27
27.57
26.65
17.05
27.57
36.56
21.38
145.06
74.08
69.64
21.16
25.19
30.24
18.50
35.17
29.60
21.35
27.07
35.64
3.80
16.44
13.32
27.69
8.71
4.51
15.07
3.58
11.71
13.47
25.03
7.79
9.88
43.43
2.36
9.86
21.55
17.66
35.86
6.47
24.80
54.33
18.01
24.66
29.36
50.61
42.35
24.13
24.96
24.23
31.58
25.18
51.77
25.95
41.19
34.38
28.66
25.54
25.67
24.16
25.78
31.99
48.41
46.83
50.23
53.48
33.23
29.21
51.79
28.59
27.02
37.20
22.71
29.09
59.55
31.10
52.28
54.88
24.44
20.67
29.66
28.02
13.10
20.19
27.38
24.45
17.41
27.16
Net Assets
(MIL)
21.0
3.0
28.0
52.4
48.8
106.2
37.6
31.7
31.5
285.7
169.9
4.2
81.2
128.7
333.9
70.2
29.0
174.1
154.5
385.5
256.2
42.3
36.0
602.9
2.6
0.1
0.7
0.1
0.4
0.2
0.3
0.6
0.1
0.3
0.2
1.9
0.1
82.7
4.3
3.1
38.6
226.2
559.9
25.0
2.1
184.3
93.7
7.1
26.4
190.2
3796.8
3207.0
2702.0
177.1
171.6
486.3
221.0
1216.2
447.2
6044.6
4490.5
4642.5
1519.9
810.1
1432.5
266.6
1082.6
1804.8
85.6
177.2
4332.1
22489.3
7292.6
3601.1
1120.3
8902.2
765.2
2097.6
6326.7
633.7
8503.6
122.7
5969.7
16.3
221.1
52.6
22.6
29.4
36.8
176.1
4.1
46.1
4th Qtr
Total Return
1 Year 3 Years*
8.83
19.07
16.39
4.53
9.07
8.18
11.75
9.91
6.63
-0.13
11.24
5.24
10.38
8.28
-13.14
1.09
11.11
15.44
5.01
14.98
8.71
5.32
5.69
5.57
-8.89
11.07
-3.85
6.14
3.69
-3.27
-0.82
-16.42
23.13
-7.91
11.81
-17.66
23.80
20.68
-16.92
-8.05
16.15
9.74
15.08
-2.79
-4.34
13.64
7.94
10.76
12.30
4.60
6.80
7.19
7.53
7.25
7.61
6.86
7.65
17.26
4.74
6.14
10.14
9.80
10.88
10.59
8.94
11.82
5.13
2.85
1.67
11.49
11.44
11.84
11.81
11.78
9.56
9.74
17.79
15.30
13.75
12.47
14.84
11.22
8.99
9.37
-32.26
16.18
-14.22
-9.86
17.38
64.38
-16.41
27.36
13.22
N/A
45.34
6.74
11.86
4.99
N/A
N/A
17.51
-11.39
13.94
8.13
8.98
-2.10
5.95
6.05
11.84
14.21
6.53
33.66
20.02
4.22
9.81
17.95
-8.22
15.08
-1.64
10.09
-8.32
-0.30
4.45
-20.13
18.47
-7.77
12.90
-3.71
7.04
17.74
-14.50
-4.46
35.30
N/A
21.88
-30.76
N/A
39.60
N/A
17.13
24.47
N/A
6.97
12.63
13.61
11.89
14.50
15.58
9.41
9.62
4.00
17.75
17.58
17.20
18.90
15.03
19.59
17.95
3.91
5.89
N/A
N/A
24.66
21.87
26.38
20.92
12.45
13.11
11.06
19.22
17.53
26.29
20.84
N/A
16.59
N/A
-9.66
-2.78
0.68
-30.47
68.43
24.27
-46.50
118.55
11.03
N/A
N/A
N/A
13.78
6.85
N/A
N/A
13.16
0.09
10.60
-0.48
1.40
-1.28
18.51
N/A
N/A
11.10
-6.11
8.27
-0.33
N/A
N/A
7.70
19.52
-20.64
11.33
-9.10
2.89
-16.27
-5.54
30.10
-40.16
17.00
-19.81
20.54
-25.88
-0.67
-3.28
0.10
N/A
N/A
3.68
N/A
N/A
10.49
N/A
N/A
9.94
N/A
N/A
-1.21
N/A
N/A
N/A
N/A
N/A
N/A
N/A
10.00
5.23
N/A
N/A
N/A
N/A
N/A
N/A
N/A
N/A
N/A
9.53
9.76
9.38
N/A
N/A
9.49
N/A
N/A
9.53
N/A
15.33
N/A
3.74
N/A
31.75
-21.29
19.23
N/A
N/A
14.55
N/A
N/A
Fund
Direxion:Auspice BC Stra
Direxion:China Bear 3X
Direxion:Cloud Comp Bl2X
Direxion:Cons Dis BL 3X
Direxion:CSI Ch Int Bl2X
Direxion:CSI300 ChA Bl2X
Direxion:DJ Int Bear 3X
Direxion:DJ Int Bull 3X
Direxion:Dl NVDA Bl 1.5X
Direxion:Dly NVDA Br 1x
Direxion:Elctr & AV Bl2X
Direxion:EnergyBear 2X
Direxion:EnergyBull 2X
Direxion:Finl Bear 3X
Direxion:Finl Bull 3X
Direxion:FTSE Chn Bl 3X
Direxion:FTSE EU Bull 3X
Direxion:Gl Cln En Bl 2X
Direxion:Gold M Id Bl 2X
Direxion:Gold M Id Br 2X
Direxion:GOOGL Bear 1X
Direxion:GOOGL Bull 1.5X
Direxion:Hbldrs&Sup Bl3X
Direxion:HCM TE US Eq St
Direxion:Hlthcre Bull 3X
Direxion:Hydrogen ETF
Direxion:Industrls Bl 3X
Direxion:Jr Mnr Bear 2X
Direxion:Jr Mnr Bull 2X
Direxion:MidCapBull 3X
Direxion:Moonshot Innov
Direxion:MSCI Bra Bull2X
Direxion:MSCI EM Bear 3X
Direxion:MSCI EM Bull 3X
Direxion:MSCI Ind Bull2X
Direxion:MSCI Mex Bl 3X
Direxion:MSCI SKor Bl3X
Direxion:MSFT Bear 1X
Direxion:MSFT Bull 1.5X
Direxion:NASDAQ-100 EWI
Direxion:NYSE F+ BL2X
Direxion:Pharma&Med Bl3X
Direxion:R AI & A Bl 2X
Direxion:Real Est Bl 3X
Direxion:Real Est Br 3X
Direxion:Reg Bnk Bull 3X
Direxion:Retail Bull 3X
Direxion:S&P 500 Bear 1X
Direxion:S&P 500 Bear 3X
Direxion:S&P 500 Bull 2X
Direxion:S&P 500 Bull 3X
Direxion:S&P 500 HB Bl3X
Direxion:S&P 500 HB Br3X
Direxion:S&P Btech Br 3X
Direxion:S&P OG EP Bl 2X
Direxion:S&P OG EP Br 2X
Direxion:Semicnd Bear 3X
Direxion:Semicnd Bull 3X
Direxion:Sm Cap Bear 3X
Direxion:Sm Cap Bull 3X
Direxion:Tech Bear 3X
Direxion:Tech Bull 3X
Direxion:Transport Bl 3X
Direxion:Travel Vac Bl2X
Direxion:TSLA Bear 1X
Direxion:TSLA Bull 1.5X
Direxion:Utilities Bl 3X
Direxion:Work From Home
Discipline Fund
Distillate Itl Fdmtl S&V
Distillate Sm/M Cash Flw
Distillate US Fdmntl S&V
Dividend Performers
Donoghue Forlines Innov
Donoghue FR Yld Enh Rl A
Donoghue FT High Yield
DoubleLine:Comm Rl Est
DoubleLine:Mortgage
DoubleLine:Opportnstc Bd
DoubleLine:Sh CAPE US Eq
DriveWealth NYSE 100 Idx
Dynamic Sh ST Vol Fut
EA Bridgeway Blue Chip
EA Bridgeway Omni SC Val
Ecofin Global Water ESG
EMQQ EM Intrt & Ecom ETF
ERShares:Entrprnrs
ERShares:NxtGn Entrprnrs
EST:Sovereign's Cp Flrsh
EST:SRH US Quality
ETC 6 Mrdn Hdgd Eq Ix Op
ETC 6 Mrdn Low Beta Eq S
Data provided by
Description
ETF
Symbols
Commodities General
Dedicated Short Bias
Equity Leverage
Equity Leverage
Equity Leverage
Equity Leverage
Dedicated Short Bias
Equity Leverage
Equity Leverage
Dedicated Short Bias
Equity Leverage
Dedicated Short Bias
Equity Leverage
Dedicated Short Bias
Equity Leverage
Equity Leverage
Equity Leverage
Equity Leverage
Equity Leverage
Dedicated Short Bias
Dedicated Short Bias
Equity Leverage
Equity Leverage
Flexible Portfolio
Equity Leverage
Alternative Energy
Equity Leverage
Dedicated Short Bias
Equity Leverage
Equity Leverage
Science & Technology
Equity Leverage
Dedicated Short Bias
Equity Leverage
Equity Leverage
Equity Leverage
Equity Leverage
Dedicated Short Bias
Equity Leverage
Multi-Cap Growth
Equity Leverage
Equity Leverage
Equity Leverage
Equity Leverage
Dedicated Short Bias
Equity Leverage
Equity Leverage
Dedicated Short Bias
Dedicated Short Bias
Equity Leverage
Equity Leverage
Equity Leverage
Dedicated Short Bias
Dedicated Short Bias
Equity Leverage
Dedicated Short Bias
Dedicated Short Bias
Equity Leverage
Dedicated Short Bias
Equity Leverage
Dedicated Short Bias
Equity Leverage
Equity Leverage
Equity Leverage
Dedicated Short Bias
Equity Leverage
Equity Leverage
Science & Technology
Flexible Portfolio
Intl Multi-Cp Core Fds
Small-Cap Core
Multi-Cap Core
Equity Income
Flexible Portfolio
Real Return
High Yield
U.S. Mortgage
U.S. Mortgage
Multi-Sector Income
Multi-Cap Core
Large-Cap Core
Dedicated Short Bias
Large-Cap Core
Small-Cap Value
Specialty/Miscellaneous
Global Science/Technology Fds
Multi-Cap Growth
Intl Sm/Md-Cp Gro Fds
Specialty/Miscellaneous
Multi-Cap Growth
Options Arbitrage/Opt Strat Fds
Mid-Cap Core
COM
YANG
CLDL
WANT
CWEB
CHAU
WEBS
WEBL
NVDU
NVDD
EVAV
ERY
ERX
FAZ
FAS
YINN
EURL
KLNE
NUGT
DUST
GGLS
GGLL
NAIL
HCMT
CURE
HJEN
DUSL
JDST
JNUG
MIDU
MOON
BRZU
EDZ
EDC
INDL
MEXX
KORU
MSFD
MSFU
QQQE
FNGG
PILL
UBOT
DRN
DRV
DPST
RETL
SPDN
SPXS
SPUU
SPXL
HIBL
HIBS
LABD
GUSH
DRIP
SOXS
SOXL
TZA
TNA
TECS
TECL
TPOR
OOTO
TSLS
TSLL
UTSL
WFH
DSCF
DSTX
DSMC
DSTL
IPDP
DFNV
DFRA
DFHY
DCMB
DMBS
DBND
CAPE
CETF
WEIX
BBLU
BSVO
EBLU
EMQQ
ENTR
ERSX
SOVF
SRHQ
SIXH
SIXL
NAV
27.80
12.82
10.91
34.15
33.27
14.00
8.53
15.14
27.85
22.19
44.86
27.91
56.61
13.69
82.49
21.00
23.75
8.78
34.77
10.22
17.21
31.71
109.68
26.61
101.44
12.12
43.12
5.50
33.95
44.35
11.36
103.11
11.02
30.25
56.80
35.02
9.39
15.59
39.63
84.58
91.54
7.70
20.64
10.63
34.43
97.24
9.14
13.30
11.56
103.18
103.86
42.58
27.11
9.70
32.70
11.30
5.81
31.39
19.97
39.42
9.91
66.67
32.85
14.22
18.80
14.35
21.16
54.54
22.32
23.75
34.42
49.37
17.03
27.80
28.89
20.99
50.82
49.42
46.21
26.50
25.87
27.79
10.36
20.99
43.82
30.93
13.50
12.69
28.34
32.17
33.33
33.11
Net Assets
(MIL)
282.9
104.9
7.2
33.4
359.3
64.7
25.2
159.8
26.6
11.9
4.8
22.9
376.5
135.5
1874.9
601.2
22.8
3.3
573.8
75.8
1.8
38.7
225.8
174.6
173.3
28.3
26.9
69.2
312.5
51.4
27.0
122.2
23.2
81.5
63.9
14.4
38.0
8.2
61.0
911.4
31.4
10.2
28.3
59.5
113.9
556.7
51.1
195.0
672.1
293.9
3387.6
79.5
38.9
58.8
526.6
64.6
935.9
7193.7
345.6
1759.6
100.9
2872.7
26.9
13.7
40.0
1015.2
42.2
30.7
36.1
31.9
37.6
1367.2
19.1
45.4
50.1
32.0
86.1
160.4
231.5
331.0
0.7
5.4
126.9
962.1
47.4
454.9
66.4
19.7
24.9
120.0
363.0
139.8
4th Qtr
Total Return
1 Year 3 Years*
-5.60
18.81
32.97
30.02
-3.45
-12.59
-38.62
49.51
18.10
-12.84
-23.36
14.78
-14.80
-31.16
41.22
-26.06
34.43
10.30
31.26
-30.02
-6.27
7.58
99.70
12.33
15.40
1.41
37.93
-33.18
33.44
31.23
7.75
35.61
-19.24
19.87
19.21
53.51
38.09
-15.32
27.94
13.40
36.12
8.47
29.17
56.59
-42.40
80.22
57.76
-8.96
-26.10
22.09
33.33
52.40
-40.99
-52.58
-15.87
13.35
-47.51
66.61
-35.09
37.85
-38.00
54.92
34.74
24.42
-2.30
-4.61
19.89
15.41
7.63
9.92
12.66
11.08
13.41
12.69
7.19
5.72
2.50
6.74
6.51
12.54
2.74
8.94
9.89
16.56
16.06
5.07
17.49
8.47
13.55
12.51
4.45
8.10
-2.16
12.13
84.32
114.37
-32.92
-28.44
-75.59
165.54
N/A
N/A
-22.78
-0.29
-12.31
-26.53
14.54
-53.01
44.13
-44.33
2.71
-27.55
-37.68
80.63
259.71
N/A
-9.76
-9.74
36.79
-28.51
-4.52
27.59
9.49
55.18
-19.51
6.38
26.27
115.16
28.53
-35.86
82.92
33.72
203.82
-12.66
72.26
11.92
-33.80
-55.83
34.23
-14.94
-45.84
47.09
69.20
81.40
-62.98
-41.60
-7.38
-17.13
-84.59
226.36
-41.01
25.95
-74.45
202.76
54.48
45.42
-60.15
139.57
-35.54
35.61
10.50
20.10
29.46
22.67
30.01
27.00
19.01
7.71
N/A
N/A
6.34
27.75
N/A
53.07
30.48
17.14
20.15
4.19
51.35
4.72
N/A
21.82
4.86
2.39
11.11
-6.10
N/A
-12.38
-61.68
-29.22
-31.62
-37.43
N/A
N/A
N/A
-56.16
62.39
-37.45
12.18
-62.06
-1.08
N/A
-19.95
-18.88
N/A
N/A
33.64
N/A
10.44
N/A
14.89
-16.29
-33.99
3.82
-28.28
0.66
2.98
-30.45
10.85
42.20
-36.69
N/A
N/A
6.02
N/A
-32.16
-19.44
-2.32
-29.57
-24.92
-19.64
-8.35
-32.42
13.23
13.41
9.69
-56.07
-26.32
52.59
-64.60
-67.61
0.85
-27.80
-15.36
-50.75
18.27
9.52
N/A
N/A
N/A
-6.32
-6.25
N/A
-0.24
N/A
12.24
10.67
4.60
N/A
-2.26
N/A
N/A
N/A
N/A
N/A
N/A
11.64
17.72
5.31
-21.18
-6.54
-12.34
N/A
N/A
10.01
4.38
January 8, 2024
BARRON’S
•
L33
Funds Quarterly
ETF Score Card
For personal non-commercial use only. Do not edit or alter. Reproductions not permitted.
To reprint or license content, please contact Barron's reprints department at 800-843-0008 or www.djreprints.com
Fund
ETC 6 Mrdn Mega Cap Eqty
ETC 6 Mrdn Quality Gro
ETC 6 Mrdn Small Cp Eqty
ETF Mgr:Brkwv DB Shppng
ETF Mgr:Brkwv Tkr Shppng
ETFB Green SRI REITs
ETFis:InfraCap MLP
ETFis:InfraCap REIT Pref
ETFis:Virtus InfCp US PS
ETFis:Virtus LS Bio Clin
ETFis:Virtus LS Bio Prod
ETFis:Virtus NF MS Bd
ETFis:Virtus Prv Cd Str
ETFis:Virtus Reaves Uts
ETFis:Virtus Rl Asst I
ETFis:Virtus WMC Intl Dv
ETFMG Alternative Hrvst
ETFMG Prime Cybr Sec ETF
ETFMG Prime Jr Silvr Mnr
ETFMG Prime Mob Pymt ETF
ETFMG Travel Tech
ETFMG Trtmnt Tstng Adv
ETFMG US Alternative Hrv
Etho Climate Leadrshp US
Euclidean Fundamental Vl
Fairlead Tactical Sector
FCF Intl Qlty
FCF US Quality ETF
Federated Hrms SD Corp
Federated Hrms SD Hi Yld
Federated Hrms US Str Dv
Fidelity Blue Chip G ETF
Fidelity Blue Chip V ETF
Fidelity Clean Energy
Fidelity Cloud Computing
Fidelity Crypto In&Dg Py
Fidelity Digital Health
Fidelity Disrupt Auto
Fidelity Disrupt Comm
Fidelity Disrupt Fnnc
Fidelity Disrupt Med
Fidelity Disrupt Tech
Fidelity Disruptors
Fidelity Dv Rising Rates
Fidelity Elec Veh & FT
Fidelity EM Multifctr
Fidelity Enh Intl
Fidelity Enh LC Core
Fidelity Enh LC Growth
Fidelity Enh LC Value
Fidelity Enh Mid Cap
Fidelity Enh Small Cap
Fidelity Growth Opps
Fidelity High Dividend
Fidelity High Yield Fctr
Fidelity Intl High Div
Fidelity Intl Multifctr
Fidelity Intl Val Fctr
Fidelity Low Vol Factor
Fidelity Magellan
Fidelity Metaverse
Fidelity Momentum Factor
Fidelity MSCI Comm Svc
Fidelity MSCI Cons Discr
Fidelity MSCI Cons Stpls
Fidelity MSCI Energy
Fidelity MSCI Financials
Fidelity MSCI Hlth Care
Fidelity MSCI Industrial
Fidelity MSCI Info Tech
Fidelity MSCI Materials
Fidelity MSCI Real Est
Fidelity MSCI Utilities
Fidelity Nasd Composite
Fidelity Nw Millennium
Fidelity Pref Secs Inc
Fidelity Quality Factor
Fidelity Real Estate Inv
Fidelity Small-Mid MF
Fidelity Sm-Mid Cp Opps
Fidelity Stocks for Inf
Fidelity Sustain US Eqty
Fidelity Sustainable HY
Fidelity US Multifactor
Fidelity Value Factor
Fidelity Wmn Ldrshp
Fidelity:Corporate Bond
Fidelity:Inv Grade Bond
Fidelity:Inv Grade Sec
Fidelity:Limited Term Bd
Fidelity:Low Dur Bd Fctr
Fidelity:Sust Core+Bd
Description
ETF
Symbols
Large-Cap Value
Multi-Cap Growth
Small-Cap Core
Alternative Managed Futures Fds
Alternative Managed Futures Fds
Global Real Estate
Energy MLP
Real Estate
Flexible Income
Health/Biotechnology
Health/Biotechnology
Alternative Credit Focus
Financial Services
Utility
Flexible Portfolio
Intl Equity Income Fds
Specialty/Miscellaneous
Global Science/Technology Fds
Precious Metals Equity
Global Science/Technology Fds
Consumer Services
Health/Biotechnology
Specialty/Miscellaneous
Multi-Cap Core
Multi-Cap Value
Flexible Portfolio
Intl Multi-Cp Gro Fds
Multi-Cap Growth
Short-Intmdt Inv. Grade Debt
Short High Yield
Equity Income
Large-Cap Growth
Multi-Cap Value
Alternative Energy
Science & Technology
Global Science/Technology Fds
Global Health/Biotechnology Fds
Global Science/Technology Fds
Telecommunication
Global Financial Services
Health/Biotechnology
Global Science/Technology Fds
Global Multi-Cap Growth Fds
Equity Income
Global Science/Technology Fds
Emerging Markets
Intl Multi-Cp Core Fds
Large-Cap Core
Large-Cap Growth
Multi-Cap Value
Mid-Cap Core
Small-Cap Core
Multi-Cap Growth
Equity Income
High Yield
Intl Equity Income Fds
Intl Multi-Cp Core Fds
Intl Large-Cp Val Fds
Multi-Cap Core
Large-Cap Growth
Global Science/Technology Fds
Multi-Cap Growth
Telecommunication
Consumer Services
Consumer Goods
Natural Resources
Financial Services
Health/Biotechnology
Industrials
Science & Technology
Basic Materials
Real Estate
Utility
Multi-Cap Growth
Multi-Cap Value
Flexible Income
Large-Cap Core
Real Estate
Small-Cap Core
Small-Cap Core
Multi-Cap Core
Multi-Cap Core
High Yield
Multi-Cap Core
Multi-Cap Value
Multi-Cap Core
Corporate Debt BBB-Rated
Core Bond
U.S. Mortgage
Short-Intmdt Inv. Grade Debt
Short Inv. Grade Debt
Core Plus Bond
SIXA
SXQG
SIXS
BDRY
BWET
RITA
AMZA
PFFR
PFFA
BBC
BBP
NFLT
VPC
UTES
VRAI
VWID
MJ
HACK
SILJ
IPAY
AWAY
GERM
MJUS
ETHO
ECML
TACK
TTAI
TTAC
FCSH
FHYS
FDV
FBCG
FBCV
FRNW
FCLD
FDIG
FDHT
FBOT
FDCF
FDFF
FMED
FDTX
FDIF
FDRR
FDRV
FDEM
FENI
FELC
FELG
FELV
FMDE
FESM
FGRO
FDVV
FDHY
FIDI
FDEV
FIVA
FDLO
FMAG
FMET
FDMO
FCOM
FDIS
FSTA
FENY
FNCL
FHLC
FIDU
FTEC
FMAT
FREL
FUTY
ONEQ
FMIL
FPFD
FQAL
FPRO
FSMD
FSMO
FCPI
FSST
FSYD
FLRG
FVAL
FDWM
FCOR
FIGB
FSEC
FLTB
FLDR
FSBD
NAV
36.70
26.59
47.12
11.64
16.04
19.34
35.26
18.44
20.42
24.46
57.97
22.45
21.92
44.67
23.85
26.99
3.24
60.45
10.02
46.54
19.60
19.67
1.61
55.71
31.25
24.78
29.02
56.63
23.88
22.85
24.01
33.25
29.15
17.26
22.55
27.88
19.42
25.20
29.50
29.13
24.22
28.40
26.52
43.95
17.15
23.93
26.59
26.56
26.24
26.83
27.41
28.11
18.97
42.25
47.88
20.61
26.65
24.42
52.90
24.12
28.01
52.93
44.50
78.94
44.60
23.05
53.54
64.65
61.22
143.58
48.69
26.64
40.87
59.13
36.19
20.81
54.26
21.67
36.17
23.61
35.01
22.54
46.43
27.78
52.97
20.49
46.86
43.34
42.95
49.16
49.83
47.27
Net Assets
(MIL)
190.8
31.0
62.8
72.8
2.1
6.7
357.7
62.4
671.5
8.8
15.4
49.2
25.0
46.2
18.4
9.2
214.3
1556.1
688.5
342.1
103.4
12.4
117.5
172.9
153.2
205.3
58.5
315.0
26.6
26.9
72.3
919.6
114.0
27.8
46.7
49.3
8.6
102.6
39.0
41.6
45.8
101.8
86.8
513.1
45.6
27.6
1337.2
1893.4
2075.5
1825.0
1390.8
452.9
206.8
1894.3
256.6
89.7
38.5
87.0
718.6
50.3
22.7
154.4
848.7
1232.7
1060.3
1578.9
1386.0
2899.3
823.8
7848.0
453.0
936.0
1344.6
5214.0
158.7
32.3
349.8
14.2
126.5
37.9
131.9
10.1
9.0
45.6
596.3
3.4
191.5
33.5
3.1
159.9
276.5
11.4
4th Qtr
Total Return
1 Year 3 Years*
9.15
13.00
11.25
111.67
2.58
11.89
3.52
8.65
8.92
24.95
15.64
6.09
5.61
8.15
9.51
9.11
-9.41
17.34
18.64
18.73
16.01
9.94
-13.29
12.26
12.58
9.82
10.60
10.84
3.59
4.24
8.64
14.90
6.43
8.53
18.95
73.90
15.06
13.48
19.18
16.65
9.50
20.49
16.11
10.94
0.16
8.07
10.07
10.95
12.13
8.77
12.24
12.86
15.58
10.65
6.79
12.01
8.34
7.61
9.19
13.38
17.29
13.70
12.32
13.25
5.59
-6.62
15.52
7.07
13.66
17.19
10.65
18.09
8.58
13.94
11.55
6.71
10.48
16.91
12.54
12.45
9.54
12.31
6.95
9.15
11.24
14.06
8.37
6.97
7.49
3.79
2.17
7.12
11.92
28.30
14.96
24.09
N/A
9.55
23.47
19.75
24.81
-1.64
17.44
9.22
21.55
-2.40
5.70
17.00
-21.50
37.42
-4.63
18.35
18.21
-13.81
-17.93
14.80
N/A
7.38
17.39
22.93
5.62
11.53
-2.13
57.72
5.53
-19.61
52.39
165.75
4.54
22.01
46.62
14.26
0.24
52.74
29.22
13.61
12.90
16.67
18.54
25.06
37.34
10.37
15.29
20.35
49.56
17.90
11.64
16.60
14.15
20.26
16.29
31.27
40.62
24.71
44.43
40.42
2.29
0.04
14.03
2.48
22.55
53.27
13.66
11.73
-7.45
45.29
25.19
11.09
24.13
10.92
17.28
17.17
15.34
25.40
12.81
18.10
23.02
22.79
9.02
6.42
5.41
6.00
6.39
6.99
9.45
N/A
9.50
13.65
N/A
N/A
35.46
-0.93
6.99
-20.97
2.86
0.19
12.77
5.88
5.91
7.00
-37.36
1.91
-14.70
-11.20
-8.72
-13.60
N/A
2.78
N/A
N/A
1.31
11.17
N/A
N/A
N/A
5.22
9.80
N/A
N/A
N/A
N/A
-0.19
-0.31
1.89
-4.50
-4.12
-0.27
9.04
N/A
-0.24
4.36
10.96
9.25
9.82
7.07
5.84
N/A
13.49
1.10
9.02
1.78
7.72
8.86
N/A
N/A
7.22
0.15
4.20
5.69
36.39
10.57
5.26
10.82
12.07
8.66
5.05
3.22
6.49
15.90
N/A
9.61
N/A
9.52
N/A
12.95
N/A
N/A
10.83
11.25
N/A
-3.33
N/A
N/A
-0.45
1.88
N/A
Fund
Fidelity:Sust Low Dur Bd
Fidelity:Tactical Bd
Fidelity:Total Bond
FIS Christian Stock Fund
FIS KOC Global Belief
FlexShs:Core Select Bond
FlexShs:CS US Crp Bd Idx
FlexShs:CS US Lng Crp Bd
FlexShs:Disp Dur MBS Id
FlexShs:DM ex-US Ql LV
FlexShs:EM Qlty LV
FlexShs:ESG & Cl EM C
FlexShs:ESG C DM ex-US C
FlexShs:ESG Clim I Gr CC
FlexShs:ESG Clim US LC C
FlexShs:Gl Qual RE Idx
FlexShs:HY Val-Sco Bond
FlexShs:iB 3Y TD TIPS
FlexShs:iB 5Y TD TIPS
FlexShs:Int Qual Div Def
FlexShs:Int Qual Div Dyn
FlexShs:Int Qual Div Idx
FlexShs:MS DM exUS Fac
FlexShs:MS EM Fac Tilt
FlexShs:MS Gl Ups NR Idx
FlexShs:MS US Mkt Fac
FlexShs:Qual Div Def
FlexShs:Quality Div
FlexShs:Real Asst All Id
FlexShs:STOXX Gl Brd Inf
FlexShs:STOXX Gl ESG Sel
FlexShs:STOXX US ESG Sel
FlexShs:Ultra-Short Inc
FlexShs:US Qlty LV
FlexShs:US Qual LgCp Idx
FMC Excelsior Focus Eqty
FMQQ The Nxt Fntr I&E
Formidable ETF
Formidable Fortress ETF
FPA Global Equity ETF
Franklin ETF:Bdy G US FI
Franklin ETF:ClrBrdg SI
Franklin ETF:Dsrptv Com
Franklin ETF:Dyn Muni Bd
Franklin ETF:EM CDT Idx
Franklin ETF:Expo Data
Franklin ETF:Foc Grwth
Franklin ETF:FTSE AsiaxJ
Franklin ETF:FTSE Aus
Franklin ETF:FTSE Brazil
Franklin ETF:FTSE Canada
Franklin ETF:FTSE China
Franklin ETF:FTSE Eu
Franklin ETF:FTSE Euro
Franklin ETF:FTSE Ger
Franklin ETF:FTSE HK
Franklin ETF:FTSE India
Franklin ETF:FTSE Jpn
Franklin ETF:FTSE Jpn Hg
Franklin ETF:FTSE Lat Am
Franklin ETF:FTSE Mex
Franklin ETF:FTSE SA
Franklin ETF:FTSE SK
Franklin ETF:FTSE Swzlnd
Franklin ETF:FTSE Taiwan
Franklin ETF:FTSE UK
Franklin ETF:Gen Adv
Franklin ETF:HY Corp
Franklin ETF:Inc Focus
Franklin ETF:Intel Mach
Franklin ETF:Intl Agg Bd
Franklin ETF:Intl CDT Ix
Franklin ETF:Inv Gr Corp
Franklin ETF:Mun Grn Bd
Franklin ETF:SD US Govt
Franklin ETF:Senior Loan
Franklin ETF:Sys SP
Franklin ETF:Ult Shrt Bd
Franklin ETF:US CDT Idx
Franklin ETF:US Core Bd
Franklin ETF:US Eqty Idx
Franklin ETF:US LC Mltfc
Franklin ETF:US Low Vol
Franklin ETF:US MC Mltfc
Franklin ETF:US SC Mltfc
Franklin ETF:US Treas Bd
Franklin ETF:West Ast Bd
Franklin Rspn Src Gold
Freedom 100 Emerg Mkts
Freedom Day Dividend
Frnkln Intl LoVol HD Ix
Frnkln US LoVol HD Ix
Data provided by
Description
ETF
Symbols
Short Inv. Grade Debt
Global High Yield
Core Bond
Global Multi-Cap Core Fds
Global Multi-Cap Core Fds
Core Bond
Corporate Debt BBB-Rated
Corporate Debt BBB-Rated
U.S. Mortgage
Intl Multi-Cp Core Fds
Emerging Markets
Emerging Markets
Intl Large-Cp Core Fds
Corporate Debt BBB-Rated
Large-Cap Core
Global Real Estate
High Yield
Inflation Protected Bond
Inflation Protected Bond
Intl Equity Income Fds
Intl Equity Income Fds
Intl Equity Income Fds
Intl Multi-Cp Val Fds
Emerging Markets
Global Natural Resources
Multi-Cap Core
Equity Income
Equity Income
Real Return
Global Infrastructure
Global Large-Cap Value Fds
Large-Cap Core
Ultra-Short Obligations
Multi-Cap Core
Large-Cap Core
Multi-Cap Growth
Emerging Markets
Multi-Cap Core
Multi-Cap Core
Global Multi-Cap Value Fds
Corporate Debt BBB-Rated
Industrials
Consumer Services
Interm. Municipal Debt
Emerging Markets
Science & Technology
Large-Cap Growth
Pacific Ex Japan
Pacific Region
Latin American
Intl Large-Cp Core Fds
China Region
European Region
European Region
European Region
China Region
India Region
Japanese
Japanese
Latin American
Latin American
Emerging Markets
Pacific Ex Japan
European Region
China Region
European Region
Health/Biotechnology
High Yield
Flexible Portfolio
Science & Technology
Intl Income
Intl Large-Cp Core Fds
Corporate Debt BBB-Rated
General & Insured Municipal Debt
Short U.S. Government
Loan Participation
Absolute Return
Ultra-Short Obligations
Equity Income
Core Bond
Large-Cap Core
Large-Cap Core
Large-Cap Core
Mid-Cap Growth
Small-Cap Core
General U.S. Treasury
General Bond
Commodities Prec Metals Fds
Emerging Markets
Equity Income
Intl Large-Cp Val Fds
Multi-Cap Value
FSLD
FTBD
FBND
PRAY
KOCG
BNDC
SKOR
LKOR
MBSD
QLVD
QLVE
FEEM
FEDM
FEIG
FEUS
GQRE
HYGV
TDTT
TDTF
IQDE
IQDY
IQDF
TLTD
TLTE
GUNR
TILT
QDEF
QDF
ASET
NFRA
ESGG
ESG
RAVI
QLV
QLC
FMCX
FMQQ
FORH
KONG
FPAG
USFI
INFR
BUYZ
FLMI
DIEM
XDAT
FFOG
FLAX
FLAU
FLBR
FLCA
FLCH
FLEE
FLEU
FLGR
FLHK
FLIN
FLJP
FLJH
FLLA
FLMX
FLSA
FLKR
FLSW
FLTW
FLGB
HELX
FLHY
INCM
IQM
FLIA
DIVI
FLCO
FLMB
FTSD
FLBL
FLSP
FLUD
UDIV
FLCB
USPX
FLQL
FLLV
FLQM
FLQS
FLGV
WABF
FGDL
FRDM
MBOX
LVHI
LVHD
NAV
50.01
49.48
45.88
25.58
23.48
22.37
47.85
44.73
20.57
25.97
23.35
46.54
48.04
41.50
54.04
55.90
41.01
23.63
23.66
21.11
27.93
23.31
68.50
50.94
41.11
182.52
59.03
61.49
30.66
53.59
149.60
116.03
75.02
56.22
52.95
26.57
11.24
22.52
26.45
26.48
24.95
24.62
28.82
24.21
24.90
21.81
28.92
21.42
28.67
21.03
33.35
16.04
28.22
24.21
23.19
18.11
34.82
28.10
26.31
24.61
33.19
36.39
22.98
33.13
41.29
25.20
30.49
23.50
25.70
51.10
20.25
30.68
21.62
24.12
90.01
24.23
21.79
24.71
36.95
21.60
41.67
47.70
51.69
48.11
38.83
20.81
26.13
27.55
32.98
28.57
27.61
36.36
Net Assets
(MIL)
6.3
14.4
6109.1
32.9
20.7
183.5
283.6
31.6
75.7
67.9
13.6
4.5
43.5
28.1
39.0
291.8
1373.3
1907.7
822.3
26.5
72.6
536.1
510.6
235.2
7191.2
1444.0
338.2
1682.5
16.9
2168.8
165.5
181.6
1112.2
199.0
161.0
82.7
19.0
28.9
26.2
44.6
12.0
8.4
9.6
149.4
12.0
4.2
55.0
33.6
29.1
158.5
363.8
104.2
129.8
18.9
15.6
10.7
484.3
1693.1
36.1
66.2
35.8
17.3
291.4
43.9
188.5
612.4
11.2
229.3
99.3
21.5
427.6
510.1
625.5
108.4
170.2
285.3
163.4
2.5
58.4
1751.5
950.1
1099.6
135.3
336.5
31.9
457.5
42.8
70.7
727.3
78.7
638.6
853.8
4th Qtr
Total Return
1 Year 3 Years*
1.70
7.65
6.85
11.18
10.43
6.89
5.81
13.91
5.35
6.89
5.67
7.97
11.39
8.34
11.66
14.89
6.25
3.16
4.53
9.49
13.96
11.51
10.24
7.37
2.61
12.60
9.95
11.13
8.93
11.21
11.08
10.46
1.63
9.66
11.49
12.34
9.46
6.55
5.89
11.83
7.96
12.98
17.49
6.93
8.99
21.44
15.73
6.31
14.53
18.13
12.12
-4.47
11.33
12.51
13.18
3.29
10.55
7.88
3.83
17.11
17.20
8.47
14.57
10.52
16.52
7.28
7.51
6.83
7.94
15.51
6.12
10.79
7.99
8.61
2.37
3.08
-2.27
1.68
12.39
6.67
11.96
11.35
9.84
12.55
13.91
5.43
8.06
10.22
17.59
11.76
6.05
9.13
5.38
N/A
6.84
19.38
20.13
5.34
7.52
12.39
4.62
12.21
8.34
9.13
17.90
8.61
25.53
9.29
13.03
4.54
4.19
14.82
23.23
19.61
17.56
12.52
-1.72
24.65
17.42
19.63
5.51
8.94
25.43
27.83
5.54
13.72
25.86
21.93
15.64
0.73
12.75
29.00
N/A
5.19
38.76
7.67
14.59
45.79
49.15
6.39
13.38
33.17
15.23
-11.98
20.93
15.90
24.12
-11.90
20.71
19.68
35.04
32.44
39.82
12.43
20.99
16.71
29.78
15.37
1.23
13.97
N/A
41.00
7.06
19.23
7.77
7.72
4.86
13.57
4.69
5.92
25.14
5.67
27.16
23.46
13.88
17.46
20.61
4.15
N/A
13.63
23.23
15.51
17.20
-1.08
N/A
N/A
-2.42
N/A
N/A
-3.67
-1.50
-6.44
-2.21
2.33
-1.51
N/A
N/A
N/A
N/A
1.67
1.43
1.69
-0.23
2.43
5.22
4.02
4.42
-0.58
12.31
9.60
9.63
10.00
4.05
2.45
8.16
9.62
1.85
8.92
10.25
N/A
N/A
N/A
N/A
N/A
N/A
N/A
-17.44
0.18
-0.75
N/A
1.49
-6.04
5.64
7.04
9.41
-18.55
5.89
10.00
0.60
-7.86
11.42
0.65
14.49
9.28
19.72
14.04
-6.78
4.71
6.75
7.95
-11.64
2.15
N/A
5.70
-0.94
11.15
-3.92
-1.55
0.23
5.21
5.26
2.05
8.30
-3.53
7.22
10.05
8.72
9.60
8.31
-3.43
N/A
N/A
3.81
N/A
12.95
7.20
L34
BARRON’S
•
Funds Quarterly
January 8, 2024
ETF Score Card
For personal non-commercial use only. Do not edit or alter. Reproductions not permitted.
To reprint or license content, please contact Barron's reprints department at 800-843-0008 or www.djreprints.com
Fund
FT ADEX II:APAC Ex-Japan
FT ADEX II:Brazil ADEX
FT ADEX II:China ADEX
FT ADEX II:DM ex-US
FT ADEX II:DM ex-US SC
FT ADEX II:Emerg Mkts
FT ADEX II:Emerg Mkts SC
FT ADEX II:Europe ADEX
FT ADEX II:Eurozone ADEX
FT ADEX II:Germany ADEX
FT ADEX II:India N50 EW
FT ADEX II:Japan ADEX
FT ADEX II:Latin America
FT ADEX II:Switzerland
FT ADEX II:UK AlphaDEX
FT ADEX:Consumer Dscr
FT ADEX:Consumer Stpls
FT ADEX:Energy AlphaDEX
FT ADEX:Financials ADEX
FT ADEX:Health Care ADEX
FT ADEX:Ind/Prod Drbls
FT ADEX:Large Cap Core
FT ADEX:Large Cap Gro
FT ADEX:Large Cap Val
FT ADEX:Materials ADEX
FT ADEX:Mid Cap Core
FT ADEX:Mid Cap Growth
FT ADEX:Mid Cap Value
FT ADEX:Multi Cap Gro
FT ADEX:Multi Cap Val
FT ADEX:Small Cap Core
FT ADEX:Small Cap Gro
FT ADEX:Small Cap Val
FT ADEX:Technology ADEX
FT ADEX:Utilities ADEX
FT II:Alerian Disrup Tch
FT II:Alerian US NG Infr
FT II:Bloomberg EMD
FT II:Cloud Computing
FT II:DJ Glbl Sel Div
FT II:DJ Intl Internet
FT II:Global Wind Energy
FT II:Indxx Gl Agri
FT II:Indxx Gl NR Inc
FT II:Indxx Metaverse
FT II:Indxx NextG
FT II:Intl Eqty Opps
FT II:IPOX Eur Eq Opptys
FT II:NSDQ Cln Edge SGI
FT II:Nsdq Cybersecurity
FT II:Nsdq Lux Digi Hlth
FT II:SNet Fut Vhc & Tch
FT II:STOXX Eur Sel Div
FT III:Cali Mun High Inc
FT III:EM Loc Cur Bd
FT III:Hrzn MV Dev Itl
FT III:Hrzn MV Domstc
FT III:Hrzn MV Sm/Mid
FT III:Instl Pfd Sec&Inc
FT III:Long/Short Equity
FT III:Managed Municipal
FT III:Merger Arbitrage
FT III:Mun High Income
FT III:NY Mun High Inc
FT III:Pfd Sec & Inc
FT III:RvFrnt Dyn Dv Itl
FT III:RvFrnt Dyn EM
FT III:RvFrnt Dyn Europe
FT III:Short Dur Mgd Mun
FT III:Ult Short Dur Mun
FT IV:Cboe V DJIA D10TI
FT IV:Cboe V Rising DATI
FT IV:Cboe V S&P500 DATI
FT IV:Cboe V SMID RDATI
FT IV:Cboe Vest Tech DTI
FT IV:EIP Carbon Impact
FT IV:Energy Income PS
FT IV:Enhanced Short Mat
FT IV:High Inc Str Focus
FT IV:Int Dur Invt Gr
FT IV:Int Govt Oppty
FT IV:Long Dur Opptys
FT IV:Low Dur Opptys
FT IV:Ltd Dur Inv Gr Crp
FT IV:North Am En Infra
FT IV:Senior Loan
FT IV:SSI Strat Conv Sec
FT IV:Tact High Yield
FT V:Mgd Futures Strat
FT VI:BuyWrite Income
FT VI:DW DALI 1
FT VI:DW Dyn Focus 5
Description
ETF
Symbols
Pacific Ex Japan
Latin American
China Region
Intl Multi-Cp Val Fds
Intl Sm/Md-Cp Core Fds
Emerging Markets
Emerging Markets
European Region
European Region
European Region
India Region
Japanese
Latin American
European Region
European Region
Consumer Services
Consumer Goods
Natural Resources
Financial Services
Health/Biotechnology
Industrials
Multi-Cap Value
Multi-Cap Growth
Multi-Cap Value
Basic Materials
Small-Cap Core
Small-Cap Growth
Small-Cap Value
Multi-Cap Growth
Mid-Cap Value
Small-Cap Core
Small-Cap Growth
Small-Cap Value
Science & Technology
Utility
Global Real Estate
Specialty/Miscellaneous
Emerging Markets
Science & Technology
Global Equity Income
Global Science/Technology Fds
Alternative Energy
Specialty/Miscellaneous
Basic Materials
Global Science/Technology Fds
Telecommunication
Intl Multi-Cp Gro Fds
Alternative Event Driven
Global Infrastructure
Science & Technology
Health/Biotechnology
Industrials
Intl Equity Income Fds
California Intermdt Municipal Debt
EmergingMarketsLocalCurrencyDebtFds
Intl Multi-Cp Val Fds
Multi-Cap Value
Small-Cap Core
Flexible Income
Alternative Long/Short Eqty Fds
General & Insured Municipal Debt
Alternative Event Driven
High Yield Municipal Debt
New York Intermdt Municipal Debt
Flexible Income
Intl Multi-Cp Gro Fds
Emerging Markets
European Region
Short Municipal Debt
Short Municipal Debt
Options Arbitrage/Opt Strat Fds
Equity Income
Equity Income
Equity Income
Equity Income
Alternative Energy
Energy MLP
Short-Intmdt Inv. Grade Debt
Multi-Sector Income
Core Plus Bond
Interm. U.S. Government
Corporate Debt A Rated
U.S. Mortgage
Short-Intmdt Inv. Grade Debt
Energy MLP
Loan Participation
Convertible Securities
High Yield
Alternative Managed Futures Fds
Alternative Long/Short Eqty Fds
Flexible Portfolio
Specialty/Miscellaneous
FPA
FBZ
FCA
FDT
FDTS
FEM
FEMS
FEP
FEUZ
FGM
NFTY
FJP
FLN
FSZ
FKU
FXD
FXG
FXN
FXO
FXH
FXR
FEX
FTC
FTA
FXZ
FNX
FNY
FNK
FAD
FAB
FYX
FYC
FYT
FXL
FXU
DTRE
RBLD
EMDM
SKYY
FGD
FDNI
FAN
FTAG
FTRI
ARVR
NXTG
FPXI
FPXE
GRID
CIBR
EKG
CARZ
FDD
FCAL
FEMB
HDMV
HUSV
HSMV
FPEI
FTLS
FMB
MARB
FMHI
FMNY
FPE
RFDI
RFEM
RFEU
FSMB
FUMB
DOGG
RDVI
KNG
SDVD
TDVI
ECLN
EIPX
FTSM
HISF
FIIG
MGOV
LGOV
LMBS
FSIG
EMLP
FTSL
FCVT
HYLS
FMF
FTHI
DALI
FVC
NAV
27.45
12.19
18.57
52.61
40.65
22.22
38.17
36.31
40.46
38.81
54.06
50.68
20.76
64.95
36.75
58.96
63.07
16.69
43.27
103.56
64.84
90.16
109.37
70.85
68.93
104.32
68.03
50.93
112.34
78.00
91.45
62.81
54.43
128.12
31.66
43.36
56.91
22.51
87.66
22.32
22.58
16.55
25.64
13.07
34.75
76.93
42.33
22.47
104.67
53.59
15.94
57.07
12.07
49.88
29.24
28.97
33.60
32.10
17.84
56.41
51.61
20.21
47.68
27.12
16.89
61.41
59.42
63.20
19.93
20.10
21.43
23.05
51.63
21.04
21.30
24.25
21.24
59.68
44.85
20.81
20.49
22.01
48.26
18.92
27.67
46.17
33.36
41.57
46.16
21.34
21.57
32.82
Net Assets
(MIL)
16.7
6.2
6.4
409.4
7.8
395.8
311.1
226.5
17.7
20.6
113.4
180.5
66.7
82.9
19.2
1289.2
507.2
627.0
751.9
1222.6
1586.1
1053.1
991.1
1122.1
451.5
1001.6
269.4
213.6
162.0
158.4
780.8
224.0
156.8
1279.7
230.4
22.3
8.1
5.3
2719.0
629.4
27.0
201.3
11.9
222.2
1.6
395.2
175.1
4.3
759.6
5451.5
5.6
42.2
181.2
154.0
129.5
36.3
86.0
18.2
1121.1
813.9
1898.7
61.5
495.4
14.6
5234.6
119.9
34.1
9.1
403.0
237.6
9.0
560.0
1676.7
18.1
3.0
29.9
234.5
7463.1
30.5
12.1
19.8
231.7
3839.2
821.3
2361.6
2218.5
93.2
1435.1
152.7
321.1
135.9
182.1
4th Qtr
Total Return
1 Year 3 Years*
8.79
20.57
-2.52
6.16
6.36
6.14
0.75
10.07
8.81
8.43
11.23
3.70
14.34
12.35
13.79
15.80
4.95
-3.58
15.39
6.67
13.18
11.69
13.01
10.11
9.81
13.83
12.18
14.98
12.50
12.83
13.82
11.56
16.41
15.60
11.67
14.85
12.82
15.33
15.46
10.14
7.68
13.93
-1.01
5.09
19.51
14.21
10.18
8.82
11.74
18.30
13.13
11.34
12.22
6.54
9.12
7.47
8.39
9.49
7.43
6.93
6.39
0.95
7.00
7.71
7.21
10.52
12.03
9.97
3.37
1.50
12.30
11.98
7.02
15.91
14.13
7.72
1.78
1.67
6.26
8.12
6.73
9.59
3.41
4.24
5.65
3.03
7.58
7.67
-4.98
7.19
-12.08
5.65
10.72
28.15
-9.31
13.95
11.18
10.89
3.25
16.07
15.76
12.90
24.40
22.47
29.63
22.12
20.62
23.30
1.92
0.90
9.24
-4.50
26.82
14.42
20.13
10.17
16.14
20.45
21.06
20.68
19.24
15.83
18.14
14.15
22.94
40.43
-2.22
13.56
19.08
N/A
52.21
8.21
2.15
-3.13
-7.49
1.74
42.53
28.34
9.20
14.23
21.36
39.17
0.00
41.51
13.45
5.89
16.82
9.16
3.54
4.99
6.68
17.03
5.97
2.56
7.28
6.45
6.62
17.78
20.76
15.68
3.46
3.22
N/A
18.66
7.42
N/A
N/A
-3.04
10.69
5.17
6.50
N/A
N/A
4.32
5.89
6.11
7.94
11.13
6.86
13.41
0.22
20.07
-8.17
-4.49
-1.37
5.71
-9.48
0.89
1.63
0.77
2.69
1.40
1.61
-6.05
14.52
2.27
7.30
4.84
3.14
5.88
8.61
31.04
10.92
-1.16
9.80
8.50
4.80
11.05
14.67
9.10
1.49
14.43
3.14
12.15
7.12
1.06
11.04
4.94
6.07
2.14
6.77
N/A
-2.36
6.58
-20.62
-9.19
1.46
11.40
N/A
5.84
-14.30
-6.77
10.30
7.02
N/A
4.95
3.19
-0.30
-3.05
1.29
6.92
5.55
0.86
9.85
-0.63
2.19
-0.50
N/A
-0.66
1.87
-0.57
2.28
0.29
1.14
N/A
N/A
7.56
N/A
N/A
4.66
N/A
2.04
1.72
N/A
N/A
-6.23
0.57
N/A
13.61
4.42
-4.06
0.89
3.16
9.32
0.97
3.05
Fund
FT VI:DW Focus 5
FT VI:DW Intl Focus 5
FT VI:DW Mom & Dividend
FT VI:DW Mom & Low Vol
FT VI:DW Mom & Value
FT VI:Emg Mkts Eqty Sel
FT VI:Indxx Innv Trn&Prc
FT VI:Indxx Med Devices
FT VI:Intl Dev Cap Str
FT VI:LC US Eqty Sel
FT VI:MC US Eqty Sel
FT VI:Mlt-Asst Dvsfd Inc
FT VI:Nsdq AI & Robotics
FT VI:Nsdq Bank
FT VI:Nsdq BuyWrite Inc
FT VI:Nsdq Food & Bev
FT VI:Nsdq Oil & Gas
FT VI:Nsdq Pharmaceutcls
FT VI:Nsdq Semiconductor
FT VI:Nsdq Tech Div
FT VI:Nsdq Transportatn
FT VI:RBA Am Ind Renssnc
FT VI:Rising Div Achvrs
FT VI:S&P Itl Div Arstcr
FT VI:SC US Equity Sel
FT VI:SMID Rising Dv Ach
FT VI:SNet E-Commerce
FT VI:SNet Strmng & Gmng
FT VII:Alt Abs Rtn Strat
FT VII:Eqty Mod B Aug
FT VII:Eqty Mod B Sep
FT VII:Glbl Tact Cmd Str
FT VIII:Active Factor LC
FT VIII:Active Factor MC
FT VIII:Active Factor SC
FT VIII:Actv Gbl Qty Inc
FT VIII:Eqty E&M B Aug
FT VIII:Eqty E&M B Dec
FT VIII:Eqty E&M B Jul
FT VIII:Eqty E&M B Jun
FT VIII:Eqty E&M B Mar
FT VIII:Eqty E&M B Sept
FT VIII:Eqty Mod B Apr
FT VIII:Eqty Mod B Feb
FT VIII:Eqty Mod B Jan
FT VIII:Eqty Mod B Jul
FT VIII:Eqty Mod B Jun
FT VIII:Eqty Mod B Mar
FT VIII:Eqty Mod B May
FT VIII:Expanded Tech
FT VIII:Flx Mun High Inc
FT VIII:Fund of Buffer
FT VIII:Fund of Dp Bffr
FT VIII:Fund of N100 B
FT VIII:Income Opptys
FT VIII:Innov Leaders
FT VIII:Intl Eq Md B Dec
FT VIII:Intl Eqty B Jun
FT VIII:Intl Eqty B Mar
FT VIII:Intl Eqty B Sep
FT VIII:Low Dur Str Foc
FT VIII:Mlt-Mgr Lg Gro
FT VIII:Mlt-Mgr SC Opps
FT VIII:Multi-Strat Alt
FT VIII:Nsdq100 B Dec
FT VIII:Nsdq100 B Jun
FT VIII:Nsdq100 B Mar
FT VIII:Nsdq100 B Sep
FT VIII:SB Crypto Ind&DE
FT VIII:TCW Em Mkts Debt
FT VIII:TCW Opprtnstc FI
FT VIII:TCW Securitzd +
FT VIII:TCW Unconstr+ Bd
FT VIII:US SC Mod B Aug
FT VIII:US SC Mod B May
FT VIII:USV Eqt B&PI Sep
FT VIII:VB Alloc Defensv
FT VIII:VB Alloc Growth
FT VIII:VUS Eqty B Apr
FT VIII:VUS Eqty B Aug
FT VIII:VUS Eqty B Dec
FT VIII:VUS Eqty B Feb
FT VIII:VUS Eqty B Jan
FT VIII:VUS Eqty B Jul
FT VIII:VUS Eqty B Jun
FT VIII:VUS Eqty B Mar
FT VIII:VUS Eqty B May
FT VIII:VUS Eqty B Nov
FT VIII:VUS Eqty B Oct
FT VIII:VUS Eqty B Sep
FT VIII:VUS Eqty DB Apr
FT VIII:VUS Eqty DB Aug
Data provided by
Description
ETF
Symbols
Specialty/Miscellaneous
Specialty/Miscellaneous
Equity Income
Multi-Cap Core
Mid-Cap Value
Emerging Markets
Global Science/Technology Fds
Global Health/Biotechnology Fds
Intl Large-Cp Core Fds
Equity Income
Equity Income
Flexible Portfolio
Global Science/Technology Fds
Financial Services
Alternative Long/Short Eqty Fds
Consumer Goods
Natural Resources
Health/Biotechnology
Science & Technology
Science & Technology
Industrials
Industrials
Equity Income
Intl Equity Income Fds
Equity Income
Equity Income
Specialty/Miscellaneous
Telecommunication
Alternative Managed Futures Fds
Options Arbitrage/Opt Strat Fds
Options Arbitrage/Opt Strat Fds
Commodities General
Multi-Cap Core
Small-Cap Core
Small-Cap Core
Global Equity Income
Options Arbitrage/Opt Strat Fds
Options Arbitrage/Opt Strat Fds
Options Arbitrage/Opt Strat Fds
Options Arbitrage/Opt Strat Fds
Options Arbitrage/Opt Strat Fds
Options Arbitrage/Opt Strat Fds
Options Arbitrage/Opt Strat Fds
Options Arbitrage/Opt Strat Fds
Options Arbitrage/Opt Strat Fds
Options Arbitrage/Opt Strat Fds
Options Arbitrage/Opt Strat Fds
Options Arbitrage/Opt Strat Fds
Options Arbitrage/Opt Strat Fds
Science & Technology
High Yield Municipal Debt
Options Arbitrage/Opt Strat Fds
Options Arbitrage/Opt Strat Fds
Options Arbitrage/Opt Strat Fds
Mixed-Asset Trgt Alloc Gro Fds
Science & Technology
Options Arbitrage/Opt Strat Fds
Options Arbitrage/Opt Strat Fds
Options Arbitrage/Opt Strat Fds
Options Arbitrage/Opt Strat Fds
Short Inv. Grade Debt
Large-Cap Growth
Small-Cap Growth
Alternative Multi-Strategy
Options Arbitrage/Opt Strat Fds
Options Arbitrage/Opt Strat Fds
Options Arbitrage/Opt Strat Fds
Options Arbitrage/Opt Strat Fds
Science & Technology
Emerging Mrkts Hard Currency Debt
Multi-Sector Income
U.S. Mortgage
Alternative Credit Focus
Options Arbitrage/Opt Strat Fds
Options Arbitrage/Opt Strat Fds
Options Arbitrage/Opt Strat Fds
Options Arbitrage/Opt Strat Fds
Options Arbitrage/Opt Strat Fds
Options Arbitrage/Opt Strat Fds
Options Arbitrage/Opt Strat Fds
Options Arbitrage/Opt Strat Fds
Options Arbitrage/Opt Strat Fds
Options Arbitrage/Opt Strat Fds
Options Arbitrage/Opt Strat Fds
Options Arbitrage/Opt Strat Fds
Options Arbitrage/Opt Strat Fds
Options Arbitrage/Opt Strat Fds
Options Arbitrage/Opt Strat Fds
Options Arbitrage/Opt Strat Fds
Options Arbitrage/Opt Strat Fds
Options Arbitrage/Opt Strat Fds
Options Arbitrage/Opt Strat Fds
FV
IFV
DDIV
DVOL
DVLU
RNEM
LEGR
MDEV
FICS
RNLC
RNMC
MDIV
ROBT
FTXO
FTQI
FTXG
FTXN
FTXH
FTXL
TDIV
FTXR
AIRR
RDVY
FID
RNSC
SDVY
ISHP
BNGE
FAAR
GAUG
GSEP
FTGC
AFLG
AFMC
AFSM
AGQI
XAUG
XDEC
XJUL
XJUN
XMAR
XSEP
GAPR
GFEB
GJAN
GJUL
GJUN
GMAR
GMAY
XPND
MFLX
BUFR
BUFD
BUFQ
FCEF
ILDR
YDEC
YJUN
YMAR
YSEP
LDSF
MMLG
MMSC
LALT
QDEC
QJUN
QMAR
QSPT
CRPT
EFIX
FIXD
DEED
UCON
SAUG
SMAY
XISE
BUFT
BUFG
FAPR
FAUG
FDEC
FFEB
FJAN
FJUL
FJUN
FMAR
FMAY
FNOV
FOCT
FSEP
DAPR
DAUG
NAV
51.88
19.46
30.40
27.34
25.96
51.58
40.88
20.17
33.77
34.49
31.08
15.63
45.49
25.28
19.86
24.27
28.30
26.63
81.61
64.09
30.04
57.82
51.65
16.11
28.69
32.79
28.88
23.57
27.28
31.54
31.64
22.47
27.27
26.70
27.37
13.30
31.36
34.11
32.09
35.17
32.85
35.94
32.72
33.03
34.44
32.07
31.81
33.38
32.90
23.50
16.95
26.55
22.66
27.03
19.72
19.68
22.75
21.27
22.09
20.82
18.87
23.99
17.04
19.69
23.64
24.11
25.58
23.79
9.68
16.05
44.50
21.24
24.62
21.23
22.04
30.58
20.82
21.31
34.95
40.54
38.98
42.63
39.78
41.63
44.13
37.77
41.37
42.51
38.90
40.25
32.38
35.40
Net Assets
(MIL)
3142.9
183.4
42.1
47.0
23.9
34.3
99.2
2.8
73.1
17.9
18.6
424.1
441.9
133.9
121.3
84.0
258.7
20.0
1097.1
2108.7
37.4
529.4
8405.5
75.5
31.3
1863.9
5.4
4.6
162.5
111.5
130.4
2723.4
5.3
4.9
3.7
113.7
32.3
324.0
57.3
318.2
228.9
145.5
141.8
167.0
132.8
245.6
323.7
85.7
112.6
11.2
14.0
2539.4
728.9
301.9
25.9
18.6
36.1
134.2
85.6
32.7
123.5
51.0
7.9
2.0
166.0
402.8
205.8
222.8
24.4
33.8
4612.3
66.1
1665.7
32.8
27.8
39.0
107.4
172.6
409.5
604.0
346.7
574.1
387.8
567.7
629.2
367.9
589.6
550.0
432.5
453.7
213.3
336.0
4th Qtr
Total Return
1 Year 3 Years*
17.43
10.27
10.72
10.06
14.31
7.59
10.96
11.93
12.40
12.02
13.28
8.86
12.64
23.51
8.76
3.47
-4.92
4.63
21.01
15.11
7.60
12.18
13.20
11.39
13.43
16.85
13.52
14.55
-3.90
6.88
6.93
-5.50
11.47
12.30
14.22
3.20
5.62
3.61
6.29
5.97
3.66
5.86
6.41
7.24
6.76
7.11
7.28
5.17
6.51
14.96
7.95
8.59
6.84
7.73
7.89
14.95
8.23
8.08
9.25
8.89
4.12
17.71
10.79
-0.11
4.28
9.94
6.23
9.73
96.35
9.79
7.11
7.32
4.61
8.26
8.15
3.01
5.63
8.34
8.24
8.19
10.90
9.34
9.05
8.69
8.77
7.15
7.96
9.17
6.60
8.32
6.41
6.95
13.41
19.88
9.99
5.35
18.62
22.55
21.84
7.17
18.18
17.38
16.43
11.53
27.10
0.19
24.52
-6.18
5.00
-1.41
54.30
36.81
20.65
31.60
20.43
9.22
15.87
28.73
24.35
37.36
-5.72
N/A
N/A
-4.90
19.69
21.49
22.18
9.62
N/A
14.89
N/A
14.93
N/A
16.50
N/A
N/A
N/A
N/A
N/A
N/A
N/A
46.27
8.00
19.81
15.08
35.76
10.14
39.18
14.55
15.04
16.08
15.99
6.61
45.13
18.83
N/A
29.53
36.06
34.77
42.11
193.33
11.43
5.72
5.69
7.55
N/A
N/A
N/A
12.54
18.85
19.41
16.76
22.77
19.71
21.35
21.23
22.11
20.67
17.60
19.65
17.59
20.33
9.99
13.72
9.40
-1.67
10.38
4.76
14.97
5.89
5.41
N/A
4.48
9.31
10.25
7.46
-2.94
4.92
7.55
3.83
37.84
2.35
11.48
11.32
3.87
19.69
11.05
3.96
8.24
13.54
1.66
N/A
5.62
N/A
N/A
12.61
8.40
8.87
8.33
4.62
N/A
N/A
N/A
N/A
N/A
N/A
N/A
N/A
N/A
N/A
N/A
N/A
N/A
N/A
-2.01
7.42
N/A
N/A
1.80
N/A
3.97
N/A
N/A
N/A
0.22
0.00
N/A
N/A
5.56
N/A
N/A
N/A
N/A
N/A
-3.99
-3.19
0.76
N/A
N/A
N/A
N/A
N/A
N/A
5.29
8.33
8.71
N/A
8.01
9.02
N/A
6.11
6.39
7.18
7.72
N/A
2.19
January 8, 2024
BARRON’S
•
L35
Funds Quarterly
ETF Score Card
For personal non-commercial use only. Do not edit or alter. Reproductions not permitted.
To reprint or license content, please contact Barron's reprints department at 800-843-0008 or www.djreprints.com
Fund
FT VIII:VUS Eqty DB Dec
FT VIII:VUS Eqty DB Feb
FT VIII:VUS Eqty DB Jan
FT VIII:VUS Eqty DB Jul
FT VIII:VUS Eqty DB Jun
FT VIII:VUS Eqty DB Mar
FT VIII:VUS Eqty DB May
FT VIII:VUS Eqty DB Nov
FT VIII:VUS Eqty DB Oct
FT VIII:VUS Eqty DB Sep
FT:Bloomberg Inf Sens Eq
FT:Capital Strength
FT:Dividend Strength
FT:DJ Internet Index Fd
FT:DJ Select MicroCap
FT:Dow 30 Equal Weight
FT:Gold Strat Qtly Bffr
FT:Gold Strat Target Inc
FT:Growth Strength ETF
FT:Indxx A&D ETF
FT:Lunt US Fctr Rotation
FT:MS Dividend Leaders
FT:Natural Gas
FT:NSDQ ABA Commnty Bank
FT:NSDQ Cln Edge Grn En
FT:NSDQ-100 Equal Weight
FT:NSDQ-100 Ex-Tech Sect
FT:NSDQ-100-Technology
FT:NYSE Arca Biotech
FT:S&P REIT Index Fd
FT:S&P500 Df FreeCshFlw
FT:S&P500 Dvsfd DA
FT:US Equity Opptys
FT:Value Line Dividend
FT:Water ETF
FundX
FundX Aggressive
FundX Conservative
FundX Flexible
Future Fund Active
Future Fund Long/Short
Gabelli:Automation ETF
Gabelli:Commercial AD
Gabelli:Finl Srvcs Opps
Gabelli:Grwth Innovators
Gabelli:Love Our P&P
Gadsden Dynamic Mlt-Asst
GGM Macro Alignment
Glbl X 1-3 Month T-Bill
Glbl X Adaptive US Fctr
Glbl X Adptv US Rsk Mgmt
Glbl X Aging Population
Glbl X AgTch & Food Innv
Glbl X AI & Technology
Glbl X Alternative Inc
Glbl X Auto & Elct Vhcls
Glbl X Blckchn & Btc Str
Glbl X Blockchain ETF
Glbl X Cannabis ETF
Glbl X Carbon Crdts Str
Glbl X China Btech Innov
Glbl X Clean Water ETF
Glbl X CleanTech ETF
Glbl X Cloud Computing
Glbl X Conscious Com ETF
Glbl X Copper Miners ETF
Glbl X Cybersecurity
Glbl X D30 Cov Call & Gr
Glbl X D30 Covered Call
Glbl X DAX Germany
Glbl X DC REITs & DI
Glbl X Disruptive Mtrls
Glbl X E-commerce
Glbl X EM Grt Cnsmr
Glbl X Emerg Mrkts
Glbl X Emerging Mkts Bd
Glbl X FinTech
Glbl X Fnl Cov Call & Gr
Glbl X FTSE SE Asia
Glbl X Geno & Biotech
Glbl X Gold Explrs ETF
Glbl X Green Building
Glbl X Guru Index ETF
Glbl X HC Cov Call & Gro
Glbl X Health & Wellness
Glbl X Hydrogen ETF
Glbl X InfoTech Cov C&G
Glbl X Int Rt Vol & IH
Glbl X Interest Rate Hdg
Glbl X Itrnt of Things
Glbl X Lith & Bat Tech
Glbl X Metaverse
Description
ETF
Symbols
Options Arbitrage/Opt Strat Fds
Options Arbitrage/Opt Strat Fds
Options Arbitrage/Opt Strat Fds
Options Arbitrage/Opt Strat Fds
Options Arbitrage/Opt Strat Fds
Options Arbitrage/Opt Strat Fds
Options Arbitrage/Opt Strat Fds
Options Arbitrage/Opt Strat Fds
Options Arbitrage/Opt Strat Fds
Options Arbitrage/Opt Strat Fds
Real Return
Large-Cap Core
Equity Income
Science & Technology
Small-Cap Core
Large-Cap Value
Options Arbitrage/Opt Strat Fds
Options Arbitrage/Opt Strat Fds
Large-Cap Growth
Industrials
Multi-Cap Core
Equity Income
Natural Resources
Financial Services
Alternative Energy
Multi-Cap Growth
Multi-Cap Core
Science & Technology
Health/Biotechnology
Real Estate
Large-Cap Value
Equity Income
Multi-Cap Growth
Multi-Cap Value
Specialty/Miscellaneous
Mixed-Asset Trgt All Agg Gr Fds
Mixed-Asset Trgt All Agg Gr Fds
Mixed-Asset Trgt Alloc Mod Fds
Multi-Sector Income
Multi-Cap Growth
Alternative Long/Short Eqty Fds
Industrials
Industrials
Financial Services
Large-Cap Growth
Multi-Cap Value
Flexible Portfolio
Multi-Cap Core
Short U.S. Treasury
Multi-Cap Value
Flexible Income
Global Health/Biotechnology Fds
Consumer Goods
Global Science/Technology Fds
Alternative Multi-Strategy
Global Science/Technology Fds
Alternative Currency Strategies
Global Science/Technology Fds
Specialty/Miscellaneous
Alternative Managed Futures Fds
China Region
Specialty/Miscellaneous
Alternative Energy
Global Science/Technology Fds
Multi-Cap Core
Basic Materials
Global Science/Technology Fds
Alternative Long/Short Eqty Fds
Alternative Long/Short Eqty Fds
European Region
Global Science/Technology Fds
Global Small-/Mid-Cap
Specialty/Miscellaneous
Emerging Markets
Emerging Markets
Emerging Mrkts Hard Currency Debt
Global Science/Technology Fds
Financial Services
Pacific Region
Global Health/Biotechnology Fds
Precious Metals Equity
Global Real Estate
Multi-Cap Core
Health/Biotechnology
Global Health/Biotechnology Fds
Alternative Energy
Science & Technology
Inflation Protected Bond
Inflation Protected Bond
Global Science/Technology Fds
Basic Materials
Global Science/Technology Fds
DDEC
DFEB
DJAN
DJUL
DJUN
DMAR
DMAY
DNOV
DOCT
DSEP
FTIF
FTCS
FTDS
FDN
FDM
EDOW
BGLD
IGLD
FTGS
MISL
FCTR
FDL
FCG
QABA
QCLN
QQEW
QQXT
QTEC
FBT
FRI
FCFY
KNGZ
FPX
FVD
FIW
XCOR
XNAV
XRLX
XFLX
FFND
FFLS
GAST
GCAD
GABF
GGRW
LOPP
GDMA
GGM
CLIP
AUSF
ONOF
AGNG
KROP
AIQ
ALTY
DRIV
BITS
BKCH
POTX
NTRL
CHB
AQWA
CTEC
CLOU
KRMA
COPX
BUG
DYLG
DJIA
DAX
VPN
DMAT
EBIZ
EMC
EMM
EMBD
FINX
FYLG
ASEA
GNOM
GOEX
GRNR
GURU
HYLG
BFIT
HYDR
TYLG
IRVH
RATE
SNSR
LIT
VR
NAV
35.75
37.52
34.51
36.49
38.06
33.84
36.11
38.66
36.39
36.49
21.91
80.03
46.46
186.50
61.45
32.64
18.81
19.39
27.17
25.45
27.81
35.87
24.31
49.83
42.19
117.52
88.19
175.53
158.00
26.21
22.03
29.76
95.75
40.55
94.83
55.36
57.14
37.85
24.03
20.45
20.20
24.45
28.27
32.78
21.12
25.21
30.12
26.46
25.01
37.18
29.62
28.51
10.71
31.15
11.35
24.74
53.20
46.44
5.82
31.75
8.14
16.33
10.85
22.64
33.35
37.87
29.23
26.52
21.88
30.92
14.62
15.50
21.22
25.55
26.19
22.29
25.59
24.64
15.03
11.57
25.50
23.50
40.42
24.55
22.69
6.87
30.25
21.70
18.36
35.40
51.38
26.06
Net Assets
(MIL)
241.4
200.5
187.0
457.0
189.3
194.6
195.2
266.5
189.9
197.2
1.1
8553.7
19.7
5386.4
158.5
256.6
34.0
81.6
56.3
54.8
88.0
3906.8
513.9
62.0
998.7
2044.5
165.7
3184.6
1167.4
114.6
1.0
21.3
697.7
10596.0
1412.7
138.9
23.4
56.0
58.0
8.4
2.0
4.4
4.2
8.7
3.1
10.8
153.6
9.1
111.3
181.8
94.8
53.6
4.5
781.3
34.5
697.7
16.2
87.1
28.0
1.6
2.3
9.4
58.9
581.2
579.7
1357.5
647.6
2.6
82.0
53.4
39.3
6.5
72.8
209.3
24.3
126.3
351.5
2.4
39.5
93.0
36.5
2.2
50.4
2.7
9.2
35.8
4.1
3.4
2.7
287.5
2101.8
2.7
4th Qtr
Total Return
1 Year 3 Years*
6.62
7.51
6.38
7.51
7.54
5.00
6.36
8.78
5.02
7.10
4.32
9.27
11.68
16.81
12.55
13.28
9.85
9.35
14.61
17.30
13.19
8.88
-5.56
26.42
-0.91
13.37
8.96
20.80
7.96
15.84
13.10
9.98
14.04
9.27
14.93
13.25
11.81
8.43
3.83
8.20
4.12
8.51
18.75
18.39
13.79
8.91
3.66
8.67
1.38
18.79
4.71
9.66
-0.41
15.74
8.39
5.86
80.69
103.36
-10.44
3.53
7.41
16.17
-0.69
20.23
12.62
4.61
20.51
8.63
4.35
13.46
15.87
-2.47
16.79
7.44
7.08
8.83
27.08
9.32
5.04
13.99
14.92
16.41
12.15
5.04
9.29
-6.91
13.48
4.10
-15.58
15.67
-6.73
20.87
16.94
12.54
13.63
17.98
17.54
12.39
15.37
18.26
16.26
19.13
N/A
8.57
11.83
51.45
13.04
15.77
12.95
11.55
33.56
14.89
0.70
2.95
2.66
-2.45
-9.96
33.52
16.79
66.91
2.26
13.15
N/A
9.74
22.01
4.12
20.40
14.13
16.09
8.91
3.73
38.93
N/A
18.24
N/A
38.85
42.13
4.83
1.85
N/A
N/A
22.15
11.59
9.71
-23.92
54.78
11.09
25.60
214.05
270.95
-44.36
N/A
-14.60
19.85
-25.82
41.15
21.98
9.30
40.95
N/A
8.82
23.59
18.21
-19.67
30.50
-1.83
2.98
10.03
33.88
6.96
4.43
-8.61
2.67
18.15
19.09
4.07
8.70
-37.26
41.59
0.37
-7.58
22.81
-11.85
50.67
5.51
5.01
N/A
4.70
5.43
N/A
3.25
5.02
5.61
5.43
N/A
7.24
6.47
-4.24
10.43
8.29
N/A
N/A
N/A
N/A
-0.94
11.07
44.31
6.08
-15.31
5.80
4.40
8.44
-2.04
6.71
N/A
8.99
-6.35
7.20
10.23
1.09
0.81
1.54
-0.96
N/A
N/A
N/A
N/A
N/A
N/A
N/A
1.31
N/A
N/A
15.79
N/A
1.32
N/A
4.95
6.43
2.18
N/A
N/A
-51.98
N/A
-20.53
N/A
-21.47
-6.18
8.09
10.41
2.04
N/A
N/A
2.62
-0.23
N/A
-12.40
-14.39
-5.89
-2.16
-16.60
N/A
4.95
-21.13
-9.02
N/A
-2.43
N/A
-2.86
N/A
N/A
N/A
N/A
4.32
-5.22
N/A
Fund
Glbl X Millennial Consmr
Glbl X MLP & Engy Infra
Glbl X MLP ETF
Glbl X MSCI Argnt ETF
Glbl X MSCI Ch Cn Dscr
Glbl X MSCI Ch Cn Stp
Glbl X MSCI Ch Comm Svcs
Glbl X MSCI Ch Energy
Glbl X MSCI Ch Fncls
Glbl X MSCI Ch Health Cr
Glbl X MSCI Ch Indus
Glbl X MSCI Ch Info Tech
Glbl X MSCI Ch Materials
Glbl X MSCI Ch Rl Est
Glbl X MSCI Ch Utilities
Glbl X MSCI Colombia ETF
Glbl X MSCI Greece
Glbl X MSCI Nigeria ETF
Glbl X MSCI Norway ETF
Glbl X MSCI Nxt Emg & Fr
Glbl X MSCI Pakistan ETF
Glbl X MSCI Portugal
Glbl X MSCI SupDiv EAFE
Glbl X MSCI SuperDiv EM
Glbl X MSCI Vietnam
Glbl X NAS 100 Collar 95
Glbl X Nas 100 ESG CC
Glbl X NAS 100 R Mgd Inc
Glbl X NAS 100 Tail Risk
Glbl X NASDAQ 100 CC
Glbl X Nasdaq 100 CC&G
Glbl X PropTech
Glbl X RE Producers
Glbl X Rob & Art Intel
Glbl X Russ2000 Cov C&G
Glbl X Russ2000 Cov Call
Glbl X S&P 500 Cath Val
Glbl X S&P 500 CC
Glbl X S&P 500 CC & Gro
Glbl X S&P 500 Col 95
Glbl X S&P 500 ESG CC
Glbl X S&P 500 Qual Div
Glbl X S&P 500 R Mgd Inc
Glbl X S&P 500 Tail Risk
Glbl X S&P CV Dev xUS
Glbl X Silver Miners ETF
Glbl X Social Media
Glbl X Solar ETF
Glbl X Super Inc Prfrd
Glbl X SuperDiv REIT
Glbl X SuperDiv US ETF
Glbl X SuperDividend ETF
Glbl X Telemed & DH
Glbl X Thematic Growth
Glbl X Uranium ETF
Glbl X US Csh Flo Kn 100
Glbl X US Infra Dev
Glbl X US Preferred
Glbl X Var Rt Preferred
Glbl X VG & Esports
Glbl X Wind Energy ETF
Global X Brazil Active
Global X Defense Tech
Global X India Active
Goldman II:MB Tot Int Eq
Goldman II:MB US 1000 Eq
Goldman Sachs Phys Gold
Goldman:AB Em Mkts Eq
Goldman:AB Europe Eqty
Goldman:AB Intl Eqty
Goldman:AB Japan Eqty
Goldman:AB Par-Al Clm LC
Goldman:AB US Lg Cap Eq
Goldman:AB US Sm Cap Eq
Goldman:AB Wrld LV + Eq
Goldman:Acc EM USD Bd
Goldman:Acc Hi Yld Cp Bd
Goldman:Acc Inv GC 1-5 Y
Goldman:Acc Inv Gd Cp Bd
Goldman:Acc IP USD Bd
Goldman:Acc Trsry 0-1 Yr
Goldman:Acc Ult Sh Bd
Goldman:Acc US Agg Bd
Goldman:Bbg Cln Egy Eqty
Goldman:Community Mun Bd
Goldman:Defensive Equity
Goldman:Eql Wgt US LC Eq
Goldman:Fut Consumer Eq
Goldman:Fut Health Care
Goldman:Fut RE & Infra
Goldman:Fut Tch Ldrs Eq
Goldman:Future Planet Eq
Data provided by
Description
ETF
Symbols
Multi-Cap Core
Energy MLP
Energy MLP
Latin American
Consumer Goods
Consumer Goods
Telecommunication
Global Natural Resources
Global Financial Services
Global Health/Biotechnology Fds
Industrials
Global Science/Technology Fds
Basic Materials
Intl Real Estate
Utility
Latin American
Emerging Markets
Emerging Markets
European Region
Frontier Markets
Emerging Markets
European Region
Intl Multi-Cp Val Fds
Intl Equity Income Fds
Frontier Markets
Options Arbitrage/Opt Strat Fds
Alternative Long/Short Eqty Fds
Options Arbitrage/Opt Strat Fds
Options Arbitrage/Opt Strat Fds
Alternative Long/Short Eqty Fds
Alternative Long/Short Eqty Fds
Global Science/Technology Fds
Alternative Event Driven
Global Science/Technology Fds
Alternative Long/Short Eqty Fds
Alternative Long/Short Eqty Fds
Large-Cap Core
Alternative Long/Short Eqty Fds
Alternative Long/Short Eqty Fds
Options Arbitrage/Opt Strat Fds
Alternative Long/Short Eqty Fds
Equity Income
Options Arbitrage/Opt Strat Fds
Options Arbitrage/Opt Strat Fds
Intl Large-Cp Core Fds
Precious Metals Equity
Global Science/Technology Fds
Alternative Energy
Flexible Income
Global Real Estate
Equity Income
Global Equity Income
Global Health/Biotechnology Fds
Global Multi-Cap Growth Fds
Basic Materials
Large-Cap Growth
Industrials
Flexible Income
Equity Income
Telecommunication
Alternative Energy
Latin American
Industrials
India Region
Intl Large-Cp Core Fds
Large-Cap Core
Commodities Prec Metals Fds
Emerging Markets
European Region
Intl Multi-Cp Core Fds
Japanese
Multi-Cap Core
Multi-Cap Core
Small-Cap Core
Global Multi-Cap Value Fds
Emerging Mrkts Hard Currency Debt
High Yield
Short-Intmdt Inv. Grade Debt
Core Plus Bond
Inflation Protected Bond
Short U.S. Treasury
Ultra-Short Obligations
Core Plus Bond
Alternative Energy
Interm. Municipal Debt
Options Arbitrage/Opt Strat Fds
Multi-Cap Core
Consumer Services
Health/Biotechnology
Global Real Estate
Global Science/Technology Fds
Global Multi-Cap Core Fds
MILN
MLPX
MLPA
ARGT
CHIQ
CHIS
CHIC
CHIE
CHIX
CHIH
CHII
CHIK
CHIM
CHIR
CHIU
GXG
GREK
NGE
NORW
EMFM
PAK
PGAL
EFAS
SDEM
VNAM
QCLR
QYLE
QRMI
QTR
QYLD
QYLG
PTEC
RNRG
BOTZ
RYLG
RYLD
CATH
XYLD
XYLG
XCLR
XYLE
QDIV
XRMI
XTR
CEFA
SIL
SOCL
RAYS
SPFF
SRET
DIV
SDIV
EDOC
GXTG
URA
FLOW
PAVE
PFFD
PFFV
HERO
WNDY
BRAZ
SHLD
NDIA
GXUS
GUSA
AAAU
GEM
GSEU
GSIE
GSJY
GPAL
GSLC
GSSC
GLOV
GEMD
GHYB
GSIG
GIGB
GTIP
GBIL
GSST
GCOR
GCLN
GMUN
GDEF
GSEW
GBUY
GDOC
GREI
GTEK
GSFP
NAV
35.47
44.51
44.43
51.28
17.63
16.85
13.32
15.22
10.68
13.91
10.20
15.29
14.38
13.78
12.82
22.83
37.24
6.32
25.51
18.91
16.68
10.69
14.45
25.01
16.55
26.49
25.94
17.12
26.10
17.36
28.86
30.02
11.37
28.54
25.31
16.74
58.01
39.47
28.31
27.20
24.94
32.22
18.93
27.14
29.58
28.51
40.39
13.19
9.10
22.19
17.16
22.58
10.16
24.71
27.71
28.32
34.44
19.39
23.04
20.26
13.78
28.66
27.75
27.98
42.65
41.37
20.43
30.86
34.79
32.74
35.32
39.34
93.81
63.18
43.57
41.00
44.25
46.73
46.30
48.97
99.73
50.01
41.79
34.14
50.58
44.19
66.99
28.12
32.81
34.30
27.97
30.00
Net Assets
(MIL)
105.5
999.2
1488.9
93.0
281.2
9.2
5.7
5.4
20.9
9.2
4.5
12.1
2.8
6.7
2.0
33.8
171.3
29.0
55.4
22.8
33.8
8.3
10.9
44.6
10.3
2.3
2.6
11.5
1.5
7716.6
110.8
2.7
47.2
2244.4
10.5
1446.4
739.6
2804.2
64.4
2.4
2.2
48.3
27.2
2.6
15.9
937.4
159.2
6.0
168.7
238.6
595.1
745.6
64.9
32.3
2425.3
3.8
5153.8
2268.3
222.3
132.3
2.7
3.3
4.9
7.4
411.1
1417.8
619.4
953.1
11.7
3286.8
13.8
7.5
11047.0
460.6
743.8
53.2
103.7
11.6
633.2
99.3
5555.7
612.3
530.7
11.6
20.0
6.7
477.6
79.1
23.5
23.0
161.8
45.3
4th Qtr
Total Return
1 Year 3 Years*
17.16
6.50
1.62
25.19
-3.13
-7.22
-7.68
2.24
-4.97
0.49
-4.83
5.13
-6.63
-13.42
2.07
13.15
12.67
-13.80
5.21
5.84
32.33
11.82
12.36
9.62
-0.35
11.41
6.81
3.47
12.96
6.49
10.55
15.27
13.84
15.28
7.63
1.11
11.74
4.05
7.80
9.17
4.99
6.92
2.01
10.34
11.20
19.56
12.07
-2.01
6.23
13.28
8.67
6.99
10.55
6.39
7.76
8.13
13.95
5.52
3.26
9.34
8.02
16.57
14.63
10.73
9.48
11.92
10.25
7.44
10.40
9.35
6.49
12.68
11.88
13.70
9.71
9.27
6.95
3.89
8.42
4.52
1.42
1.99
6.78
7.22
5.18
1.93
12.87
11.56
8.63
14.63
18.57
12.30
36.19
15.48
16.18
52.50
-10.92
-23.57
-6.73
17.37
-5.05
-16.36
-17.53
-7.34
-16.34
-34.21
-7.97
22.56
43.51
-27.27
5.01
6.82
18.89
10.83
14.65
13.32
12.76
27.91
N/A
11.45
45.14
22.82
38.16
N/A
-12.33
38.62
8.50
0.34
26.36
11.04
18.19
15.54
N/A
5.17
4.50
21.06
17.74
1.92
30.94
-35.37
3.63
9.63
-1.77
5.53
-13.01
10.34
46.23
N/A
30.88
7.48
10.61
8.78
-22.40
N/A
N/A
N/A
N/A
26.59
13.63
11.26
20.86
17.27
18.92
24.50
25.04
17.37
16.10
8.42
12.77
6.04
8.65
4.09
4.94
6.09
5.35
-5.15
N/A
6.46
17.62
21.23
4.90
9.56
33.79
5.36
-1.51
25.08
27.34
21.09
-20.36
-19.12
-20.18
28.37
-7.16
-19.51
-9.92
-22.21
-11.19
-31.46
-1.53
-4.87
16.01
-11.24
2.48
2.20
-10.56
2.48
5.83
-2.99
N/A
N/A
N/A
N/A
N/A
3.15
6.50
N/A
-13.23
-4.62
N/A
2.23
9.20
5.33
7.36
N/A
N/A
10.38
N/A
N/A
2.16
-13.77
-12.97
N/A
-2.36
0.90
7.25
-7.02
-19.23
-16.02
27.15
N/A
18.34
-3.56
0.39
-12.68
N/A
N/A
N/A
N/A
N/A
N/A
2.76
-4.06
4.94
3.68
0.32
N/A
8.95
6.57
N/A
N/A
1.19
-0.28
-3.42
-1.11
1.93
2.08
-3.73
N/A
N/A
2.21
6.75
N/A
N/A
N/A
N/A
N/A
L36
BARRON’S
•
Funds Quarterly
January 8, 2024
ETF Score Card
For personal non-commercial use only. Do not edit or alter. Reproductions not permitted.
To reprint or license content, please contact Barron's reprints department at 800-843-0008 or www.djreprints.com
Fund
Goldman:Hdg Indus VIP
Goldman:Innovate Equity
Goldman:JUST US LC Eq
Goldman:MB Em Mkts Eq
Goldman:MB Intl Eqty
Goldman:MB US Equity
Goldman:North Am P&P Eq
Goose Hollow Tact Alloc
GraniteShares:Gold Trust
GraniteShares:Plat Trust
Grayscale Fut of Finance
Grizzle Growth ETF
GrnShs:1.25x Lg TSLA Dly
GrnShs:1.5x Lg COIN Dly
GrnShs:1.5x Lg META Dly
GrnShs:1.5x Lg NVDA Dly
GrnShs:1.5x Shrt NVDA D
GrnShs:1.5x Shrt TSLA D
GrnShs:1.75x Lg AAPL Dly
GrnShs:1.75x Lg BABA Dly
GrnShs:1.75x Lg TSLA Dly
GrnShs:1x Shrt AMD D
GrnShs:Blm CBS No K-1
GrnShs:HIPS US High Inc
GrnShs:Nasdaq Sel Dspt
Guinn Atkin:SmartETFs AM
Guinn Atkin:SmartETFs AP
Guinn Atkin:SmartETFs DB
Guinn Atkin:SmartETFs SE
Guinn Atkin:SmartETFs ST
Guru Favorite Stocks
Harbor Comm All-Wthr Str
Harbor Disruptive Innov
Harbor Div Growth Ldrs
Harbor En Transition Str
Harbor Health Care
Harbor Hm Cap Fct Uncnst
Harbor Hm Cap Fct US LC
Harbor Hm Cap Fct US SC
Harbor Intl Compounders
Harbor Long-Term Growers
Harbor Multi-Asset Explr
Harbor Sci Alpha HY
Harbor Sci Alpha Inc
Hartford Core Bond
Hartford Large Cap Gro
Hartford Municipal Oppt
Hartford Quality Value
Hartford Schr Com Strat
Hartford Schr Tax-Awr Bd
Hartford Short Duration
Hartford Sustainable Inc
Hartford Total Return Bd
Hashdex Bitcoin Futures
HCM Defender 100 Idx ETF
HCM Defender 500 Idx ETF
Hennessy:Stance ESG
Horizon Kinetics Inf Ben
Horizon Kinetics Medical
Horizon Kinetics SPAC Ac
Horizon Knt Blkch Dev
Horizon Knt Enrgy Rmdtn
Hoya Capital High Dv Yld
Hoya Capital Housing
Hull Tactical US
Humankind:US Stock
Hypatia Women CEO
iMGP Berkshire Div Gro
iMGP DBi Hedge Strategy
iMGP DBi Mngd Fut Strat
iMGP RBA Resp Glbl Alloc
ImpShs:Affd Housing MBS
ImpShs:NAACP Min Empwr
ImpShs:YMCA Wmn Empwrmt
IndexIQ:CBRE NextGen RE
IndexIQ:Cndrm US LCE
IndexIQ:FTSE Intl Eq CN
IndexIQ:Hdg Mlt-Str Trck
IndexIQ:IQ 500 Internatl
IndexIQ:IQ Cdm US MCE
IndexIQ:IQ Clean Oceans
IndexIQ:IQ Cleaner Trans
IndexIQ:IQ Cndrm Intl Eq
IndexIQ:IQ Engndr Eqlty
IndexIQ:IQ Gl Eq R&D Ldr
IndexIQ:IQ Healthy Hrts
IndexIQ:IQ US LC R&D Ldr
IndexIQ:IQ US Small Cap
IndexIQ:Merger Arbitrage
India Internet & Ecomm
InfraCap Eqty Inc Fund
Innovator 20+ TB 5 F Qtr
Description
ETF
Symbols
Multi-Cap Core
Global Multi-Cap Growth Fds
Large-Cap Core
Emerging Markets
Intl Large-Cp Core Fds
Large-Cap Core
Utility
Flexible Portfolio
Commodities Prec Metals Fds
Commodities Prec Metals Fds
Global Science/Technology Fds
Multi-Cap Growth
Equity Leverage
Equity Leverage
Equity Leverage
Equity Leverage
Dedicated Short Bias
Dedicated Short Bias
Equity Leverage
Equity Leverage
Equity Leverage
Dedicated Short Bias
Commodities General
Mixed-Asset Trgt Alloc Gro Fds
Large-Cap Growth
Global Science/Technology Fds
Intl Equity Income Fds
Global Equity Income
Alternative Energy
Global Science/Technology Fds
Large-Cap Core
Commodities General
Multi-Cap Growth
Equity Income
Commodities Energy
Health/Biotechnology
Science & Technology
Large-Cap Core
Small-Cap Core
Intl Large-Cp Gro Fds
Large-Cap Growth
Flexible Portfolio
High Yield
Multi-Sector Income
Core Bond
Multi-Cap Growth
Interm. Municipal Debt
Large-Cap Value
Commodities General
General & Insured Municipal Debt
Short Inv. Grade Debt
Multi-Sector Income
Core Bond
Alternative Currency Strategies
Large-Cap Growth
Large-Cap Core
Large-Cap Core
Global Multi-Cap Core Fds
Global Health/Biotechnology Fds
Alternative Event Driven
Global Science/Technology Fds
Alternative Energy
Equity Income
Real Estate
Alternative Long/Short Eqty Fds
Multi-Cap Core
Multi-Cap Core
Equity Income
Alternative Long/Short Eqty Fds
Alternative Managed Futures Fds
Alternative Global Macro
U.S. Mortgage
Large-Cap Core
Large-Cap Core
Real Estate
Large-Cap Core
Intl Large-Cp Core Fds
Alternative Multi-Strategy
Intl Multi-Cp Val Fds
Small-Cap Core
Global Natural Resources
Industrials
Intl Large-Cp Core Fds
Multi-Cap Core
Global Large-Cap Value Fds
Global Health/Biotechnology Fds
Large-Cap Core
Small-Cap Core
Alternative Event Driven
Global Science/Technology Fds
Equity Income
Options Arbitrage/Opt Strat Fds
GVIP
GINN
JUST
GSEE
GSID
GSUS
GPOW
GHTA
BAR
PLTM
GFOF
DARP
TSL
CONL
FBL
NVDL
NVD
TSDD
AAPB
BABX
TSLR
AMDS
COMB
HIPS
DRUP
MRAD
ADIV
DIVS
SOLR
MOTO
GFGF
HGER
INNO
GDIV
RENW
MEDI
HAPY
HAPI
HAPS
OSEA
WINN
MAPP
SIHY
SIFI
HCRB
HFGO
HMOP
QUVU
HCOM
HTAB
HSRT
HSUN
HTRB
DEFI
QQH
LGH
STNC
INFL
MEDX
SPAQ
BCDF
NVIR
RIET
HOMZ
HTUS
HKND
WCEO
BDVG
DBEH
DBMF
IRBA
OWNS
NACP
WOMN
ROOF
IQSU
HFXI
QAI
IQIN
IQSM
OCEN
CLNR
IQSI
EQUL
WRND
HART
LRND
CSML
MNA
INQQ
ICAP
TFJL
NAV
95.86
52.57
67.98
42.32
53.86
65.31
41.96
27.55
20.39
9.77
17.98
26.51
11.01
33.97
77.54
89.56
19.05
15.58
22.95
15.90
25.76
15.42
19.46
12.38
45.94
15.37
14.05
25.84
28.16
41.86
24.94
20.89
14.48
13.43
12.82
24.79
21.21
27.96
28.18
26.16
20.67
20.35
45.18
43.46
35.14
16.79
38.89
23.04
14.41
19.68
38.93
33.82
34.02
50.74
50.30
41.20
28.14
31.53
28.01
96.94
24.47
25.95
10.98
42.27
35.86
29.28
28.11
10.44
26.62
25.77
9.44
17.22
33.99
33.30
20.42
41.83
24.88
30.13
32.76
30.11
22.38
22.78
28.29
23.98
26.26
28.90
28.34
36.06
31.49
13.63
24.95
21.45
Net Assets
(MIL)
151.1
335.7
298.9
92.2
718.6
1652.3
10.6
39.4
940.0
36.9
5.6
13.2
6.7
16.7
12.6
240.3
1.9
1.5
4.8
7.8
6.9
0.6
97.4
57.7
49.5
1.2
3.2
29.4
4.6
10.9
32.4
103.7
29.7
222.8
23.4
4.6
11.2
269.8
115.1
27.8
221.3
3.5
114.5
32.1
256.3
98.0
379.0
167.9
15.3
186.2
94.3
56.0
1326.8
2.3
343.5
281.9
57.6
711.4
17.8
16.6
5.1
3.3
47.1
35.3
35.2
126.5
3.1
1.0
32.9
799.8
7.8
115.0
39.9
43.5
18.7
370.7
443.4
619.9
203.0
175.4
4.7
5.9
193.8
5.6
6.9
8.4
5.4
172.7
422.8
9.9
48.9
9.4
4th Qtr
Total Return
1 Year 3 Years*
12.96
13.69
12.15
7.48
10.31
11.92
8.03
11.54
10.21
8.86
70.69
8.68
-4.41
232.71
23.88
17.55
-20.22
-5.97
19.05
-19.70
-7.30
-32.20
-4.57
5.98
18.44
13.15
7.70
8.99
8.32
7.68
14.98
-2.38
17.34
11.52
-8.83
14.36
17.35
10.85
16.26
14.94
15.87
7.83
7.83
6.77
7.15
15.87
6.83
8.89
-3.98
8.88
3.59
7.59
7.45
51.73
12.41
10.95
11.65
3.71
1.36
0.96
16.87
-3.03
15.09
19.70
15.29
9.08
13.44
8.54
4.05
-8.11
9.05
6.76
10.28
12.01
15.49
12.27
8.35
4.25
8.72
13.25
16.98
9.47
10.29
13.88
10.14
6.75
13.27
16.41
0.66
9.18
15.54
11.06
39.03
29.90
24.76
10.68
17.81
27.63
N/A
13.84
13.60
-6.01
145.73
33.30
112.48
643.33
339.22
430.56
N/A
N/A
76.68
-33.94
N/A
N/A
-8.39
13.75
41.40
22.84
11.50
16.02
-0.94
26.69
24.51
1.98
33.09
15.41
-28.91
24.81
34.22
30.30
N/A
21.07
52.42
N/A
13.68
9.51
6.60
42.36
6.77
7.02
-8.69
6.68
7.41
9.72
7.03
137.06
48.00
24.21
11.40
1.86
-6.03
5.92
24.86
N/A
12.45
36.42
31.13
12.35
N/A
N/A
7.91
-8.72
8.62
4.43
29.74
28.30
11.08
32.39
19.45
10.29
20.59
15.84
17.78
27.80
18.11
13.63
34.77
9.92
44.05
14.88
0.36
30.36
8.69
8.25
1.95
-0.90
9.13
-4.51
3.81
9.17
N/A
N/A
2.75
-2.68
N/A
N/A
N/A
N/A
N/A
N/A
N/A
N/A
N/A
N/A
N/A
N/A
10.19
7.08
8.95
-15.24
1.00
9.12
-0.86
2.80
N/A
N/A
N/A
8.52
N/A
N/A
N/A
N/A
N/A
N/A
N/A
N/A
N/A
N/A
-3.57
N/A
-0.11
9.28
N/A
-0.78
1.08
N/A
-3.10
N/A
7.23
8.19
N/A
N/A
2.69
0.09
N/A
N/A
N/A
11.41
13.33
N/A
N/A
N/A
1.95
7.25
N/A
N/A
8.63
9.47
1.91
10.44
6.73
0.17
7.75
N/A
N/A
N/A
4.18
N/A
N/A
N/A
N/A
8.81
-1.48
N/A
N/A
-4.14
Fund
Innovator 20+ TB 9 B Jul
Innovator Buffer Step-Up
Innovator Def Wealth Shd
Innovator Dpwt Frntr Tch
Innovator DS 9 Bffr Jan
Innovator DS Jan
Innovator Em Mkts PB Apr
Innovator Em Mkts PB Jan
Innovator Em Mkts PB Jul
Innovator Em Mkts PB Oct
Innovator Eq DP 2Y J2025
Innovator Eqty Mgd Flr
Innovator Gdt Tct Rtn St
Innovator Gro Acc + Apr
Innovator Gro Acc + Jan
Innovator Gro Acc + Jul
Innovator Gro Acc + Oct
Innovator Gro Accel Qtr
Innovator Growth PB Apr
Innovator Growth PB Jan
Innovator Growth PB Jul
Innovator Growth PB Oct
Innovator Hdg TSLA Strat
Innovator IBD 50
Innovator IBD Brkout Opp
Innovator Itl Dev PB Apr
Innovator Itl Dev PB Jan
Innovator Itl Dev PB Jul
Innovator Itl Dev PB Oct
Innovator Itl Dev PB Sep
Innovator Lddrd Alloc B
Innovator Lddrd Alloc PB
Innovator P Bffr Step-Up
Innovator PI 10 Br-Aprl
Innovator PI 10 Br-July
Innovator PI 10 Br-Oct
Innovator PI 15 Br-Oct
Innovator PI 20 Br-Aprl
Innovator PI 20 Br-July
Innovator PI 20 Br-Oct
Innovator PI 30 Br-Aprl
Innovator PI 30 Br-July
Innovator PI 30 Br-Oct
Innovator PI 40 Br-Aprl
Innovator PI 40 Br-July
Innovator PI 40 Br-Oct
Innovator PI 9 B Oct
Innovator S&P Inv Gd Prf
Innovator TS Jan
Innovator Uncp Acc US Eq
Innovator US E 10 B Q
Innovator US E 5-15 B Q
Innovator US EA 9 B Apr
Innovator US EA 9 B Jan
Innovator US EA 9 B Jul
Innovator US EA 9 B Oct
Innovator US Eq Acc Apr
Innovator US Eq Acc Jan
Innovator US Eq Acc Jul
Innovator US Eq Acc Oct
Innovator US Eq Acc Qtr
Innovator US Eq Acc+ Apr
Innovator US Eq Acc+ Jan
Innovator US Eq Acc+ Jul
Innovator US Eq Acc+ Oct
Innovator US Eqty B Apr
Innovator US Eqty B Aug
Innovator US Eqty B Dec
Innovator US Eqty B Feb
Innovator US Eqty B Jan
Innovator US Eqty B Jul
Innovator US Eqty B Jun
Innovator US Eqty B Mar
Innovator US Eqty B May
Innovator US Eqty B Nov
Innovator US Eqty B Oct
Innovator US Eqty B Sep
Innovator US Eqty PB Apr
Innovator US Eqty PB Aug
Innovator US Eqty PB Dec
Innovator US Eqty PB Feb
Innovator US Eqty PB Jan
Innovator US Eqty PB Jul
Innovator US Eqty PB Jun
Innovator US Eqty PB Mar
Innovator US Eqty PB May
Innovator US Eqty PB Nov
Innovator US Eqty PB Oct
Innovator US Eqty PB Sep
Innovator US Eqty UB Apr
Innovator US Eqty UB Aug
Innovator US Eqty UB Dec
Data provided by
Description
ETF
Symbols
Options Arbitrage/Opt Strat Fds
Options Arbitrage/Opt Strat Fds
Options Arbitrage/Opt Strat Fds
Global Science/Technology Fds
Options Arbitrage/Opt Strat Fds
Options Arbitrage/Opt Strat Fds
Options Arbitrage/Opt Strat Fds
Options Arbitrage/Opt Strat Fds
Options Arbitrage/Opt Strat Fds
Options Arbitrage/Opt Strat Fds
Options Arbitrage/Opt Strat Fds
Options Arbitrage/Opt Strat Fds
Global Multi-Cap Core Fds
Options Arbitrage/Opt Strat Fds
Options Arbitrage/Opt Strat Fds
Options Arbitrage/Opt Strat Fds
Options Arbitrage/Opt Strat Fds
Options Arbitrage/Opt Strat Fds
Options Arbitrage/Opt Strat Fds
Options Arbitrage/Opt Strat Fds
Options Arbitrage/Opt Strat Fds
Options Arbitrage/Opt Strat Fds
Options Arbitrage/Opt Strat Fds
Mid-Cap Growth
Mid-Cap Growth
Options Arbitrage/Opt Strat Fds
Options Arbitrage/Opt Strat Fds
Options Arbitrage/Opt Strat Fds
Options Arbitrage/Opt Strat Fds
Options Arbitrage/Opt Strat Fds
Options Arbitrage/Opt Strat Fds
Options Arbitrage/Opt Strat Fds
Options Arbitrage/Opt Strat Fds
Options Arbitrage/Opt Strat Fds
Options Arbitrage/Opt Strat Fds
Options Arbitrage/Opt Strat Fds
Options Arbitrage/Opt Strat Fds
Options Arbitrage/Opt Strat Fds
Options Arbitrage/Opt Strat Fds
Options Arbitrage/Opt Strat Fds
Options Arbitrage/Opt Strat Fds
Options Arbitrage/Opt Strat Fds
Options Arbitrage/Opt Strat Fds
Options Arbitrage/Opt Strat Fds
Options Arbitrage/Opt Strat Fds
Options Arbitrage/Opt Strat Fds
Options Arbitrage/Opt Strat Fds
Flexible Income
Options Arbitrage/Opt Strat Fds
Options Arbitrage/Opt Strat Fds
Options Arbitrage/Opt Strat Fds
Options Arbitrage/Opt Strat Fds
Options Arbitrage/Opt Strat Fds
Options Arbitrage/Opt Strat Fds
Options Arbitrage/Opt Strat Fds
Options Arbitrage/Opt Strat Fds
Options Arbitrage/Opt Strat Fds
Options Arbitrage/Opt Strat Fds
Options Arbitrage/Opt Strat Fds
Options Arbitrage/Opt Strat Fds
Options Arbitrage/Opt Strat Fds
Options Arbitrage/Opt Strat Fds
Options Arbitrage/Opt Strat Fds
Options Arbitrage/Opt Strat Fds
Options Arbitrage/Opt Strat Fds
Options Arbitrage/Opt Strat Fds
Options Arbitrage/Opt Strat Fds
Options Arbitrage/Opt Strat Fds
Options Arbitrage/Opt Strat Fds
Options Arbitrage/Opt Strat Fds
Options Arbitrage/Opt Strat Fds
Options Arbitrage/Opt Strat Fds
Options Arbitrage/Opt Strat Fds
Options Arbitrage/Opt Strat Fds
Options Arbitrage/Opt Strat Fds
Options Arbitrage/Opt Strat Fds
Options Arbitrage/Opt Strat Fds
Options Arbitrage/Opt Strat Fds
Options Arbitrage/Opt Strat Fds
Options Arbitrage/Opt Strat Fds
Options Arbitrage/Opt Strat Fds
Options Arbitrage/Opt Strat Fds
Options Arbitrage/Opt Strat Fds
Options Arbitrage/Opt Strat Fds
Options Arbitrage/Opt Strat Fds
Options Arbitrage/Opt Strat Fds
Options Arbitrage/Opt Strat Fds
Options Arbitrage/Opt Strat Fds
Options Arbitrage/Opt Strat Fds
Options Arbitrage/Opt Strat Fds
Options Arbitrage/Opt Strat Fds
Options Arbitrage/Opt Strat Fds
TBJL
BSTP
BALT
LOUP
DBJA
DSJA
EAPR
EJAN
EJUL
EOCT
TJUL
SFLR
IGTR
QTAP
QTJA
QTJL
QTOC
XDQQ
NAPR
NJAN
NJUL
NOCT
TSLH
FFTY
BOUT
IAPR
IJAN
IJUL
IOCT
ISEP
BUFB
BUFF
PSTP
APRD
JULD
OCTD
LOCT
APRH
JULH
OCTH
APRJ
JULJ
OCTJ
APRQ
JULQ
OCTQ
HOCT
EPRF
TSJA
XUSP
ZALT
EALT
XBAP
XBJA
XBJL
XBOC
XDAP
XDJA
XDJL
XDOC
XDSQ
XTAP
XTJA
XTJL
XTOC
BAPR
BAUG
BDEC
BFEB
BJAN
BJUL
BJUN
BMAR
BMAY
BNOV
BOCT
BSEP
PAPR
PAUG
PDEC
PFEB
PJAN
PJUL
PJUN
PMAR
PMAY
PNOV
POCT
PSEP
UAPR
UAUG
UDEC
NAV
20.22
28.46
28.54
43.76
29.47
29.84
25.11
28.58
23.49
23.60
25.65
27.32
24.18
32.02
21.18
27.92
25.53
26.45
44.51
41.63
55.14
45.85
25.48
24.37
33.10
25.74
30.37
27.18
27.97
26.18
27.75
40.00
28.21
24.77
24.98
24.35
24.05
24.70
24.97
24.24
24.64
24.94
24.12
24.59
24.88
24.02
24.16
18.63
29.08
30.70
26.55
27.31
30.60
25.74
30.58
27.83
30.75
24.51
30.07
27.29
29.58
30.28
24.14
29.46
26.63
38.24
35.98
38.30
36.69
40.88
37.56
35.71
39.65
33.88
34.90
38.47
36.70
32.66
33.36
35.10
32.68
37.21
36.16
33.39
35.64
31.49
34.45
36.14
34.76
27.44
30.75
32.03
Net Assets
(MIL)
82.1
42.1
596.9
40.5
5.9
2.2
62.6
356.1
104.5
47.9
221.8
104.7
188.0
21.3
26.4
18.8
13.6
41.1
135.9
76.7
271.8
160.4
2.1
84.2
12.4
228.9
129.4
208.6
116.7
44.0
65.7
348.1
82.0
8.2
5.0
4.3
12.6
26.9
25.8
17.7
48.6
27.1
22.5
29.8
8.8
7.9
9.6
105.6
4.9
15.9
36.9
14.1
76.9
73.7
86.0
68.2
6.0
5.5
9.5
4.0
82.7
11.2
14.4
17.2
19.5
156.0
231.7
102.0
104.0
162.4
360.3
108.0
92.3
115.6
109.7
187.6
178.1
602.6
953.7
592.1
466.2
612.4
1071.5
549.7
390.1
481.6
784.8
777.1
747.7
91.6
396.0
71.1
4th Qtr
Total Return
1 Year 3 Years*
9.17
7.73
2.62
22.81
3.00
4.32
4.48
4.31
4.45
5.03
5.00
7.44
11.32
7.20
2.07
12.89
10.50
9.09
6.31
2.45
8.64
7.90
1.01
9.63
10.36
6.69
9.13
7.05
6.66
7.52
9.03
6.79
5.85
3.08
4.80
4.54
3.06
2.39
3.65
3.73
1.94
2.72
2.94
1.70
2.13
2.28
3.69
7.26
6.55
14.64
3.69
6.64
5.94
4.03
7.50
6.25
8.79
6.17
10.86
8.72
7.16
7.78
4.73
10.16
8.17
9.31
9.09
9.42
9.98
11.21
9.12
8.82
9.08
9.00
6.61
8.43
9.11
6.72
7.47
8.52
7.28
6.87
7.38
6.57
6.24
6.77
4.22
6.46
7.30
6.40
7.39
8.96
4.27
18.15
7.45
50.73
17.27
23.84
8.01
5.17
2.52
6.28
N/A
21.13
-0.17
43.20
25.49
42.34
38.91
29.95
30.56
20.75
29.56
30.83
17.99
12.31
13.04
7.82
13.93
14.42
17.71
N/A
20.44
16.43
13.73
N/A
N/A
N/A
N/A
N/A
N/A
N/A
N/A
N/A
N/A
N/A
N/A
N/A
N/A
9.62
22.27
26.40
N/A
N/A
20.27
17.38
19.37
20.11
24.25
24.19
28.62
28.28
22.81
23.37
22.29
25.85
25.79
22.97
20.07
20.06
22.48
23.48
21.54
16.87
23.20
16.76
17.26
21.42
20.87
16.11
17.90
17.89
15.08
18.05
20.04
12.32
16.20
12.30
14.15
20.27
18.91
10.82
17.70
16.79
-6.21
N/A
N/A
-4.22
5.06
5.48
N/A
-1.57
-3.73
N/A
N/A
N/A
N/A
N/A
N/A
N/A
N/A
N/A
7.73
3.09
7.23
8.23
N/A
-14.93
2.60
N/A
5.88
4.19
N/A
N/A
N/A
6.44
N/A
N/A
N/A
N/A
N/A
N/A
N/A
N/A
N/A
N/A
N/A
N/A
N/A
N/A
N/A
-4.12
4.59
N/A
N/A
N/A
N/A
N/A
N/A
N/A
N/A
N/A
N/A
N/A
N/A
N/A
N/A
N/A
N/A
8.75
6.50
7.79
10.48
7.72
7.67
4.61
10.11
4.53
5.44
8.57
7.96
6.09
5.62
6.66
7.52
6.80
7.85
3.46
7.71
3.44
5.96
9.09
7.54
3.16
3.35
4.05
January 8, 2024
BARRON’S
•
L37
Funds Quarterly
ETF Score Card
For personal non-commercial use only. Do not edit or alter. Reproductions not permitted.
To reprint or license content, please contact Barron's reprints department at 800-843-0008 or www.djreprints.com
Fund
Innovator US Eqty UB Feb
Innovator US Eqty UB Jan
Innovator US Eqty UB Jul
Innovator US Eqty UB Jun
Innovator US Eqty UB Mar
Innovator US Eqty UB May
Innovator US Eqty UB Nov
Innovator US Eqty UB Oct
Innovator US Eqty UB Sep
Innovator US SC PB Apr
Innovator US SC PB Jan
Innovator US SC PB Jul
Innovator US SC PB Oct
Inspire 100 ETF
Inspire Corporate Bond
Inspire Faithward MC Mom
Inspire Fidelis Mlt Fctr
Inspire Global Hope ETF
Inspire Intl
Inspire Small/Mid Cap
Inspire Tactical Balncd
Inverse Cramer Tracker
Invesco 0-5 Yr US TIPS
Invesco AAA CLO FLRN
Invesco Active US RE
Invesco Aerospace
Invesco AG BC Users & DC
Invesco AG Crypto Econ
Invesco Agr Cmd No K-1
Invesco AI & NxtGn Sftwr
Invesco Biotech & Genome
Invesco Bloomberg MVP MF
Invesco Bloomberg PP
Invesco Blt 2024 CB
Invesco Blt 2024 HY
Invesco Blt 2024 MB
Invesco Blt 2025 CB
Invesco Blt 2025 HY
Invesco Blt 2025 MB
Invesco Blt 2026 CB
Invesco Blt 2026 HY
Invesco Blt 2026 MB
Invesco Blt 2027 CB
Invesco Blt 2027 HY
Invesco Blt 2027 MB
Invesco Blt 2028 CB
Invesco Blt 2028 HY
Invesco Blt 2028 MB
Invesco Blt 2029 CB
Invesco Blt 2029 HY
Invesco Blt 2029 MB
Invesco Blt 2030 CB
Invesco Blt 2030 HY CB
Invesco Blt 2030 MB
Invesco Blt 2031 CB
Invesco Blt 2031 HY CB
Invesco Blt 2031 MB
Invesco Blt 2032 CB
Invesco Blt 2032 MB
Invesco Blt 2033 CB
Invesco Blt 2033 MB
Invesco Building & Cons
Invesco Bybck Ach
Invesco CA AMT-Fr MB
Invesco CEF Income
Invesco China Tech
Invesco DB Cm Idx
Invesco DB MS Agri
Invesco DB MS BMtl
Invesco DB MS Engy
Invesco DB MS Oil
Invesco DB MS PMtl
Invesco DB USD Idx Bl
Invesco DB USD Idx Br
Invesco Div Achvrs
Invesco DJIA Div
Invesco Dorsey W SC Mo
Invesco Dorsey W Util Mo
Invesco Dorsey Wrght BMM
Invesco Dorsey Wrght CCM
Invesco Dorsey Wrght CSM
Invesco Dorsey Wrght DMM
Invesco Dorsey Wrght EMM
Invesco Dorsey Wright EM
Invesco Dorsey Wright FM
Invesco Dorsey Wright HM
Invesco Dorsey Wright IM
Invesco Dorsey Wright Mo
Invesco Dorsey Wright TM
Invesco EM Sov Dbt
Invesco En Explo & Prod
Invesco Eq W 0-30 Yr Trs
Description
ETF
Symbols
Options Arbitrage/Opt Strat Fds
Options Arbitrage/Opt Strat Fds
Options Arbitrage/Opt Strat Fds
Options Arbitrage/Opt Strat Fds
Options Arbitrage/Opt Strat Fds
Options Arbitrage/Opt Strat Fds
Options Arbitrage/Opt Strat Fds
Options Arbitrage/Opt Strat Fds
Options Arbitrage/Opt Strat Fds
Options Arbitrage/Opt Strat Fds
Options Arbitrage/Opt Strat Fds
Options Arbitrage/Opt Strat Fds
Options Arbitrage/Opt Strat Fds
Multi-Cap Core
Core Plus Bond
Mid-Cap Growth
Mid-Cap Core
Global Multi-Cap Value Fds
Intl Multi-Cp Core Fds
Small-Cap Core
Flexible Portfolio
Alternative Long/Short Eqty Fds
Inflation Protected Bond
Loan Participation
Real Estate
Industrials
Global Science/Technology Fds
Global Science/Technology Fds
Commodities Agriculture
Global Science/Technology Fds
Health/Biotechnology
Multi-Cap Core
Multi-Cap Value
Corporate Debt BBB-Rated
High Yield
Short-Intmdt Municipal Debt
Corporate Debt BBB-Rated
High Yield
Interm. Municipal Debt
Corporate Debt BBB-Rated
High Yield
Interm. Municipal Debt
Corporate Debt BBB-Rated
High Yield
Interm. Municipal Debt
Corporate Debt BBB-Rated
High Yield
Interm. Municipal Debt
Corporate Debt BBB-Rated
High Yield
Interm. Municipal Debt
Corporate Debt BBB-Rated
High Yield
Interm. Municipal Debt
Corporate Debt BBB-Rated
High Yield
Interm. Municipal Debt
Corporate Debt BBB-Rated
General & Insured Municipal Debt
Corporate Debt BBB-Rated
Interm. Municipal Debt
Industrials
Multi-Cap Value
California Municipal Debt
Mixed-Asset Trgt Alloc Mod Fds
Global Science/Technology Fds
Commodities General
Commodities Agriculture
Commodities Base Metals Fds
Commodities Energy
Commodities Energy
Commodities Prec Metals Fds
Alternative Currency Strategies
Specialty Fixed Income
Equity Income
Equity Income
Small-Cap Growth
Utility
Basic Materials
Consumer Services
Consumer Goods
Intl Multi-Cp Gro Fds
Emerging Markets
Natural Resources
Financial Services
Health/Biotechnology
Industrials
Multi-Cap Growth
Science & Technology
Emerging Mrkts Hard Currency Debt
Natural Resources
General U.S. Treasury
UFEB
UJAN
UJUL
UJUN
UMAR
UMAY
UNOV
UOCT
USEP
KAPR
KJAN
KJUL
KOCT
BIBL
IBD
GLRY
FDLS
BLES
WWJD
ISMD
RISN
SJIM
PBTP
ICLO
PSR
PPA
BLKC
SATO
PDBA
IGPT
PBE
BMVP
POWA
BSCO
BSJO
BSMO
BSCP
BSJP
BSMP
BSCQ
BSJQ
BSMQ
BSCR
BSJR
BSMR
BSCS
BSJS
BSMS
BSCT
BSJT
BSMT
BSCU
BSJU
BSMU
BSCV
BSJV
BSMV
BSCW
BSMW
BSCX
BSSX
PKB
PKW
PWZ
PCEF
CQQQ
DBC
DBA
DBB
DBE
DBO
DBP
UUP
UDN
PFM
DJD
DWAS
PUI
PYZ
PEZ
PSL
PIZ
PIE
PXI
PFI
PTH
PRN
PDP
PTF
PCY
PXE
GOVI
NAV
29.46
34.40
30.32
30.06
31.61
29.42
31.65
32.38
31.34
29.12
34.24
27.08
27.56
34.90
23.62
26.58
29.34
35.64
29.51
34.59
24.92
21.63
24.88
25.53
91.51
92.14
18.25
14.06
29.87
38.75
65.87
40.53
72.43
20.87
22.68
24.83
20.43
22.75
24.45
19.28
23.15
23.66
19.41
22.38
23.78
20.24
21.66
23.64
18.50
21.18
23.41
16.59
25.55
22.34
16.36
26.42
21.55
20.63
25.92
21.23
26.51
63.04
99.03
25.09
17.98
35.93
22.05
20.74
18.28
19.19
13.96
49.99
27.08
18.42
39.87
45.98
83.83
31.91
85.64
82.36
91.50
31.84
19.80
44.71
44.88
39.20
117.93
85.44
50.54
20.69
30.89
28.82
Net Assets
(MIL)
51.3
114.3
137.0
74.4
45.2
57.7
56.7
106.2
94.4
159.0
163.9
190.3
83.3
303.6
232.7
45.1
70.6
166.8
227.7
169.0
83.4
3.1
75.0
35.8
97.3
2437.6
3.0
5.3
27.8
176.0
228.6
89.6
192.9
3984.9
716.8
215.6
3200.9
1032.1
197.0
2211.7
344.3
140.7
1299.5
128.9
98.6
970.5
86.0
83.8
491.0
26.5
59.6
356.5
24.8
67.6
267.1
7.6
48.3
235.2
42.8
24.4
10.3
219.1
1026.8
795.0
680.1
702.3
2007.7
833.4
134.6
120.3
279.4
155.1
581.0
64.4
614.3
306.2
675.5
34.3
98.3
18.6
80.0
131.5
139.6
103.0
26.3
121.2
149.4
1049.5
333.1
1380.9
152.9
735.5
4th Qtr
Total Return
1 Year 3 Years*
7.08
5.58
7.37
6.30
5.95
6.38
4.37
6.19
7.20
8.76
11.42
8.30
7.44
12.20
5.60
5.73
10.96
12.36
12.77
14.30
9.71
-6.00
2.45
2.29
16.64
15.73
47.00
86.52
1.26
19.32
15.40
11.27
12.28
1.67
2.41
1.63
2.53
3.38
2.74
3.52
3.84
3.85
4.58
6.38
4.92
5.58
7.12
5.81
6.61
8.41
6.93
7.57
8.25
8.07
8.49
9.33
8.80
8.98
9.51
9.35
10.16
25.11
10.49
8.68
7.64
-0.52
-7.23
1.27
2.74
-14.81
-17.76
9.99
-3.03
5.51
9.70
12.26
12.74
8.20
9.55
27.24
10.13
10.91
6.31
-2.88
9.37
16.60
17.02
11.10
14.51
14.66
-4.13
8.60
11.97
15.60
17.78
12.27
12.53
12.54
14.31
19.08
19.06
14.84
14.32
11.72
9.21
17.94
6.43
19.54
21.41
16.42
16.54
17.28
10.08
N/A
4.52
8.90
8.28
18.39
128.34
263.82
7.94
27.76
3.67
18.83
10.63
4.95
9.43
2.86
5.01
10.88
2.97
5.71
10.26
3.48
6.27
12.31
4.22
7.41
12.73
4.78
8.27
14.11
5.36
8.11
13.72
6.10
8.59
N/A
6.53
8.85
N/A
N/A
N/A
54.80
17.35
6.96
9.46
-16.97
-6.18
7.60
0.74
-12.10
-3.95
9.11
3.59
4.83
11.33
9.26
16.82
-4.41
9.62
29.55
12.38
17.88
13.47
5.31
12.54
-4.37
37.14
20.75
33.80
17.67
7.55
3.44
4.16
4.90
4.68
2.36
4.39
2.48
3.89
6.41
4.98
2.84
5.76
1.45
2.02
4.88
-1.73
2.43
N/A
6.48
4.97
9.15
3.49
N/A
2.25
N/A
4.62
11.57
N/A
N/A
N/A
-6.55
-2.06
6.05
8.48
0.04
1.89
0.16
-0.85
3.17
-0.53
-1.59
2.19
-1.17
-1.88
1.05
-0.91
-2.17
0.09
-1.45
-2.57
N/A
-1.73
-3.72
N/A
-2.37
N/A
N/A
N/A
N/A
N/A
N/A
N/A
15.70
11.74
-1.12
1.00
-24.13
16.65
10.56
4.84
22.71
20.17
-0.03
6.22
-3.56
8.74
9.93
4.55
2.42
7.16
3.15
3.39
-0.34
-2.51
39.13
3.17
-9.72
8.92
-0.57
2.54
-4.83
48.98
-7.37
Fund
Invesco ESG NAS NG 100
Invesco ESG NASDAQ 100
Invesco ESG S&P 500 EW
Invesco EVMCS No K-1
Invesco F R DMxUSS-M
Invesco F R DvMxUS
Invesco F R Em Mkt
Invesco F R SMid
Invesco F R US 1K
Invesco Fd HY Corp
Invesco Finl Prfrd
Invesco Fltng Rt Mun Inc
Invesco Food & Beverage
Invesco Fund IG C Bd
Invesco Gl Cln En
Invesco Gl Lst Pr Eq
Invesco Gl Water
Invesco Glbl ex-US HY CB
Invesco Gldn DrgnChi
Invesco High Yld Bd Fctr
Invesco High Yld Slct
Invesco HYE Div
Invesco India
Invesco Int Dv Ach
Invesco Intl BB Achv
Invesco Intl Corp Bd
Invesco Intl Dvlp Dyn MF
Invesco Inv Grd Def
Invesco KBW Bank
Invesco KBW Hi Dv Y
Invesco KBW P&C Insr
Invesco KBW PYE REIT
Invesco KBW Reg Bank
Invesco Large Cap Growth
Invesco Large Cap Value
Invesco Leisure and Ent
Invesco MSCI Gl Tmbr
Invesco MSCI Green Bldg
Invesco MSCI Sus Fut
Invesco MSCI USA
Invesco Mun Strat Inc
Invesco NASD Intrt
Invesco NASDAQ 100
Invesco Nasdaq Biotech
Invesco NASDAQ FG 200
Invesco NASDAQ NG 100
Invesco Next Gen Conn
Invesco Nl AMT-Fr MB
Invesco NxtGn Med & Gmng
Invesco NY AMT-Fr MB
Invesco Oil & Gas Serv
Invesco OYDCS No K-1
Invesco Pharmaceuticals
Invesco PHLX Semicon
Invesco Preferred
Invesco QQQ Trust 1
Invesco RAFI Str US
Invesco Real Assets ESG
Invesco RJ SB-1 Eq
Invesco Rus 1000 EW
Invesco Russel 1000 DM
Invesco Russel 2000 DM
Invesco S&P 100 Eq Wght
Invesco S&P 500 BW
Invesco S&P 500 EW CS
Invesco S&P 500 EWRE
Invesco S&P 500 GARP
Invesco S&P 500 Qual
Invesco S&P 500 QVM MF
Invesco S&P 500 Revenue
Invesco S&P 500 VM
Invesco S&P EM LV
Invesco S&P EM Mom
Invesco S&P Gl Wtr
Invesco S&P Intl DLV
Invesco S&P Itl Dv M
Invesco S&P Itl Dv Q
Invesco S&P MC 400 GARP
Invesco S&P MC 400 QVM M
Invesco S&P MC 400 Rev
Invesco S&P MC400 PG
Invesco S&P MC400 PV
Invesco S&P MidCap Mom
Invesco S&P MidCap Qlty
Invesco S&P MidCap VM
Invesco S&P MidCp LV
Invesco S&P SC 600 QVM M
Invesco S&P SC 600 Rev
Invesco S&P SC Con D
Invesco S&P SC Con S
Invesco S&P SC Enrgy
Invesco S&P SC Finls
Data provided by
Description
ETF
Symbols
Mid-Cap Growth
Large-Cap Growth
Multi-Cap Value
Commodities Base Metals Fds
Intl Sm/Md-Cp Core Fds
Intl Multi-Cp Val Fds
Emerging Markets
Small-Cap Core
Multi-Cap Value
High Yield
Financial Services
Short Municipal Debt
Consumer Goods
Corporate Debt BBB-Rated
Alternative Energy
Global Financial Services
Specialty/Miscellaneous
Global High Yield
China Region
High Yield
High Yield
Equity Income
India Region
Intl Equity Income Fds
Intl Multi-Cp Val Fds
Intl Income
Intl Multi-Cp Core Fds
Core Plus Bond
Financial Services
Financial Services
Financial Services
Real Estate
Financial Services
Large-Cap Growth
Large-Cap Value
Consumer Services
Basic Materials
Global Small-/Mid-Cap
Industrials
Large-Cap Core
High Yield Municipal Debt
Science & Technology
Large-Cap Growth
Health/Biotechnology
Mid-Cap Core
Mid-Cap Growth
Global Science/Technology Fds
General & Insured Municipal Debt
Consumer Services
New York Municipal Debt
Natural Resources
Commodities General
Health/Biotechnology
Science & Technology
Flexible Income
Large-Cap Growth
Multi-Cap Value
Real Return
Mid-Cap Core
Mid-Cap Core
Multi-Cap Core
Small-Cap Core
Large-Cap Value
Alternative Long/Short Eqty Fds
Telecommunication
Real Estate
Multi-Cap Core
Large-Cap Core
Large-Cap Core
Multi-Cap Value
Multi-Cap Value
Emerging Markets
Emerging Markets
Specialty/Miscellaneous
Intl Multi-Cp Val Fds
Intl Large-Cp Gro Fds
Intl Large-Cp Gro Fds
Small-Cap Core
Small-Cap Core
Small-Cap Core
Small-Cap Growth
Small-Cap Value
Small-Cap Core
Small-Cap Growth
Small-Cap Core
Small-Cap Core
Small-Cap Core
Small-Cap Core
Consumer Services
Consumer Goods
Natural Resources
Financial Services
QQJG
QQMG
RSPE
EVMT
PDN
PXF
PXH
PRFZ
PRF
PHB
PGF
PVI
PBJ
PFIG
PBD
PSP
PIO
PGHY
PGJ
IHYF
HIYS
PEY
PIN
PID
IPKW
PICB
IMFL
IIGD
KBWB
KBWD
KBWP
KBWY
KBWR
PWB
PWV
PEJ
CUT
GBLD
ERTH
PBUS
IMSI
PNQI
QQQM
IBBQ
QQQS
QQQJ
KNCT
PZA
GGME
PZT
PXJ
PDBC
PJP
SOXQ
PGX
QQQ
IUS
IVRA
RYJ
EQAL
OMFL
OMFS
EQWL
PBP
RSPC
RSPR
SPGP
SPHQ
QVML
RWL
SPVM
EELV
EEMO
CGW
IDLV
IDMO
IDHQ
GRPM
QVMM
RWK
RFG
RFV
XMMO
XMHQ
XMVM
XMLV
QVMS
RWJ
PSCD
PSCC
PSCE
PSCF
NAV
Net Assets
(MIL)
20.82
3.4
27.91
22.6
24.26
9.1
16.88
9.7
32.62
504.5
47.51
1609.8
19.12
1163.9
37.46
2057.8
35.18
6255.4
18.14
540.6
14.57
935.2
24.80
38.5
45.89
185.7
23.66
41.6
16.06
139.4
62.27
203.8
39.69
264.8
19.62
134.2
26.02
163.3
22.30
45.3
25.42
9.9
21.14
1241.4
25.52
182.3
18.49
959.4
37.51
76.0
22.99
123.0
25.17
250.8
24.26
63.2
49.19
1374.6
15.85
350.6
90.45
189.7
20.17
207.5
54.75
56.5
77.63
701.9
50.75
773.1
41.93
298.7
32.16
53.6
17.48
5.7
47.41
220.7
47.67
3617.1
50.79
29.9
36.05
625.9
168.48
17036.8
21.87
16.3
26.27
5.6
26.98
644.2
89.52
39.9
24.08
2488.2
38.75
32.1
23.16
90.2
28.67
77.2
13.31
5470.1
76.07
249.3
32.88
161.0
11.46
4458.5
409.34 217642.2
43.27
252.0
14.18
3.1
61.82
114.4
44.10
598.9
51.38
4951.2
38.82
352.9
87.57
388.3
21.67
95.3
29.27
60.9
33.26
88.3
98.00
4030.6
54.05
6498.5
27.84
861.9
85.24
2233.7
50.74
35.2
24.18
741.4
15.19
5.1
53.06
922.3
28.24
531.6
36.82
76.1
28.56
204.9
98.41
202.1
25.62
259.5
104.96
566.5
41.25
245.9
116.29
261.6
89.41
1071.7
88.65
2054.4
50.32
179.3
53.15
841.3
25.01
195.1
41.45
1328.9
103.70
30.7
38.41
78.2
52.04
221.1
49.10
19.0
4th Qtr
Total Return
1 Year 3 Years*
10.74
14.91
12.06
-7.34
10.56
9.46
7.40
13.91
11.09
7.53
5.67
0.70
8.72
5.70
4.91
21.49
17.51
5.56
-2.18
6.87
6.12
12.00
10.43
11.26
7.28
10.74
9.60
4.50
23.82
7.51
8.02
18.08
25.68
14.64
9.01
9.36
8.80
16.14
6.81
11.96
5.92
17.65
14.56
10.75
11.52
9.60
17.47
9.36
19.09
9.92
-6.41
-7.23
5.36
21.89
6.43
14.52
9.19
15.17
12.46
11.18
12.40
14.79
12.05
4.08
10.21
17.35
7.93
8.47
11.73
9.72
7.61
8.12
8.32
15.76
8.48
11.30
10.46
12.93
11.40
12.27
5.56
18.39
11.29
10.40
10.40
8.51
15.10
14.27
22.47
10.92
-8.15
19.14
17.13
55.37
13.97
-27.28
13.33
18.89
13.06
20.03
15.63
11.45
7.80
2.80
2.34
6.72
-10.72
36.96
21.13
10.35
-2.46
13.71
11.43
7.36
22.59
14.70
15.00
11.75
24.94
5.65
-1.17
19.95
7.05
12.75
-0.66
30.44
10.34
15.68
9.18
5.66
-0.23
27.08
6.34
60.58
54.92
4.49
-2.11
13.53
27.59
7.76
24.00
7.82
14.42
-6.04
-2.22
66.66
9.33
54.76
20.81
9.44
15.63
12.07
21.43
15.27
19.46
11.29
17.61
11.49
20.29
24.74
22.42
17.19
5.49
9.54
13.82
15.40
9.19
21.06
18.98
18.86
15.42
23.74
16.31
29.98
19.89
29.57
16.33
1.70
16.62
16.41
33.11
14.87
4.93
5.63
N/A
N/A
N/A
N/A
0.65
7.53
1.58
8.90
11.84
1.66
-3.74
1.15
10.21
-1.85
-21.07
3.17
5.45
2.07
-24.97
1.54
N/A
11.51
11.19
10.09
3.75
-7.02
N/A
-1.15
2.19
8.62
12.43
6.24
7.85
5.01
12.05
2.00
0.73
N/A
-9.41
9.10
N/A
-7.57
10.04
N/A
N/A
-3.63
3.08
-1.30
-4.42
-1.30
27.32
16.74
3.11
N/A
-3.75
9.95
13.40
10.20
7.63
6.09
10.48
7.08
10.74
5.60
-1.47
7.67
12.01
10.38
N/A
12.82
10.01
6.57
-4.45
5.87
1.70
6.36
1.86
9.92
N/A
15.19
1.23
18.50
5.54
11.13
13.02
5.39
N/A
16.57
9.66
11.27
35.48
3.00
L38
BARRON’S
•
Funds Quarterly
January 8, 2024
ETF Score Card
For personal non-commercial use only. Do not edit or alter. Reproductions not permitted.
To reprint or license content, please contact Barron's reprints department at 800-843-0008 or www.djreprints.com
Fund
Invesco S&P SC H Cre
Invesco S&P SC HD LV
Invesco S&P SC Indls
Invesco S&P SC Info
Invesco S&P SC Matls
Invesco S&P SC Util & CS
Invesco S&P SC600 PG
Invesco S&P SC600 PV
Invesco S&P SmallCap Mom
Invesco S&P SmallCap VM
Invesco S&P SmCp LV
Invesco S&P SmCp Qlt
Invesco S&P Spin-Off
Invesco S&P Ultra Dv Rev
Invesco S&P500 DHP
Invesco S&P500 ERSLV
Invesco S&P500 EV
Invesco S&P500 EW CD
Invesco S&P500 EW CS
Invesco S&P500 EW En
Invesco S&P500 EW Fn
Invesco S&P500 EW HC
Invesco S&P500 EW In
Invesco S&P500 EW Mt
Invesco S&P500 EW Tc
Invesco S&P500 EW Ut
Invesco S&P500 EWght
Invesco S&P500 HD LV
Invesco S&P500 Hi Be
Invesco S&P500 LowVl
Invesco S&P500 Momnt
Invesco S&P500 MV
Invesco S&P500 Pr Gr
Invesco S&P500 Pre V
Invesco S&P500 Top50
Invesco Semiconductors
Invesco Senior Loan
Invesco Short Term Treas
Invesco Shrt Dur Bd
Invesco Solar
Invesco Tot Rtn Bd
Invesco Txb Muni Bd
Invesco Ultr Sh Dur
Invesco Var Rt Pref
Invesco VR Inv Gd
Invesco Water Res
Invesco WldHill CE
Invesco Zacks MA Inc
Invesco Zacks Mid-Cap
Invesco:AU Dollar
Invesco:Canadian Dollar
Invesco:Euro
Invesco:GBP Sterling
Invesco:Japanese Yen
Invesco:Swiss Franc
iPath Bloomberg Agri A
iPath Bloomberg Alum A
iPath Bloomberg CITR A
iPath Bloomberg Coffee A
iPath Bloomberg Copper A
iPath Bloomberg Cotton A
iPath Bloomberg Energy A
iPath Bloomberg Grains A
iPath Bloomberg IndMtl A
iPath Bloomberg Lvstk A
iPath Bloomberg Nickel A
iPath Bloomberg Plat A
iPath Bloomberg PrMtl A
iPath Bloomberg Softs A
iPath Bloomberg Sugar A
iPath Bloomberg Tin A
iPath ETN As&Glf Cr A
iPath ETN Carbon B
iPath ETN GEMS Asia 8 A
iPath ETN GEMS Str Idx A
iPath ETN Glbl Carbon A
iPath ETN Op Cur Carry A
iPath ETN SP500 VIX MT B
iPath ETN SP500 VIX ST B
IQ:CBRE Real Assets
IQ:MacKay Cal Muni Intmd
IQ:MacKay ESG Core+Bond
IQ:MacKay ESG High Inc
IQ:MacKay Muni Insd
IQ:MacKay Muni Intmd
IQ:Ultra Short Duration
IQ:Winslow Focused LC Gr
IQ:Winslow Large Cap Gro
iShares Gold Trust Micro
iShares MSCI Pr & Gl Exp
iShares:0-3 Month Trs Bd
iShares:0-5 HY Corp Bd
Description
ETF
Symbols
Health/Biotechnology
Equity Income
Industrials
Science & Technology
Basic Materials
Utility
Small-Cap Growth
Small-Cap Value
Small-Cap Core
Small-Cap Value
Small-Cap Core
Small-Cap Core
Mid-Cap Core
Equity Income
Absolute Return
Multi-Cap Value
Multi-Cap Value
Consumer Services
Consumer Goods
Natural Resources
Financial Services
Health/Biotechnology
Industrials
Basic Materials
Science & Technology
Utility
Multi-Cap Value
Equity Income
Multi-Cap Core
Multi-Cap Value
Large-Cap Core
Large-Cap Core
Multi-Cap Growth
Multi-Cap Value
Large-Cap Core
Science & Technology
Loan Participation
Short U.S. Treasury
Short Inv. Grade Debt
Alternative Energy
Core Bond
General Bond
Ultra-Short Obligations
Equity Income
Ultra-Short Obligations
Specialty/Miscellaneous
Alternative Energy
Mid-Cap Value
Mid-Cap Core
Alternative Currency Strategies
Alternative Currency Strategies
Alternative Currency Strategies
Alternative Currency Strategies
Alternative Currency Strategies
Alternative Currency Strategies
Commodities Agriculture
Commodities Base Metals Fds
Commodities General
Commodities Agriculture
Commodities Base Metals Fds
Commodities Agriculture
Commodities Energy
Commodities Agriculture
Commodities Base Metals Fds
Commodities Agriculture
Commodities Base Metals Fds
Commodities Prec Metals Fds
Commodities Prec Metals Fds
Commodities Agriculture
Commodities Agriculture
Commodities Base Metals Fds
Alternative Currency Strategies
Commodities Energy
Alternative Currency Strategies
Alternative Currency Strategies
Commodities Energy
Alternative Currency Strategies
Specialty/Miscellaneous
Specialty/Miscellaneous
Real Return
California Municipal Debt
Core Plus Bond
High Yield
General & Insured Municipal Debt
Interm. Municipal Debt
Ultra-Short Obligations
Large-Cap Growth
Large-Cap Growth
Commodities Prec Metals Fds
Latin American
Short U.S. Treasury
High Yield
PSCH
XSHD
PSCI
PSCT
PSCM
PSCU
RZG
RZV
XSMO
XSVM
XSLV
XSHQ
CSD
RDIV
PHDG
XRLV
SPVU
RSPD
RSPS
RSPG
RSPF
RSPH
RSPN
RSPM
RSPT
RSPU
RSP
SPHD
SPHB
SPLV
SPMO
SPMV
RPG
RPV
XLG
PSI
BKLN
TBLL
ISDB
TAN
GTO
BAB
GSY
VRP
VRIG
PHO
PBW
CVY
CZA
FXA
FXC
FXE
FXB
FXY
FXF
DJP
GRN
VXZ
VXX
IQRA
MMCA
ESGB
IQHI
MMIN
MMIT
ULTR
IWFG
IWLG
IAUM
EPU
SGOV
SHYG
NAV
42.85
16.44
115.88
48.18
73.83
54.14
45.53
107.22
56.56
54.22
44.15
39.83
64.48
43.65
34.16
47.43
44.21
47.54
31.42
73.69
58.60
29.79
43.07
33.64
32.63
54.54
157.77
42.43
82.41
62.64
65.45
39.26
32.24
82.04
37.70
49.48
21.17
105.57
24.94
53.46
47.22
26.88
49.86
23.04
24.97
60.87
29.71
23.70
93.82
67.62
74.26
102.11
122.78
65.78
105.72
44.97
18.20
30.42
18.61
43.81
65.39
5.22
33.59
34.21
17.79
19.90
19.90
83.84
43.87
42.39
79.62
48.17
30.81
37.34
17.46
107.22
40.23
14.46
15.54
25.17
21.78
21.06
26.54
24.51
24.52
47.89
35.85
36.42
20.59
34.45
100.26
42.26
Net Assets
(MIL)
205.3
20.7
140.3
296.3
15.8
16.5
90.1
223.9
190.2
625.8
382.6
82.7
51.5
703.0
135.4
45.6
84.6
394.7
541.1
604.4
250.4
896.0
589.3
284.5
3267.5
271.8
42667.9
2929.7
483.8
8246.6
251.8
8.1
1699.8
1608.9
2962.3
610.0
5155.8
1548.2
9.9
1301.8
1109.2
1508.9
1844.5
1436.2
769.2
1831.4
440.9
100.0
185.3
75.6
72.2
216.9
91.5
266.7
194.4
4.4
0.3
583.7
13.9
10.8
2.0
0.3
13.1
1.8
1.5
1.9
1.4
1.2
0.4
7.8
0.4
0.1
37.1
0.1
0.1
5.0
0.3
39.8
298.3
4.7
33.1
221.3
85.2
428.8
604.4
16.7
7.2
22.5
960.1
90.3
17364.7
4796.6
4th Qtr
Total Return
1 Year 3 Years*
14.01
12.40
16.74
10.17
15.22
10.28
13.42
18.17
16.85
12.94
12.83
12.19
15.70
18.43
10.24
7.12
10.09
13.29
5.52
-3.14
16.21
8.84
12.83
9.07
16.07
9.28
11.81
9.67
17.78
7.29
14.59
9.39
7.38
12.16
11.30
15.70
2.97
1.44
3.30
2.96
6.96
7.63
2.00
5.16
1.81
14.65
-4.72
9.42
11.67
6.08
3.13
4.94
5.28
5.70
8.71
-0.55
0.56
-5.51
41.34
4.64
-9.74
-23.65
0.85
-0.03
-10.72
-12.86
12.49
11.34
-0.59
-23.54
6.85
1.32
-5.19
3.16
6.67
-5.37
-3.22
-13.54
-33.37
13.85
6.21
7.27
7.14
8.70
5.73
1.89
16.24
17.89
10.24
16.26
1.36
5.27
-2.62
2.90
31.47
20.70
19.75
2.20
19.12
22.90
21.44
20.23
1.16
23.92
23.77
4.53
8.38
0.09
11.59
22.54
-5.36
4.47
6.38
3.94
22.14
8.28
35.19
-3.51
13.65
1.37
33.25
0.47
17.59
10.20
7.94
7.90
38.05
48.82
11.62
4.97
5.63
-26.85
5.89
8.46
5.99
10.43
7.28
18.92
-20.06
17.27
7.02
1.72
4.96
5.27
8.97
-6.96
9.66
-5.74
-2.11
-9.74
29.76
4.39
0.76
-28.25
-15.28
-10.82
-3.13
-48.15
-5.73
9.74
19.99
21.15
6.28
2.58
-4.61
-4.69
12.07
-4.80
2.30
-44.17
-72.47
N/A
5.80
7.22
12.95
6.98
5.30
5.42
38.34
43.20
13.72
25.94
5.13
10.96
-8.83
-0.68
14.25
5.74
9.87
2.22
0.78
18.71
6.98
17.58
4.93
9.40
5.89
13.08
2.42
6.66
12.61
6.23
3.73
37.54
9.05
5.08
12.02
8.57
9.44
5.62
9.13
8.39
14.18
5.87
8.83
6.94
0.41
12.68
10.93
12.73
4.02
2.00
N/A
-19.47
-3.46
-4.10
1.97
1.47
3.05
9.93
-32.20
10.19
8.65
-3.85
-0.49
-3.36
-1.40
-10.40
0.85
12.38
5.00
11.64
19.89
4.36
10.44
25.69
7.54
4.53
4.50
-0.37
-2.10
0.34
19.73
20.02
16.65
0.43
33.53
1.06
1.45
34.65
3.00
-22.23
-61.33
N/A
N/A
N/A
N/A
-1.10
-0.30
1.94
N/A
N/A
N/A
4.01
2.22
3.45
Fund
iShares:0-5 IG Corp Bd
iShares:0-5 TIPS Bd ETF
iShares:10+ IG Corp Bd
iShares:10-20 Trs Bd ETF
iShares:1-3 Itl Trs Bd
iShares:1-3 Trs Bd ETF
iShares:1-5 IG Corp Bd
iShares:20+ Trs Bd ETF
iShares:20+Yr Tr B BW St
iShares:25+ Trs STRIPS B
iShares:3-7 Trs Bd ETF
iShares:5-10 IG Corp Bd
iShares:7-10 Trs Bd ETF
iShares:Aaa - A Rated Co
iShares:Agency Bd ETF
iShares:Asia 50
iShares:Asia/Pac Div
iShares:BB Rated Corp Bd
iShares:BBB Rated Crp Bd
iShares:Biotechnology
iShares:Blckchn & Tech
iShares:Blm RS Comm Str
iShares:BR Sh Dur Bd
iShares:BR Sh Mat Mu Bd
iShares:BR Ultra ST Bd
iShares:Brd USD HY Cp Bd
iShares:Brd USD IG Cp Bd
iShares:Brkthrgh Env Sol
iShares:C&S REIT ETF
iShares:CA Muni Bond
iShares:CH MSCI ACWI xUS
iShares:China Large Cp
iShares:Clmt CT MSCI USA
iShares:CMBS ETF
iShares:Comdty CC Strat
iShares:Convertible Bond
iShares:Copper and Mt Mn
iShares:Core 10+Y USD Bd
iShares:Core 1-5Y USD Bd
iShares:Core 5-10Y USD B
iShares:Core Aggr Alloc
iShares:Core Consv Alloc
iShares:Core Div Growth
iShares:Core Growth All
iShares:Core High Div
iShares:Core Intl Agg Bd
iShares:Core Modt Alloc
iShares:Core MSCI EAFE
iShares:Core MSCI EmMkts
iShares:Core MSCI Europe
iShares:Core MSCI Pac
iShares:Core MSCI TIS
iShares:Core S&P 500
iShares:Core S&P Md-Cp
iShares:Core S&P Sm-Cp
iShares:Core S&P Tot USM
iShares:Core S&P US Gr
iShares:Core S&P US Val
iShares:Core Tot USD Bd
iShares:Core US Agg Bd
iShares:Core US REIT
iShares:Cr MSCI Intl DM
iShares:Curr Hgd EAFE
iShares:Curr Hgd EAFE SC
iShares:Curr Hgd Em Mkts
iShares:Curr Hgd Euro
iShares:Curr Hgd Germany
iShares:Curr Hgd Japan
iShares:Cybersec & Tech
iShares:DJ US ETF
iShares:EM Eqty Fctr
iShares:Em Fd & AgTch MS
iShares:Em Mkt Infr
iShares:Em Mkts Div
iShares:Env Aware RE
iShares:Env Infra & Ind
iShares:ESG A 1-5Yr CB
iShares:ESG A MSCI EAFE
iShares:ESG A MSCI EM
iShares:ESG A MSCI USA
iShares:ESG A MSCI USA G
iShares:ESG A MSCI USA S
iShares:ESG A MSCI USA V
iShares:ESG A USD CB
iShares:ESG Adv HY Cp Bd
iShares:ESG Adv IG Cp Bd
iShares:ESG Adv MSCI EAF
iShares:ESG Adv MSCI EM
iShares:ESG Adv MSCI USA
iShares:ESG Adv USD Bd
iShares:ESG Aware Agg Al
iShares:ESG Aware Csv Al
Data provided by
Description
ETF
Symbols
Short-Intmdt Inv. Grade Debt
Inflation Protected Bond
Corporate Debt BBB-Rated
General U.S. Treasury
Intl Income
Short U.S. Treasury
Short-Intmdt Inv. Grade Debt
General U.S. Treasury
Specialty Fixed Income
General U.S. Treasury
General U.S. Treasury
Core Bond
General U.S. Treasury
Corporate Debt A Rated
General U.S. Government
Pacific Ex Japan
Intl Equity Income Fds
Corporate Debt BBB-Rated
Corporate Debt BBB-Rated
Health/Biotechnology
Global Science/Technology Fds
Commodities General
Short Inv. Grade Debt
Short Municipal Debt
Ultra-Short Obligations
High Yield
Corporate Debt BBB-Rated
Alternative Energy
Real Estate
California Municipal Debt
Intl Large-Cp Gro Fds
China Region
Large-Cap Core
U.S. Mortgage
Commodities General
Convertible Securities
Basic Materials
General Bond
Short-Intmdt Inv. Grade Debt
Core Bond
Mixed-Asset Trgt All Agg Gr Fds
Mixed-Asset Trgt Alloc Con Fds
Equity Income
Mixed-Asset Trgt Alloc Gro Fds
Equity Income
Intl Income
Mixed-Asset Trgt Alloc Mod Fds
Intl Multi-Cp Core Fds
Emerging Markets
European Region
Pacific Region
Intl Multi-Cp Core Fds
S&P 500 Index
S&P Midcap 400 Index
Small-Cap Core
Multi-Cap Core
Large-Cap Growth
Multi-Cap Value
General Bond
Core Bond
Real Estate
Intl Multi-Cp Core Fds
Intl Large-Cp Core Fds
Intl Sm/Md-Cp Gro Fds
Emerging Markets
European Region
European Region
Japanese
Global Science/Technology Fds
Large-Cap Core
Emerging Markets
Global Multi-Cap Value Fds
Global Infrastructure
Intl Equity Income Fds
Global Real Estate
Global Infrastructure
Short-Intmdt Inv. Grade Debt
Intl Large-Cp Core Fds
Emerging Markets
Large-Cap Core
Large-Cap Growth
Small-Cap Core
Multi-Cap Value
Core Bond
High Yield
Corporate Debt BBB-Rated
Intl Multi-Cp Gro Fds
Emerging Markets
Multi-Cap Core
General Bond
Mixed-Asset Trgt All Agg Gr Fds
Mixed-Asset Trgt Alloc Con Fds
SLQD
STIP
IGLB
TLH
ISHG
SHY
IGSB
TLT
TLTW
GOVZ
IEI
IGIB
IEF
QLTA
AGZ
AIA
DVYA
HYBB
LQDB
IBB
IBLC
CMDY
NEAR
MEAR
ICSH
USHY
USIG
ETEC
ICF
CMF
HAWX
FXI
USCL
CMBS
CCRV
ICVT
ICOP
ILTB
ISTB
IMTB
AOA
AOK
DGRO
AOR
HDV
IAGG
AOM
IEFA
IEMG
IEUR
IPAC
IXUS
IVV
IJH
IJR
ITOT
IUSG
IUSV
IUSB
AGG
USRT
IDEV
HEFA
HSCZ
HEEM
HEZU
HEWG
HEWJ
IHAK
IYY
EMGF
IVEG
EMIF
DVYE
ERET
EFRA
SUSB
ESGD
ESGE
ESGU
EGUS
ESML
EVUS
SUSC
HYXF
ELQD
DMXF
EMXF
USXF
EUSB
EAOA
EAOK
NAV
Net Assets
(MIL)
49.15
2231.7
98.52
8909.1
52.55
2011.4
108.01
7085.8
72.05
77.0
82.00
26299.8
51.20
21297.0
98.77
45871.0
27.44
819.1
12.23
162.6
117.03
12708.7
51.90
11571.8
96.31
27996.7
48.08
1032.9
108.34
673.9
58.14
1425.4
35.87
39.6
46.03
279.4
86.40
29.3
135.81
6518.8
29.27
10.1
47.04
284.0
50.47
3082.5
50.00
618.2
50.35
6162.0
36.39
10604.6
51.17
9650.7
23.36
3.6
58.70
1998.2
57.86
2639.0
28.96
183.0
23.92
4675.5
56.05
2552.0
46.72
367.5
19.81
28.2
78.44
1503.1
25.62
4.7
52.50
521.1
47.52
4092.8
43.46
155.6
69.08
1762.6
36.16
677.3
53.80
24337.0
53.19
2038.2
102.00
10064.7
49.74
4954.0
41.51
1387.2
70.28 101193.1
50.56
71876.2
55.05
4128.0
59.56
1738.0
64.87
32304.2
477.38 378410.5
277.21
71969.3
108.26
67601.9
105.17
46471.8
104.03
14245.0
84.32
14526.5
46.04
22429.4
99.20
95596.6
54.25
2049.9
63.61
11378.5
31.50
3727.7
29.28
103.4
24.57
128.8
33.29
329.2
32.27
32.9
34.90
228.3
45.35
679.5
116.42
1653.6
42.73
576.3
19.46
5.5
21.72
20.7
26.57
642.2
26.00
8.7
29.15
4.4
24.46
854.1
75.48
7246.4
32.12
4010.3
104.88
12761.7
33.65
5.2
38.04
1311.2
25.70
3.9
23.23
1130.3
45.59
115.0
82.89
12.0
63.94
529.9
35.38
65.9
39.78
770.2
43.22
549.2
32.06
24.7
24.88
7.2
4th Qtr
Total Return
1 Year 3 Years*
3.54
2.52
13.25
11.28
6.70
2.48
3.98
12.90
2.20
18.81
4.44
8.10
6.36
8.02
3.63
6.33
14.00
7.40
8.30
11.13
84.45
-4.16
3.10
1.60
1.73
7.15
7.94
8.20
18.14
6.80
6.39
-7.77
11.28
4.99
-5.22
6.79
9.79
13.10
3.68
7.32
10.18
7.92
9.39
9.26
4.19
5.93
8.36
10.95
7.90
12.02
9.27
10.03
11.68
11.66
15.10
12.15
10.08
13.61
6.73
6.69
16.19
10.93
6.06
6.55
5.90
9.12
9.50
3.48
17.91
11.95
9.09
5.88
6.64
14.58
15.28
13.24
4.02
10.66
7.68
12.08
14.21
13.55
9.85
8.39
7.81
9.77
13.49
6.25
15.39
6.64
10.43
8.07
5.99
4.59
11.22
3.97
3.93
4.15
6.42
2.96
0.75
0.98
4.42
9.17
3.58
7.58
5.18
4.84
13.96
11.43
9.19
3.62
201.77
-9.09
7.33
3.96
5.59
13.50
8.70
N/A
10.38
5.59
17.06
-12.87
N/A
4.93
6.57
15.29
N/A
7.93
5.55
6.16
18.28
10.84
10.43
15.24
1.77
8.37
12.29
17.63
11.30
19.83
14.33
15.62
26.26
16.42
16.03
26.10
29.27
21.77
6.20
5.59
13.62
17.28
20.44
17.04
9.64
22.89
23.35
36.20
37.43
26.34
10.72
-2.46
7.82
20.65
10.21
13.88
6.06
18.08
9.41
25.72
N/A
17.31
N/A
8.48
12.47
8.99
20.75
6.78
31.61
5.86
18.36
10.23
0.28
2.35
-6.69
-9.80
-4.95
-0.21
-0.05
-12.38
N/A
-17.44
-2.73
-2.64
-5.30
-3.78
-1.36
-10.77
5.15
1.22
N/A
-3.30
N/A
9.66
2.62
1.37
2.21
1.89
-3.19
N/A
5.51
-0.76
6.63
-18.19
N/A
-2.86
19.20
-3.11
N/A
-8.28
-0.50
-3.00
4.59
-0.05
8.80
2.75
9.16
-1.67
0.89
3.57
-3.95
5.29
0.70
1.63
9.97
8.05
7.20
8.44
6.48
12.98
-3.02
-3.36
7.12
3.99
11.06
6.91
-3.54
11.15
6.55
13.86
4.31
8.67
-0.51
N/A
-1.05
-2.47
N/A
N/A
-0.26
3.87
-6.17
8.34
N/A
5.03
N/A
-3.52
0.64
N/A
2.68
-3.44
9.69
-3.09
3.69
-0.74
January 8, 2024
BARRON’S
•
L39
Funds Quarterly
ETF Score Card
For personal non-commercial use only. Do not edit or alter. Reproductions not permitted.
To reprint or license content, please contact Barron's reprints department at 800-843-0008 or www.djreprints.com
Fund
iShares:ESG Aware Gro Al
iShares:ESG Aware Mod Al
iShares:ESG MSCI EM Ldrs
iShares:ESG MSCI USA Ldr
iShares:ESG MSCI USA MVF
iShares:ESG Scrn S&P 500
iShares:ESG Scrn S&P MC
iShares:ESG Scrn S&P SC
iShares:ESG US Aggr Bd
iShares:Europe
iShares:Exp Tech ETF
iShares:Exp Tech Sector
iShares:Expand Tch-Sftwr
iShares:Factors US Gr
iShares:Fall Ang USD Bd
iShares:Floating Rt Bond
iShares:Focused Val Fctr
iShares:Frtr & S EM
iShares:Ftr Cld 5G & Tch
iShares:Future Meta T&C
iShares:Gen Immu & HC
iShares:Gl Cl Energy
iShares:Gl Timber
iShares:Glbl 100
iShares:Glbl Comm Svcs
iShares:Glbl Con Disc
iShares:Glbl Con Staples
iShares:Glbl Energy
iShares:Glbl Financials
iShares:Glbl HealthCare
iShares:Glbl Industrials
iShares:Glbl Infra
iShares:Glbl Materials
iShares:Glbl Tech
iShares:Glbl Utilities
iShares:Global Eqty Fctr
iShares:Global REIT ETF
iShares:GNMA Bond
iShares:Gold Strategy
IShares:Gold Trust
iShares:GSCI Comm Dyn RS
iShares:Gvt/Crd Bd ETF
iShares:HY Bond Factor
iShares:HY Corp Bd BW St
iShares:iBd 2024T HY&Inc
iShares:iBd 2025T HY&Inc
iShares:iBd 2026T HY&Inc
iShares:iBd 2027T HY&Inc
iShares:iBd 2028T HY&Inc
iShares:iBd 2029T HY&Inc
iShares:iBd 2030T HY&Inc
iShares:iBd D2024T Trs
iShares:iBd D2025T Trs
iShares:iBd D2026T Trs
iShares:iBd D2027T Trs
iShares:iBd D2028T Trs
iShares:iBd D2029T Trs
iShares:iBd D2030T Trs
iShares:iBd D2031T Trs
iShares:iBd D2032T Trs
iShares:iBd Dc2032T Crp
iShares:iBd Dec2024T Crp
iShares:iBd Dec2024T MB
iShares:iBd Dec2025T Crp
iShares:iBd Dec2025T MB
iShares:iBd Dec2026T Crp
iShares:iBd Dec2026T MB
iShares:iBd Dec2027T Crp
iShares:iBd Dec2027T MB
iShares:iBd Dec2028T Crp
iShares:iBd Dec2028T MB
iShares:iBd Dec2029T Crp
iShares:iBd Dec2029T MB
iShares:iBd Dec2030T Crp
iShares:iBd Dec2031T Crp
iShares:iBd Dec2033T Crp
iShares:iBd Dec2033T Trs
iShares:iBd O2024T TIPS
iShares:iBd O2025T TIPS
iShares:iBd O2026T TIPS
iShares:iBd O2027T TIPS
iShares:iBd O2028T TIPS
iShares:iBd O2029T TIPS
iShares:iBd O2030T TIPS
iShares:iBd O2031T TIPS
iShares:iBd O2032T TIPS
iShares:iBd O2033T TIPS
iShares:iBoxx $HY Corp
iShares:iBoxx $IG Corp
iShares:IG Bond Factor
iShares:IG Cp Bd BW Str
iShares:India 50
Description
ETF
Symbols
Mixed-Asset Trgt Alloc Gro Fds
Mixed-Asset Trgt Alloc Mod Fds
Emerging Markets
Large-Cap Core
Multi-Cap Core
Large-Cap Core
Small-Cap Core
Small-Cap Core
Core Bond
European Region
Global Science/Technology Fds
Science & Technology
Science & Technology
Multi-Cap Growth
High Yield
Ultra-Short Obligations
Mid-Cap Value
Frontier Markets
Global Science/Technology Fds
Global Science/Technology Fds
Global Health/Biotechnology Fds
Alternative Energy
Basic Materials
Global Large-Cap Core Fds
Telecommunication
Consumer Services
Consumer Goods
Global Natural Resources
Global Financial Services
Global Health/Biotechnology Fds
Industrials
Global Infrastructure
Basic Materials
Global Science/Technology Fds
Utility
Global Multi-Cap Value Fds
Global Real Estate
GNMA
Precious Metals Equity
Commodities Prec Metals Fds
Commodities General
Corporate Debt BBB-Rated
High Yield
Specialty Fixed Income
High Yield
High Yield
High Yield
High Yield
High Yield
High Yield
High Yield
General U.S. Treasury
General U.S. Treasury
General U.S. Treasury
General U.S. Treasury
General U.S. Treasury
General U.S. Treasury
General U.S. Treasury
General U.S. Treasury
General U.S. Treasury
Corporate Debt BBB-Rated
Corporate Debt BBB-Rated
Interm. Municipal Debt
Corporate Debt BBB-Rated
Interm. Municipal Debt
Corporate Debt BBB-Rated
Interm. Municipal Debt
Corporate Debt BBB-Rated
Interm. Municipal Debt
Corporate Debt BBB-Rated
Interm. Municipal Debt
Corporate Debt BBB-Rated
Interm. Municipal Debt
Corporate Debt BBB-Rated
Corporate Debt BBB-Rated
Corporate Debt BBB-Rated
General U.S. Treasury
Inflation Protected Bond
Inflation Protected Bond
Inflation Protected Bond
Inflation Protected Bond
Inflation Protected Bond
Inflation Protected Bond
Inflation Protected Bond
Inflation Protected Bond
Inflation Protected Bond
Inflation Protected Bond
High Yield
Corporate Debt BBB-Rated
Core Plus Bond
Specialty Fixed Income
India Region
EAOR
EAOM
LDEM
SUSL
ESMV
XVV
XJH
XJR
EAGG
IEV
XT
IGM
IGV
STLG
FALN
FLOT
FOVL
FM
IDAT
IVRS
IDNA
ICLN
WOOD
IOO
IXP
RXI
KXI
IXC
IXG
IXJ
EXI
IGF
MXI
IXN
JXI
GLOF
REET
GNMA
IAUF
IAU
COMT
GBF
HYDB
HYGW
IBHD
IBHE
IBHF
IBHG
IBHH
IBHI
IBHJ
IBTE
IBTF
IBTG
IBTH
IBTI
IBTJ
IBTK
IBTL
IBTM
IBDX
IBDP
IBMM
IBDQ
IBMN
IBDR
IBMO
IBDS
IBMP
IBDT
IBMQ
IBDU
IBMR
IBDV
IBDW
IBDY
IBTO
IBIA
IBIB
IBIC
IBID
IBIE
IBIF
IBIG
IBIH
IBII
IBIJ
HYG
LQD
IGEB
LQDW
INDY
NAV
29.06
26.26
44.18
84.27
25.00
36.40
37.71
38.22
47.70
52.87
59.96
448.02
405.53
41.09
26.46
50.59
58.21
26.43
27.64
32.56
23.04
15.61
81.43
80.45
74.64
158.82
59.25
39.12
78.62
86.70
127.19
47.12
87.45
68.13
58.50
37.93
24.19
44.25
54.33
39.03
25.07
105.13
46.23
33.43
23.15
23.06
22.90
22.19
23.23
23.13
26.00
23.84
23.26
22.84
22.37
22.20
21.76
19.70
20.53
23.08
25.15
24.87
25.92
24.72
26.55
23.86
25.48
23.89
25.36
25.03
25.54
23.01
25.52
21.58
20.70
25.82
24.81
25.04
25.15
25.31
25.39
25.46
25.56
25.64
25.70
25.65
25.79
77.55
110.52
45.09
29.63
49.16
Net Assets
(MIL)
16.8
5.1
43.9
1170.8
8.5
174.4
121.4
55.8
3382.9
1611.4
3273.9
3551.8
7367.6
17.7
1476.7
7527.0
18.6
607.5
6.1
6.2
118.8
2772.8
203.6
4513.4
286.8
310.3
905.4
3053.5
421.8
3996.3
537.5
3617.9
261.2
3857.0
127.8
115.5
3166.9
323.2
51.7
25921.3
768.8
332.3
285.2
47.4
456.7
296.5
199.4
58.9
36.2
13.5
12.7
2719.6
1695.5
573.6
355.6
278.5
137.5
162.3
150.5
160.0
372.2
2659.0
506.4
2279.8
561.0
1947.0
377.4
1615.2
336.9
1263.4
254.7
782.0
28.7
637.7
571.0
167.9
103.2
5.1
5.0
6.3
5.0
7.6
5.0
3.8
3.8
5.0
5.0
17059.7
31271.2
340.9
182.7
715.7
4th Qtr
Total Return
1 Year 3 Years*
9.48
8.54
5.86
12.21
9.93
12.60
12.01
15.66
6.68
11.54
15.09
17.35
18.89
15.17
8.62
1.55
16.51
2.84
18.15
16.95
13.79
7.50
10.20
10.54
10.09
8.88
5.84
-3.58
12.82
5.94
13.51
10.91
13.17
18.11
10.31
11.80
15.56
7.27
11.38
10.19
-9.68
6.48
7.79
1.52
2.40
3.30
4.26
5.87
7.38
8.60
8.44
1.55
2.25
2.97
3.73
4.35
4.97
5.52
6.19
6.40
9.09
1.70
1.38
2.62
2.43
3.59
3.47
4.70
4.46
5.71
5.48
6.80
7.87
7.71
8.69
9.45
6.67
1.43
1.84
2.55
3.10
3.55
4.13
4.80
5.23
5.56
5.80
7.16
9.85
8.10
0.47
8.94
15.06
11.82
4.22
29.07
12.10
29.80
16.80
16.40
5.51
19.82
27.09
60.67
58.47
42.76
14.02
6.59
17.68
9.78
32.73
N/A
-7.76
-20.33
13.83
27.61
38.71
27.22
2.37
4.06
14.93
3.49
21.67
6.16
14.49
52.78
0.84
22.37
10.43
5.33
12.59
13.52
-6.27
5.62
14.78
7.30
9.60
10.69
10.96
11.25
13.03
14.34
N/A
4.40
4.12
4.31
4.38
4.62
4.50
4.01
3.71
3.61
9.31
5.03
2.55
5.09
2.50
5.85
2.91
6.53
3.42
7.54
3.97
8.51
N/A
8.43
8.99
N/A
N/A
N/A
N/A
N/A
N/A
N/A
N/A
N/A
N/A
N/A
N/A
12.41
9.27
9.47
3.93
17.05
1.94
0.18
-6.69
10.63
N/A
9.64
7.32
6.38
-3.44
6.17
2.21
9.01
4.64
10.24
1.38
2.67
14.38
-0.10
N/A
N/A
-19.97
-16.84
2.42
10.36
1.55
1.76
3.01
29.43
9.46
5.63
7.86
5.36
6.26
11.56
2.34
6.57
3.57
-2.65
2.03
2.67
15.02
-3.77
2.76
N/A
3.99
3.50
2.63
N/A
N/A
N/A
N/A
-0.55
-1.64
-2.45
-3.13
-3.63
-4.13
-5.11
N/A
N/A
N/A
0.15
-0.20
-0.80
-0.81
-1.55
-0.93
-1.76
-1.01
-2.18
-1.11
-2.56
N/A
-3.41
N/A
N/A
N/A
N/A
N/A
N/A
N/A
N/A
N/A
N/A
N/A
N/A
N/A
1.23
-4.11
-2.68
N/A
8.76
Fund
iShares:Infl Hdg Crp Bd
iShares:Infn Hdg HY Bd
iShares:Infn Hdg US AgBd
iShares:Int Govt/Crdt Bd
iShares:Int Rt Hgd US AB
iShares:Interest Rt HCB
iShares:Interest Rt HY B
iShares:Internatl HY Bd
iShares:Intl Dev Prop
iShares:Intl Dev RE
iShares:Intl Dev SC VF
iShares:Intl Div Growth
iShares:Intl Eqty Fct
iShares:Intl SC EF
iShares:IR Hdgd LT Cp Bd
iShares:iShares Core Dv
iShares:Itl Sel Div ETF
iShares:Itl Trs Bd
iShares:JPM EM Corp Bd
iShares:JPM EM Hi Yld Bd
iShares:JPM EM LC Bd
iShares:JPM USD EM Bd
iShares:JPMrgn BUSD EM B
iShares:JPX-Nikkei 400
iShares:Lat Amer 40
iShares:Lit Min and Prod
iShares:MBS ETF
iShares:Micro-Cap
iShares:Morningstar MC
iShares:Morningstar SC
iShares:Morningstar Val
iShares:Mornstr Growth
iShares:Mornstr MC-Gro
iShares:Mornstr MC-Val
iShares:Mornstr SC-Gro
iShares:Mornstr SC-Val
iShares:Mornstr US Eqty
iShares:MS MltAsst Inc
iShares:MSCI AC AXJ
iShares:MSCI ACWI
iShares:MSCI ACWI Low CT
iShares:MSCI ACWI XUS
iShares:MSCI Agri Prod
iShares:MSCI Australia
iShares:MSCI Austria
iShares:MSCI Belgium
iShares:MSCI BIC
iShares:MSCI Brazil
iShares:MSCI Brz Sm-Cap
iShares:MSCI Canada
iShares:MSCI Chile
iShares:MSCI China
iShares:MSCI China A
iShares:MSCI China MTech
iShares:MSCI Chna Sm-Cap
iShares:MSCI Denmark
iShares:MSCI EAFE ETF
iShares:MSCI EAFE Gro
iShares:MSCI EAFE Sm-Cp
iShares:MSCI EAFE Val
iShares:MSCI Em Mkt Asia
iShares:MSCI Em Mkt SC
iShares:MSCI Em Mkts
iShares:MSCI EM MV F
iShares:MSCI EM xChn
iShares:MSCI Europe F
iShares:MSCI Europe SC
iShares:MSCI Eurozone
iShares:MSCI Finland
iShares:MSCI France
iShares:MSCI Germany
iShares:MSCI Gl Engy Pro
iShares:MSCI Gl GMiners
iShares:MSCI Gl M&MP
iShares:MSCI Gl MV Fctr
iShares:MSCI Gl SMetal
iShares:MSCI Glbl SDGs
iShares:MSCI Hong Kong
iShares:MSCI Ind Sm-Cap
iShares:MSCI India
iShares:MSCI Indonesia
iShares:MSCI Intl SF
iShares:MSCI Ireland
iShares:MSCI Israel
iShares:MSCI Italy
iShares:MSCI Itl Mom Fct
iShares:MSCI Itl Qlty Fc
iShares:MSCI Itl Val Fct
iShares:MSCI Japan
iShares:MSCI Japan SC
iShares:MSCI Japan Value
iShares:MSCI KLD 400 Soc
Data provided by
Description
ETF
Symbols
Inflation Protected Bond
Inflation Protected Bond
Inflation Protected Bond
Core Bond
Core Bond
Corporate Debt BBB-Rated
High Yield
Global High Yield
Intl Real Estate
Intl Real Estate
Intl Sm/Md-Cp Core Fds
Intl Equity Income Fds
Intl Multi-Cp Core Fds
Intl Sm/Md-Cp Gro Fds
Corporate Debt BBB-Rated
Equity Income
Intl Equity Income Fds
Intl Income
Emerging Mrkts Hard Currency Debt
Emerging Mrkts Hard Currency Debt
EmergingMarketsLocalCurrencyDebtFds
Emerging Mrkts Hard Currency Debt
Emerging Mrkts Hard Currency Debt
Japanese
Latin American
Basic Materials
U.S. Mortgage
Small-Cap Core
Mid-Cap Core
Small-Cap Core
Large-Cap Value
Large-Cap Growth
Mid-Cap Growth
Mid-Cap Value
Small-Cap Growth
Small-Cap Core
Large-Cap Core
Alternative Global Macro
Pacific Ex Japan
Global Multi-Cap Core Fds
Global Multi-Cap Core Fds
Intl Multi-Cp Core Fds
Specialty/Miscellaneous
Pacific Region
European Region
European Region
Emerging Markets
Latin American
Latin American
Intl Large-Cp Core Fds
Latin American
China Region
China Region
China Region
China Region
European Region
Intl Large-Cp Core Fds
Intl Large-Cp Gro Fds
Intl Sm/Md-Cp Gro Fds
Intl Large-Cp Val Fds
Emerging Markets
Emerging Markets
Emerging Markets
Emerging Markets
Emerging Markets
Global Financial Services
European Region
European Region
European Region
European Region
European Region
Global Natural Resources
Precious Metals Equity
Basic Materials
Global Multi-Cap Value Fds
Precious Metals Equity
Global Multi-Cap Value Fds
China Region
India Region
India Region
Emerging Markets
Intl Multi-Cp Core Fds
European Region
Intl Sm/Md-Cp Core Fds
European Region
Intl Large-Cp Gro Fds
Intl Large-Cp Gro Fds
Intl Multi-Cp Val Fds
Japanese
Japanese
Japanese
Large-Cap Core
LQDI
HYGI
AGIH
GVI
AGRH
LQDH
HYGH
HYXU
WPS
IFGL
ISVL
IGRO
INTF
ISCF
IGBH
DIVB
IDV
IGOV
CEMB
EMHY
LEMB
EMB
BEMB
JPXN
ILF
ILIT
MBB
IWC
IMCB
ISCB
ILCV
ILCG
IMCG
IMCV
ISCG
ISCV
ILCB
IYLD
AAXJ
ACWI
CRBN
ACWX
VEGI
EWA
EWO
EWK
BKF
EWZ
EWZS
EWC
ECH
MCHI
CNYA
TCHI
ECNS
EDEN
EFA
EFG
SCZ
EFV
EEMA
EEMS
EEM
EEMV
EMXC
EUFN
IEUS
EZU
EFNL
EWQ
EWG
FILL
RING
PICK
ACWV
SLVP
SDG
EWH
SMIN
INDA
EIDO
ISZE
EIRL
EIS
EWI
IMTM
IQLT
IVLU
EWJ
SCJ
EWJV
DSI
NAV
26.22
25.89
24.60
104.69
25.71
93.03
84.08
49.15
28.80
21.86
33.79
64.58
28.01
32.12
24.20
41.02
28.06
41.30
43.89
36.19
36.77
88.91
51.66
68.05
29.06
16.99
94.08
115.96
67.07
53.61
70.58
67.76
64.45
67.67
43.94
59.17
65.72
19.89
66.55
101.77
165.64
51.01
38.28
24.42
21.58
18.83
34.33
34.92
15.10
36.68
28.08
40.81
25.87
16.86
25.54
112.47
75.37
96.87
61.98
52.03
66.23
58.01
40.25
55.66
55.35
20.96
56.08
47.34
35.76
39.18
29.66
24.14
24.74
43.30
100.45
10.21
81.36
17.38
69.78
48.82
22.25
26.07
61.02
58.19
33.89
34.27
37.53
26.47
64.15
71.99
29.14
91.01
Net Assets
(MIL)
48.4
2.5
2.4
3361.2
5.2
267.7
176.6
48.7
37.1
120.3
163.9
606.6
948.2
530.2
70.9
261.2
4299.8
1060.8
407.8
321.4
469.7
14671.6
40.1
79.8
1647.7
3.1
27960.6
789.4
753.4
200.1
843.1
1838.0
1643.4
556.8
445.3
370.0
800.5
127.2
2385.6
18199.0
886.5
4407.5
169.2
2027.3
55.0
17.4
69.9
5637.4
251.7
3000.1
546.0
6578.2
220.5
7.0
59.0
245.2
48645.5
10255.3
9477.3
16779.1
432.1
341.5
16956.4
4334.2
7916.3
1211.8
115.0
6502.4
19.0
879.8
1023.5
115.9
429.6
1300.6
4222.6
176.4
344.8
581.5
504.5
6351.1
398.7
5.1
94.0
130.4
262.1
1582.3
6915.1
1651.5
13152.6
111.3
234.8
3866.4
4th Qtr
Total Return
1 Year 3 Years*
8.05
6.28
5.25
4.46
2.12
3.77
4.40
10.79
15.39
15.06
12.51
9.54
10.40
11.21
3.94
11.12
11.96
10.94
5.80
9.04
6.66
9.68
8.26
8.23
17.19
-6.76
7.33
16.00
12.83
14.41
9.78
13.89
13.15
12.43
13.80
14.92
11.97
7.09
6.01
11.16
11.41
9.94
1.79
16.02
12.75
9.09
2.88
17.74
15.37
11.15
6.99
-3.88
-4.44
2.67
-2.57
12.13
10.81
13.08
11.43
8.61
6.29
8.36
7.52
5.73
12.34
12.61
14.93
12.98
12.04
10.91
13.30
-4.37
20.69
11.56
6.81
19.49
9.91
3.72
10.76
10.05
0.20
10.63
13.06
7.42
12.98
10.34
12.94
7.01
8.03
7.42
4.23
12.23
8.89
11.64
5.43
5.14
6.58
10.66
12.29
16.08
7.46
5.86
17.02
15.50
18.35
11.52
12.43
13.15
10.75
5.63
8.07
11.43
7.68
10.58
N/A
19.47
32.79
N/A
4.99
9.09
16.21
19.65
14.36
40.25
20.82
11.73
22.84
16.45
26.86
11.05
4.94
22.22
22.34
15.46
-8.51
13.98
19.88
7.46
1.48
31.78
31.25
14.62
9.24
-11.07
-13.51
-5.69
-23.28
17.80
18.07
17.24
12.90
18.87
6.98
22.52
8.90
8.02
18.71
26.18
16.63
22.93
-0.04
21.69
22.90
4.09
12.62
10.05
8.17
-2.05
4.66
-14.04
34.80
17.49
2.09
15.86
34.06
5.32
30.34
13.68
18.46
19.99
19.78
12.95
23.05
28.45
-0.32
N/A
N/A
-1.82
N/A
3.64
5.54
-2.12
-4.07
-4.67
N/A
3.61
4.96
2.36
3.86
10.02
4.96
-9.27
-1.92
-1.64
-4.63
-4.02
N/A
0.24
8.24
N/A
-2.97
0.33
6.20
4.40
10.43
5.95
1.11
11.55
-3.84
10.42
8.17
-1.42
-7.62
5.75
5.52
1.38
6.06
5.43
7.08
1.40
-11.38
7.13
0.31
8.22
3.00
-18.83
-13.10
N/A
-15.89
6.13
4.03
0.08
-0.72
7.62
-6.97
5.66
-5.91
-1.02
1.34
11.12
-0.75
4.92
-3.31
8.96
0.10
28.38
-4.11
11.64
3.43
-14.90
-2.76
-8.17
18.83
9.23
0.84
1.72
7.42
-1.78
8.37
0.31
4.28
9.24
0.17
-1.27
7.21
9.73
L40
BARRON’S
•
Funds Quarterly
January 8, 2024
ETF Score Card
For personal non-commercial use only. Do not edit or alter. Reproductions not permitted.
To reprint or license content, please contact Barron's reprints department at 800-843-0008 or www.djreprints.com
Fund
iShares:MSCI Kokusai
iShares:MSCI Kuwait
iShares:MSCI Malaysia
iShares:MSCI Mexico
iShares:MSCI MV EAFE MVF
iShares:MSCI Netherlands
iShares:MSCI New Zlnd
iShares:MSCI Norway
iShares:MSCI Pac xJpn
iShares:MSCI Philippines
iShares:MSCI Poland
iShares:MSCI Qatar
iShares:MSCI S Africa
iShares:MSCI S Arabia
iShares:MSCI S Korea
iShares:MSCI Singapore
iShares:MSCI Spain
iShares:MSCI Sweden
iShares:MSCI Switzerland
iShares:MSCI Taiwan
iShares:MSCI Thai
iShares:MSCI Turkey
iShares:MSCI UAE
iShares:MSCI UK
iShares:MSCI UK Sm-Cap
iShares:MSCI USA ESG Sel
iShares:MSCI USA EW
iShares:MSCI USA Mom Fct
iShares:MSCI USA MVF
iShares:MSCI USA QF
iShares:MSCI USA SC MVF
iShares:MSCI USA SF
iShares:MSCI USA Val Fct
iShares:MSCI Water Mgt
iShares:MSCI World
iShares:Mtge RE
iShares:N Amer Nat Res
iShares:Natl Muni Bond
iShares:Neurosci & Hlthc
iShares:NY Muni Bond
iShares:Par-Al Clm MSCI
iShares:Pref and Inc Sec
iShares:Res & Mltsctr RE
iShares:Rob & Art Int Ms
iShares:Russ 1000 ETF
iShares:Russ 1000 Gr ETF
iShares:Russ 1000 Vl ETF
iShares:Russ 2000 ETF
iShares:Russ 2000 Gr ETF
iShares:Russ 2000 Vl ETF
iShares:Russ 2500 ETF
iShares:Russ MC Gr
iShares:Russ MC Val
iShares:Russ Mid-Cap
iShares:Russ Top 200
iShares:Russ Top 200 Gr
iShares:Russ Top 200 Val
iShares:Russell 3000
iShares:S&P 100
iShares:S&P 500 Gro
iShares:S&P 500 Val
iShares:S&P GSCI Cmdty
iShares:S&P MC 400 Gro
iShares:S&P MC 400 Val
iShares:S&P SC 600 Gro
iShares:S&P SC 600 Val
iShares:Sel Div ETF
iShares:Self-Dri EV&Tech
iShares:Semiconductor
iShares:Sh Trs Bd ETF
IShares:Silver Trust
iShares:ST Nat Muni Bond
iShares:TIPS Bd ETF
iShares:Tr Fl Rate Bond
iShares:Trstn-Enblg Mtls
iShares:US & I HY Crp Bd
iShares:US Aer&Def ETF
iShares:US BD & SE ETF
iShares:US Bsc Mat ETF
iShares:US Cnsmr Disc
iShares:US Cnsmr Foc
iShares:US Cnsmr Staples
iShares:US Dg Infra & RE
iShares:US Energy ETF
iShares:US Eqty Fct
iShares:US FI BR Fctr
iShares:US Finanls ETF
iShares:US Fnl Svc ETF
iShares:US HC Prvd ETF
iShares:US Hlthcr ETF
iShares:US Home Cons ETF
iShares:US Indust ETF
Description
ETF
Symbols
Global Large-Cap Core Fds
Frontier Markets
Pacific Region
Latin American
Intl Multi-Cp Core Fds
European Region
Pacific Region
European Region
Pacific Ex Japan
Pacific Region
European Region
Emerging Markets
Emerging Markets
Emerging Markets
Pacific Ex Japan
Pacific Region
European Region
European Region
European Region
China Region
Emerging Markets
Emerging Markets
Emerging Markets
European Region
European Region
Multi-Cap Core
Multi-Cap Core
Large-Cap Core
Multi-Cap Core
Large-Cap Core
Small-Cap Core
Multi-Cap Core
Multi-Cap Value
Specialty/Miscellaneous
Global Large-Cap Core Fds
Real Estate
Natural Resources
General & Insured Municipal Debt
Global Health/Biotechnology Fds
New York Municipal Debt
Large-Cap Growth
Flexible Income
Real Estate
Global Science/Technology Fds
Large-Cap Core
Large-Cap Growth
Multi-Cap Value
Small-Cap Core
Small-Cap Growth
Small-Cap Core
Small-Cap Growth
Mid-Cap Growth
Mid-Cap Core
Mid-Cap Core
Large-Cap Core
Large-Cap Growth
Large-Cap Value
Multi-Cap Core
Large-Cap Core
Large-Cap Growth
Large-Cap Value
Commodities General
Small-Cap Growth
Small-Cap Core
Small-Cap Growth
Small-Cap Value
Equity Income
Global Science/Technology Fds
Science & Technology
Short U.S. Treasury
Commodities Prec Metals Fds
Short-Intmdt Municipal Debt
Inflation Protected Bond
Short U.S. Treasury
Commodities Base Metals Fds
Global High Yield
Industrials
Financial Services
Basic Materials
Consumer Services
Consumer Services
Consumer Goods
Telecommunication
Natural Resources
Multi-Cap Core
Multi-Sector Income
Financial Services
Financial Services
Health/Biotechnology
Health/Biotechnology
Consumer Services
Industrials
TOK
KWT
EWM
EWW
EFAV
EWN
ENZL
ENOR
EPP
EPHE
EPOL
QAT
EZA
KSA
EWY
EWS
EWP
EWD
EWL
EWT
THD
TUR
UAE
EWU
EWUS
SUSA
EUSA
MTUM
USMV
QUAL
SMMV
SIZE
VLUE
IWTR
URTH
REM
IGE
MUB
IBRN
NYF
PABU
PFF
REZ
IRBO
IWB
IWF
IWD
IWM
IWO
IWN
SMMD
IWP
IWS
IWR
IWL
IWY
IWX
IWV
OEF
IVW
IVE
GSG
IJK
IJJ
IJT
IJS
DVY
IDRV
SOXX
SHV
SLV
SUB
TIP
TFLO
TMET
GHYG
ITA
IAI
IYM
IYC
IEDI
IYK
IDGT
IYE
LRGF
FIBR
IYF
IYG
IHF
IYH
ITB
IYJ
NAV
98.85
30.85
21.25
67.93
69.32
44.57
48.67
24.39
43.56
25.85
22.71
18.12
42.09
42.13
65.76
18.64
30.54
39.45
48.29
46.00
64.27
32.36
14.77
33.08
34.71
100.52
84.38
156.91
77.98
147.21
35.67
131.97
101.18
28.82
132.90
23.60
40.73
108.42
26.24
54.16
52.70
31.09
73.49
34.47
262.16
303.08
165.20
200.77
252.34
155.26
61.49
104.43
116.31
77.75
115.04
175.11
70.13
273.58
223.24
75.09
173.80
20.08
79.18
114.02
125.09
103.02
117.23
35.93
575.83
110.10
21.78
105.25
107.28
50.43
25.74
44.10
126.55
108.40
138.06
75.78
44.18
191.73
64.71
44.11
48.24
86.24
85.35
178.98
262.59
286.02
101.67
114.32
Net Assets
(MIL)
185.6
55.4
236.4
1644.2
7193.7
217.2
116.4
36.0
1773.7
92.9
244.0
69.2
318.5
732.1
3844.7
467.1
821.2
313.1
1220.9
3622.2
276.5
194.1
36.8
2650.5
43.7
5127.5
580.1
8126.8
27571.7
37905.4
815.7
314.2
6396.9
5.6
2886.9
589.0
575.0
37351.2
4.3
670.4
1493.7
13216.0
588.3
536.1
31312.2
77702.7
51581.4
53890.0
9622.8
10836.3
839.5
13266.3
12251.7
28815.8
1031.9
8407.8
1757.1
11751.9
11999.5
35815.8
25816.7
1068.3
7654.4
6739.9
4933.1
6344.7
18192.6
335.6
9195.0
20129.0
10857.7
8992.6
19480.2
10704.9
12.7
119.9
5689.1
394.3
659.0
812.9
14.5
1361.9
47.3
1315.4
1498.2
59.2
1904.8
1179.0
904.7
3017.3
2001.1
1129.6
4th Qtr
Total Return
1 Year 3 Years*
12.17
0.44
4.51
18.50
7.53
18.15
11.01
6.04
12.01
4.08
36.35
2.70
13.03
9.03
13.97
4.75
12.83
22.37
10.81
16.11
3.41
-15.86
-3.72
7.06
13.31
12.18
12.73
12.57
8.32
12.16
8.51
12.80
12.25
13.65
11.59
9.94
-1.32
6.99
25.04
7.34
12.82
5.50
12.63
13.69
11.96
14.17
9.45
14.03
12.75
15.21
13.36
14.49
12.06
12.78
11.69
14.12
7.97
12.05
11.64
10.05
13.57
-10.91
9.91
13.57
14.24
15.75
10.06
-2.76
21.73
1.42
2.97
2.92
4.42
1.25
2.04
8.26
19.89
19.43
9.95
13.37
15.36
3.63
4.76
-6.24
11.86
6.05
14.83
16.34
6.90
6.22
29.74
13.63
24.63
-4.49
-4.01
40.43
11.98
21.34
3.53
4.55
5.92
-0.27
50.13
1.85
1.31
13.60
19.05
5.27
29.80
24.75
17.37
29.15
-12.18
-9.16
2.76
13.03
15.30
23.87
17.60
9.10
10.21
30.84
4.97
17.84
14.26
15.06
23.93
14.56
3.12
5.86
0.99
6.22
29.79
9.32
10.89
36.01
26.40
42.49
11.31
16.80
18.58
14.42
17.51
25.63
12.53
17.07
29.71
46.43
10.41
25.80
32.65
29.80
22.02
-5.34
17.32
15.25
16.97
14.64
1.09
8.31
66.90
5.04
-1.14
3.11
3.68
5.17
N/A
13.73
14.27
15.03
12.73
34.10
24.26
-2.77
-6.05
-2.29
25.78
8.29
15.23
15.96
-1.06
2.05
68.83
19.87
8.17
9.93
-5.53
19.73
0.72
4.06
-8.37
2.54
1.14
-5.79
8.31
2.95
1.32
12.84
-6.91
0.21
7.14
3.20
4.46
5.71
-3.22
10.77
11.80
8.13
-3.64
8.30
6.99
0.40
6.47
9.75
3.36
7.43
8.16
N/A
7.45
-1.11
24.18
-0.29
N/A
-0.28
N/A
-1.50
5.55
-3.39
8.83
8.69
8.66
2.11
-3.55
7.70
4.25
1.12
8.15
5.76
9.90
10.38
8.80
8.38
10.60
6.43
12.90
17.76
4.08
11.76
4.09
9.88
10.69
-4.16
16.01
1.93
-3.99
0.36
-1.31
2.31
N/A
0.48
11.17
12.97
8.76
3.05
5.06
5.70
3.06
33.94
10.21
-2.50
10.35
7.97
4.57
6.39
22.95
6.64
Fund
iShares:US Infra
iShares:US Ins ETF
iShares:US Med Dev ETF
iShares:US O&G E&P ETF
iShares:US Oil E&S ETF
iShares:US Pharma ETF
iShares:US Rgnl Bnks ETF
iShares:US Rl Est ETF
iShares:US SC Eqty Fctr
iShares:US SC Val Fctr
iShares:US Tch Brktru Ms
iShares:US Tech ETF
iShares:US Tech Ind Foc
iShares:US Telecom ETF
iShares:US Transportatn
iShares:US Treasury Bond
iShares:US Utl ETF
iShares:USD Bond Factor
iShares:USD Green Bond
iShares:Virtual W&L MS
iShares:Yld Optimized Bd
J Hancock ETF:Corp Bond
J Hancock ETF:Itl Hi Div
J Hancock ETF:Mltfctr DI
J Hancock ETF:Mltfctr EM
J Hancock ETF:Mltfctr LC
J Hancock ETF:Mltfctr MC
J Hancock ETF:Mltfctr SC
J Hancock ETF:Mtg-B Sec
J Hancock ETF:Prefd Inc
J Hancock ETF:US Hi Div
Jacob Forward ETF
Jns Hndsn AAA CLO
Jns Hndsn B-BBB CLO
Jns Hndsn Intl Sus Eqty
Jns Hndsn Mort-Bckd Sec
Jns Hndsn S/M Cap Gr Alp
Jns Hndsn Shr Dur Inc
Jns Hndsn Sm Cap Gr Alp
Jns Hndsn Sus & Imp C Bd
Jns Hndsn Sus Corp Bd
Jns Hndsn US Real Estate
Jns Hndsn US Sus Eqty
JPMorgan Alerian MLP ETN
JPMorgan:AB Em Mkts Eq
JPMorgan:Active China
JPMorgan:Active Growth
JPMorgan:Active SC Val
JPMorgan:Active Value
JPMorgan:BB 1-5yr US AB
JPMorgan:BB Canada ETF
JPMorgan:BB Dv AsPc xJp
JPMorgan:BB Emg Mrkts Eq
JPMorgan:BB Europe
JPMorgan:BB Intl Equity
JPMorgan:BB Japan
JPMorgan:BB MSCI US REIT
JPMorgan:BB US Ag Bd
JPMorgan:BB US Equity
JPMorgan:BB US Md Cp Eq
JPMorgan:BB US Sm Cp Eq
JPMorgan:BB US TB 1-3 Yr
JPMorgan:BB US TB 20+ Y
JPMorgan:BB US TB 3-10 Y
JPMorgan:BB US TIPS 0-5Y
JPMorgan:BB USD HY CB
JPMorgan:BB USD IGCB
JPMorgan:Clim Change Sol
JPMorgan:Core Plus Bond
JPMorgan:Crbn Trns US Eq
JPMorgan:Div Ret EM Eqty
JPMorgan:Div Ret Intl Eq
JPMorgan:Div Ret US Eqty
JPMorgan:Dv Rtn US MC Eq
JPMorgan:Dv Rtn US SC Eq
JPMorgan:Eqty Prem Inc
JPMorgan:Equity Focus
JPMorgan:Glbl Sl Eq
JPMorgan:Hdg Eq Ld Ovly
JPMorgan:High Yield Muni
JPMorgan:Income
JPMorgan:Infl Mgd Bond
JPMorgan:Intl Bond Opp
JPMorgan:Intl Growth
JPMorgan:Intl Val
JPMorgan:IR Enh Eqty
JPMorgan:Ltd Dur Bd
JPMorgan:Mkt Exp Enh Eq
JPMorgan:Municipal
JPMorgan:Nsdq Eq Prm Inc
JPMorgan:Realty Inc
JPMorgan:Shrt Dur Core +
Data provided by
Description
ETF
Symbols
Industrials
Financial Services
Health/Biotechnology
Natural Resources
Natural Resources
Health/Biotechnology
Financial Services
Real Estate
Small-Cap Core
Small-Cap Value
Science & Technology
Science & Technology
Science & Technology
Telecommunication
Industrials
General U.S. Treasury
Utility
General Bond
Global Income
Global Science/Technology Fds
Multi-Sector Income
Corporate Debt BBB-Rated
Intl Equity Income Fds
Intl Multi-Cp Core Fds
Emerging Markets
Multi-Cap Core
Mid-Cap Core
Small-Cap Core
U.S. Mortgage
Flexible Income
Equity Income
Science & Technology
Loan Participation
Loan Participation
Intl Multi-Cp Gro Fds
U.S. Mortgage
Small-Cap Growth
Short Inv. Grade Debt
Small-Cap Growth
Core Bond
Corporate Debt BBB-Rated
Real Estate
Multi-Cap Core
Energy MLP
Emerging Markets
China Region
Large-Cap Growth
Small-Cap Value
Multi-Cap Value
Short-Intmdt Inv. Grade Debt
Intl Large-Cp Core Fds
Pacific Ex Japan
Emerging Markets
European Region
Intl Large-Cp Core Fds
Japanese
Real Estate
General Bond
Large-Cap Core
Small-Cap Growth
Small-Cap Core
Short U.S. Treasury
General U.S. Treasury
Interm. U.S. Government
Inflation Protected Bond
High Yield
Corporate Debt BBB-Rated
Global Multi-Cap Core Fds
Core Plus Bond
Large-Cap Core
Emerging Markets
Intl Multi-Cp Val Fds
Multi-Cap Value
Mid-Cap Core
Small-Cap Core
Options Arbitrage/Opt Strat Fds
Large-Cap Core
Global Large-Cap Core Fds
Options Arbitrage/Opt Strat Fds
High Yield Municipal Debt
Multi-Sector Income
Inflation Protected Bond
Intl Income
Intl Large-Cp Gro Fds
Intl Large-Cp Val Fds
Intl Large-Cp Core Fds
Short-Intmdt Inv. Grade Debt
Small-Cap Core
Interm. Municipal Debt
Options Arbitrage/Opt Strat Fds
Real Estate
Short Inv. Grade Debt
IFRA
IAK
IHI
IEO
IEZ
IHE
IAT
IYR
SMLF
SVAL
TECB
IYW
IETC
IYZ
IYT
GOVT
IDU
USBF
BGRN
IWFH
BYLD
JHCB
JHID
JHMD
JHEM
JHML
JHMM
JHSC
JHMB
JHPI
JHDV
JFWD
JAAA
JBBB
SXUS
JMBS
JSMD
VNLA
JSML
JIB
SCRD
JRE
SSPX
AMJ
JEMA
JCHI
JGRO
JPSV
JAVA
BBSA
BBCA
BBAX
BBEM
BBEU
BBIN
BBJP
BBRE
BBAG
BBUS
BBMC
BBSC
BBSB
BBLB
BBIB
BBIP
BBHY
BBCB
TEMP
JCPB
JCTR
JPEM
JPIN
JPUS
JPME
JPSE
JEPI
JPEF
JGLO
HELO
JMHI
JPIE
JCPI
JPIB
JIG
JIVE
JIRE
JPLD
JMEE
JMUB
JEPQ
JPRE
JSCP
NAV
40.22
100.12
53.98
93.17
21.93
185.30
41.82
91.37
58.74
30.80
42.91
122.70
62.38
22.76
262.32
23.02
79.87
85.00
47.11
15.53
22.40
21.32
28.31
32.54
25.57
58.81
52.62
36.54
21.75
21.52
30.34
10.46
50.24
47.80
17.71
45.92
65.70
48.34
58.95
42.32
41.97
22.71
23.68
25.36
36.13
39.07
61.06
54.37
55.58
47.81
64.06
49.66
49.57
56.52
56.95
52.51
89.30
46.54
85.88
84.66
61.45
98.73
94.37
98.50
97.90
45.90
46.11
40.76
46.95
64.54
52.21
54.40
102.73
91.89
44.02
54.97
52.75
52.20
52.90
49.81
45.34
46.55
47.50
58.40
50.75
58.46
50.74
53.64
50.93
49.92
44.98
46.47
Net Assets
(MIL)
2128.8
398.2
5033.4
837.4
342.1
570.1
629.3
3086.8
753.6
82.0
314.2
13319.3
166.3
246.8
843.6
23158.7
809.3
12.4
326.1
3.0
108.4
25.7
7.3
522.5
655.1
736.8
3269.9
355.9
33.8
32.6
7.3
2.4
4982.3
135.7
7.6
2951.0
277.7
2415.5
160.3
35.0
30.3
5.9
7.8
3092.4
819.8
10.7
763.8
11.0
692.2
20.1
6256.1
4043.6
519.7
5852.3
3862.3
9527.2
802.5
1878.9
2439.9
1525.8
717.2
4.4
51.0
6.8
7.6
492.9
67.9
20.9
2048.8
4.7
287.0
370.4
434.3
338.6
418.6
30376.5
277.3
902.5
160.2
188.7
848.5
454.9
375.7
76.4
12.3
5574.7
780.5
876.0
859.2
7660.5
339.9
288.2
4th Qtr
Total Return
1 Year 3 Years*
10.65
9.67
11.47
-3.41
-8.56
4.95
26.02
17.92
13.58
17.27
17.39
17.16
17.33
7.45
12.62
5.49
9.47
7.08
5.95
14.63
6.54
8.65
7.60
9.71
8.45
11.83
12.01
14.25
6.59
6.70
10.95
36.66
2.24
3.92
13.81
7.72
12.44
2.25
16.04
6.90
9.13
12.65
12.16
4.44
7.31
-5.60
13.56
13.34
9.10
3.45
11.23
11.89
7.39
11.77
10.78
7.83
16.05
6.69
11.97
13.01
15.73
2.52
12.90
4.90
2.50
7.16
8.34
13.21
6.94
12.13
4.80
10.27
10.23
10.67
12.86
5.70
11.69
13.16
6.26
7.06
4.75
4.11
6.23
10.91
7.15
10.65
2.96
11.96
6.66
10.17
16.58
4.01
13.20
11.22
3.21
3.52
4.47
0.99
-8.53
11.86
19.69
12.32
57.41
65.50
54.25
3.88
24.53
4.21
-5.05
6.80
6.52
17.31
8.19
9.33
19.86
19.13
12.67
21.21
14.52
20.58
7.48
7.15
15.97
35.14
8.58
15.35
10.11
5.68
26.88
6.02
29.82
5.62
8.49
8.73
24.97
25.08
8.75
N/A
37.66
N/A
10.33
4.79
14.83
5.60
N/A
19.98
18.17
20.02
13.76
5.48
27.20
18.30
20.03
N/A
N/A
N/A
N/A
12.53
8.58
10.36
7.04
27.48
11.16
17.05
11.05
11.32
15.77
9.88
31.67
N/A
N/A
4.86
7.51
4.75
7.84
13.37
N/A
19.67
6.50
17.89
6.07
36.28
13.28
6.22
12.48
16.23
0.09
42.14
26.14
2.76
0.32
4.96
10.05
10.41
7.33
13.41
10.44
-6.82
7.20
-3.93
3.57
N/A
-3.33
-19.00
-1.39
N/A
N/A
4.64
-1.80
8.93
6.47
7.19
N/A
N/A
N/A
N/A
3.41
N/A
N/A
-2.35
1.98
1.88
-1.79
N/A
N/A
N/A
N/A
30.97
N/A
N/A
N/A
N/A
N/A
-0.81
8.71
2.06
N/A
6.09
4.19
0.42
7.01
-3.51
9.18
3.77
3.65
N/A
N/A
N/A
N/A
1.54
-3.53
N/A
-2.36
10.35
2.71
2.42
9.41
8.89
8.56
8.83
11.14
N/A
N/A
-2.05
N/A
0.36
0.66
-5.78
N/A
5.26
1.20
9.85
-0.12
N/A
6.21
N/A
January 8, 2024
BARRON’S
•
L41
Funds Quarterly
ETF Score Card
For personal non-commercial use only. Do not edit or alter. Reproductions not permitted.
To reprint or license content, please contact Barron's reprints department at 800-843-0008 or www.djreprints.com
Fund
JPMorgan:Sust Muni Inc
JPMorgan:Sustainbl Infra
JPMorgan:Ultra-Short Inc
JPMorgan:Ult-Sht Mun Inc
JPMorgan:US Mom Factor
JPMorgan:US Quality Fact
JPMorgan:US Value Factor
JPMorgan:USD EM Sov Bd
Kingsbarn Tactical Bond
Knowledge Ldrs Dev World
Kovitz Core Equity
KPOP and Korean Entmt
KraneShs:Asia Pac HI Bd
KraneShs:Bbg Chn Bd Inc
KraneShs:Bos MSCI Cn A50
KraneShs:CA Crbn All St
KraneShs:Chn Innovation
KraneShs:CICC Ch 5G & Sc
KraneShs:CICC Ch Cns Ldr
KraneShs:CICC Strtgy
KraneShs:CSI China Intrt
KraneShs:Dyn EM Strtgy
KraneShs:Elc Vhcs&Fut Mb
KraneShs:Elec Metals Str
KraneShs:EM Cons Tech Ix
KraneShs:Eur Crbn All St
KraneShs:Glb Crbn OffStr
KraneShs:Glbl Crbn Strat
KraneShs:Glbl Lxry Idx
KraneShs:Hang Seng TECH
KraneShs:KFA MLMFI Strat
KraneShs:MSCI 1Belt 1Rd
KraneShs:MSCI All Ch HCI
KraneShs:MSCI All China
KraneShs:MSCI Ch Cln Tch
KraneShs:MSCI EM ex Chna
KraneShs:QIR V&I Hdg
KraneShs:Quadratic Defl
KraneShs:Rckflr Ocn Eng
KraneShs:S&P PanAsia DAI
KraneShs:SSE STAR Mkt 50
KraneShs:VL Dyn Dv Eq Ix
LAFFER TENGLER Eqty Inc
Lattice:Hfd Disc US Eqty
Lattice:Hfd Longevity Ec
Lattice:Hfd MF DM xUS St
Lattice:Hfd MF Dvsd Intl
Lattice:Hfd MF Emg Mkts
Lattice:Hfd MF Sm Cp
Lattice:Hfd MF US Equity
LeaderShs Activist Ldrs
LeaderShs AlpFtr Tct Foc
LeaderShs AlpFtr US Cr
LeaderShs Dyn Yld
LeaderShs Equity Skew
Leuthold:Core ETF
Level Four LCG Active
LHA Mkt State Alpha Skr
LHA Mkt State Tact Beta
LHA Mkt State Tact Q
LHA Risk-Managed Income
Logan Cap Broad Innov Gr
M Sheffield Managed Risk
Madison:Aggregate Bond
Madison:Covered Call
Madison:Dividend Value
Madison:Sh-Trm Strat Inc
Main BuyWrite
Main Intl
Main Sector Rotation ETF
Main Thematic Innovation
Mairs & Pwr Minn Muni Bd
MarketDesk Focus US Div
Matthews Asia:China Actv
Matthews Asia:Div Actv
Matthews Asia:EM Eq Actv
Matthews Asia:EM ex-Ch A
Matthews Asia:EM Sus FA
Matthews Asia:India Actv
Matthews Asia:Innov Actv
Matthews Asia:Japan Act
Matthews Asia:Korea Actv
Matthews Asia:Pac Tg Act
MAX Airlines -3X Inv Lev
MAX Airlines 3X Lev
MAX Auto Ind -3X Inv Lev
MAX Auto Industry 3X Lev
MC Sustainable Intl Eqty
Meet Kevin Pricing Pwr
Mindful Conservative ETF
MKAM
Mohr Growth ETF
Description
ETF
Symbols
Interm. Municipal Debt
Industrials
Ultra-Short Obligations
Short Municipal Debt
Multi-Cap Core
Multi-Cap Core
Multi-Cap Value
Emerging Mrkts Hard Currency Debt
Multi-Sector Income
Global Multi-Cap Core Fds
Multi-Cap Core
Consumer Services
Emerging Mrkts Hard Currency Debt
EmergingMarketsLocalCurrencyDebtFds
China Region
Commodities Energy
China Region
Global Science/Technology Fds
Consumer Goods
Options Arbitrage/Opt Strat Fds
Global Science/Technology Fds
Emerging Markets
Alternative Energy
Basic Materials
Emerging Markets
Commodities Energy
Commodities Prec Metals Fds
Commodities Energy
Consumer Services
Global Science/Technology Fds
Alternative Managed Futures Fds
China Region
China Region
China Region
China Region
Emerging Markets
Inflation Protected Bond
Inflation Protected Bond
Specialty/Miscellaneous
Pacific Region
Global Science/Technology Fds
Multi-Cap Value
Large-Cap Growth
Multi-Cap Core
Multi-Cap Value
Intl Multi-Cp Val Fds
Intl Multi-Cp Val Fds
Emerging Markets
Small-Cap Core
Multi-Cap Value
Small-Cap Core
Mid-Cap Value
Mid-Cap Core
Multi-Sector Income
Multi-Cap Core
Flexible Portfolio
Large-Cap Growth
Alternative Long/Short Eqty Fds
Alternative Act Extension Fds
Large-Cap Growth
Corporate Debt BBB-Rated
Science & Technology
Multi-Cap Core
Core Bond
Alternative Long/Short Eqty Fds
Equity Income
Short-Intmdt Inv. Grade Debt
Alternative Long/Short Eqty Fds
Intl Multi-Cp Val Fds
Multi-Cap Value
Science & Technology
Minnesota Municipal Debt
Equity Income
China Region
Pacific Region
Emerging Markets
Emerging Markets
Emerging Markets
India Region
Pacific Ex Japan
Japanese
Pacific Ex Japan
Pacific Ex Japan
Dedicated Short Bias
Equity Leverage
Dedicated Short Bias
Equity Leverage
Intl Large-Cp Gro Fds
Specialty/Miscellaneous
Flexible Portfolio
Flexible Portfolio
Global Multi-Cap Core Fds
JMSI
BLLD
JPST
JMST
JMOM
JQUA
JVAL
JPMB
KDRN
KLDW
EQTY
KPOP
KHYB
KBND
KBA
KCCA
KGRO
KFVG
KBUY
KLIP
KWEB
KEM
KARS
KMET
KEMQ
KEUA
KSET
KRBN
KLXY
KTEC
KMLM
OBOR
KURE
KALL
KGRN
KEMX
IVOL
BNDD
KSEA
KDIV
KSTR
KVLE
TGLR
HDUS
HLGE
RODM
RODE
ROAM
ROSC
ROUS
ACTV
LSAT
LSAF
DYLD
SQEW
LCR
LGRO
MSVX
MSTB
MSTQ
RMIF
LCLG
MSMR
MAGG
CVRD
DIVL
MSTI
BUYW
INTL
SECT
TMAT
MINN
FDIV
MCH
ADVE
MEM
MEMX
EMSF
INDE
MINV
JPAN
MKOR
ASIA
JETD
JETU
CARD
CARU
MCSE
PP
MFUL
MKAM
MOHR
NAV
50.67
48.91
50.21
50.70
45.72
47.85
38.59
39.75
23.04
41.96
19.89
19.37
24.07
31.37
20.76
30.11
13.46
14.91
14.61
16.25
26.86
24.71
25.92
13.38
14.85
27.69
0.92
36.55
25.43
11.52
28.75
20.37
17.54
18.25
23.07
28.37
20.67
14.96
26.24
26.62
12.34
23.08
25.28
46.48
27.22
27.48
26.75
22.40
41.47
43.96
33.40
34.48
34.47
22.70
31.24
32.11
28.18
23.82
28.86
28.28
25.09
40.34
25.40
20.69
20.67
19.97
20.47
13.40
22.24
46.56
16.38
22.52
26.53
19.07
31.63
28.24
27.60
25.74
27.00
23.56
26.31
26.31
25.33
24.92
20.80
16.13
23.59
14.62
26.10
20.94
26.55
19.90
Net Assets
(MIL)
222.3
24.7
22388.4
2553.0
340.2
2864.2
753.2
662.6
1.1
125.0
902.8
3.1
15.3
3.1
301.5
269.2
1.4
11.1
5.4
120.2
5798.1
3.8
140.7
4.1
11.0
19.3
0.7
438.9
3.0
6.0
285.3
4.1
64.1
6.8
68.7
41.0
923.4
51.6
2.5
2.7
31.4
31.2
6.7
96.2
8.9
1495.5
18.2
19.9
35.6
389.9
87.1
132.8
140.5
78.2
125.3
70.7
65.1
26.7
118.5
6.1
31.8
55.1
38.6
48.3
81.7
64.2
58.5
337.1
98.1
1330.7
111.7
18.0
60.1
22.6
1.5
52.4
8.4
6.3
5.7
84.3
1.0
65.1
48.6
4.9
2.8
4.2
2.6
31.5
37.4
62.7
5.5
74.7
4th Qtr
Total Return
1 Year 3 Years*
6.35
15.44
1.83
1.57
11.84
11.13
12.32
9.20
5.39
10.03
10.48
8.15
5.86
3.47
-6.03
8.36
-1.82
-0.33
-9.98
6.27
-0.96
2.88
-5.25
-6.07
5.10
0.68
-58.44
4.47
8.70
-3.54
-11.32
-0.35
-1.26
-3.98
-7.48
12.98
1.24
6.46
8.18
7.74
-3.06
10.70
10.24
10.59
13.12
8.77
8.27
9.84
15.86
10.09
10.80
4.75
9.80
5.12
10.31
7.70
16.03
3.73
10.40
12.59
2.09
17.77
7.61
6.49
6.59
6.25
4.51
2.28
12.65
10.90
20.62
8.96
10.02
-5.23
6.76
7.27
9.87
2.17
8.48
6.00
8.48
10.92
1.85
-29.65
28.32
-16.14
-13.01
18.01
9.86
3.52
4.86
10.06
5.42
8.85
5.17
3.53
22.81
25.11
19.51
9.74
9.93
17.51
26.85
-0.87
3.72
1.55
-17.10
34.05
-11.85
-3.30
-22.12
N/A
-9.93
N/A
-7.10
-23.84
0.97
-4.01
-90.07
6.58
N/A
-11.21
-5.98
-7.93
-17.31
-10.87
-14.80
21.36
-5.39
3.84
N/A
13.10
-18.12
11.55
N/A
21.14
19.02
15.75
17.30
20.71
18.90
14.93
16.41
13.78
15.49
6.31
14.18
12.65
N/A
-0.53
16.73
42.82
N/A
35.49
18.52
N/A
N/A
N/A
N/A
11.97
18.35
21.03
32.42
5.26
N/A
-19.35
N/A
7.51
N/A
N/A
N/A
-1.83
N/A
15.39
N/A
N/A
N/A
N/A
N/A
14.79
48.58
2.37
N/A
3.43
-0.73
N/A
2.11
1.31
6.78
11.74
11.58
-3.43
N/A
0.86
8.38
N/A
-6.42
0.09
-14.46
N/A
N/A
-17.15
-17.55
N/A
-27.60
N/A
-11.10
N/A
-22.95
N/A
N/A
25.82
N/A
N/A
9.62
-5.35
-19.63
-15.65
-18.46
2.10
-6.22
N/A
N/A
N/A
N/A
10.30
N/A
N/A
N/A
3.18
5.06
4.07
11.63
9.77
5.21
7.36
7.13
N/A
2.65
5.29
N/A
1.63
3.59
N/A
N/A
7.19
N/A
N/A
N/A
N/A
N/A
7.47
N/A
10.84
N/A
N/A
N/A
N/A
N/A
N/A
N/A
N/A
N/A
N/A
N/A
-4.92
N/A
N/A
N/A
N/A
N/A
-2.88
N/A
N/A
N/A
N/A
Fund
Mohr Sector Nav ETF
Monarch Ambassador Inc
Monarch Blue Chips Core
Monarch ProCap
Morgan Dempsey LCV
MS Energy -3X Inv Lv
MS Energy 3X Leveraged
MS FANG+ ETN
MS FANG+ Idx -3X Inv Lev
MS FANG+ Index 2X Lev
MS FANG+ Index 3x Lev
MS Gold -3X Inv Lv
MS Gold 3X Lv
MS Gold Minrs -3X Inv Lv
MS Gold Minrs 3X Lv
MS O&G Expl & Pr -3X IL
MS O&G Expl & Pr 3X L
MS Sol FANG & Innov 3X
MS Sol FANG & Innov -3X
MS Travel -3X Inv Lev
MS Travel 3X Leveraged
MS US BB Idx -3X Inv Lev
MS US BB Idx 3X Lvrgd
MS US BO Idx -3X Inv Lev
MS US BO Idx 3X Lvrgd
MUSQ Global Music In
N/R Robust Momentum ETF
Natixis Loomis Sayles FG
Natixis LS Shrt Dur Inc
Natixis VN Mid Cap
Natixis VN Select
NEOS Enh Incm Aggrg Bd
NEOS Enh Incm Cash Alt
NEOS S&P 500 High Income
NETLease Corp Real Est
Neuberger Brmn Chn Eqty
Neuberger Brmn Glbl RE
Neuberger Cbn Tns & Infr
Neuberger Comm Strategy
Neuberger Disrupters
Neuberger NxtGen Con Cns
Nicholas Fixed Inc Alt
Nifty India Financials
Ntwd Dow Jones Rsk-Mgd I
Ntwd NASDAQ-100 RskMgd I
Ntwd Russ 2000 Rsk-Mgd I
Ntwd S&P 500 Rsk-Mgd I
Nuveen Dividend Growth
Nuveen Enh Yld US Aggr
Nuveen ESG 1-5 Y US AB
Nuveen ESG Dividend
Nuveen ESG Em Mkt Eqty
Nuveen ESG Hi Yld Crp Bd
Nuveen ESG Intl DM Eq
Nuveen ESG Large-Cap
Nuveen ESG Large-Cap Gro
Nuveen ESG Large-Cap Val
Nuveen ESG Mid-Cap Gro
Nuveen ESG Mid-Cap Val
Nuveen ESG Small-Cap
Nuveen ESG US Aggr
Nuveen Gl Net Zero Trans
Nuveen Growth Opps
Nuveen Short-Term REIT
Nuveen Small Cap Select
Nuveen W LC Gro ESG
OneAscent Core Plus Bond
OneAscent Emerging Mkt
OneAscent Intl Eqty
OneAscent Large Cap Core
Opt Rare Earth & Crit Mt
Optimize AI Sm S E-Drv
Opus Small Cap Value
Overlay Shs Core Bd ETF
Overlay Shs For Eqty ETF
Overlay Shs Hedged LC Eq
Overlay Shs LC Eqty ETF
Overlay Shs Muni Bd ETF
Overlay Shs SC Eqty ETF
Overlay Shs Short Tm Bd
Pacer Amer Enrgy Indpndc
Pacer BioThreat Strategy
Pacer BlStr Digital Ent
Pacer BlStr Engr the Ftr
Pacer CFRA-Stv EW SRI
Pacer Csh Cws Fd of Fds
Pacer CSOP FTSE Ch A50
Pacer Data & Digital Rev
Pacer Data & Infra RE
Pacer DM Intl CC 100
Pacer Em Mkt Csh Cws 100
Pacer Glbl Cash Cows Div
Data provided by
Description
ETF
Symbols
Specialty/Miscellaneous
Global Income
Large-Cap Core
Flexible Portfolio
Equity Income
Dedicated Short Bias
Equity Leverage
Science & Technology
Dedicated Short Bias
Equity Leverage
Equity Leverage
Commodities Prec Metals Fds
Commodities Prec Metals Fds
Dedicated Short Bias
Equity Leverage
Dedicated Short Bias
Equity Leverage
Equity Leverage
Dedicated Short Bias
Dedicated Short Bias
Equity Leverage
Dedicated Short Bias
Equity Leverage
Dedicated Short Bias
Equity Leverage
Consumer Services
Flexible Portfolio
Large-Cap Growth
Short Inv. Grade Debt
Mid-Cap Core
Multi-Cap Core
Specialty Fixed Income
Specialty Fixed Income
Alternative Long/Short Eqty Fds
Real Estate
China Region
Global Real Estate
Global Infrastructure
Commodities General
Science & Technology
Global Science/Technology Fds
General U.S. Treasury
India Region
Options Arbitrage/Opt Strat Fds
Options Arbitrage/Opt Strat Fds
Options Arbitrage/Opt Strat Fds
Options Arbitrage/Opt Strat Fds
Equity Income
Core Bond
Short-Intmdt Inv. Grade Debt
Equity Income
Emerging Markets
High Yield
Intl Large-Cp Core Fds
Large-Cap Core
Large-Cap Growth
Multi-Cap Value
Mid-Cap Growth
Mid-Cap Value
Small-Cap Core
Core Bond
Global Large-Cap Core Fds
Large-Cap Growth
Real Estate
Small-Cap Core
Large-Cap Growth
Core Plus Bond
Emerging Markets
Intl Large-Cp Core Fds
Large-Cap Core
Precious Metals Equity
Large-Cap Core
Small-Cap Core
Corporate Debt BBB-Rated
Intl Multi-Cp Core Fds
Large-Cap Core
Large-Cap Core
General & Insured Municipal Debt
Small-Cap Core
Short Inv. Grade Debt
Energy MLP
Health/Biotechnology
Global Science/Technology Fds
Global Science/Technology Fds
Multi-Cap Core
Multi-Cap Core
China Region
Global Science/Technology Fds
Real Estate
Intl Multi-Cp Val Fds
Emerging Markets
Global Equity Income
SNAV
MAMB
MBCC
MPRO
MDLV
WTID
WTIU
FNGS
FNGD
FNGO
FNGU
DULL
SHNY
GDXD
GDXU
OILD
OILU
BULZ
BERZ
FLYD
FLYU
BNKD
BNKU
NRGD
NRGU
MUSQ
ROMO
LSGR
LSST
VNMC
VNSE
BNDI
CSHI
SPYI
NETL
NBCE
NBGR
NBCT
NBCM
NBDS
NBCC
FIAX
INDF
NDJI
NUSI
NTKI
NSPI
NDVG
NUAG
NUSA
NUDV
NUEM
NUHY
NUDM
NULC
NULG
NULV
NUMG
NUMV
NUSC
NUBD
NTZG
NUGO
NURE
NSCS
NWLG
OACP
OAEM
OAIM
OALC
CRIT
OAIE
OSCV
OVB
OVF
OVLH
OVL
OVM
OVS
OVT
USAI
VIRS
ODDS
BULD
SZNE
HERD
AFTY
TRFK
SRVR
ICOW
ECOW
GCOW
NAV
27.48
22.33
28.98
26.84
24.08
22.69
16.23
37.77
5.83
45.98
233.17
17.92
27.65
4.05
33.48
20.53
35.23
105.34
3.92
3.41
42.72
6.18
24.26
230.19
413.09
25.19
26.40
28.07
23.95
32.70
30.74
48.35
49.91
48.19
25.01
23.84
27.74
24.87
20.65
25.15
22.52
19.71
34.95
21.04
22.47
19.25
21.50
28.06
21.06
23.04
25.73
27.10
21.06
29.47
38.92
69.40
35.89
42.32
31.52
39.07
22.22
29.48
25.50
30.88
24.61
26.01
22.96
29.25
30.41
24.94
18.76
29.04
33.56
20.60
23.14
28.91
37.64
22.03
32.73
21.69
28.82
32.33
20.18
22.33
36.40
36.74
13.66
36.63
29.85
31.21
20.09
34.24
Net Assets
(MIL)
53.4
60.7
57.9
100.0
12.8
3.7
2.6
160.7
172.2
207.0
2602.5
3.0
4.4
43.0
191.5
20.8
54.1
748.3
12.1
3.7
5.3
13.7
172.6
118.7
1538.1
13.7
39.5
5.6
21.4
3.4
30.4
4.7
254.6
473.0
63.9
4.5
5.7
25.4
274.7
10.7
5.3
53.7
7.2
23.9
414.6
12.2
16.8
10.3
34.7
32.0
12.2
229.5
100.7
390.6
24.6
1501.5
1557.4
430.0
358.4
1059.3
291.0
5.8
2740.2
43.6
5.9
6.2
109.8
32.0
83.9
56.0
2.1
0.6
209.4
44.6
14.5
93.3
132.0
13.6
8.0
58.6
46.6
3.8
0.8
0.8
45.8
73.4
4.3
5.4
503.3
1006.3
71.2
1749.6
4th Qtr
Total Return
1 Year 3 Years*
9.75
7.67
12.70
9.94
6.02
14.54
-23.40
18.20
-41.06
36.15
55.32
-27.92
28.78
-46.41
41.60
15.73
-23.83
68.44
-47.34
-39.59
40.83
-51.41
78.00
10.25
-17.52
9.34
8.62
14.27
3.03
15.95
10.95
6.91
1.57
5.93
17.48
-3.90
16.32
12.11
-4.11
15.47
11.56
2.31
8.45
8.94
13.32
2.61
9.43
11.23
7.42
3.48
11.65
6.20
7.60
11.22
11.94
16.30
9.52
15.71
13.36
13.34
6.53
9.47
14.76
15.04
11.61
18.50
6.85
10.80
8.62
11.34
4.64
6.57
10.88
7.86
11.39
8.80
12.78
7.90
16.14
5.31
6.54
8.55
9.25
18.81
12.79
7.10
-4.55
18.82
15.23
5.30
5.88
6.11
N/A
4.92
22.43
10.53
N/A
N/A
N/A
95.31
-90.12
235.42
439.09
N/A
N/A
-52.37
-20.85
-19.40
-32.49
395.61
-89.12
-75.13
111.78
-40.05
-4.79
-28.57
-15.65
N/A
11.12
N/A
5.73
16.93
22.48
6.80
6.24
18.41
3.36
-20.94
7.28
7.47
-6.11
38.41
19.26
3.66
19.82
12.65
31.51
5.57
18.88
15.14
7.30
5.17
10.17
9.07
12.17
17.89
22.29
42.55
7.51
20.34
8.27
15.50
5.48
16.61
45.87
12.99
17.76
43.50
5.83
17.69
16.90
22.09
-2.94
17.78
10.13
7.08
15.62
17.14
27.86
7.13
17.36
7.70
14.02
15.67
24.67
28.23
6.59
17.03
-11.67
67.07
6.97
18.64
15.90
13.69
N/A
N/A
N/A
N/A
N/A
N/A
N/A
10.90
-60.91
7.18
-6.67
N/A
N/A
-43.41
-49.15
N/A
N/A
N/A
N/A
N/A
N/A
-46.26
-1.56
-80.41
88.91
N/A
3.06
N/A
0.63
8.26
12.51
N/A
N/A
N/A
3.11
-16.46
1.49
N/A
12.57
N/A
N/A
N/A
8.66
N/A
1.07
N/A
N/A
N/A
-3.44
-0.69
N/A
-4.53
0.42
3.33
7.15
9.36
6.08
-0.90
6.54
3.86
-3.61
N/A
N/A
7.43
N/A
N/A
N/A
N/A
N/A
N/A
N/A
N/A
7.68
-3.46
1.33
N/A
9.63
-0.44
6.85
N/A
23.32
5.93
N/A
N/A
5.71
11.80
-14.22
N/A
-3.80
6.71
0.22
11.16
L42
BARRON’S
•
Funds Quarterly
January 8, 2024
ETF Score Card
For personal non-commercial use only. Do not edit or alter. Reproductions not permitted.
To reprint or license content, please contact Barron's reprints department at 800-843-0008 or www.djreprints.com
Fund
Pacer Indls & Logistics
Pacer Industrial RE
Pacer Lunt LC Alt
Pacer Lunt LC MF Alt
Pacer Lunt MC MF Alt
Pacer Meta US LC DM 300
Pacer Meta US LC DM 400
Pacer Pac Asst FR Hi Inc
Pacer Swan SOS Consv Apr
Pacer Swan SOS Consv Jan
Pacer Swan SOS Consv Jul
Pacer Swan SOS Consv Oct
Pacer Swan SOS Fd of Fds
Pacer Swan SOS Flex Apr
Pacer Swan SOS Flex Jan
Pacer Swan SOS Flex Jul
Pacer Swan SOS Flex Oct
Pacer Swan SOS Modt Apr
Pacer Swan SOS Modt Jan
Pacer Swan SOS Modt Jul
Pacer Swan SOS Modt Oct
Pacer Trendpilot 100 ETF
Pacer Trendpilot Eur Idx
Pacer Trendpilot Intl
Pacer Trendpilot US Bond
Pacer Trendpilot US LC
Pacer Trendpilot US MC
Pacer Trndplt Fd of Fds
Pacer US Cash Cows 100
Pacer US Cash Cows Gro
Pacer US Export Leaders
Pacer US Lg Cap CCGL
Pacer US SC Csh Cws 100
Pacer US Sm Cap CCGL
Pacer WealthShield
Panagram AAA CLO
Panagram BBB-B CLO
PGIM AAA CLO
PGIM Active Aggregate Bd
PGIM Active High Yld Bd
PGIM Floating Rate Inc
PGIM Jennison Foc Gro
PGIM Jennison Foc Val
PGIM Portfolio Ballast
PGIM Sh Dur Mul Sec Bd
PGIM Total Return Bond
PGIM Ultra Short Bond
PIMCO ETF:0-5Yr HY CB
PIMCO ETF:1-5 Yr US TIPS
PIMCO ETF:15+ Yr US TIPS
PIMCO ETF:25+ Yr US Tres
PIMCO ETF:Active Bond
PIMCO ETF:Broad US TIPS
PIMCO ETF:Comm Str Act
PIMCO ETF:En Low Dur Act
PIMCO ETF:Enh SM Act ESG
PIMCO ETF:Enh SM Act ETF
PIMCO ETF:Int Mu Bd Act
PIMCO ETF:Inv Gr Crp Bnd
PIMCO ETF:Mltsctr Bd Act
PIMCO ETF:Mu Inc Opp Act
PIMCO ETF:Pref CS Act
PIMCO ETF:ShTm Mu Bd Act
PIMCO ETF:Sr Loan Active
PIMCO ETF:Ult Sh Gvt Act
PIMCO:RAFI Dyn M-F EM Eq
PIMCO:RAFI Dyn M-F IntEq
PIMCO:RAFI Dyn M-F US Eq
PIMCO:RAFI ESG US
Pinnacle Focused Opps
PMV Adaptive Risk Parity
Point Bridge Amer First
Polen Capital Global Gro
Preferred Plus
Principal Active HY
Principal Foc Blue Chip
Principal Hlthcare Innov
Principal Inv Gr Crp Atv
Principal Quality
Principal RE Active Opps
Principal Spec PS Atv
Principal Spec Tx-Adv DA
Principal US Mega Cp
Principal US Sm Cp
Principal Value
Procure Dstr Rcvry Strat
Procure Space
ProShares:Big Data Refnr
ProShares:Bitcoin Strat
ProShares:Dcl of the RS
ProShares:DJ Bkfd Gl Inf
ProShares:Eqts for RR
Description
ETF
Symbols
Industrials
Real Estate
Multi-Cap Core
Large-Cap Core
Small-Cap Growth
Equity Income
Equity Income
Loan Participation
Options Arbitrage/Opt Strat Fds
Options Arbitrage/Opt Strat Fds
Options Arbitrage/Opt Strat Fds
Options Arbitrage/Opt Strat Fds
Options Arbitrage/Opt Strat Fds
Options Arbitrage/Opt Strat Fds
Options Arbitrage/Opt Strat Fds
Options Arbitrage/Opt Strat Fds
Options Arbitrage/Opt Strat Fds
Options Arbitrage/Opt Strat Fds
Options Arbitrage/Opt Strat Fds
Options Arbitrage/Opt Strat Fds
Options Arbitrage/Opt Strat Fds
Specialty/Miscellaneous
European Region
Intl Large-Cp Core Fds
Specialty Fixed Income
Large-Cap Core
Small-Cap Core
Large-Cap Core
Multi-Cap Value
Multi-Cap Core
Multi-Cap Core
Multi-Cap Growth
Small-Cap Core
Small-Cap Growth
Flexible Portfolio
Loan Participation
Loan Participation
Loan Participation
Core Bond
High Yield
Loan Participation
Large-Cap Growth
Large-Cap Value
Options Arbitrage/Opt Strat Fds
Short-Intmdt Inv. Grade Debt
Core Plus Bond
Ultra-Short Obligations
High Yield
Inflation Protected Bond
Inflation Protected Bond
General U.S. Treasury
Core Plus Bond
Inflation Protected Bond
Commodities General
Short Inv. Grade Debt
Ultra-Short Obligations
Ultra-Short Obligations
Interm. Municipal Debt
Corporate Debt BBB-Rated
Multi-Sector Income
Interm. Municipal Debt
Flexible Income
Short Municipal Debt
Loan Participation
Short U.S. Government
Emerging Markets
Intl Multi-Cp Val Fds
Multi-Cap Value
Large-Cap Value
Alternative Managed Futures Fds
Alternative Global Macro
Specialty/Miscellaneous
Global Large-Cap Growth Fds
Flexible Income
High Yield
Large-Cap Growth
Health/Biotechnology
Core Plus Bond
Multi-Cap Core
Real Estate
Flexible Income
Flexible Income
Large-Cap Core
Small-Cap Core
Multi-Cap Value
Industrials
Industrials
Science & Technology
Alternative Currency Strategies
Dedicated Short Bias
Global Infrastructure
Multi-Cap Value
SHPP
INDS
ALTL
PALC
PAMC
TRPL
QDPL
FLRT
PSCW
PSCX
PSCJ
PSCQ
PSFF
PSFM
PSFD
PSFJ
PSFO
PSMR
PSMD
PSMJ
PSMO
PTNQ
PTEU
PTIN
PTBD
PTLC
PTMC
TRND
COWZ
BUL
PEXL
COWG
CALF
CAFG
PWS
CLOX
CLOZ
PAAA
PAB
PHYL
PFRL
PJFG
PJFV
PBL
PSDM
PTRB
PULS
HYS
STPZ
LTPZ
ZROZ
BOND
TIPZ
CMDT
LDUR
EMNT
MINT
MUNI
CORP
PYLD
MINO
PRFD
SMMU
LONZ
BILZ
MFEM
MFDX
MFUS
RAFE
FCUS
ARP
MAGA
PCGG
IPPP
YLD
BCHP
BTEC
IG
PSET
BYRE
PREF
PQDI
USMC
PSC
PY
FIXT
UFO
DAT
BITO
EMTY
TOLZ
EQRR
NAV
26.93
41.77
33.62
40.93
37.12
40.12
33.06
47.14
23.20
24.45
23.27
24.15
25.84
26.01
28.89
25.18
25.89
24.84
25.85
24.96
25.21
65.37
24.89
27.42
20.50
43.28
32.85
29.69
51.97
36.27
45.72
23.83
48.03
23.88
27.05
25.31
26.37
50.56
42.45
34.79
50.27
72.42
57.28
25.79
50.67
41.94
49.39
93.22
51.15
56.49
84.91
92.44
53.30
25.64
94.84
97.92
99.81
52.75
97.02
25.56
45.47
48.34
50.06
50.65
100.61
19.18
29.10
41.92
32.53
24.30
25.15
41.77
10.50
9.54
18.84
28.48
36.37
20.91
61.09
24.09
17.44
18.02
46.78
45.94
43.40
30.74
18.67
32.81
20.50
14.25
45.71
53.81
Net Assets
(MIL)
1.0
193.3
416.3
267.0
38.5
1.0
191.7
155.5
10.8
11.5
10.1
7.1
203.1
18.3
22.5
24.4
12.6
33.4
38.3
49.1
41.9
1052.4
40.4
139.5
183.2
2351.7
355.9
50.7
16928.7
37.0
40.5
40.2
5011.2
4.3
23.4
45.6
162.7
159.6
44.1
107.8
49.1
62.5
11.5
28.5
26.5
118.6
5655.4
1181.0
601.1
769.7
1185.4
3812.5
116.6
203.2
961.0
166.1
10193.9
1276.1
932.6
184.6
98.1
70.0
552.4
255.7
113.9
90.9
201.0
128.3
41.9
18.0
22.8
19.0
23.3
11.3
135.5
27.5
41.0
69.7
32.5
8.2
707.3
20.4
1954.8
348.2
46.3
2.1
35.8
3.8
1464.1
10.5
150.5
26.5
4th Qtr
Total Return
1 Year 3 Years*
9.95
19.01
-1.93
11.43
7.96
11.14
10.58
3.74
6.96
6.03
7.74
6.70
7.18
8.15
9.08
8.18
7.46
6.78
6.45
7.40
6.53
7.80
3.39
7.86
7.09
9.69
6.20
7.73
5.73
1.84
10.07
11.70
15.47
15.28
3.33
2.18
4.19
2.36
7.02
7.07
3.61
15.80
10.45
7.86
3.66
7.34
1.78
5.52
2.70
8.79
18.85
6.62
4.43
-3.72
2.56
1.61
1.47
6.61
7.93
6.84
7.60
8.15
3.18
3.39
1.39
8.20
9.34
10.42
12.96
13.01
4.03
11.19
11.42
6.02
6.84
16.53
20.91
8.07
12.44
16.16
5.51
5.45
9.96
12.85
11.94
11.16
11.49
19.57
52.46
-14.23
11.29
7.20
21.09
17.10
-15.88
17.33
19.28
24.40
24.00
14.61
11.78
16.27
18.75
20.34
18.24
18.23
21.01
20.47
20.15
16.20
17.40
19.95
20.58
34.85
12.09
14.34
9.10
16.75
7.27
16.40
14.78
3.06
24.50
20.57
35.54
N/A
-3.55
N/A
N/A
N/A
6.24
12.45
13.67
54.52
18.47
14.22
N/A
7.65
6.29
11.76
4.28
0.51
0.81
6.33
3.57
N/A
4.85
5.71
6.19
6.07
8.79
N/A
8.57
N/A
4.44
12.96
N/A
14.38
17.13
12.22
18.74
21.22
3.65
10.42
N/A
15.04
13.08
N/A
7.91
7.29
23.84
10.79
7.12
6.23
31.29
18.52
9.10
27.15
-2.45
51.41
137.18
0.21
6.46
9.08
N/A
6.97
2.96
12.16
5.88
N/A
N/A
4.87
N/A
5.74
N/A
N/A
8.24
N/A
11.68
N/A
N/A
N/A
7.83
N/A
N/A
8.66
5.47
2.90
-4.45
10.93
1.16
3.67
17.91
4.62
8.77
N/A
17.33
N/A
-0.97
N/A
N/A
N/A
N/A
1.69
N/A
N/A
N/A
N/A
N/A
N/A
2.72
3.50
1.71
-9.73
-17.55
-3.32
-1.51
N/A
-0.02
1.78
1.69
-0.11
-2.94
N/A
N/A
N/A
0.73
N/A
N/A
0.79
5.22
9.50
10.04
N/A
N/A
13.47
N/A
-1.34
3.98
N/A
-14.44
-4.07
10.17
N/A
-1.11
-0.41
11.21
9.63
11.82
N/A
-8.06
N/A
N/A
-13.24
7.00
14.70
Fund
ProShares:Gl Lstd Prv Eq
ProShares:Hedge Repl ETF
ProShares:HY-IR Hdgd
ProShares:Inflation Expc
ProShares:Inv Grd IR Hdg
ProShares:K1 Fr Crd Oil
ProShares:LgCp Core +
ProShares:Lng OL/Sh Str
ProShares:Merger ETF
ProShares:Metaverse ETF
ProShares:MSCI EAFE DG
ProShares:MSCI EM Div Gr
ProShares:MSCI Eur Dv Gr
ProShares:MSCI Trnsfm Ch
ProShares:Nanotechnology
ProShares:Nas100 DW Mom
ProShares:On-Demand
ProShares:Online Retail
ProShares:Pet Care
ProShares:Russ 2000 DG
ProShares:Russ US DG
ProShares:S&P 500 Bond
ProShares:S&P 500 Dv Art
ProShares:S&P 500 Ex-Eng
ProShares:S&P 500 Ex-Fnl
ProShares:S&P 500 Ex-HC
ProShares:S&P 500 Ex-Tch
ProShares:S&P Glbl CBM
ProShares:S&P Kensho CT
ProShares:S&P Kensho SF
ProShares:S&P MC400 D Ar
ProShares:S&P Tch Dv Art
ProShares:SC Logistics
ProShares:Sh 7-10 Yr Trs
ProShares:Sh Bitcoin Str
ProShares:Short Dow30
ProShares:Short S&P500
ProShares:Sht 20+ Treas
ProShares:Sht Financials
ProShares:Sht FTSE Ch 50
ProShares:Sht High Yield
ProShares:Sht MC400
ProShares:Sht MSCI EAFE
ProShares:Sht MSCI EM
ProShares:Sht QQQ
ProShares:Sht Real Est
ProShares:Sht Rus2000
ProShares:Sht SC600
ProShares:Smrt Materials
ProShares:Ul PrSh S&P500
ProShares:Ul Sht S&P500
ProShares:UlS 20+ Yr Trs
ProShares:UlS 7-10Y Trs
ProShares:UlS Cons Disc
ProShares:UlS Cons Stp
ProShares:UlS Dow30
ProShares:UlS Energy
ProShares:UlS Finl
ProShares:UlS FTSE Ch 50
ProShares:UlS FTSE Euro
ProShares:UlS Hlth Cr
ProShares:UlS Indust
ProShares:UlS Mat
ProShares:UlS MC400
ProShares:UlS MSCI Brz
ProShares:UlS MSCI EAFE
ProShares:UlS MSCI EM
ProShares:UlS MSCI Jpn
ProShares:UlS Nasdaq Bio
ProShares:UlS QQQ
ProShares:UlS Rl Est
ProShares:UlS Rus2000
ProShares:UlS SC600
ProShares:UlS Semicond
ProShares:UlS Tech
ProShares:UlS Util
ProShares:Ult 20+ Yr Tr
ProShares:Ult 7-10 Yr Tr
ProShares:Ult Comm Svc
ProShares:Ult Cons Disc
ProShares:Ult Cons Stp
ProShares:Ult Energy
ProShares:Ult Finl
ProShares:Ult FTSE Ch 50
ProShares:Ult FTSE Euro
ProShares:Ult Hi Yld
ProShares:Ult Hlth Cr
ProShares:Ult Indust
ProShares:Ult Mat
ProShares:Ult MC400
ProShares:Ult MSCI Braz
ProShares:Ult MSCI EAF
Data provided by
Description
ETF
Symbols
Global Small-/Mid-Cap
Alternative Long/Short Eqty Fds
High Yield
Inflation Protected Bond
Inflation Protected Bond
Commodities Energy
Alternative Act Extension Fds
Alternative Long/Short Eqty Fds
Alternative Event Driven
Science & Technology
Intl Multi-Cp Gro Fds
Intl Equity Income Fds
Intl Equity Income Fds
Global Multi-Cap Growth Fds
Global Science/Technology Fds
Large-Cap Growth
Consumer Services
Consumer Services
Specialty/Miscellaneous
Small-Cap Core
Equity Income
Corporate Debt BBB-Rated
Multi-Cap Value
Large-Cap Core
Large-Cap Core
Large-Cap Core
Large-Cap Value
Precious Metals Equity
Alternative Energy
Science & Technology
Small-Cap Core
Science & Technology
Global Infrastructure
Specialty Fixed Income
Dedicated Short Bias
Dedicated Short Bias
Dedicated Short Bias
Specialty Fixed Income
Dedicated Short Bias
Dedicated Short Bias
Specialty Fixed Income
Dedicated Short Bias
Dedicated Short Bias
Dedicated Short Bias
Dedicated Short Bias
Dedicated Short Bias
Dedicated Short Bias
Dedicated Short Bias
Industrials
Dedicated Short Bias
Dedicated Short Bias
Specialty Fixed Income
Specialty Fixed Income
Dedicated Short Bias
Dedicated Short Bias
Dedicated Short Bias
Dedicated Short Bias
Dedicated Short Bias
Dedicated Short Bias
Dedicated Short Bias
Dedicated Short Bias
Dedicated Short Bias
Dedicated Short Bias
Dedicated Short Bias
Dedicated Short Bias
Dedicated Short Bias
Dedicated Short Bias
Dedicated Short Bias
Dedicated Short Bias
Dedicated Short Bias
Dedicated Short Bias
Dedicated Short Bias
Dedicated Short Bias
Dedicated Short Bias
Dedicated Short Bias
Dedicated Short Bias
Specialty Fixed Income
Specialty Fixed Income
Equity Leverage
Equity Leverage
Equity Leverage
Equity Leverage
Equity Leverage
Equity Leverage
Equity Leverage
Specialty Fixed Income
Equity Leverage
Equity Leverage
Equity Leverage
Equity Leverage
Equity Leverage
Equity Leverage
PEX
HDG
HYHG
RINF
IGHG
OILK
CSM
CLIX
MRGR
VERS
EFAD
EMDV
EUDV
ANEW
TINY
QQQA
OND
ONLN
PAWZ
SMDV
TMDV
SPXB
NOBL
SPXE
SPXN
SPXV
SPXT
ION
CTEX
MAKX
REGL
TDV
SUPL
TBX
BITI
DOG
SH
TBF
SEF
YXI
SJB
MYY
EFZ
EUM
PSQ
REK
RWM
SBB
TINT
SPXU
SDS
TBT
PST
SCC
SZK
DXD
DUG
SKF
FXP
EPV
RXD
SIJ
SMN
MZZ
BZQ
EFU
EEV
EWV
BIS
QID
SRS
TWM
SDD
SSG
REW
SDP
UBT
UST
LTL
UCC
UGE
DIG
UYG
XPP
UPV
UJB
RXL
UXI
UYM
MVV
UBR
EFO
NAV
28.18
48.70
62.87
31.57
75.29
42.30
54.75
38.12
40.20
42.27
38.76
44.30
47.51
38.32
41.85
39.26
24.68
36.07
52.84
64.97
46.89
76.73
95.17
101.85
102.33
100.65
77.32
32.17
27.08
38.13
73.56
69.51
40.53
28.52
13.14
29.71
12.99
22.11
11.37
19.04
17.24
21.47
17.16
14.18
9.48
18.28
21.08
15.98
34.12
8.62
29.95
30.28
22.14
15.31
15.29
33.95
11.64
14.72
39.11
8.59
11.92
11.35
8.18
12.59
10.03
8.46
19.79
12.18
18.05
10.61
14.29
11.66
18.53
5.04
8.10
12.48
22.41
45.47
50.78
35.96
15.75
36.72
55.15
13.76
58.58
68.10
91.42
28.78
24.98
57.87
34.02
42.89
Net Assets
(MIL)
8.0
32.4
119.9
30.9
292.7
132.7
392.5
21.6
12.0
6.5
88.7
15.1
8.7
8.1
2.9
11.3
0.6
99.0
78.9
756.3
9.0
11.1
11279.1
38.6
46.8
17.9
38.6
2.2
4.6
0.9
1474.0
250.7
1.9
27.9
55.2
184.2
1534.3
165.6
21.5
7.5
180.5
10.5
54.3
26.7
678.0
36.7
290.4
11.6
1.6
807.6
761.7
422.6
25.2
2.0
2.0
79.0
15.4
20.1
21.0
46.1
2.1
3.3
2.1
2.5
8.2
1.5
6.8
4.2
4.6
381.5
47.9
80.6
3.0
7.4
4.0
1.7
80.7
15.6
1.9
13.7
5.3
108.0
559.4
8.1
4.0
24.0
77.1
15.2
38.1
132.5
4.9
8.4
4th Qtr
Total Return
1 Year 3 Years*
10.78
3.54
4.62
-5.36
3.22
-11.88
12.62
8.52
2.71
20.41
11.39
3.20
13.01
11.82
19.37
16.87
14.63
16.58
18.17
16.00
8.92
8.97
8.22
12.57
11.10
12.46
9.58
-0.28
7.31
15.03
11.20
12.32
9.62
-4.20
-37.13
-9.63
-8.65
-10.47
-10.92
7.81
-5.22
-9.29
-8.18
-6.10
-11.30
-15.05
-11.46
-12.51
11.87
-26.36
-17.82
-21.48
-9.30
-19.05
-7.99
-19.76
13.94
-21.77
13.15
-20.19
-9.60
-20.32
-15.69
-19.17
-29.31
-17.60
-13.17
-13.23
-18.65
-22.75
-29.55
-23.78
-25.17
-33.19
-27.08
-15.12
23.90
11.21
20.25
20.52
8.64
-14.93
26.96
-17.12
22.70
13.07
10.84
24.82
17.32
21.23
34.63
19.39
22.95
7.22
14.61
1.13
11.68
-0.44
23.14
28.85
4.73
51.13
11.96
-0.63
20.70
22.62
47.60
24.61
26.60
27.31
12.61
8.89
2.36
8.78
8.06
27.64
28.48
30.70
16.11
-14.28
-10.32
26.05
5.41
27.18
23.09
3.65
-66.18
-7.02
-14.82
2.23
-8.80
12.64
-5.67
-9.37
-10.37
-3.71
-32.06
-6.25
-10.47
-10.37
20.05
-45.96
-31.53
-2.55
3.01
-44.41
-2.89
-18.79
-2.20
-21.86
12.77
-30.92
3.29
-24.14
-20.69
-23.45
-49.04
-25.58
-12.82
-28.40
-6.34
-57.25
-18.81
-26.84
-25.77
-78.77
-61.29
18.83
-3.64
0.00
62.11
61.36
2.49
-13.05
21.91
-34.59
32.15
17.64
-3.19
27.22
17.87
22.33
50.38
26.58
5.25
0.34
6.00
8.34
3.74
27.40
10.32
-25.57
1.87
N/A
-1.60
-6.40
2.54
-2.44
N/A
N/A
N/A
-21.92
-9.27
6.91
6.25
-3.76
8.23
9.07
9.85
10.12
7.99
N/A
N/A
N/A
8.05
11.10
N/A
7.66
N/A
-7.40
-8.65
14.07
-9.39
10.34
-1.24
-8.49
-4.02
4.66
-11.36
-5.65
-4.57
-8.71
N/A
-32.33
-20.11
24.95
14.14
-12.34
-3.92
-17.37
-56.18
-21.66
7.05
-18.38
-13.49
-16.20
-25.23
-20.74
-32.88
-11.65
4.30
-4.95
-8.04
-26.82
-15.60
-15.38
-21.82
-54.38
-33.42
-11.35
-27.92
-13.69
10.27
-6.02
-8.05
61.54
11.56
-42.09
3.57
-1.35
6.70
4.76
11.88
7.38
-1.10
0.05
January 8, 2024
BARRON’S
•
L43
Funds Quarterly
ETF Score Card
For personal non-commercial use only. Do not edit or alter. Reproductions not permitted.
To reprint or license content, please contact Barron's reprints department at 800-843-0008 or www.djreprints.com
Fund
ProShares:Ult MSCI EM
ProShares:Ult MSCI Jpn
ProShares:Ult Nasdaq Bio
ProShares:Ult Nasdaq CC
ProShares:Ult Nasdaq Cs
ProShares:Ult QQQ
ProShares:Ult Real Est
ProShares:Ult Rus2000
ProShares:Ult SC600
ProShares:Ult Semicond
ProShares:Ult Tech
ProShares:Ult Util
ProShares:UltP Dow30
ProShares:UltP MidCap400
ProShares:UltP QQQ
ProShares:UltP Rus2000
ProShares:UltP Sht Dow30
ProShares:UltP Sht QQQ
ProShares:UltPro S&P500
ProShares:UltPSh MdCp400
ProShares:UltPSh Rus2000
ProShares:Ultra Dow30
ProShares:Ultra S&P500
ProShares:UPSh 20+ Trs
ProShs II:ShVIX STF ETF
ProShs II:UlS Blm CrO
ProShs II:UlS Blm Nat Gs
ProShs II:UlS Euro
ProShs II:UlS Gold
ProShs II:UlS Yen
ProShs II:Ult Blm CrO
ProShs II:Ult Blm Nat Gs
ProShs II:Ult Euro
ProShs II:Ult Gold
ProShs II:Ult Silver
ProShs II:Ult Yen
ProShs II:UltVIX STF ETF
ProShs II:VIX MT Fut ETF
ProShs II:VIX ST Fut ETF
Putnam BDC Income
Putnam BioRevolution
Putnam Em Mkts ex-China
Putnam ESG Core Bond
Putnam ESG High Yield
Putnam ESG Ultra Short
Putnam Focused LC Growth
Putnam Focused LC Value
Putnam PanAgora ESG EM E
Putnam PanAgora ESG IE
Putnam Sustainable Futr
Putnam Sustainable Ldrs
Q3 All-Season Active Rot
QRAFT AI-Enhanced US LC
QRAFT AI-Enhanced US LCM
QRAFT AI-Enhanced US NV
QRAFT AI-Pilot US LCDB&I
R3 Global Dividend Gro
Range Cancer Thrptcs
Rareview Dynamic Fxd Inc
Rareview Inflation/Defl
Rareview Systematic Eqty
Rareview Tax Adv Inc
Rayliant Qtmtl EM exCh E
Rayliant Quanta Chn Eqty
Rayliant Quantv Devd ME
RBB:F/m Opportunistic In
RBB:MF Cap Eff 100 Index
RBB:MF Next Index
RBB:MF Small-Cap Growth
RBB:Motley Fool 100 Idx
RBB:Mtly Fool Glbl Opps
RBB:Mtly Fool Mid-Cp Gro
RBB:SGI Dynamic Tactical
RBB:SGI US Large Cap Cr
RBB:US Treas 10 Yr Note
RBB:US Treas 12 Month Bl
RBB:US Treas 2 Yr Note
RBB:US Treas 20 Yr Bond
RBB:US Treas 3 Month Bl
RBB:US Treas 3 Yr Note
RBB:US Treas 30 Yr Bond
RBB:US Treas 5 Yr Note
RBB:US Treas 6 Month Bl
RBB:US Treas 7 Yr Note
Regents Park Hdg Mkt Str
Relative Sntmnt Tact All
Renaissance Intl IPO ETF
Renaissance IPO ETF
Return Stckd Bds & Mgd F
Return Stckd US S & MF
Reverb
RH Tactical Outlook
Description
ETF
Symbols
Equity Leverage
Equity Leverage
Equity Leverage
Equity Leverage
Equity Leverage
Equity Leverage
Equity Leverage
Equity Leverage
Equity Leverage
Equity Leverage
Equity Leverage
Equity Leverage
Equity Leverage
Equity Leverage
Equity Leverage
Equity Leverage
Dedicated Short Bias
Dedicated Short Bias
Equity Leverage
Dedicated Short Bias
Dedicated Short Bias
Equity Leverage
Equity Leverage
Specialty Fixed Income
Dedicated Short Bias
Commodities Specialty
Commodities Specialty
Alternative Currency Strategies
Commodities Specialty
Alternative Currency Strategies
Commodities Specialty
Commodities Specialty
Alternative Currency Strategies
Commodities Specialty
Commodities Specialty
Alternative Currency Strategies
Equity Leverage
Specialty/Miscellaneous
Specialty/Miscellaneous
Financial Services
Health/Biotechnology
Emerging Markets
Core Bond
High Yield
Short U.S. Government
Large-Cap Growth
Large-Cap Value
Emerging Markets
Intl Large-Cp Core Fds
Multi-Cap Growth
Large-Cap Core
Flexible Portfolio
Multi-Cap Core
Multi-Cap Growth
Multi-Cap Value
Large-Cap Core
Global Equity Income
Health/Biotechnology
Multi-Sector Income
Inflation Protected Bond
Alternative Long/Short Eqty Fds
General & Insured Municipal Debt
Emerging Markets
China Region
Global Multi-Cap Core Fds
General Bond
Large-Cap Growth
Mid-Cap Growth
Small-Cap Growth
Large-Cap Growth
Global Multi-Cap Growth Fds
Mid-Cap Growth
Flexible Portfolio
Large-Cap Core
General U.S. Treasury
Short U.S. Treasury
Short U.S. Treasury
General U.S. Treasury
Short U.S. Treasury
General U.S. Treasury
General U.S. Treasury
General U.S. Treasury
Short U.S. Treasury
General U.S. Treasury
Large-Cap Core
Flexible Portfolio
Intl Multi-Cp Gro Fds
Multi-Cap Growth
Alternative Multi-Strategy
Alternative Multi-Strategy
Multi-Cap Core
Multi-Cap Growth
EET
EZJ
BIB
SKYU
UCYB
QLD
URE
UWM
SAA
USD
ROM
UPW
UDOW
UMDD
TQQQ
URTY
SDOW
SQQQ
UPRO
SMDD
SRTY
DDM
SSO
TTT
SVXY
SCO
KOLD
EUO
GLL
YCS
UCO
BOIL
ULE
UGL
AGQ
YCL
UVXY
VIXM
VIXY
PBDC
SYNB
PEMX
PCRB
PHYD
PULT
PGRO
PVAL
PPEM
PPIE
PFUT
PLDR
QVOY
QRFT
AMOM
NVQ
AIDB
GDVD
CNCR
RDFI
FLTN
RSEE
RTAI
RAYE
RAYC
RAYD
XFIX
TMFE
TMFX
TMFS
TMFC
TMFG
TMFM
DYTA
SGLC
UTEN
OBIL
UTWO
UTWY
TBIL
UTRE
UTHY
UFIV
XBIL
USVN
RPHS
MOOD
IPOS
IPO
RSBT
RSST
RVRB
RHTX
NAV
50.74
36.39
57.10
21.68
39.36
75.97
63.51
38.03
24.84
54.46
52.99
53.02
74.29
22.31
50.66
46.41
18.41
13.47
54.68
13.49
30.23
79.15
65.01
61.16
103.39
20.75
96.11
29.16
26.39
68.88
26.28
28.55
11.86
63.83
27.29
27.46
8.44
16.74
15.50
31.62
29.11
45.96
49.08
50.89
50.21
28.95
31.49
19.89
21.43
21.82
27.09
27.48
43.98
33.30
33.08
27.27
23.46
13.52
22.67
20.32
26.11
20.87
22.98
12.84
24.94
51.81
20.70
16.85
30.62
44.66
27.87
25.32
27.06
29.68
45.06
49.92
48.31
47.66
49.85
49.39
47.27
49.16
49.95
48.76
8.96
26.64
14.04
37.70
17.32
20.17
24.83
13.77
Net Assets
(MIL)
15.6
6.5
74.8
3.1
2.0
5126.4
59.2
169.9
25.5
323.7
599.1
12.2
620.2
25.2
18667.9
278.2
402.0
3775.6
2703.7
4.4
158.8
362.8
3646.4
51.9
322.3
172.3
82.6
40.3
10.7
30.1
641.9
857.1
7.5
182.4
428.1
23.8
387.9
37.3
173.6
46.9
4.7
6.6
469.7
107.3
105.7
43.3
236.4
20.5
136.0
188.7
399.0
71.7
5.2
14.4
4.7
3.2
28.3
11.3
37.6
20.7
34.1
19.5
37.2
78.0
56.9
27.6
23.4
25.6
73.2
605.4
423.8
186.9
105.1
102.5
123.8
199.9
365.0
18.9
2698.2
3.4
4.8
8.7
580.2
3.3
62.6
12.7
5.6
180.5
42.9
26.4
3.6
11.2
4th Qtr
Total Return
1 Year 3 Years*
13.48
13.36
18.92
29.71
37.01
28.17
36.58
25.98
28.40
41.57
35.15
14.11
38.54
30.95
42.88
37.43
-28.55
-32.76
33.25
-29.30
-35.25
25.18
22.06
-32.31
19.87
23.11
56.38
-7.23
-17.89
-8.26
-25.44
-47.13
9.06
21.02
10.21
9.80
-47.93
-13.83
-33.53
5.55
9.17
12.24
6.70
6.95
1.82
15.77
8.99
7.70
10.29
17.60
14.15
6.99
11.73
13.12
7.40
10.07
10.39
23.53
9.94
3.23
6.05
16.33
10.19
-6.88
8.31
6.85
14.31
14.29
9.83
13.72
12.23
9.42
9.51
11.62
6.58
1.84
2.41
10.21
1.34
3.11
12.27
4.35
1.43
5.41
8.63
7.05
1.83
17.93
-1.03
4.01
11.83
6.14
6.92
31.02
-1.28
104.87
70.07
117.08
11.16
22.45
20.83
229.19
130.09
-22.33
32.59
26.82
198.20
24.31
-28.80
-73.63
68.43
-38.21
-42.05
24.30
46.47
-11.25
76.11
-13.28
255.99
-0.99
-15.14
28.34
-13.15
-92.14
5.23
15.89
-14.06
-20.49
-87.72
-44.97
-72.81
30.29
12.25
N/A
N/A
N/A
N/A
45.03
18.34
N/A
N/A
30.07
27.36
17.33
24.15
27.04
6.80
N/A
8.67
-1.98
8.69
-6.34
10.54
4.41
22.24
-21.75
15.46
N/A
41.08
17.93
25.14
46.72
28.08
21.77
N/A
N/A
3.11
4.71
3.47
N/A
5.12
N/A
N/A
N/A
N/A
N/A
11.72
12.53
-17.18
52.36
N/A
N/A
26.82
7.57
-18.52
-7.40
-12.81
N/A
N/A
9.79
1.79
-5.09
5.31
28.25
13.94
-0.56
13.99
3.47
4.47
-15.85
-27.70
-42.71
12.93
-34.73
-28.81
12.35
12.76
31.93
35.65
-55.29
-53.44
8.98
-5.66
26.64
42.42
-59.19
-9.11
-1.88
-18.66
-22.86
-80.08
-23.05
-61.67
N/A
N/A
N/A
N/A
N/A
N/A
N/A
N/A
N/A
N/A
N/A
N/A
N/A
5.41
1.96
9.45
N/A
N/A
-22.83
0.48
N/A
N/A
-3.64
N/A
-18.49
N/A
N/A
N/A
N/A
-6.42
8.53
-0.28
-2.55
N/A
N/A
N/A
N/A
N/A
N/A
N/A
N/A
N/A
N/A
N/A
N/A
N/A
N/A
-27.40
-16.35
N/A
N/A
N/A
1.58
Fund
RH Tactical Rotation
RiverFront Dyn Core Inc
RiverFront Dyn US Dv Adv
RiverNorth Enh Pre-Mrgr
RiverNorth Patriot
Rndhll Acquirers Dp Val
Robo Gl HC Tech & Innov
Robo Glbl Art Intel
Robo Glbl Robots & Auto
Roundhill Alerian LNG
Roundhill Ball Metaverse
Roundhill Cannabis ETF
Roundhill Gen AI & Tech
Roundhill Mgfcnt Svn
Roundhill S&P Global Lux
Roundhill Sports B & iG
Roundhill Video Games
Royce Quant SC Qlty Val
Running Oak Eff Gr
Saba Closed-End
SB&H Trust:Select Equity
Schwab Str:1000 Index
Schwab Str:1-5 Corp Bd
Schwab Str:5-10 Corp Bd
Schwab Str:Ariel ESG ETF
Schwab Str:Crypto Thmtc
Schwab Str:EM Eqty ETF
Schwab Str:Fund EM LCI
Schwab Str:Fund Intl LCI
Schwab Str:Fund Intl SCI
Schwab Str:Fund US BMI
Schwab Str:Fund US LCI
Schwab Str:Fund US SCI
Schwab Str:High Yield Bd
Schwab Str:Intl Div Eqty
Schwab Str:Intl Eqty ETF
Schwab Str:Intl SCEq ETF
Schwab Str:IT US Tr ETF
Schwab Str:LT US Trsry
Schwab Str:Municipal Bd
Schwab Str:ST US Tr ETF
Schwab Str:US Agg Bd ETF
Schwab Str:US Br Mkt ETF
Schwab Str:US Div Eq ETF
Schwab Str:US LC Gro ETF
Schwab Str:US LC Val ETF
Schwab Str:US Lg Cap ETF
Schwab Str:US Md Cp ETF
Schwab Str:US REIT ETF
Schwab Str:US Sm Cap ETF
Schwab Str:US TIPS ETF
SEI Enh Low Vol US LC
SEI Enh US LC Momtm Fctr
SEI Enh US LC Qlty Fctr
SEI Enh US LC Value Fctr
Sel Sector:C Dsc SPDR
Sel Sector:C Stp SPDR
Sel Sector:Comm Svc SPDR
Sel Sector:Energy SPDR
Sel Sector:Finl S SPDR
Sel Sector:H Care SPDR
Sel Sector:Indust SPDR
Sel Sector:Matrls SPDR
Sel Sector:Rl Est SPDR
Sel Sector:Tech SPDR
Sel Sector:Util SPDR
Simplify:Aggregate Bond
Simplify:BTC Str + I
Simplify:Comm Str No K-1
Simplify:Enhanced Income
Simplify:Health Care
Simplify:Hedged Equity
Simplify:HiYld+ Cr Hdg
Simplify:Int Trm Trs Ft
Simplify:Intrst Rt Hdg
Simplify:Macro Strategy
Simplify:Mgd Fut Strat
Simplify:Mkt Ntr Eqt L/S
Simplify:Multi-QIS Alt
Simplify:Opp Income
Simplify:Propel Opps
Simplify:ShTm Trs FS
Simplify:Stable Income
Simplify:Tail Risk Strat
Simplify:US Eqty + Convx
Simplify:US Eqty + DC
Simplify:US Eqty + GBTC
Simplify:US Eqty + UC
Simplify:Volatility Prem
Simplify:Volt RoboCar DT
Siren:DIVCON Div Dfndr
Siren:DIVCON Leaders Div
Data provided by
Description
ETF
Symbols
Multi-Cap Core
Multi-Sector Income
Equity Income
Alternative Event Driven
Mid-Cap Core
Small-Cap Core
Global Health/Biotechnology Fds
Global Science/Technology Fds
Global Science/Technology Fds
Global Natural Resources
Consumer Services
Specialty/Miscellaneous
Global Science/Technology Fds
Science & Technology
Consumer Services
Consumer Services
Consumer Services
Small-Cap Core
Large-Cap Core
Flexible Portfolio
Multi-Cap Core
Large-Cap Core
Short-Intmdt Inv. Grade Debt
Corporate Debt BBB-Rated
Mid-Cap Core
Specialty/Miscellaneous
Emerging Markets
Emerging Markets
Intl Multi-Cp Val Fds
Intl Sm/Md-Cp Core Fds
Multi-Cap Value
Multi-Cap Value
Small-Cap Core
High Yield
Intl Equity Income Fds
Intl Large-Cp Core Fds
Intl Sm/Md-Cp Gro Fds
General U.S. Treasury
General U.S. Treasury
General & Insured Municipal Debt
Short U.S. Treasury
Core Bond
Multi-Cap Core
Equity Income
Large-Cap Growth
Multi-Cap Value
Large-Cap Core
Mid-Cap Core
Real Estate
Small-Cap Core
Inflation Protected Bond
Multi-Cap Value
Multi-Cap Core
Multi-Cap Growth
Multi-Cap Value
Consumer Services
Consumer Goods
Telecommunication
Natural Resources
Financial Services
Health/Biotechnology
Industrials
Basic Materials
Real Estate
Science & Technology
Utility
Corporate Debt BBB-Rated
Alternative Currency Strategies
Alternative Managed Futures Fds
General U.S. Treasury
Health/Biotechnology
Options Arbitrage/Opt Strat Fds
High Yield
General U.S. Treasury
Inflation Protected Bond
Mixed-Asset Trgt Alloc Mod Fds
Alternative Managed Futures Fds
Alternative Eq Mrkt Neutral Fds
Alternative Multi-Strategy
General Bond
Health/Biotechnology
General U.S. Treasury
General U.S. Treasury
Options Arbitrage/Opt Strat Fds
Options Arbitrage/Opt Strat Fds
Options Arbitrage/Opt Strat Fds
Multi-Cap Core
Options Arbitrage/Opt Strat Fds
Alternative Managed Futures Fds
Global Science/Technology Fds
Alternative Long/Short Eqty Fds
Multi-Cap Core
RHRX
RFCI
RFDA
SPCZ
FLDZ
DEEP
HTEC
THNQ
ROBO
LNGG
METV
WEED
CHAT
MAGS
LUXX
BETZ
NERD
SQLV
RUNN
CEFS
USSE
SCHK
SCHJ
SCHI
SAEF
STCE
SCHE
FNDE
FNDF
FNDC
FNDB
FNDX
FNDA
SCYB
SCHY
SCHF
SCHC
SCHR
SCHQ
SCMB
SCHO
SCHZ
SCHB
SCHD
SCHG
SCHV
SCHX
SCHM
SCHH
SCHA
SCHP
SELV
SEIM
SEIQ
SEIV
XLY
XLP
XLC
XLE
XLF
XLV
XLI
XLB
XLRE
XLK
XLU
AGGH
MAXI
HARD
HIGH
PINK
HEQT
CDX
TYA
PFIX
FIG
CTA
EQLS
QIS
CRDT
SURI
TUA
BUCK
CYA
SPYC
SPD
SPBC
SPUC
SVOL
VCAR
DFND
LEAD
NAV
12.92
22.61
47.70
25.62
24.01
36.29
28.08
41.19
57.49
24.48
11.54
30.14
30.92
33.35
25.19
17.41
15.73
41.15
28.06
18.79
26.36
46.03
48.34
44.98
23.35
31.74
24.77
27.17
33.77
34.91
61.04
61.90
55.31
52.03
24.67
37.00
34.99
49.72
35.07
52.47
48.43
46.64
55.64
76.12
82.98
70.06
56.39
75.27
20.70
47.25
52.16
25.87
27.91
30.39
28.17
178.81
72.00
72.65
83.82
37.62
136.32
113.91
85.54
40.05
192.44
63.36
22.05
18.98
23.30
24.53
27.35
25.23
22.79
14.26
39.82
22.95
23.52
22.16
24.78
25.63
20.66
23.15
24.95
0.18
30.88
28.76
28.58
33.00
22.76
9.59
39.24
60.90
Net Assets
(MIL)
22.7
25.7
73.1
6.1
3.2
36.2
62.0
110.1
1293.6
0.7
432.3
3.0
61.4
17.4
1.2
99.6
21.5
27.6
69.1
145.3
37.9
3030.2
384.3
5472.7
17.6
14.3
8376.3
5170.3
11306.2
3046.4
596.7
12493.8
6849.4
66.2
776.7
32831.5
3802.6
7600.4
526.7
221.9
11965.5
7089.9
23809.8
48880.6
21543.7
9856.2
35108.5
9905.4
6130.7
14125.6
11611.9
8.9
30.7
18.4
32.0
17551.9
15678.9
14786.9
37500.2
32566.5
37087.7
14624.7
5447.9
4833.1
55346.9
13812.6
134.2
32.1
9.4
206.4
50.3
112.9
56.4
49.1
198.8
31.7
160.5
113.6
118.2
64.5
87.8
786.1
23.1
8.4
65.0
84.5
6.0
4.7
543.0
4.3
9.8
46.8
4th Qtr
Total Return
1 Year 3 Years*
6.44
6.55
9.81
0.16
10.73
10.64
10.86
21.04
14.08
0.37
21.70
-9.24
14.43
12.60
9.28
9.08
14.21
14.76
10.70
10.81
9.56
11.97
4.08
8.32
14.80
64.66
6.21
7.45
8.84
10.77
11.42
11.18
14.59
6.94
10.03
10.77
11.09
4.94
12.35
7.25
2.54
6.70
12.15
8.67
14.36
9.45
11.95
11.79
17.95
14.70
4.53
6.58
11.18
10.61
12.27
11.29
5.43
11.04
-6.39
13.96
6.37
13.02
9.66
18.80
17.68
8.51
6.01
53.38
-7.33
1.17
9.29
6.85
6.59
13.69
-21.57
4.14
-8.43
-2.23
-0.18
2.86
6.19
7.42
0.64
-96.33
11.49
10.00
19.38
13.68
5.66
14.17
6.70
11.46
10.38
5.91
17.14
5.71
12.18
22.20
-3.04
55.90
23.83
N/A
60.37
0.71
N/A
N/A
N/A
21.30
13.35
21.13
N/A
21.12
N/A
26.53
6.16
8.84
17.89
108.59
7.97
14.88
20.33
15.19
18.26
18.12
20.13
N/A
14.67
18.29
14.69
4.29
3.29
5.89
4.27
5.52
26.17
4.59
50.13
8.90
26.87
16.67
11.26
18.53
3.87
6.50
16.29
22.62
21.94
39.63
-0.89
52.84
-0.72
12.03
1.99
18.03
12.44
12.27
55.97
-7.14
8.48
143.61
N/A
7.50
3.76
16.73
12.50
-2.56
4.20
2.53
-3.52
N/A
N/A
N/A
N/A
-2.14
4.52
-98.33
24.04
21.03
48.61
27.47
23.05
60.10
18.54
26.37
1.71
-1.81
10.41
N/A
N/A
10.89
-13.69
0.99
-1.79
N/A
N/A
N/A
N/A
N/A
N/A
-12.19
-18.96
12.77
N/A
9.38
N/A
8.71
-0.16
-2.76
N/A
N/A
-3.86
3.59
8.32
2.53
12.94
13.14
10.30
N/A
N/A
3.90
0.15
-3.16
-11.51
N/A
-0.14
-3.41
8.51
9.51
9.44
8.09
9.01
4.89
5.58
3.42
-1.10
N/A
N/A
N/A
N/A
4.40
4.82
3.37
35.72
10.55
7.96
10.48
7.91
6.55
14.90
3.48
N/A
N/A
N/A
N/A
N/A
N/A
N/A
N/A
N/A
N/A
N/A
N/A
N/A
N/A
N/A
N/A
N/A
N/A
6.07
3.82
N/A
8.74
N/A
-9.70
2.94
10.28
L44
BARRON’S
•
Funds Quarterly
January 8, 2024
ETF Score Card
For personal non-commercial use only. Do not edit or alter. Reproductions not permitted.
To reprint or license content, please contact Barron's reprints department at 800-843-0008 or www.djreprints.com
Fund
Siren:Nasdaq NexGen Econ
Soundwatch Hedged Equity
SPAC and New Issue
Sparkline Intangible Val
SPDR Bbg 1-10 Year TIPS
SPDR Bbg 1-3 Mo T-Bill
SPDR Bbg 3-12 Mo T-Bill
SPDR Bbg Conv Secs
SPDR Bbg EM Local Bd
SPDR Bbg EM USD Bd
SPDR Bbg High Yield Bd
SPDR Bbg IG Floatng Rate
SPDR Bbg Intl Corp Bd
SPDR Bbg Intl Treas Bd
SPDR Bbg ST Hi Yld Bd
SPDR Bbg ST Intl Treas
SPDR Blackstone High Inc
SPDR Blackstone Sr Loan
SPDR DoubleLine Em Mk FI
SPDR DoubleLine SDTR Tct
SPDR DoubleLine TR Tact
SPDR Dow Jones Gl RE
SPDR Dow Jones Indus Avg
SPDR Dow Jones Intl RE
SPDR Dow Jones REIT
SPDR EURO STOXX 50
SPDR FS Innovative Tech
SPDR FTSE Intl Gvt IP Bd
SPDR Global Dow
SPDR Gold
SPDR Gold MiniShares Tr
SPDR ICE Preferred Sec
SPDR Loomis Sayles Opp B
SPDR MktAxess IG 400 CB
SPDR MSCI ACWI Cl Prs Al
SPDR MSCI ACWI ex-US
SPDR MSCI EAFE FF Rsv Fr
SPDR MSCI EAFE SF
SPDR MSCI EM FF Rsv Free
SPDR MSCI Emg Mkt SF
SPDR MSCI USA Cl Par Al
SPDR MSCI USA Gender Div
SPDR MSCI USA SF
SPDR MSCI World SF
SPDR Nuv Bbg HY Muni Bd
SPDR Nuv Bbg Muni Bd
SPDR Nuv Bbg ST Muni Bd
SPDR Nuveen Muni Bd ESG
SPDR Nuveen Municipal Bd
SPDR NYSE Technology
SPDR Ptf Aggregate Bond
SPDR Ptf Corp Bd
SPDR Ptf Dev World ex-US
SPDR Ptf Em Markets
SPDR Ptf Europe
SPDR Ptf High Yield Bond
SPDR Ptf Int Term Trs
SPDR Ptf IT Corp Bond
SPDR Ptf LT Corp Bond
SPDR Ptf LT Treasury
SPDR Ptf MB Bd
SPDR Ptf MSCI Gl Mk
SPDR Ptf S&P 1500 CSM
SPDR Ptf S&P 400 Mid Cap
SPDR Ptf S&P 500
SPDR Ptf S&P 500 Growth
SPDR Ptf S&P 500 Hi Div
SPDR Ptf S&P 500 Value
SPDR Ptf S&P 600 SC
SPDR Ptf S&P Sec Ntr Div
SPDR Ptf ST Corp Bond
SPDR Ptf ST Treasury
SPDR Ptf TIPS ETF
SPDR Russell 1000 LowVol
SPDR Russell 1000 MomFoc
SPDR Russell 1000 YldFoc
SPDR S&P 1500 Momen TILT
SPDR S&P 1500 Value TILT
SPDR S&P 400 Mid Cap Gro
SPDR S&P 400 Mid Cap Val
SPDR S&P 500 ESG ETF
SPDR S&P 500 ETF
SPDR S&P 500 Foss Fl Res
SPDR S&P 600 Sm Cap Gro
SPDR S&P 600 Sm Cap Val
SPDR S&P Aero&Def
SPDR S&P Bank ETF
SPDR S&P Biotech
SPDR S&P Cap Mkts ETF
SPDR S&P China
SPDR S&P Dividend
Description
ETF
Symbols
Global Science/Technology Fds
Multi-Cap Core
Alternative Event Driven
Multi-Cap Core
Inflation Protected Bond
Short U.S. Treasury
Short U.S. Treasury
Convertible Securities
EmergingMarketsLocalCurrencyDebtFds
Emerging Mrkts Hard Currency Debt
High Yield
Short Inv. Grade Debt
Intl Income
Intl Income
Short High Yield
Intl Income
High Yield
Loan Participation
Emerging Mrkts Hard Currency Debt
Short-Interm. U.S. Government
Multi-Sector Income
Global Real Estate
Large-Cap Value
Intl Real Estate
Real Estate
European Region
Science & Technology
Inflation Protected Bond
Global Large-Cap Value Fds
Commodities Prec Metals Fds
Commodities Prec Metals Fds
Flexible Income
Multi-Sector Income
Corporate Debt BBB-Rated
Global Multi-Cap Core Fds
Intl Large-Cp Core Fds
Intl Multi-Cp Core Fds
Intl Multi-Cp Core Fds
Emerging Markets
Emerging Markets
Multi-Cap Core
Large-Cap Core
Large-Cap Core
Global Multi-Cap Core Fds
High Yield Municipal Debt
General & Insured Municipal Debt
Short Municipal Debt
Interm. Municipal Debt
Interm. Municipal Debt
Science & Technology
Core Bond
Corporate Debt BBB-Rated
Intl Multi-Cp Core Fds
Emerging Markets
European Region
High Yield
General U.S. Treasury
Corporate Debt BBB-Rated
General Bond
General U.S. Treasury
U.S. Mortgage
Global Multi-Cap Core Fds
Large-Cap Core
Small-Cap Core
S&P 500 Index
Large-Cap Growth
Equity Income
Multi-Cap Value
Small-Cap Core
Equity Income
Short Inv. Grade Debt
Short U.S. Treasury
Inflation Protected Bond
Mid-Cap Core
Mid-Cap Core
Mid-Cap Value
Large-Cap Core
Multi-Cap Value
Small-Cap Growth
Small-Cap Core
Large-Cap Core
S&P 500 Index
Large-Cap Core
Small-Cap Core
Small-Cap Value
Industrials
Financial Services
Health/Biotechnology
Financial Services
China Region
Equity Income
BLCN
SHDG
SPCX
ITAN
TIPX
BIL
BILS
CWB
EBND
EMHC
JNK
FLRN
IBND
BWX
SJNK
BWZ
HYBL
SRLN
EMTL
STOT
TOTL
RWO
DIA
RWX
RWR
FEZ
XITK
WIP
DGT
GLD
GLDM
PSK
OBND
LQIG
NZAC
CWI
EFAX
QEFA
EEMX
QEMM
NZUS
SHE
QUS
QWLD
HYMB
TFI
SHM
MBNE
MBND
XNTK
SPAB
SPBO
SPDW
SPEM
SPEU
SPHY
SPTI
SPIB
SPLB
SPTL
SPMB
SPGM
SPTM
SPMD
SPLG
SPYG
SPYD
SPYV
SPSM
SPDG
SPSB
SPTS
SPIP
ONEV
ONEO
ONEY
MMTM
VLU
MDYG
MDYV
EFIV
SPY
SPYX
SLYG
SLYV
XAR
KBE
XBI
KCE
GXC
SDY
NAV
Net Assets
(MIL)
24.13
65.8
24.46
115.6
23.17
16.0
26.70
29.6
18.57
1305.8
91.38
35917.9
99.10
3014.1
72.15
3443.7
21.32
1891.9
24.29
200.8
95.03
8204.7
30.56
2446.4
29.86
200.2
23.24
1102.9
25.19
3682.5
27.37
173.3
28.13
126.6
41.93
4690.5
41.74
77.4
46.72
151.4
40.29
3201.5
43.78
1177.4
376.78
30558.4
27.33
315.1
95.25
1286.0
47.65
2300.2
145.99
91.8
42.04
434.8
119.12
172.0
191.13
57342.0
40.90
6118.4
33.49
828.6
26.15
36.9
97.24
56.4
31.66
248.1
27.08
1496.9
39.01
235.2
73.19
912.2
30.79
78.5
57.10
48.0
27.02
106.4
95.03
239.3
132.20
1115.8
110.30
101.3
25.25
2293.9
47.08
3686.7
47.83
3884.0
29.98
38.2
27.53
48.6
164.18
600.9
25.63
7502.8
29.41
1126.7
34.04
17091.0
35.41
7718.2
40.34
226.7
23.43
2929.1
28.55
4421.4
32.81
7041.3
23.76
698.6
29.03
7547.7
22.07
4565.3
55.38
645.9
58.41
7002.7
48.71
7141.6
55.88
23199.8
65.04
20386.7
39.19
6300.9
46.62
18013.9
42.16
8417.0
32.17
3.0
29.76
7337.6
29.04
5595.7
25.74
1451.8
114.44
565.5
104.52
153.0
100.65
734.4
202.27
87.1
159.87
267.0
75.67
2108.2
73.36
2183.5
46.16
1068.9
475.14 436436.1
38.88
1390.5
83.57
2678.8
83.25
3549.2
135.35
1838.2
46.03
1252.2
89.27
6150.7
101.98
248.7
67.87
813.7
124.91
20109.0
4th Qtr
Total Return
1 Year 3 Years*
26.24
7.19
0.91
14.67
3.68
1.34
1.45
7.12
8.89
9.38
7.39
1.56
10.24
9.90
5.56
6.36
5.30
3.00
6.08
2.28
6.35
15.87
13.03
14.62
16.33
13.18
18.11
9.84
9.85
10.15
10.23
5.38
6.80
9.15
12.53
9.74
10.83
9.89
7.67
8.33
13.06
12.26
10.58
9.92
7.79
8.57
3.83
6.80
6.57
20.27
6.72
8.47
10.52
6.90
11.62
7.23
4.94
5.83
13.80
12.46
7.40
10.97
11.78
11.66
11.67
10.07
13.32
13.59
15.10
11.81
3.11
2.53
4.57
9.77
11.53
10.98
13.11
11.12
9.90
13.56
11.64
11.64
12.36
14.22
15.76
21.04
25.86
22.18
18.26
-3.51
9.46
17.64
17.71
-3.88
34.57
4.36
4.96
4.96
14.31
9.78
9.71
13.17
6.63
11.13
5.73
12.08
3.49
12.40
10.81
9.11
6.33
5.84
11.25
15.98
6.49
13.72
26.96
45.89
8.74
21.04
13.35
13.68
9.01
9.60
9.39
22.79
15.97
18.27
17.32
9.22
11.71
29.25
22.34
21.83
19.90
7.37
5.79
3.00
5.67
5.85
70.11
5.59
8.96
17.88
10.28
19.95
13.56
4.26
7.25
11.14
3.28
5.08
21.38
25.46
16.40
26.25
29.96
3.97
22.14
16.03
N/A
5.65
4.26
3.74
13.28
15.62
11.00
22.54
16.85
17.31
15.25
27.84
26.14
27.34
17.00
14.69
23.65
5.28
7.50
32.10
-10.69
2.55
-15.33
7.10
-2.40
N/A
0.57
2.05
1.89
-2.46
-4.43
N/A
1.10
2.67
-6.57
-8.23
3.66
-5.03
N/A
3.53
-1.87
0.74
-2.57
2.92
9.21
-3.19
6.92
7.43
-12.08
-3.98
10.47
2.52
2.80
-3.53
N/A
N/A
5.34
2.03
2.89
4.30
-5.31
-0.72
N/A
3.34
9.87
8.01
-1.38
-1.56
-0.41
N/A
N/A
5.66
-3.39
-3.23
3.26
-2.72
5.19
2.36
-3.19
-1.44
-6.80
-11.54
-3.07
6.31
9.86
8.06
9.98
6.57
10.90
13.05
7.26
N/A
0.64
-0.15
-1.44
10.34
8.81
13.64
9.08
12.02
4.08
11.79
11.44
9.91
9.28
4.14
10.03
6.34
6.21
-14.08
12.94
-17.63
8.55
Fund
SPDR S&P Em Asia Pac
SPDR S&P Em Mkts Div
SPDR S&P Em Mkts Sm Cp
SPDR S&P Global Dividend
SPDR S&P Global Infr
SPDR S&P Global Ntrl Res
SPDR S&P Health Care Svc
SPDR S&P Hlth Care Equip
SPDR S&P Homebuilders
SPDR S&P Insurance ETF
SPDR S&P Internet
SPDR S&P Intl Div
SPDR S&P Intl Sm Cap
SPDR S&P Knsh Clean Pwr
SPDR S&P Knsh Fnl Frntrs
SPDR S&P Knsh Future Sec
SPDR S&P Knsh Intel Strc
SPDR S&P Knsh Nw Eco Cmp
SPDR S&P Knsh Smrt Mob
SPDR S&P Metals&Mining
SPDR S&P MidCap 400 ETF
SPDR S&P N Amer Ntrl Res
SPDR S&P Oil&Gas E&S
SPDR S&P Oil&Gas Exp
SPDR S&P Pharm
SPDR S&P Reg Banking ETF
SPDR S&P Retail
SPDR S&P Semiconductor
SPDR S&P Sftwre & Svc
SPDR S&P SmCap 600 ESG
SPDR S&P Telecom
SPDR S&P Trans
SPDR SSgA FI Sect Rot
SPDR SSgA Glb Alloc
SPDR SSgA Inc Alloc
SPDR SSgA Mlt-A Real Rtn
SPDR SSgA Ultra ShTm Bd
SPDR SSGA US LC Low Vol
SPDR SSGA US SC Low Vol
SPDR SSgA US Sect Rot
Spear Alpha ETF
Sprott Energy Trans Mats
Sprott Gold Miners
Sprott Junior Copp Mnrs
Sprott Junior Gold Mnrs
Sprott Junior Uranm Mnrs
Sprott Lithium Miners
Sprott Nickel Miners
Sprott Uranium Miners
SS Nasdaq 7HANDL Idx ETF
Sterling Div MultiMg Act
Sterling Focus Equity
STF Tact Grwth
STF Tact Grwth & Inc
Strat Shs Gold-Hedged Bd
Strategas Glbl Pol Opps
Strategas Mac Thm Opps
Strive 1000 Dividend Gro
Strive 1000 Growth
Strive 1000 Value
Strive 500
Strive Emerging Mkt Ex-C
Strive En Inc Shrt Mat
Strive FAANG 2.0
Strive Small-Cap
Strive Total Return Bond
Strive US Energy
Strive US Semiconductor
Subversive Decarbon
Subversive Food Security
Subversive Mental Health
Swan Hedged Equity US LC
Syntax Stratified LC ETF
Syntax Stratified MC ETF
Syntax Stratified SC ETF
Syntax Stratified TM II
Syntax Stratified US TM
Syntax Stratified US TMH
T Rowe:Blue Chip Gro ETF
T Rowe:Cap App Eqty ETF
T Rowe:Dividend Gro ETF
T Rowe:Equity Income ETF
T Rowe:Floating Rate ETF
T Rowe:Growth ETF
T Rowe:Growth Stock ETF
T Rowe:Internatl Eq ETF
T Rowe:Price US HY ETF
T Rowe:QM US Bond ETF
T Rowe:Small-Mid Cap ETF
T Rowe:Total Return ETF
T Rowe:Ult Sh-Tm Bd ETF
T Rowe:US Eqty Rsrch ETF
Data provided by
Description
ETF
Symbols
Emerging Markets
Intl Equity Income Fds
Emerging Markets
Global Equity Income
Global Infrastructure
Global Natural Resources
Health/Biotechnology
Health/Biotechnology
Consumer Services
Financial Services
Science & Technology
Intl Equity Income Fds
Intl Sm/Md-Cp Gro Fds
Alternative Energy
Alternative Energy
Global Science/Technology Fds
Global Infrastructure
Global Science/Technology Fds
Global Infrastructure
Basic Materials
S&P Midcap 400 Index
Natural Resources
Natural Resources
Natural Resources
Health/Biotechnology
Financial Services
Consumer Services
Science & Technology
Science & Technology
Small-Cap Core
Telecommunication
Industrials
Multi-Sector Income
Mixed-Asset Trgt Alloc Mod Fds
Flexible Portfolio
Real Return
Ultra-Short Obligations
Multi-Cap Core
Small-Cap Core
Large-Cap Core
Science & Technology
Basic Materials
Precious Metals Equity
Basic Materials
Precious Metals Equity
Basic Materials
Basic Materials
Basic Materials
Precious Metals Equity
Flexible Portfolio
Multi-Cap Core
Multi-Cap Growth
Flexible Portfolio
Flexible Portfolio
Flexible Portfolio
Global Multi-Cap Core Fds
Multi-Cap Core
Equity Income
Large-Cap Growth
Multi-Cap Value
Large-Cap Core
Emerging Markets
Short Inv. Grade Debt
Industrials
Small-Cap Core
General Bond
Natural Resources
Science & Technology
Global Natural Resources
Consumer Goods
Global Health/Biotechnology Fds
Flexible Portfolio
Multi-Cap Value
Small-Cap Core
Small-Cap Core
Multi-Cap Core
Multi-Cap Core
Alternative Multi-Strategy
Large-Cap Growth
Large-Cap Core
Large-Cap Core
Equity Income
Loan Participation
Large-Cap Growth
Large-Cap Growth
Intl Large-Cp Core Fds
High Yield
Core Bond
Mid-Cap Core
Core Plus Bond
Ultra-Short Obligations
Large-Cap Core
GMF
EDIV
EWX
WDIV
GII
GNR
XHS
XHE
XHB
KIE
XWEB
DWX
GWX
CNRG
ROKT
FITE
SIMS
KOMP
HAIL
XME
MDY
NANR
XES
XOP
XPH
KRE
XRT
XSD
XSW
ESIX
XTL
XTN
FISR
GAL
INKM
RLY
ULST
LGLV
SMLV
XLSR
SPRX
SETM
SGDM
COPJ
SGDJ
URNJ
LITP
NIKL
URNM
HNDL
DEIF
LCG
TUG
TUGN
GLDB
SAGP
SAMT
STXD
STXG
STXV
STRV
STXE
BUXX
FTWO
STXK
STXT
DRLL
SHOC
DKRB
KCAL
SANE
HEGD
SSPY
SMDY
SSLY
SYII
SYUS
SHUS
TCHP
TCAF
TDVG
TEQI
TFLR
TGRT
TGRW
TOUS
THYF
TAGG
TMSL
TOTR
TBUX
TSPA
NAV
101.29
32.44
56.30
60.64
53.53
56.75
88.96
84.43
95.63
45.19
87.93
35.64
31.87
71.83
44.72
55.12
34.60
46.76
31.49
59.82
507.49
51.13
84.50
136.89
41.60
52.40
72.34
224.87
150.70
29.14
80.02
83.49
26.00
41.45
31.03
27.24
40.39
145.02
112.40
45.81
22.45
17.67
25.03
18.41
29.44
23.38
12.62
14.00
48.07
20.75
24.82
28.42
29.38
22.78
20.83
26.02
23.07
28.87
33.96
26.66
30.55
27.74
20.18
25.24
29.00
20.42
28.06
39.42
23.25
21.90
22.77
19.52
71.20
40.87
44.73
44.12
45.04
40.52
30.92
27.57
35.21
36.53
51.27
28.49
30.62
26.00
51.37
43.01
27.96
41.09
49.16
29.36
Net Assets
(MIL)
326.3
320.0
824.3
208.8
425.7
3833.3
89.0
307.6
1393.8
701.2
21.2
501.0
680.9
232.8
16.7
36.8
19.9
1716.2
41.6
1762.3
18822.6
518.4
398.2
3387.8
185.1
2934.2
484.5
1365.7
320.7
3.9
52.8
189.6
176.4
228.2
72.9
556.7
651.6
789.1
173.9
389.9
11.6
12.4
230.4
3.8
103.0
180.2
4.1
1.4
1620.6
911.3
101.2
59.7
163.2
39.3
10.1
31.2
65.6
30.7
39.0
21.7
331.4
68.2
64.2
2.9
32.4
61.0
336.4
38.8
0.6
0.5
0.6
194.6
92.1
10.4
16.1
7.4
17.2
33.8
451.8
497.9
335.7
130.5
106.8
59.1
56.6
69.4
38.8
102.9
57.9
109.2
112.8
65.4
4th Qtr
Total Return
1 Year 3 Years*
5.28
9.21
6.66
11.96
10.70
3.49
6.92
8.23
25.19
6.78
21.02
8.88
10.09
6.82
13.80
17.73
8.86
18.62
2.83
14.19
11.52
-2.24
-11.54
-6.72
5.07
26.55
19.46
14.86
18.78
15.70
12.86
11.58
6.70
8.87
9.17
3.11
2.01
9.37
14.44
10.90
28.00
0.12
11.06
6.49
18.81
2.25
-11.03
-12.54
4.98
10.14
10.11
22.71
10.69
11.24
17.97
11.19
4.34
10.24
13.33
9.08
11.91
10.59
2.06
5.83
15.76
5.93
-5.94
21.45
-5.07
3.00
0.47
8.08
10.79
12.27
13.16
10.98
10.98
7.97
13.97
11.55
10.25
10.35
3.16
14.40
13.34
10.83
6.13
6.72
13.50
6.70
2.08
12.14
7.87
40.93
17.57
8.43
6.15
3.54
5.12
-5.97
60.06
12.12
41.09
14.48
11.07
-11.42
14.46
28.30
7.54
20.20
9.52
21.50
16.07
-2.85
6.75
3.51
2.84
-7.68
21.59
34.83
38.90
17.53
-1.10
25.29
5.22
13.48
10.26
2.70
5.67
9.17
7.44
19.01
87.63
N/A
2.70
N/A
6.75
N/A
N/A
N/A
56.88
13.07
12.58
43.25
37.12
35.15
12.50
11.62
1.45
14.94
35.86
9.25
27.52
N/A
N/A
N/A
19.97
N/A
-1.76
61.70
-0.47
-9.94
-7.73
13.99
13.67
17.29
11.57
13.89
13.89
6.14
50.10
N/A
13.69
9.59
11.89
N/A
48.87
N/A
11.90
5.66
N/A
6.28
6.41
29.77
-4.84
9.75
5.53
4.75
5.38
12.23
-2.55
-9.45
19.42
12.49
-17.53
3.29
-0.83
-11.73
5.92
6.46
-5.12
-5.44
-15.28
22.87
7.84
18.68
24.65
35.91
-5.99
3.00
5.85
9.96
-0.59
N/A
-1.01
6.42
-4.50
3.33
1.54
10.81
2.22
8.63
8.21
6.57
N/A
N/A
-5.03
N/A
-13.11
N/A
N/A
N/A
35.75
0.16
N/A
2.42
N/A
N/A
N/A
N/A
N/A
N/A
N/A
N/A
N/A
N/A
N/A
N/A
N/A
N/A
N/A
N/A
N/A
N/A
N/A
5.90
10.01
7.72
4.54
N/A
N/A
N/A
3.28
N/A
8.86
10.21
N/A
N/A
1.78
N/A
N/A
N/A
N/A
N/A
N/A
N/A
January 8, 2024
BARRON’S
•
L45
Funds Quarterly
ETF Score Card
For personal non-commercial use only. Do not edit or alter. Reproductions not permitted.
To reprint or license content, please contact Barron's reprints department at 800-843-0008 or www.djreprints.com
Fund
T Rowe:Value ETF
Tactical Advantage
TCW Engine 1 Trnsfrm 500
TCW Transform Supply Ch
TCW Transform Systems
Tema American Reshoring
Tema Global Royalties
Tema Luxury
Tema Mono and Oligo
Tema Oncology
Teucrium Agric Strat NK1
Teucrium AiLA LgSh BMS
Teucrium AiLA LS Agri St
Teucrium:Agricultural
Teucrium:Corn
Teucrium:Soybean
Teucrium:Sugar
Teucrium:Wheat
Texas Cap Texas Eqty Ix
THOR Low Volatility
Thrivent:Sm-Md Cap ESG
Tidal:Acad Vet Impct
Tidal:Acruence AH US Eq
Tidal:Adasina SJ AC Glbl
Tidal:Amer Cust Satsfctn
Tidal:ATAC Credit Rot
Tidal:ATAC US Rotation
Tidal:Aztlan Gl Stk S DM
Tidal:FolioBeyond AI&IRH
Tidal:God Bless America
Tidal:Gotham 1000 Value
Tidal:Gotham Enh 500
Tidal:Gotham Short Strat
Tidal:Ionic Infl Protctn
Tidal:LB L/S Alt Yield
Tidal:Newday Ocean Hlth
Tidal:Priv RE S Lq REIT
Tidal:Residential REIT
Tidal:Rob Alt Yd PM SPAC
Tidal:RPAR Risk Parity
Tidal:SoFi Be Yr OwnBoss
Tidal:SoFi Next 500
Tidal:SoFi Select 500
Tidal:SoFi Smart Energy
Tidal:SoFi Social 50
Tidal:SoFi Web 3
Tidal:SoFi Weekly Div
Tidal:SoFi Weekly Income
Tidal:Sound Enh Fxd Inc
Tidal:Sound Eqty Div Inc
Tidal:SP Fds DJ Gl Sukuk
Tidal:SP Fds S&P 500 SIE
Tidal:SP Fds S&P Glbl RS
Tidal:SS Glb Ship
Tidal:Subversive Cnnbs
Tidal:Unli HFND MS RT
Tidal:UPAR Ultra Rs Prty
Tidal:ZEGA Buy and Hedge
Tim Pln:High Div Stk Enh
Tim Pln:High Dividend St
Tim Pln:Intl
Tim Pln:Market Neutral
Tim Pln:US L/M Core Enh
Tim Pln:US L/M Cp Core
Tim Pln:US Sm Cap Core
Toews Agility Sh Dyn TI
Toews Agility Sh Mgd Rsk
Tortoise N Amer Pipeline
Touchstone Climate Trans
Touchstone Dividend Slct
Touchstone Sec Inc
Touchstone Strat Inc Opp
Touchstone UltShrt Inc
Touchstone US Lg Cap Foc
Touchstone:Dyn Intl
Trajan Wealth Income Opp
TrueShs EGREI
TrueShs Low Vol Eqty Inc
TrueShs Strc Outcome Apr
TrueShs Strc Outcome Aug
TrueShs Strc Outcome Dec
TrueShs Strc Outcome Feb
TrueShs Strc Outcome Jan
TrueShs Strc Outcome Jul
TrueShs Strc Outcome Jun
TrueShs Strc Outcome Mar
TrueShs Strc Outcome May
TrueShs Strc Outcome Nov
TrueShs Strc Outcome Oct
TrueShs Strc Outcome Sep
TrueShs Tech AI & DL
Description
ETF
Symbols
Large-Cap Value
Flexible Portfolio
Large-Cap Core
Global Multi-Cap Core Fds
Multi-Cap Value
Industrials
Global Multi-Cap Core Fds
Consumer Goods
Multi-Cap Core
Global Health/Biotechnology Fds
Commodities Agriculture
Commodities Base Metals Fds
Commodities Agriculture
Commodities Agriculture
Commodities Agriculture
Commodities Agriculture
Commodities Agriculture
Commodities Agriculture
Small-Cap Core
Large-Cap Core
Mid-Cap Core
U.S. Mortgage
Large-Cap Core
Global Multi-Cap Core Fds
Multi-Cap Core
Flexible Portfolio
Flexible Portfolio
Global Small-/Mid-Cap
U.S. Mortgage
Large-Cap Core
Mid-Cap Core
Large-Cap Core
Alternative Long/Short Eqty Fds
Inflation Protected Bond
Alternative Long/Short Eqty Fds
Multi-Cap Core
Global Real Estate
Real Estate
Alternative Event Driven
Flexible Portfolio
Global Multi-Cap Growth Fds
Small-Cap Growth
Large-Cap Core
Alternative Energy
Large-Cap Growth
Global Science/Technology Fds
Global Equity Income
General Bond
General Bond
Equity Income
Global Income
Large-Cap Growth
Global Real Estate
Industrials
Specialty/Miscellaneous
Alternative Multi-Strategy
Flexible Portfolio
Flexible Portfolio
Equity Income
Equity Income
Intl Multi-Cp Core Fds
Alternative Eq Mrkt Neutral Fds
Multi-Cap Core
Multi-Cap Core
Small-Cap Core
Flexible Portfolio
Flexible Portfolio
Energy MLP
Multi-Cap Growth
Equity Income
U.S. Mortgage
General Bond
Ultra-Short Obligations
Large-Cap Core
Mixed-Asset Trgt Alloc Gro Fds
Mixed-Asset Trgt Alloc Gro Fds
Global Natural Resources
Equity Income
Options Arbitrage/Opt Strat Fds
Options Arbitrage/Opt Strat Fds
Options Arbitrage/Opt Strat Fds
Options Arbitrage/Opt Strat Fds
Options Arbitrage/Opt Strat Fds
Options Arbitrage/Opt Strat Fds
Options Arbitrage/Opt Strat Fds
Options Arbitrage/Opt Strat Fds
Options Arbitrage/Opt Strat Fds
Options Arbitrage/Opt Strat Fds
Options Arbitrage/Opt Strat Fds
Options Arbitrage/Opt Strat Fds
Science & Technology
TVAL
FDAT
VOTE
SUPP
NETZ
RSHO
ROYA
LUX
TOLL
CANC
TILL
OAIB
OAIA
TAGS
CORN
SOYB
CANE
WEAT
TXS
THLV
TSME
VETZ
XVOL
JSTC
ACSI
JOJO
RORO
AZTD
RISR
YALL
GVLU
GSPY
SHRT
CPII
LBAY
AHOY
PRVT
HAUS
SPAX
RPAR
BYOB
SFYX
SFY
ENRG
SFYF
TWEB
WKLY
TGIF
FXED
DIVY
SPSK
SPUS
SPRE
BOAT
LGLZ
HFND
UPAR
ZHDG
TPHE
TPHD
TPIF
TPMN
TPLE
TPLC
TPSC
THY
MRSK
TPYP
HEAT
DVND
TSEC
SIO
TUSI
LCF
TDI
TWIO
RNWZ
DIVZ
APRZ
AUGZ
DECZ
FEBZ
JANZ
JULZ
JUNZ
MARZ
MAYZ
NOVZ
OCTZ
SEPZ
LRNZ
NAV
27.22
20.81
55.56
56.88
56.73
31.85
25.50
23.76
28.58
26.35
22.22
23.31
21.78
29.45
21.61
27.03
12.44
5.98
26.40
25.40
30.90
20.38
18.32
16.93
49.98
15.09
17.66
21.89
31.41
29.31
21.81
26.05
7.88
18.96
25.97
21.66
20.03
16.53
20.45
19.20
19.15
12.80
16.94
13.46
29.97
21.35
48.76
97.36
18.26
26.02
17.87
34.16
20.12
30.05
18.61
20.84
13.72
17.64
22.63
33.16
26.43
24.23
22.82
38.22
35.34
22.58
28.93
25.98
25.03
28.22
25.59
25.16
25.08
30.23
26.85
8.77
22.80
27.77
29.71
34.04
31.88
30.55
29.87
36.21
26.25
27.81
26.08
34.76
33.41
33.46
38.23
Net Assets
(MIL)
53.4
21.8
620.9
10.4
130.2
10.5
5.3
7.5
6.5
15.8
5.7
5.7
8.0
19.7
86.4
31.8
28.4
194.5
17.6
49.6
136.3
51.2
28.1
162.0
74.4
4.4
9.9
41.9
79.3
51.7
137.3
350.7
18.4
12.8
60.8
2.6
2.8
2.9
19.5
634.4
7.5
62.7
556.2
1.7
15.8
1.8
10.5
14.5
30.1
25.8
150.1
351.8
75.1
32.4
0.9
42.1
77.8
49.2
65.8
213.4
92.6
35.1
56.5
219.8
92.2
30.7
115.0
504.0
10.6
29.8
24.0
99.6
60.2
31.0
50.6
37.1
2.4
61.7
5.0
16.2
34.1
3.5
4.7
17.8
3.4
4.0
4.4
17.8
3.7
18.9
29.7
4th Qtr
Total Return
1 Year 3 Years*
10.21
6.57
11.94
15.40
11.13
15.69
3.71
9.01
16.08
14.42
-2.19
-1.53
-0.81
-2.88
-2.03
-0.30
-15.74
7.37
10.74
7.38
11.68
6.43
4.27
10.57
14.01
10.24
17.09
10.81
-3.30
15.41
10.54
11.00
-4.82
-1.84
1.68
11.19
11.13
13.37
1.08
10.65
25.98
9.92
11.59
7.21
13.34
25.51
8.28
5.37
8.30
6.00
4.27
10.82
15.33
10.26
-15.66
4.41
14.72
5.26
3.43
9.03
11.04
2.59
4.11
11.16
14.54
5.71
4.55
7.17
7.74
11.85
3.67
6.70
1.89
10.33
10.97
5.52
14.19
6.31
8.70
8.24
8.21
8.47
8.97
8.24
8.73
8.71
8.46
8.64
8.44
8.59
28.34
N/A
N/A
27.43
N/A
20.84
N/A
N/A
N/A
N/A
N/A
-4.33
N/A
-9.56
-6.04
-19.64
-5.17
30.69
-25.11
N/A
5.90
17.87
N/A
7.30
15.22
21.02
7.69
33.09
11.14
7.61
40.31
18.00
25.79
-8.77
1.58
-8.46
16.77
N/A
13.24
5.75
6.32
48.14
17.69
29.39
-8.15
56.84
84.24
9.36
10.60
15.25
5.08
4.36
34.23
9.74
25.20
N/A
3.94
6.74
13.12
-1.18
9.02
16.39
N/A
-2.39
15.30
17.65
4.84
13.38
10.80
N/A
13.98
N/A
8.15
6.47
26.15
17.21
6.38
-3.43
-0.61
22.28
17.25
17.97
20.64
18.91
17.81
17.02
20.45
15.87
18.21
18.23
17.72
67.08
N/A
N/A
N/A
N/A
N/A
N/A
N/A
N/A
N/A
N/A
N/A
N/A
N/A
11.72
11.63
11.51
22.78
-0.97
N/A
N/A
N/A
N/A
N/A
4.26
5.69
N/A
-5.09
N/A
N/A
N/A
N/A
10.04
10.71
N/A
11.09
N/A
N/A
N/A
N/A
-4.01
-18.69
2.68
8.49
N/A
3.68
N/A
N/A
2.52
2.35
13.34
-1.88
11.96
3.68
N/A
N/A
N/A
N/A
N/A
N/A
11.07
1.83
N/A
N/A
8.28
9.69
-0.44
6.40
20.13
N/A
N/A
N/A
N/A
N/A
N/A
1.10
N/A
N/A
N/A
N/A
8.22
8.94
N/A
8.67
8.73
N/A
N/A
N/A
9.04
8.47
9.44
-7.01
Fund
UBS AG Enh LC Growth ETN
UBS ETRACS 2xL IFED Inv
UBS ETRACS 2xL MSCI ESG
UBS ETRACS 2xL MSCI MF
UBS ETRACS 2xL MSCI MVF
UBS ETRACS 2xL MSCI QF
UBS ETRACS 2xL US DF TR
UBS ETRACS 2xL US GF TR
UBS ETRACS 2xL US SF TR
UBS ETRACS 2xL US VF TR
UBS ETRACS 2xMPL Prf St
UBS ETRACS Aler Infr B
UBS ETRACS Aler Mdstm HD
UBS ETRACS Aler Mdstm TR
UBS ETRACS Aler Mdstrm E
UBS ETRACS Aler MLP B
UBS ETRACS CMCI TR B
UBS ETRACS Com Idx TR B
UBS ETRACS IFED Inv
UBS ETRACS MP1.5xL CEF
UBS ETRACS MP1.5xL MR
UBS ETRACS MP2xL SC HD B
UBS ETRACS MP2xL US H B
UBS ETRACS MV BDC Lq Ix
UBS ETRACS QP 1.5x MVBDC
UBS ETRACS QP 1.5xL A
UBS ETRACS Whitney US CT
United States 12Mo NG
United States 12Mo Oil
United States Brent Oil
United States Comdty Idx
United States Copper Idx
United States Gas
United States Nat Gas
United States Oil Fund
Unusual Whales SDT
Unusual Whales SRT
US Dvrsfd Real Estate
US Glbl Sea to Sky Cargo
US Global GG&P Mtl Mine
US Global Jets
US Value
US Vegan Climate
USCF:Dividend Income
USCF:Enrgy Cmd Str Abs R
USCF:Gold Strtgy + Inc
USCF:Midstream Enrgy Inc
USCF:SummerHaven DCS NK1
USCF:Sust Batt Met Str
USCF:Sust Commdty Strgy
UVA Uncons MT Fixed Inc
Valkyrie Bitcoin & Ether
Valkyrie Bitcoin Miners
VanEck Merk Gold Trust
VanEck:Africa Index
VanEck:Agribusiness
VanEck:BDC Income
VanEck:Biotech
VanEck:Bitcoin Strategy
VanEck:Brazil Sm Cap
VanEck:CEF Muni Inc
VanEck:China Bond
VanEck:ChiNext ETF
VanEck:CLO ETF
VanEck:CMCI Com Strat
VanEck:Comdty Strat
VanEck:Digi Trans
VanEck:Digital India
VanEck:Dynamic High Inc
VanEck:Egypt Index
VanEck:EM High Yld Bond
VanEck:Energy Income
VanEck:Envrmntl Svcs
VanEck:FA High Yld Bond
VanEck:Future of Food
VanEck:Gaming
VanEck:Gold Miners
VanEck:Green Bond
VanEck:Green Infra
VanEck:Green Metals
VanEck:High Yield Muni
VanEck:HIP Sust Muni
VanEck:IG Floating Rate
VanEck:India Gro Ldrs
VanEck:Indonesia Index
VanEck:Inf Alloc
VanEck:Interm. Muni
VanEck:Intl HY Bond
VanEck:Israel
VanEck:JPM EM LC Bond
VanEck:Jr Gold Miners
VanEck:Long Muni
Data provided by
Description
ETF
Symbols
Equity Leverage
Equity Leverage
Equity Leverage
Equity Leverage
Equity Leverage
Equity Leverage
Equity Leverage
Equity Leverage
Equity Leverage
Equity Leverage
Equity Leverage
Energy MLP
Energy MLP
Energy MLP
Energy MLP
Energy MLP
Commodities General
Commodities General
Alternative Long/Short Eqty Fds
Equity Leverage
Equity Leverage
Equity Leverage
Equity Leverage
Specialty/Miscellaneous
Equity Leverage
Equity Leverage
Absolute Return
Commodities Energy
Commodities Energy
Commodities Energy
Commodities General
Commodities Base Metals Fds
Commodities Energy
Commodities Energy
Commodities Energy
Multi-Cap Core
Multi-Cap Core
Real Estate
Industrials
Precious Metals Equity
Industrials
Mid-Cap Value
Large-Cap Core
Equity Income
Alternative Managed Futures Fds
Commodities Prec Metals Fds
Energy MLP
Commodities General
Commodities Base Metals Fds
Commodities General
Corporate Debt BBB-Rated
Alternative Currency Strategies
Specialty/Miscellaneous
Commodities Prec Metals Fds
Emerging Markets
Industrials
Financial Services
Health/Biotechnology
Alternative Currency Strategies
Latin American
Specialty Fixed Income
EmergingMarketsLocalCurrencyDebtFds
China Region
Loan Participation
Commodities General
Commodities General
Global Science/Technology Fds
Global Science/Technology Fds
Flexible Portfolio
Emerging Markets
Emerging Mrkts Hard Currency Debt
Energy MLP
Industrials
High Yield
Consumer Goods
Consumer Services
Precious Metals Equity
Global Income
Natural Resources
Global Large-Cap Core Fds
High Yield Municipal Debt
General & Insured Municipal Debt
Short Inv. Grade Debt
India Region
Emerging Markets
Real Return
Interm. Municipal Debt
Global High Yield
Intl Sm/Md-Cp Gro Fds
EmergingMarketsLocalCurrencyDebtFds
Precious Metals Equity
General & Insured Municipal Debt
FBGX
FEDL
ESUS
MTUL
USML
QULL
SCDL
IWFL
IWML
IWDL
PFFL
MLPB
AMND
AMTR
AMNA
AMUB
UCIB
DJCB
IFED
CEFD
MVRL
SMHB
HDLB
BDCZ
BDCX
MLPR
WUCT
UNL
USL
BNO
USCI
CPER
UGA
UNG
USO
NANC
KRUZ
PPTY
SEA
GOAU
JETS
USVT
VEGN
UDI
USE
GLDX
UMI
SDCI
ZSB
ZSC
FFIU
BTF
WGMI
OUNZ
AFK
MOO
BIZD
BBH
XBTF
BRF
XMPT
CBON
CNXT
CLOI
CMCI
PIT
DAPP
DGIN
INC
EGPT
HYEM
EINC
EVX
ANGL
YUMY
BJK
GDX
GRNB
RNEW
GMET
HYD
SMI
FLTR
GLIN
IDX
RAAX
ITM
IHY
ISRA
EMLC
GDXJ
MLN
NAV
695.39
35.84
23.60
18.66
30.96
34.92
33.76
29.86
18.50
31.86
9.88
21.46
40.60
53.03
39.22
16.00
24.16
19.93
32.77
18.73
19.53
7.43
11.58
18.97
32.74
50.04
29.55
8.58
35.23
27.39
56.34
24.10
60.64
5.09
66.92
30.43
27.55
30.27
15.06
17.05
19.06
29.25
43.11
26.10
31.58
25.36
36.51
17.46
16.53
26.20
22.22
13.40
17.99
19.95
14.17
76.32
16.02
165.40
38.83
17.67
21.21
22.14
24.61
52.18
24.03
45.92
10.31
36.06
26.61
23.99
18.48
68.72
152.48
28.86
16.25
42.49
31.12
23.77
24.83
24.32
51.51
46.56
25.15
43.77
17.04
25.45
46.92
20.78
34.97
25.56
38.13
18.17
Net Assets
(MIL)
158.1
32.7
21.8
17.2
29.6
32.1
30.2
27.7
15.0
28.9
9.5
226.7
41.1
64.0
78.9
76.9
27.2
43.1
62.3
18.1
17.6
34.2
11.0
25.0
31.0
51.8
56.4
18.2
75.6
145.0
186.9
126.1
81.6
975.9
1432.8
10.3
5.2
118.3
4.5
93.5
1574.6
6.2
79.8
5.5
3.7
3.9
228.0
14.6
1.7
2.6
46.2
34.0
25.1
764.3
43.7
912.7
772.7
439.6
64.8
28.9
222.6
33.1
17.4
235.1
2.5
25.5
56.8
5.1
0.8
20.8
353.9
39.1
78.2
2757.9
3.2
45.0
13275.2
85.7
1.7
24.9
3006.5
18.3
1292.1
75.0
29.1
111.7
1948.8
38.4
55.2
3003.3
4425.4
460.8
4th Qtr
Total Return
1 Year 3 Years*
26.55
20.89
22.49
24.18
13.84
23.23
15.43
27.51
25.68
17.00
9.72
2.74
5.68
6.18
6.08
4.70
-4.39
-5.08
11.26
9.58
12.47
27.18
20.47
5.40
6.93
6.25
11.14
-21.07
-12.05
-14.58
-4.70
4.29
-10.22
-25.24
-17.13
14.05
12.76
15.03
10.03
15.87
11.99
12.86
13.61
9.99
-13.20
12.07
5.02
-4.53
-10.85
-1.39
7.98
53.76
93.64
11.54
1.27
-0.23
5.94
6.70
48.42
12.92
13.89
3.05
-3.89
2.06
-4.19
-7.68
88.98
10.63
7.60
20.11
5.23
6.55
7.36
8.38
5.92
8.20
17.46
5.90
4.29
-0.41
6.90
6.89
1.65
14.61
-0.20
4.02
7.37
7.93
6.29
8.02
19.02
10.27
83.63
33.97
45.17
10.73
11.35
56.97
0.10
84.37
22.53
13.43
8.55
22.22
13.76
12.87
12.62
25.43
-2.08
-8.91
20.78
8.46
12.64
36.74
-4.00
25.30
35.19
35.52
N/A
-50.25
-0.63
-3.10
0.20
4.49
1.49
-64.21
-4.47
N/A
N/A
12.73
19.09
10.67
11.51
16.63
38.01
6.34
N/A
9.27
14.62
0.65
N/A
N/A
7.53
136.95
304.05
13.55
-8.41
-8.53
26.81
3.87
131.20
36.30
2.67
0.95
-21.31
9.38
N/A
-3.51
280.64
30.07
9.53
24.57
8.13
15.74
13.14
12.95
-7.63
12.03
10.27
6.93
2.87
-12.08
5.51
5.27
7.44
35.51
1.99
6.10
5.64
12.20
-0.17
11.87
7.80
7.81
7.94
N/A
N/A
N/A
N/A
N/A
N/A
N/A
N/A
N/A
-10.68
30.21
22.94
23.00
22.72
31.17
16.64
10.94
N/A
-1.97
-7.39
13.88
11.94
15.16
19.33
45.80
N/A
3.49
26.92
28.49
20.03
3.53
35.66
-17.89
26.48
N/A
N/A
5.31
N/A
-3.73
-4.97
N/A
8.37
N/A
N/A
N/A
N/A
21.60
N/A
N/A
-2.90
N/A
N/A
2.69
-8.08
1.48
16.53
-0.48
N/A
-2.28
-5.47
0.22
-18.11
N/A
N/A
N/A
N/A
N/A
N/A
1.02
-2.36
23.88
8.85
1.27
N/A
-2.12
-3.10
-2.60
N/A
N/A
-2.09
N/A
2.86
10.91
-3.31
9.48
-1.34
-2.44
-6.51
-3.18
-10.16
-3.13
L46
BARRON’S
•
Funds Quarterly
January 8, 2024
ETF Score Card
For personal non-commercial use only. Do not edit or alter. Reproductions not permitted.
To reprint or license content, please contact Barron's reprints department at 800-843-0008 or www.djreprints.com
Fund
VanEck:Long/Flat Trend
VanEck:Low Carbon Energy
VanEck:MA BBB Corp Bond
VanEck:MA IG Corp Bond
VanEck:MS Dur High Div
VanEck:MS ESG Moat
VanEck:MS Gl Wd Moat
VanEck:MS Intl Moat
VanEck:MS SMID Moat
VanEck:MS Wide Moat
VanEck:Mtg REIT Inc
VanEck:Natural Resources
VanEck:Ofic & Comcl REIT
VanEck:Oil Refiners
VanEck:Oil Services
VanEck:Pharmaceutical
VanEck:Pref Secs ex Fin
VanEck:Rare Earth/S Mtls
VanEck:Retail
VanEck:Robotics
VanEck:Semiconductor
VanEck:Short HY Muni
VanEck:Short Muni
VanEck:Social Sentiment
VanEck:Steel
VanEck:Urnium+Nuclr En
VanEck:VG and eSports
VanEck:Vietnam
Vanguard 500 Idx;ETF
Vanguard Cnsmr Dis;ETF
Vanguard Cnsmr Stp;ETF
Vanguard Comm Indx;ETF
Vanguard Dev Mkt;ETF
Vanguard Div A I;ETF
Vanguard EM G B;ETF
Vanguard EM St I;ETF
Vanguard Energy Idx;ETF
Vanguard ESG Intl Stock
Vanguard ESG US Corp Bd
Vanguard ESG US Stock
Vanguard Euro S;ETF
Vanguard Ext Dur T;ETF
Vanguard Ext MI;ETF
Vanguard Finl Indx;ETF
Vanguard FTSE xUS;ETF
Vanguard FTSExUSSC;ETF
Vanguard Gro Idx;ETF
Vanguard GxUS RE;ETF
Vanguard Hi Dv Yld;ETF
Vanguard Hlth Cr Idx;ETF
Vanguard I HD Y;ETF
Vanguard Indus Idx;ETF
Vanguard InfoTch Idx;ETF
Vanguard Int Crp Bd;ETF
Vanguard Int Trs;ETF
Vanguard Int-T B;ETF
Vanguard Itl D A;ETF
Vanguard Lg-Cp I;ETF
Vanguard Lg-Tm Bd;ETF
Vanguard LT Corp Bd;ETF
Vanguard LT Trs;ETF
Vanguard MC G I;ETF
Vanguard MC Gro;ETF
Vanguard MC V I;ETF
Vanguard MC Val;ETF
Vanguard Md-Cp I;ETF
Vanguard Mega Cap;ETF
Vanguard Mtg-Bk Idx;ETF
Vanguard Mtrls Idx;ETF
Vanguard Pac Stk;ETF
Vanguard RE Idx;ETF
Vanguard Rus 1000 GI;ETF
Vanguard Rus 1000 Id;ETF
Vanguard Rus 1000 VI;ETF
Vanguard Rus 2000 GI;ETF
Vanguard Rus 2000 Id;ETF
Vanguard Rus 2000 VI;ETF
Vanguard Rus 3000 Id;ETF
Vanguard S&P 500G;ETF
Vanguard S&P 500V;ETF
Vanguard S&P MC400;ETF
Vanguard S&P MC400G;ETF
Vanguard S&P MC400V;ETF
Vanguard S&P SC600;ETF
Vanguard S&P SC600G;ETF
Vanguard S&P SC600V;ETF
Vanguard SC G Id;ETF
Vanguard S-C Id;ETF
Vanguard SC V I;ETF
Vanguard Sh-Tm B;ETF
Vanguard ST Corp Bd;ETF
Vanguard ST IPSI;ETF
Description
ETF
Symbols
Large-Cap Core
Alternative Energy
Corporate Debt BBB-Rated
Corporate Debt BBB-Rated
Equity Income
Multi-Cap Core
Global Multi-Cap Value Fds
Intl Multi-Cp Val Fds
Mid-Cap Core
Multi-Cap Core
Real Estate
Global Natural Resources
Real Estate
Global Natural Resources
Natural Resources
Global Health/Biotechnology Fds
Flexible Income
Basic Materials
Consumer Services
Science & Technology
Science & Technology
High Yield Municipal Debt
Short-Intmdt Municipal Debt
Multi-Cap Growth
Basic Materials
Alternative Energy
Consumer Services
Frontier Markets
S&P 500 Index
Consumer Services
Consumer Goods
Telecommunication
Intl Multi-Cp Core Fds
Equity Income
Emerging Mrkts Hard Currency Debt
Emerging Markets
Natural Resources
Intl Multi-Cp Core Fds
Corporate Debt BBB-Rated
Multi-Cap Core
European Region
General U.S. Treasury
Small-Cap Growth
Financial Services
Intl Multi-Cp Core Fds
Intl Sm/Md-Cp Gro Fds
Large-Cap Growth
Intl Real Estate
Equity Income
Health/Biotechnology
Intl Equity Income Fds
Industrials
Science & Technology
Corporate Debt BBB-Rated
Interm. U.S. Government
Core Bond
Intl Equity Income Fds
Large-Cap Core
Corporate Debt A Rated
Corporate Debt BBB-Rated
General U.S. Treasury
Mid-Cap Growth
Large-Cap Growth
Mid-Cap Value
Large-Cap Value
Mid-Cap Core
Large-Cap Core
U.S. Mortgage
Basic Materials
Pacific Region
Real Estate
Large-Cap Growth
Large-Cap Core
Multi-Cap Value
Small-Cap Growth
Small-Cap Core
Small-Cap Core
Multi-Cap Core
Large-Cap Growth
Multi-Cap Value
S&P Midcap 400 Index
Small-Cap Growth
Small-Cap Core
Small-Cap Core
Small-Cap Core
Small-Cap Value
Small-Cap Growth
Small-Cap Core
Small-Cap Core
Short Inv. Grade Debt
Short-Intmdt Inv. Grade Debt
Inflation Protected Bond
LFEQ
SMOG
MBBB
MIG
DURA
MOTE
MOTG
MOTI
SMOT
MOAT
MORT
HAP
DESK
CRAK
OIH
PPH
PFXF
REMX
RTH
IBOT
SMH
SHYD
SMB
BUZZ
SLX
NLR
ESPO
VNM
VOO
VCR
VDC
VOX
VEA
VIG
VWOB
VWO
VDE
VSGX
VCEB
ESGV
VGK
EDV
VXF
VFH
VEU
VSS
VUG
VNQI
VYM
VHT
VYMI
VIS
VGT
VCIT
VGIT
BIV
VIGI
VV
BLV
VCLT
VGLT
VOT
MGK
VOE
MGV
VO
MGC
VMBS
VAW
VPL
VNQ
VONG
VONE
VONV
VTWG
VTWO
VTWV
VTHR
VOOG
VOOV
IVOO
IVOG
IVOV
VIOO
VIOG
VIOV
VBK
VB
VBR
BSV
VCSH
VTIP
NAV
Net Assets
(MIL)
40.11
23.4
110.82
154.5
21.42
8.3
21.37
12.4
31.02
67.5
25.54
5.4
35.05
16.8
31.15
238.7
31.47
197.9
84.84
11822.0
11.82
214.1
48.74
136.0
38.59
1.0
34.31
35.0
309.61
2218.3
81.36
387.9
17.13
1344.3
61.79
380.1
188.35
165.0
39.65
2.8
174.84
10760.0
22.32
359.7
17.13
257.1
18.68
58.0
73.78
131.2
71.48
135.6
56.88
248.9
12.94
543.7
436.63 355128.5
304.50
4868.6
191.00
6303.8
117.73
3397.9
47.91 115908.5
170.34
71083.2
63.68
3395.7
41.09
72676.2
117.29
7980.8
55.25
3412.5
63.30
466.2
84.98
7006.5
64.51
17899.5
80.99
2797.8
164.34
15892.4
92.23
8592.6
56.16
35531.5
115.00
8104.6
310.82
99545.8
42.53
3493.8
111.60
48759.9
250.72
15975.2
66.39
6630.1
220.34
4052.2
484.00
56131.7
81.16
38852.3
59.32
21121.3
76.35
15941.6
79.24
5541.4
218.35
29399.8
74.59
5500.7
80.06
6167.4
61.65
8842.0
219.60
10955.6
259.37
15779.8
144.93
15486.1
109.31
6170.0
232.58
55273.3
169.19
4537.6
46.36
17380.2
190.02
2562.0
72.21
6672.4
88.30
30967.0
77.99
16181.2
216.86
3995.3
72.48
7377.8
183.54
747.8
81.09
6533.1
136.44
733.5
212.57
1875.4
270.70
8357.4
167.95
3792.2
93.94
1652.8
98.16
767.3
87.18
789.3
99.08
2181.8
107.50
579.5
88.53
1225.5
241.70
13841.5
213.26
45227.7
180.00
24580.8
76.95
31989.1
77.29
35281.7
47.46
12689.2
4th Qtr
Total Return
1 Year 3 Years*
8.38
6.65
8.26
8.00
4.49
11.90
10.87
6.85
11.46
12.87
10.39
2.46
20.63
2.61
-8.95
2.76
5.68
-7.64
13.50
15.23
21.31
3.87
3.36
21.85
16.04
5.58
11.27
-0.04
11.69
13.22
5.59
12.23
11.17
10.25
9.70
6.53
-6.64
10.45
8.11
13.41
12.14
18.74
15.14
15.49
9.96
10.43
14.41
12.99
9.10
7.10
8.86
13.56
16.87
8.31
4.98
6.84
11.76
11.97
13.08
13.78
12.63
13.11
14.53
11.50
8.61
12.27
11.89
7.32
10.66
9.93
18.12
14.20
11.97
9.46
12.75
14.02
15.23
12.08
10.08
13.61
11.67
9.92
13.62
15.12
14.24
15.83
13.12
13.40
13.62
3.40
4.07
2.54
19.64
1.36
9.79
9.00
0.82
18.26
11.22
10.61
17.28
31.72
14.96
2.38
N/A
14.03
3.23
6.91
11.37
-18.99
20.02
N/A
73.21
3.67
3.46
54.49
31.31
36.05
33.37
16.04
26.25
40.40
2.37
44.72
17.77
14.46
10.42
9.24
0.00
15.58
8.48
30.76
20.03
2.14
25.39
14.06
15.64
15.25
46.78
6.40
6.53
2.47
16.88
22.37
52.67
8.88
4.40
6.13
16.16
27.29
7.52
11.05
3.67
23.14
51.56
9.77
9.16
15.99
29.67
5.02
13.67
15.58
11.74
42.65
26.49
11.42
18.73
17.00
14.66
25.91
29.90
22.11
16.34
17.34
15.30
16.00
16.95
14.75
21.42
18.21
16.00
4.90
6.20
4.62
6.13
-11.52
-2.16
-2.30
6.05
N/A
4.20
0.96
N/A
12.22
-0.85
11.26
N/A
14.56
27.67
8.95
0.15
0.43
7.35
N/A
17.90
-0.77
-0.29
N/A
24.33
16.42
-4.99
-7.58
9.96
4.36
5.72
0.27
3.59
8.48
-3.38
-3.19
36.47
0.27
-3.28
7.89
5.45
-16.67
1.22
10.62
1.88
0.80
7.70
-4.49
10.20
5.27
7.76
10.56
11.87
-2.67
-3.14
-3.48
2.84
9.10
-8.66
-6.58
-11.43
1.82
8.97
9.19
10.72
5.51
9.82
-2.86
8.48
-0.17
5.00
8.80
8.91
8.77
-3.48
2.26
7.87
8.46
6.50
12.98
7.99
4.09
11.80
7.18
4.10
10.04
-2.77
4.67
10.46
-0.64
-0.09
2.30
Fund
Vanguard ST Tax-Exmpt Bd
Vanguard ST Trs;ETF
Vanguard T WldStk;ETF
Vanguard TE Bd I;ETF
Vanguard Tot Bd;ETF
Vanguard Tot I S;ETF
Vanguard Tot Itl BI;ETF
Vanguard Total Corp Bond
Vanguard Total World Bd
Vanguard TSM Idx;ETF
Vanguard Ultra Short Bd
Vanguard US Minimum Vol
Vanguard US Momentum Ftr
Vanguard US Multifactor
Vanguard US Quality Ftr
Vanguard US Value Factor
Vanguard Util Indx;ETF
Vanguard Val Idx;ETF
VegTech Plnt-bsd Inn&Cl
Veridien Climate Action
Vert Gbl Sus Real Est
Vesper US LC ST Rev Str
Vest 10 Yr Int RH
VictoryII:VShs Cp Bd
VictoryII:VShs Cr Int Bd
VictoryII:VShs Cr+ Int B
VictoryII:VShs Dev EVW
VictoryII:VShs Div Accel
VictoryII:VShs Em Mk VM
VictoryII:VShs Fr Csh Fl
VictoryII:VShs Int Val M
VictoryII:VShs Intl HD
VictoryII:VShs Intl VW
VictoryII:VShs Nasdaq 50
VictoryII:VShs Sh-Trm Bd
VictoryII:VShs THB MCESG
VictoryII:VShs US DE Vo
VictoryII:VShs US EQI
VictoryII:VShs US LC HD
VictoryII:VShs US MF MV
VictoryII:VShs US SC HD
VictoryII:VShs US SC VW
VictoryII:VShs US SMC VM
VictoryII:VShs US VM
VictoryII:VShs US500 EV
VictoryII:VShs US500 VW
VictoryII:VShs WsEd USSc
Vident Intl Eq Strat
Vident US Bond Strategy
Vident US Equity Strat
Virtus D&P Cln Egy
Virtus Newfleet ABS/MBS
Virtus Newfleet SD HY Bd
Virtus Seix Senior Loan
Virtus SH EM Hi Yld Bd
Virtus Terranova US Ql M
VS:-1x Short VIX Futures
VS:2x Long VIX Futures
V-Shares MSCI W ESG M&CT
V-Shares US Ldshp Dvsty
VST: -1x Short VIX MT FS
VST: 2x Bitcoin Strategy
Wahed DJ Islamic World
Wahed FTSE USA Shariah
WBI BB Quality 3000
WBI BB Value 3000
WBI BB Yield 3000
WBI Power Factor Hi Div
WealthTr DBS Lng Term Gr
Wedbush ETFMG Gl Cld Tch
Wedbush ETFMG Vid Gm Tch
Western Asset Sh Dur Inc
Western Asset Total Rtn
WisdomTree:AI and Innov
WisdomTree:Alt Inc
WisdomTree:Batt VC & Inn
WisdomTree:BBG USD Bull
WisdomTree:BioRevolution
WisdomTree:China x-S-O
WisdomTree:Cloud Cmptng
WisdomTree:Cybersecurity
WisdomTree:Dyn Curr HIE
WisdomTree:Dyn Curr HISC
WisdomTree:Eff Gd+ Eq St
WisdomTree:Eff Gd+Gd MS
WisdomTree:EM Corp Bd
WisdomTree:Em Curr Str
WisdomTree:EM Eff Core
WisdomTree:EM ESG
WisdomTree:EM ExCh
WisdomTree:EM ex-S-O E
Data provided by
Description
ETF
Symbols
Short-Intmdt Municipal Debt
Short U.S. Government
Global Multi-Cap Core Fds
General & Insured Municipal Debt
Core Bond
Intl Multi-Cp Core Fds
Intl Income
Core Bond
Global Income
Multi-Cap Core
Short Inv. Grade Debt
Multi-Cap Core
Multi-Cap Growth
Multi-Cap Value
Multi-Cap Core
Multi-Cap Value
Utility
Large-Cap Value
Multi-Cap Core
Global Large-Cap Core Fds
Global Real Estate
Multi-Cap Value
Alternative Managed Futures Fds
Corporate Debt BBB-Rated
Core Plus Bond
Core Plus Bond
Intl Multi-Cp Core Fds
Multi-Cap Core
Emerging Markets
Multi-Cap Value
Intl Multi-Cp Val Fds
Intl Equity Income Fds
Intl Multi-Cp Core Fds
Global Small-/Mid-Cap
Short Inv. Grade Debt
Mid-Cap Growth
Small-Cap Core
Multi-Cap Value
Multi-Cap Value
Multi-Cap Core
Small-Cap Value
Small-Cap Core
Small-Cap Core
Multi-Cap Value
Multi-Cap Core
Multi-Cap Core
Specialty/Miscellaneous
Intl Sm/Md-Cp Val Fds
Core Bond
Mid-Cap Value
Alternative Energy
Specialty Fixed Income
High Yield
Loan Participation
Emerging Mrkts Hard Currency Debt
Multi-Cap Core
Dedicated Short Bias
Alternative Managed Futures Fds
Global Multi-Cap Core Fds
Multi-Cap Core
Dedicated Short Bias
Alternative Currency Strategies
Intl Large-Cp Gro Fds
Large-Cap Core
Multi-Cap Core
Multi-Cap Core
Global Equity Income
Multi-Cap Value
Flexible Portfolio
Global Science/Technology Fds
Global Science/Technology Fds
Short Inv. Grade Debt
Core Plus Bond
Global Science/Technology Fds
Specialty Fixed Income
Basic Materials
Alternative Currency Strategies
Health/Biotechnology
China Region
Science & Technology
Science & Technology
Intl Multi-Cp Val Fds
Intl Sm/Md-Cp Val Fds
Commodities Prec Metals Fds
Commodities Prec Metals Fds
Emerging Mrkts Hard Currency Debt
Alternative Currency Strategies
Flexible Portfolio
Emerging Markets
Emerging Markets
Emerging Markets
VTES
VGSH
VT
VTEB
BND
VXUS
BNDX
VTC
BNDW
VTI
VUSB
VFMV
VFMO
VFMF
VFQY
VFVA
VPU
VTV
EATV
CLIA
VGSR
UTRN
RYSE
UCRD
UITB
UBND
CIZ
VSDA
UEVM
VFLO
UIVM
CID
CIL
QQQN
USTB
MDCP
CSF
CDC
CDL
VSMV
CSB
CSA
USVM
ULVM
CFO
CFA
MODL
VIDI
VBND
VUSE
VCLN
VABS
VSHY
SEIX
VEMY
JOET
SVIX
UVIX
VMAT
VDNI
ZIVB
BITX
UMMA
HLAL
WBIL
WBIF
WBIG
WBIY
WLTG
IVES
GAMR
WINC
WBND
WTAI
HYIN
WBAT
USDU
WDNA
CXSE
WCLD
WCBR
DDWM
DDLS
GDE
GDMN
EMCB
CEW
NTSE
RESE
XC
XSOE
NAV
Net Assets
(MIL)
101.35
390.5
58.28
22110.9
102.82
30124.5
50.97
30793.9
73.56 100014.7
57.90
60060.6
49.25
52737.4
77.47
874.4
69.18
713.9
237.25 329484.3
49.40
4334.9
104.61
93.4
131.27
333.8
114.89
194.1
126.47
243.7
112.58
591.4
137.11
4691.7
149.41 101017.9
16.08
5.0
20.47
22.0
9.92
319.5
23.88
31.5
22.16
6.1
21.19
110.8
46.82
1636.0
21.67
234.7
30.30
39.2
47.58
251.6
44.77
173.7
28.33
97.8
46.26
236.6
32.37
18.5
41.66
87.0
27.11
80.7
49.50
537.8
26.34
2.4
49.24
57.7
56.61
1090.1
58.47
336.6
42.07
148.6
55.90
319.2
66.53
30.0
73.52
221.3
68.31
165.2
60.80
498.3
74.77
526.4
32.55
247.5
24.61
366.4
44.32
392.5
50.95
532.4
18.29
6.9
23.65
10.6
21.51
3.3
23.93
95.9
25.78
6.3
30.65
81.8
37.79
140.2
13.73
76.3
28.45
2.8
26.04
1.2
22.67
4.0
22.67
104.2
22.72
56.3
45.43
324.2
30.92
41.1
27.79
36.3
23.19
49.5
28.77
57.7
23.11
15.7
41.23
22.5
59.56
42.5
23.86
10.6
20.60
43.6
20.66
167.3
18.88
13.1
30.48
4.4
25.14
244.4
16.86
2.4
28.05
551.4
34.97
659.3
25.36
37.6
32.16
231.2
32.96
215.0
27.14
13.0
24.02
7.1
64.05
40.7
18.01
9.0
28.27
51.0
29.46
22.7
29.52
25.1
29.01
2031.0
4th Qtr
Total Return
1 Year 3 Years*
3.67
2.53
11.25
7.25
6.65
9.97
6.51
8.49
6.60
12.16
2.13
9.44
16.08
11.75
13.17
13.23
8.58
9.07
4.47
9.36
18.14
6.57
-14.14
8.60
6.62
6.46
5.10
10.57
8.06
9.60
9.55
9.44
10.18
10.77
3.01
12.97
3.42
3.17
9.38
7.59
15.87
14.25
13.01
11.72
3.78
10.39
10.16
10.15
7.53
9.50
7.20
2.57
5.66
3.04
8.19
11.44
34.81
-60.40
12.76
12.63
14.19
113.09
13.51
10.04
7.58
4.18
5.62
14.38
9.37
17.06
11.24
3.94
8.11
18.74
7.76
6.38
-2.65
12.40
-5.47
17.92
24.12
6.01
8.76
20.35
25.26
5.91
5.17
10.55
9.11
13.30
8.80
N/A
4.27
21.90
6.16
5.69
15.56
8.85
8.64
7.19
26.02
5.54
8.88
16.33
18.64
22.45
17.21
-7.47
9.26
0.68
N/A
13.91
0.95
N/A
9.33
6.46
7.42
2.26
8.63
17.06
N/A
16.36
16.41
15.55
13.44
6.65
20.92
-7.00
-4.92
3.12
12.25
12.49
16.23
18.72
10.14
-3.64
11.93
23.72
18.28
7.79
23.78
-17.38
7.68
12.53
12.43
14.43
16.12
158.15
-95.31
28.64
27.93
N/A
N/A
19.21
30.18
11.84
0.43
-2.33
13.91
16.78
38.50
7.23
6.64
5.88
46.57
21.86
-2.66
3.11
-2.30
-18.67
39.59
66.40
15.44
15.20
32.61
13.22
9.16
8.83
9.74
10.86
21.63
9.82
N/A
-0.13
5.73
-0.37
-3.35
1.81
-2.48
-3.35
-2.95
8.45
N/A
7.41
6.50
13.34
9.74
15.59
3.16
10.62
N/A
N/A
3.69
1.64
N/A
N/A
-2.57
N/A
1.43
8.17
3.70
N/A
4.20
8.32
2.99
-4.44
1.50
N/A
1.26
5.28
10.99
9.30
7.63
8.77
8.65
9.52
1.40
7.78
N/A
4.38
-2.70
15.00
N/A
N/A
2.05
5.23
N/A
6.51
N/A
N/A
N/A
N/A
N/A
N/A
N/A
11.31
6.18
2.37
1.42
13.30
N/A
-7.53
-8.14
-0.18
-6.83
N/A
N/A
N/A
4.91
N/A
-23.89
-13.23
N/A
9.24
6.46
N/A
N/A
-1.77
0.03
N/A
-3.84
N/A
-8.26
January 8, 2024
BARRON’S
•
L47
Funds Quarterly
ETF Score Card
For personal non-commercial use only. Do not edit or alter. Reproductions not permitted.
To reprint or license content, please contact Barron's reprints department at 800-843-0008 or www.djreprints.com
Fund
WisdomTree:EM Hi Div
WisdomTree:EM Local Debt
WisdomTree:EM Mltfctr
WisdomTree:EM Qual DivGr
WisdomTree:EM SmCp Div
WisdomTree:Enh Cmdty Str
WisdomTree:Eu Hdg Eq
WisdomTree:Eu Hdg SC Eq
WisdomTree:Eu Qual DivGr
WisdomTree:Eur SC Div
WisdomTree:Flt Rate Trs
WisdomTree:Gl x-US QDG
WisdomTree:Glbl High Div
WisdomTree:India Earns
WisdomTree:Internatl ESG
WisdomTree:Intl AI Enh V
WisdomTree:Intl Eff Core
WisdomTree:Intl Equity
WisdomTree:Intl Hdg QDG
WisdomTree:Intl Hi Div
WisdomTree:Intl LC Div
WisdomTree:Intl MC Div
WisdomTree:Intl Mltfctr
WisdomTree:Intl Qual DG
WisdomTree:Intl SC Div
WisdomTree:Intr Rte HHYB
WisdomTree:IR Hdg US AB
WisdomTree:Jpn Hdgd Eq
WisdomTree:Jpn Hgd SC Eq
WisdomTree:Jpn SC Div
WisdomTree:Mgd Futs Str
WisdomTree:Mrtg+ Bd
WisdomTree:Nw Econ RE
WisdomTree:PutWrite Str
WisdomTree:Target Range
WisdomTree:US AI Enh Val
WisdomTree:US Corp Bd
WisdomTree:US Effcnt Cr
WisdomTree:US ESG
WisdomTree:US High Div
WisdomTree:US HY Corp Bd
WisdomTree:US Lgcp
WisdomTree:US LgCp Div
WisdomTree:US MdCp Div
WisdomTree:US MidCp
WisdomTree:US Mltifctor
WisdomTree:US Qual DG
WisdomTree:US Qual Gro
WisdomTree:US SC Qual DG
WisdomTree:US SmCp
WisdomTree:US SmCp Div
WisdomTree:US ST Corp Bd
WisdomTree:US Tot Div
WisdomTree:US Value Fund
WisdomTree:Voya YE USDUB
WisdomTree:YE US ST AB
WisdomTree:Yld Enh US AB
X-Square Municipal In TF
Xtrackers BBG US Iv Grd
Xtrackers Cybrscty Sl Eq
Xtrackers EM CR&Cl Imp
Xtrackers FTSE Dv xUS MF
Xtrackers Hi Beta Hi Yld
Xtrackers Hvst CSI300 CA
Xtrackers Hvst CSI500 CA
Xtrackers Interntnl RE
Xtrackers JPM ESG EMS
Xtrackers JPM ESG HY CB
Xtrackers Lo Beta Hi Yld
Xtrackers ME Leadrs Eqty
Xtrackers MEM Ldrs Eqty
Xtrackers MSCI All Ch Eq
Xtrackers MSCI AW xUS DY
Xtrackers MSCI AW xUS Hd
Xtrackers MSCI Ch A I E
Xtrackers MSCI EAFE Hdg
Xtrackers MSCI EAFE HDY
Xtrackers MSCI EM Hdg Eq
Xtrackers MSCI Eu Hdg Eq
Xtrackers MSCI Eur Hd Eq
Xtrackers MSCI Ger Hd Eq
Xtrackers MSCI Jp Hdg Eq
Xtrackers MSCI Kokusai
Xtrackers MSCI USA CA Eq
Xtrackers MSCI USA Ld Eq
Xtrackers Mun Inf Rev Bd
Xtrackers Net Z PPA US E
Xtrackers R1000 US QARP
Xtrackers RM USD HY Str
Xtrackers Russ US Mltfct
Xtrackers S&P 500 ESG
Xtrackers S&P 500 Gr ESG
Description
ETF
Symbols
Intl Equity Income Fds
EmergingMarketsLocalCurrencyDebtFds
Emerging Markets
Intl Equity Income Fds
Intl Equity Income Fds
Commodities General
European Region
European Region
Intl Equity Income Fds
Intl Equity Income Fds
Short U.S. Treasury
Intl Multi-Cp Gro Fds
Global Equity Income
India Region
Intl Multi-Cp Core Fds
Intl Multi-Cp Val Fds
Flexible Portfolio
Intl Multi-Cp Val Fds
Intl Equity Income Fds
Intl Equity Income Fds
Intl Equity Income Fds
Intl Equity Income Fds
Intl Multi-Cp Val Fds
Intl Equity Income Fds
Intl Equity Income Fds
High Yield
Corporate Debt BBB-Rated
Japanese
Japanese
Intl Equity Income Fds
Alternative Managed Futures Fds
U.S. Mortgage
Global Real Estate
Options Arbitrage/Opt Strat Fds
Alternative Long/Short Eqty Fds
Multi-Cap Value
Corporate Debt BBB-Rated
Mixed-Asset Trgt All Agg Gr Fds
Multi-Cap Core
Equity Income
High Yield
Large-Cap Core
Large-Cap Value
Small-Cap Core
Small-Cap Core
Multi-Cap Value
Equity Income
Large-Cap Growth
Equity Income
Small-Cap Core
Small-Cap Value
Short-Intmdt Inv. Grade Debt
Equity Income
Multi-Cap Value
General Bond
Short-Intmdt Inv. Grade Debt
Corporate Debt BBB-Rated
General & Insured Municipal Debt
Corporate Debt BBB-Rated
Global Science/Technology Fds
Emerging Markets
Intl Multi-Cp Val Fds
High Yield
China Region
China Region
Intl Real Estate
Emerging Mrkts Hard Currency Debt
High Yield
High Yield
Intl Large-Cp Core Fds
Emerging Markets
China Region
Intl Equity Income Fds
Intl Large-Cp Core Fds
China Region
Intl Large-Cp Core Fds
Intl Equity Income Fds
Emerging Markets
European Region
European Region
European Region
Japanese
Global Large-Cap Core Fds
Large-Cap Core
Large-Cap Core
General & Insured Municipal Debt
Large-Cap Core
Large-Cap Core
High Yield
Multi-Cap Core
Large-Cap Core
Large-Cap Growth
DEM
ELD
EMMF
DGRE
DGS
GCC
HEDJ
EUSC
EUDG
DFE
USFR
DNL
DEW
EPI
RESD
AIVI
NTSI
DWM
IHDG
DTH
DOL
DIM
DWMF
IQDG
DLS
HYZD
AGZD
DXJ
DXJS
DFJ
WTMF
MTGP
WTRE
PUTW
GTR
AIVL
WFIG
NTSX
RESP
DHS
WFHY
EPS
DLN
DON
EZM
USMF
DGRW
QGRW
DGRS
EES
DES
SFIG
DTD
WTV
UNIY
SHAG
AGGY
ZTAX
ESCR
PSWD
EMCR
DEEF
HYUP
ASHR
ASHS
HAUZ
ESEB
ESHY
HYDW
EASG
EMSG
CN
HDAW
DBAW
ASHX
DBEF
HDEF
DBEM
DBEU
DBEZ
DBGR
DBJP
KOKU
USCA
USSG
RVNU
USNZ
QARP
HYRM
DEUS
SNPE
SNPG
NAV
40.78
28.12
24.62
24.45
49.85
16.95
42.83
35.88
31.84
59.55
50.25
37.10
48.89
41.03
29.31
40.59
35.69
52.59
41.89
38.86
49.36
60.88
25.25
36.26
64.05
21.73
21.89
88.39
29.88
75.00
35.00
43.82
18.39
31.76
22.93
95.93
44.90
39.53
49.22
82.15
45.66
50.08
66.38
45.67
57.31
42.07
70.25
36.56
47.39
49.74
32.18
47.96
65.33
68.41
49.46
47.35
43.99
26.34
18.75
30.10
27.76
28.65
41.13
23.89
27.34
21.86
17.01
18.62
46.14
29.50
23.99
24.44
24.64
30.32
18.37
36.97
24.67
22.90
37.73
41.90
32.13
62.33
85.53
29.51
44.19
25.71
30.85
44.68
23.11
47.62
43.54
34.05
Net Assets
(MIL)
2540.9
88.6
4.7
113.8
2922.2
174.9
1412.6
40.0
74.2
181.3
18459.1
598.3
110.1
1612.6
11.3
76.3
277.3
563.4
1884.9
342.6
516.2
136.9
42.4
909.6
1051.6
154.2
195.6
3268.5
71.3
206.8
151.4
33.9
20.4
84.3
61.9
367.5
8.7
892.4
67.5
1061.9
225.3
711.9
3547.3
3243.8
723.8
234.3
10638.8
81.2
274.5
576.1
1777.2
42.5
1083.4
177.1
1188.1
98.2
881.5
3.3
2.7
5.5
826.7
56.0
11.9
1997.4
22.4
644.5
6.6
5.5
227.3
45.1
25.0
6.5
10.6
135.3
4.8
4462.2
1370.6
95.7
463.0
38.4
9.3
299.9
523.6
2309.4
1360.7
113.7
157.7
57.9
44.1
137.4
933.0
6.6
4th Qtr
Total Return
1 Year 3 Years*
9.24
7.72
7.92
10.91
8.75
-2.43
8.67
9.17
11.59
13.63
1.26
11.10
8.80
11.16
9.46
8.44
12.22
8.89
8.34
7.85
8.60
9.50
3.35
13.43
11.56
4.43
2.35
1.91
5.19
9.38
4.15
6.15
16.84
5.59
8.74
8.50
8.00
13.72
11.84
6.66
7.29
10.09
8.79
12.37
13.40
9.93
11.30
15.25
15.63
15.40
15.11
4.00
9.40
11.33
6.90
3.21
7.09
7.60
8.57
18.90
7.94
10.14
7.52
-4.92
-2.36
13.49
9.36
6.88
6.59
10.98
6.31
-4.16
9.04
5.95
-4.34
5.83
9.44
5.37
6.22
8.45
9.01
3.76
11.69
11.29
12.15
10.13
13.09
8.07
6.95
11.11
11.64
9.11
20.94
14.24
19.36
17.25
18.91
-3.60
26.40
19.34
19.68
14.86
5.26
17.31
9.76
26.29
19.27
18.15
16.12
16.55
19.55
15.18
17.05
15.20
10.70
20.85
15.38
11.96
7.24
40.76
36.70
21.59
16.17
4.24
13.91
15.85
12.28
7.13
8.35
23.40
21.56
-0.19
10.81
22.72
9.94
13.98
19.40
13.47
18.67
55.91
21.05
18.43
16.43
6.04
10.44
22.11
N/A
4.56
7.08
N/A
8.49
N/A
10.73
17.10
15.40
-13.07
-9.23
6.58
10.01
12.99
10.17
18.91
5.63
-12.15
17.73
16.16
-13.95
19.69
18.64
9.11
16.95
21.34
22.00
34.97
24.38
N/A
29.00
9.20
27.86
22.72
11.88
14.76
27.84
38.39
6.60
-2.11
3.06
-1.82
6.49
7.63
11.94
9.15
4.36
1.71
2.35
1.82
8.79
15.09
3.68
5.16
N/A
5.37
8.26
6.99
6.63
2.54
4.38
2.74
2.11
4.97
2.83
21.42
17.82
3.74
6.04
-2.90
-7.72
7.95
N/A
7.25
-3.66
3.85
7.84
9.85
0.68
9.61
9.93
12.22
11.14
7.83
11.41
N/A
9.07
10.08
9.52
-0.20
10.25
13.54
N/A
-0.96
-3.71
N/A
-3.63
N/A
-1.65
1.99
1.68
-14.69
-7.40
-3.24
-4.18
2.05
1.42
3.21
-7.35
-16.40
6.50
6.19
-13.36
10.78
7.27
-3.90
10.62
10.16
5.90
14.09
8.10
N/A
10.63
-1.56
N/A
11.35
N/A
8.90
11.46
N/A
Data provided by
Fund
Description
Xtrackers S&P 500 Vl ESG
Xtrackers S&P ESG Dv Ar
Xtrackers S&P MC 400 ESG
Xtrackers S&P SC 600 ESG
Xtrackers Shrt Dur HY Bd
Xtrackers Smcndctr Sl Eq
Xtrackers US Green ISE
Xtrackers USD HY Corp Bd
YieldMax AAPL Opt Inc St
YieldMax AMD Opt Inc St
YieldMax AMZN Opt Inc St
YieldMax COIN Opt In St
YieldMax DIS Opt In St
YieldMax GOOGL Opt In St
YieldMax Invtn Opt In St
YieldMax JPM Opt Inc Str
YieldMax META Opt In St
YieldMax MSFT Opt In St
YieldMax NFLX Opt In St
YieldMax NVDA Opt In Str
YieldMax PYPL Opt In Str
YieldMax TSLA Opt Inc St
YieldMax XOM Opt In St
Zacks Earnings Cons Port
ETF
Symbols
Large-Cap Value
Multi-Cap Value
Small-Cap Core
Small-Cap Core
Short High Yield
Global Science/Technology Fds
Alternative Energy
High Yield
Options Arbitrage/Opt Strat Fds
Options Arbitrage/Opt Strat Fds
Options Arbitrage/Opt Strat Fds
Options Arbitrage/Opt Strat Fds
Options Arbitrage/Opt Strat Fds
Options Arbitrage/Opt Strat Fds
Options Arbitrage/Opt Strat Fds
Options Arbitrage/Opt Strat Fds
Options Arbitrage/Opt Strat Fds
Options Arbitrage/Opt Strat Fds
Options Arbitrage/Opt Strat Fds
Options Arbitrage/Opt Strat Fds
Options Arbitrage/Opt Strat Fds
Options Arbitrage/Opt Strat Fds
Options Arbitrage/Opt Strat Fds
Large-Cap Core
SNPV
SNPD
MIDE
SMLE
SHYL
CHPS
UPGR
HYLB
APLY
AMDY
AMZY
CONY
DISO
GOOY
OARK
JPMO
FBY
MSFO
NFLY
NVDY
PYPY
TSLY
XOMO
ZECP
Average/Total
NAV
28.63
25.30
27.83
26.54
44.37
28.34
21.30
35.67
19.62
23.31
21.36
28.81
20.48
18.30
14.51
20.06
21.70
22.27
18.17
22.56
20.00
11.90
17.39
26.09
Net Assets
(MIL)
5.5
4.8
11.5
10.6
91.5
5.1
4.3
3036.5
56.2
24.5
41.3
104.2
4.7
17.5
71.0
4.8
13.0
12.5
12.2
153.3
3.4
787.9
7.6
74.6
42.917662676.3
4th Qtr
Total Return
1 Year 3 Years*
14.22
8.36
11.56
15.73
5.59
23.26
5.03
7.10
11.20
26.63
16.69
81.68
11.25
-2.03
15.16
5.01
19.72
18.99
21.03
10.81
6.35
-0.06
-10.17
9.42
15.98
2.48
14.97
17.55
11.67
N/A
N/A
12.74
N/A
N/A
N/A
N/A
N/A
N/A
20.15
N/A
N/A
N/A
N/A
N/A
N/A
50.24
N/A
13.68
N/A
N/A
N/A
N/A
3.44
N/A
N/A
1.44
N/A
N/A
N/A
N/A
N/A
N/A
N/A
N/A
N/A
N/A
N/A
N/A
N/A
N/A
N/A
N/A
8.82 15.63
2.40
*annulized
Source: Lipper
Monthly Dow Jones Industrial Average
The following table lists the monthly average of the Price/Earnings Ratio and Dividend Yield as reported weekly in Barron's Market Laboratory. The change is the difference
between the recent month's close and the previous month's close. The high/low range is based upon the closing average for each day during the month.
Year
Month
First
Closing
Closing
High
Closing
Low
Close Avg
Mean
Last
Close
Chg.
% Chg.
Avg.
P/E
Avg.
Yield
36245.50
33274.58
33433.35
34837.71
35630.68
34418.47
33061.57
34051.70
33601.15
32661.84
34092.96
33136.37
37710.10
35950.89
33997.65
34907.11
35630.68
35559.53
34408.06
34051.70
34098.16
33431.44
34245.93
34302.61
36054.43
33274.58
32417.59
33507.50
34099.42
33734.88
33061.57
32764.65
33301.87
31819.14
32656.70
32930.08
36947.93
34704.50
33319.49
34318.89
34880.66
34777.20
33904.98
33316.80
33731.28
32483.48
33648.26
33656.00
37689.54
35950.89
33052.87
33507.50
34721.91
35559.53
34407.60
32908.27
34098.16
33274.15
32656.70
34086.04
+1738.65
+2898.02
–454.63
–1214.41
–837.62
+1151.93
+1499.33
–1189.89
+824.01
+617.45
–1429.34
+938.79
+4.84
+8.77
–1.36
–3.50
–2.36
+3.35
+4.56
–3.49
+2.48
+1.89
–4.19
+2.83
26.00
24.56
23.37
24.19
24.70
23.03
22.18
21.79
22.05
21.17
21.94
22.58
1.98
2.09
2.18
2.11
2.05
2.06
2.09
2.11
2.07
2.15
2.06
2.04
34395.01
32653.20
29490.89
31656.42
32798.40
31097.26
32813.23
33061.50
34818.27
33294.95
35405.24
36585.06
34429.88
34589.77
32861.80
32381.34
34152.01
32845.13
33248.28
34061.06
35160.79
35294.19
35768.06
36799.65
32757.54
32001.25
29202.88
28725.51
31510.43
30630.17
29888.78
31253.13
32977.21
32632.64
33131.76
34168.09
33482.26
33417.96
30570.68
30649.56
33009.56
31535.32
31446.71
32379.46
34314.99
34029.74
34648.48
35456.15
33147.25
34589.77
32732.95
28725.51
31510.43
32845.13
30775.43
32990.12
32977.21
34678.35
33892.60
35131.86
–1442.52
+1856.82
+4007.44
–2784.92
–1334.70
+2069.70
–2214.69
+12.91
–1701.14
+785.75
–1239.26
–1206.44
–4.17
+5.67
+13.95
–8.84
–4.06
+6.73
–6.71
+0.04
–4.91
+2.32
–3.53
–3.32
21.40
21.40
19.00
18.14
19.72
18.43
18.03
18.56
19.48
19.04
19.40
21.27
2.06
2.02
2.20
2.21
2.01
2.09
2.10
2.01
1.89
1.89
1.84
1.79
34022.04
35913.84
34326.46
35312.53
34838.16
34633.53
34575.31
34113.23
33153.21
31535.51
30211.91
30223.89
36488.63
36432.22
35819.56
35443.82
35625.40
35144.31
34756.39
34777.76
34200.67
33171.37
31961.86
31188.38
34022.04
34483.72
34002.92
33843.92
34792.67
33962.04
33290.08
33587.66
33153.21
30924.14
30211.91
29982.62
35641.33
35848.57
35055.52
34688.42
35243.97
34798.80
34289.91
34270.31
33803.29
32373.29
31283.91
30821.35
36338.30
34483.72
35819.56
33843.92
35360.73
34935.47
34502.51
34529.45
33874.85
32981.55
30932.37
29982.62
+1854.58
–1335.84
+1975.64
–1516.81
+425.26
+432.96
–26.94
+654.60
+893.30
+2049.18
+949.75
–623.86
+5.38
–3.73
+5.84
–4.29
+1.22
+1.25
–0.08
+1.93
+2.71
+6.62
+3.17
–2.04
22.13
22.26
23.10
23.63
23.85
27.09
29.06
29.50
32.19
34.54
33.10
31.03
1.78
1.73
1.75
1.77
1.72
1.73
1.76
1.74
1.76
1.83
1.89
1.92
29823.92
26925.05
27816.90
28645.66
26664.40
25734.97
25475.02
23723.69
20943.51
26703.32
28399.81
28868.80
30606.48
30046.24
28837.52
29100.50
28653.87
27005.84
27572.44
25548.27
24633.86
27090.86
29551.42
29348.10
29823.92
26925.05
26501.60
26763.13
26664.40
25706.09
25015.55
23247.97
20943.51
18591.93
25409.36
28256.03
30148.58
29124.04
28005.11
27733.40
27821.37
26385.83
26062.27
24271.02
23293.90
22637.42
28519.73
28879.99
30606.48
29638.64
26501.60
27781.70
28430.05
26428.32
25812.88
25383.11
24345.72
21917.16
25409.36
28256.03
+967.84
+3137.04
–1280.10
–648.35
+2001.73
+615.44
+429.77
+1037.39
+2428.56
–3492.20
–2846.67
–282.41
+3.27
+11.84
–4.61
–2.28
+7.57
+2.38
+1.69
+4.26
+11.08
–13.74
–10.07
–0.99
29.57
28.93
26.63
26.00
26.97
22.84
21.69
20.22
18.07
17.44
21.95
21.34
1.96
2.02
2.11
2.11
2.20
2.34
2.47
2.73
2.86
2.94
2.28
2.21
27783.04
27347.36
26573.04
26118.02
26583.42
26717.43
24819.78
26430.14
28645.26
28164.00
27186.69
27219.52
26583.42
27359.16
26753.17
26504.95
27502.81
27347.36
26078.62
26118.02
25479.42
26717.43
24819.78
24815.04
28167.01
27797.05
26736.80
26900.21
26058.23
27089.19
26160.10
25744.79
28538.44
28051.41
27046.23
26916.83
26403.28
26864.27
26599.96
24815.04
+487.03
+1005.18
+129.40
+513.55
–460.99
+264.31
+1784.92
–1777.87
+1.74
+3.72
+0.48
+1.95
–1.72
+0.99
+7.19
–6.69
20.90
20.52
19.29
19.32
18.78
18.77
18.08
17.71
2.24
2.24
2.30
2.28
2.30
2.19
2.24
2.26
2023
Dec
Nov
Oct
Sept
Aug
July
June
May
Apr
Mar
Feb
Jan
2022
Dec
Nov
Oct
Sept
Aug
July
June
May
Apr
Mar
Feb
Jan
2021
Dec
Nov
Oct
Sept
Aug
July
June
May
Apr
Mar
Feb
Jan
2020
Dec
Nov
Oct
Sept
Aug
July
June
May
Apr
Mar
Feb
Jan
2019
Dec
Nov
Oct
Sept
Aug
July
June
May
L48
BARRON’S
•
Funds Quarterly
January 8, 2024
s Copyright Lipper
For personal non-commercial use only. Do not edit or alter. Reproductions not permitted.
To reprint or license content, please contact Barron's reprints department at 800-843-0008 or www.djreprints.com
Closed-End Funds
FUND NAME (SYMBOL)
NAV
MARKET
($/SHR)
PRICE
12/29/23 12/29/23
PREM/
DISC
12/29/23
MARKET RETURNS THROUGH 12/29
1 YR
3 YRS
5 YRS
(Annualized)
10 YRS
abrdn AP IncFd (FAX)(x)
abrdnAusEq (IAF)
abrdn Emg Mkts Eq Inc (AEF)(x)
abrdn Glbl Dyn Div (AGD)
abrdn Glb Prem Prop (AWP)
3.10
4.99
5.96
11.04
4.31
2.71
4.33
5.11
9.34
3.88
–12.6
–13.2
–14.3
–15.4
–10.0
14.2
12.7
9.0
10.2
10.2
16.6
10.4
7.1
7.4
12.6
–5.9
4.3
–8.0
4.0
–0.2
2.6
9.6
1.1
10.3
4.9
1.5
4.6
–0.7
7.4
3.7
10.6
12.4
10.1
12.2
12.1
abrdn Global Income (FCO)(x)
abrdn Global Infra Inc (ASGI)
abrdn Inc Credit Str (ACP)
abrdn Japan Equity (JEQ)
abrdn National Muni Inc (VFL)(x)
3.98
21.04
7.03
6.83
12.13
6.46
17.94
6.80
5.74
10.21
62.3
–14.7
–3.3
–16.0
–15.8
14.1
13.9
4.8
9.3
19.9
64.8
14.5
19.9
17.1
3.1
11.1
6.6
–0.4
–7.5
–3.8
14.0
I
5.6
4.5
1.6
7.8
I
3.0
4.4
3.7
17.4
10.8
22.0
16.5
7.9
abrdn Tot Dyn Div (AOD)
Adams Diversified Eq Inc (ADX)
Adams Natural Resources (PEO)
AdvntCnvrtbl&IncFd (AVK)
AllianceBernGlHiIncm (AWF)
9.56
20.56
24.84
12.66
11.17
8.06
17.71
20.63
11.38
10.12
–15.7
–13.9
–16.9
–10.1
–9.4
9.0
13.8
–6.2
12.2
6.7
12.7
31.4
0.9
18.1
18.3
4.9
11.0
30.1
0.2
2.8
11.0
16.8
14.5
10.1
6.9
8.1
12.8
3.6
4.9
4.6
13.4
26.3
1.4
15.3
15.5
AllBerNatlMunInc (AFB)
Allspring Gl Div Oppty (EOD)
Allspring Income Oppty (EAD)
Allspring Multi-Sector (ERC)
Allspring Ut & Hi Inc (ERH)
12.78
5.03
7.37
10.18
10.60
10.84
4.34
6.52
9.44
9.21
–15.2
–13.7
–11.5
–7.3
–13.1
17.2
10.4
9.5
6.0
7.8
7.4
9.7
11.9
4.9
–10.5
–5.1
6.4
1.6
0.9
–3.5
2.0
9.7
7.3
6.6
3.7
3.4
5.4
5.8
5.6
5.0
9.3
21.3
13.9
15.1
–5.2
Angel Oak FS Inc Trm (FINS)
Apollo Senior Floating (AFT)
Apollo Tactical Income (AIF)
Ares Dynamic Crdt Alloc (ARDC)
ArrowMark Financial Corp (BANX)
13.72
15.09
14.81
14.51
N/A
11.91
13.25
13.96
13.75
18.16
–13.2
–12.2
–5.7
–5.2
N/A
1.6
1.7
7.5
9.6
3.8
2.5
20.2
29.3
32.4
14.3
–2.9
6.0
8.1
8.2
6.0
I
6.9
9.4
9.5
5.5
I
4.8
6.7
6.3
0.3
2.8
16.4
17.7
19.4
N/A
ASA Gold & Prec Met Ltd (ASA)(v)
Bancroft Fund Ltd (BCV)
Barings Corporate Inv (MCI)(x)
Barings Glb SD HY Bd (BGH)
Barings Part Inv (MPV)(x)
17.61
18.74
N/A
15.26
N/A
15.06
15.98
18.43
13.44
15.60
–14.5
–14.7
N/A
–11.9
N/A
13.1
3.5
18.4
8.5
19.2
5.4
5.5
41.6
18.2
36.0
–11.6
–11.1
19.8
5.5
16.9
9.9
6.5
12.4
6.4
7.9
2.3
6.9
10.0
4.5
9.6
1.9
3.8
N/A
17.6
N/A
Dividend and Income (DNIF)
BlackRock 2037 Muni Trg (BMN)
BlackRock CA Mun (BFZ)
BlackRock Cap Alloc Term (BCAT)
BlRck Core Bond (BHK)
18.88
26.20
13.20
17.24
11.02
12.17
23.78
12.03
14.95
10.91
–35.5
–9.2
–8.9
–13.3
–1.0
15.0
5.8
18.3
5.9
12.2
19.8
1.9
15.8
19.3
14.4
12.1
I
–1.5
–4.3
–5.8
14.5
I
4.1
I
4.5
6.6
I
3.6
I
5.1
20.8
7.7
7.9
11.7
9.9
BR Corporate HY (HYT)
BR Credit Alloc Inc (BTZ)
BR Debt Strategy (DSU)(x)
BR Enh C&I (CII)
BR Enhcd Govt (EGF)
9.73
11.60
10.89
19.81
10.34
9.43
10.32
10.79
19.00
9.73
–3.1
–11.0
–0.9
–4.1
–5.9
12.2
9.4
8.0
3.6
0.0
19.9
12.7
30.3
18.5
5.7
2.7
–3.5
9.6
11.4
–6.2
9.6
6.3
10.6
14.3
–1.6
6.3
5.1
6.9
11.3
0.5
16.2
13.4
15.0
20.3
4.4
BlackRock Energy & Res (BGR)
BlackRock Eq Enh Div (BDJ)
BlackRock Enh Glbl Div (BOE)
BlackRock Enh Intl Div (BGY)
BlackRock ESG Cap All T (ECAT)
14.13
8.82
11.81
6.21
18.05
12.45
7.69
9.92
5.27
16.13
–11.9
–12.8
–16.0
–15.1
–10.6
–3.6
4.0
7.3
7.8
11.8
5.7
–6.7
12.0
13.3
32.3
27.2
6.9
4.0
3.8
I
10.6
9.4
8.8
8.9
I
0.8
8.0
4.8
3.6
I
5.1
9.7
15.0
14.8
18.1
BR F/R Inc Str (FRA)
BlackRock Floatng Rt Inc (BGT)
BlackRock Hlth Sci Term (BMEZ)
BlackRock Hlth Sciences (BME)
BlckRk Income (BKT)(x)
13.26
12.90
17.91
42.18
12.74
12.66
12.38
14.65
40.46
12.18
–4.5
–4.0
–18.2
–4.1
–4.4
3.3
5.7
3.7
5.1
9.5
25.4
26.3
5.1
–1.1
7.6
9.7
9.9
–12.6
0.5
–5.5
9.3
9.4
I
8.4
0.8
5.4
5.6
I
9.8
1.9
14.6
14.9
4.0
3.5
5.7
BlackRock Innov&Gro Term (BIGZ)
BlckRk Inv Q Mun (BKN)(x)
BlckRk L-T Muni Adv (BTA)
BlackRock Ltd Dur Inc (BLW)
BlackRock Mlt-Sctr Inc (BIT)
9.03
13.34
10.58
14.11
14.76
7.33
11.86
10.23
13.98
15.00
–18.8
–11.1
–3.3
–0.9
1.6
7.3
18.7
15.6
11.3
6.4
19.2
6.3
14.8
17.2
16.9
I
–7.1
–1.9
3.9
4.0
I
2.7
4.5
9.1
9.0
I
3.8
5.8
5.9
8.2
11.4
8.2
10.1
14.0
11.0
BlackRock Muni 2030 Tgt (BTT)
BlackRock Muni (BFK)
BlackRock Muni II (BLE)
BlckRk Muni Inc Qly (BYM)
BR Muni Income (MUI)
24.07
11.65
12.37
12.95
13.55
20.80
10.07
10.68
11.21
11.64
–13.6
–13.6
–13.7
–13.4
–14.1
7.9
14.8
18.3
15.1
16.0
0.8
4.2
7.8
3.1
6.7
–3.9
–9.2
–7.2
–5.3
–3.8
3.5
0.9
1.1
2.4
2.6
5.9
3.1
3.4
3.9
3.1
6.3
7.3
10.2
8.2
9.3
BR MuniAssets Fd (MUA)
BR MH CA Qly Fd Inc (MUC)(x)
BR MH NJ Qly (MUJ)(x)
BR MH NY Qly (MHN)(x)
BR MH Qly 2 (MUE)
11.58
12.94
13.38
12.41
11.78
10.59
11.13
11.41
10.51
10.02
–8.5
–14.0
–14.7
–15.3
–14.9
19.3
17.7
14.1
16.4
15.4
2.9
7.8
7.5
6.6
4.6
–5.3
–5.4
–3.0
–5.2
–5.6
1.3
2.3
2.9
1.8
1.8
4.4
3.1
4.0
3.2
3.4
7.9
7.6
9.3
9.8
8.8
BR MuniHoldngs (MHD)(x)
BR MuniVest Fd (MVF)(x)
BR MuniVest 2 (MVT)(x)
BR MuniYield Fd (MYD)(x)
BR MuniYld MI Qly (MIY)(x)
13.87
8.17
12.63
12.43
13.36
11.91
7.12
10.77
10.78
11.36
–14.1
–12.9
–14.7
–13.3
–15.0
16.8
18.8
17.2
18.9
15.7
2.0
5.6
7.1
8.3
6.6
–5.6
–4.1
–6.0
–4.7
–3.8
0.4
1.6
0.8
1.8
2.7
3.4
3.2
2.9
3.8
4.3
8.7
10.0
9.9
10.0
9.1
BR MuniYld NY Qly (MYN)(x)
BR MuniYld PA Qly (MPA)(x)
BR MuniYield Qlty (MQY)(x)
BR MuniYld Qlty2 (MQT)(x)
BR MuniYld Qly 3 (MYI)(x)
12.03
13.33
13.51
11.90
12.86
10.33
11.63
12.19
10.35
11.64
–14.1
–12.8
–9.8
–13.0
–9.5
17.9
13.3
20.7
16.6
23.5
9.8
9.7
10.2
5.8
8.8
–3.9
–4.0
–5.0
–5.2
–2.6
2.2
2.8
3.6
2.7
3.9
3.3
4.1
4.0
4.1
4.4
10.2
6.9
9.4
8.4
9.8
BlackRock NY Mun (BNY)
BlackRock Res & Comm (BCX)
12.37
10.57
10.53
8.88
–14.9
–16.0
17.0
–1.9
8.7
–4.9
–6.1
12.6
1.4
12.0
3.2
4.8
10.2
–0.4
f — Rights offering in progress.
g — Rights offering announced.
h — Lipper data has been adjusted for rights offering.
QTR
1-YRNAV
% RETURN
Data provided by
NAV
MARKET
($/SHR)
PRICE
12/29/23 12/29/23
PREM/
DISC
12/29/23
QTR
FUND NAME (SYMBOL)
MARKET RETURNS THROUGH 12/29
1 YR
3 YRS
5 YRS
(Annualized)
BlackRock Sci&Tech Term (BSTZ)
BlackRock Sci&Tech Trust (BST)
BlackRock Tax Muni Bd (BBN)
21.40
34.70
18.07
16.71
33.66
16.26
–21.9
–3.0
–10.0
3.2
9.6
9.2
18.7
30.2
3.5
–15.0
–6.5
–9.8
I
13.3
1.1
I
I
5.2
19.7
30.7
11.5
BlackRock Utl Inf & Pwr (BUI)
BlackRock VA Mun (BHV)
Blackstone Lng-Sh Cr Inc (BGX)
BS SFR 2027 T (BSL)
BS St Cr 2027 Tm (BGB)
22.54
12.69
13.13
14.63
12.66
21.82
10.86
11.45
13.35
11.32
–3.2
–14.5
–12.8
–8.7
–10.6
12.0
17.8
2.1
4.4
6.7
12.3
–1.1
18.9
20.0
19.5
1.8
–8.8
3.6
5.9
5.0
9.0
–3.3
5.6
5.3
5.3
9.5
1.6
4.5
4.2
4.2
7.5
6.8
16.0
15.4
15.5
BNY Mellon Alct GCI 2024 (DCF)
BNY Mellon Hi Yield Str (DHF)(x)
BNY Mellon Muni Bd Infra (DMB)
BNY Mellon Muni Income (DMF)
BNY Mellon Str Muni Bond (DSM)
8.63
2.69
12.08
7.70
6.75
8.15
2.29
10.31
6.50
5.71
–5.6
–14.9
–14.7
–15.6
–15.4
6.9
9.9
5.0
15.5
16.1
22.8
15.0
2.4
7.1
3.2
5.6
–0.6
–5.5
–6.1
–5.8
8.6
5.4
1.9
1.2
0.8
I
3.4
5.2
2.6
2.9
21.3
16.8
8.1
8.9
8.0
BNY Mellon Strat Muni (LEO)
BrndywnGLB Glb Inc Oppts (BWG)
Brookfield Real Asst Inc (RA)
CalamosConvHi (CHY)
CalmosConvOp (CHI)
7.00
9.73
14.93
10.67
10.09
5.86
8.36
12.81
11.47
10.36
–16.3
–14.1
–14.2
7.5
2.7
11.1
14.8
7.6
6.9
2.3
0.1
16.0
–8.0
21.9
10.5
–7.4
–2.9
2.5
2.5
0.9
0.8
4.9
5.2
14.0
13.0
3.0
2.4
I
8.9
7.6
7.5
18.2
10.5
13.8
13.6
Calmos Dyn Conv and Inc (CCD)
Calamos GloDynInc (CHW)
CalamosGlbTotRet (CGO)
Calamos L/S Eqty and DI (CPZ)
CalamosStratTot (CSQ)
19.47
6.70
10.18
17.34
15.29
19.78
5.77
9.08
14.45
14.87
1.6
–13.9
–10.8
–16.7
–2.7
10.7
7.9
7.6
1.6
8.8
9.0
14.5
14.0
6.3
20.9
–1.7
–6.7
–6.3
3.5
6.2
14.7
7.4
7.7
I
16.1
I
6.0
5.5
I
12.3
12.7
18.2
15.7
8.5
27.1
Cdn Genl Inv (CGI)(y)
Carlyle Credit Income (CCIF)
CBRE GlbRlEst (IGR)
Central and Eastern Euro (CEE)(x)
Central Secs (CET)(x)
55.63
7.99
6.20
9.85
46.49
34.73
7.95
5.43
9.75
37.77
–37.6
–0.5
–12.4
–1.0
–18.8
–1.8
1.0
25.4
17.6
11.3
9.5
1.4
8.7
22.5
18.8
2.5
2.9
2.4
–23.3
12.3
14.3
I
7.4
–11.6
15.7
10.1
I
4.9
–7.6
12.5
17.3
–13.7
11.1
48.5
19.7
China (CHN)
ClearBridge MLP & Midstm (CEM)
CloughGlobDivandInc (GLV)
CloughGlobalEquity (GLQ)
CloughGlobalOpprty (GLO)
11.93
43.36
6.32
7.24
5.76
10.16
40.09
5.15
5.93
4.70
–14.8
–7.5
–18.5
–18.2
–18.4
–3.7
16.2
7.3
11.6
9.5
–21.2
30.1
–8.4
2.7
4.7
–19.6
44.0
–10.4
–14.1
–14.6
0.3
3.6
0.0
1.3
2.1
1.8
–3.5
1.0
2.2
1.9
–19.1
18.5
–1.5
11.5
10.0
CohenStrsCEOppFd (FOF)
ChnStrInfr (UTF)
CohenStrsLtdDurPref&Inc (LDP)
Cohen&SteersQualInc (RQI)
CohenStrs Real Est and I (RLTY)
10.82
22.88
20.53
13.05
16.08
11.20
21.24
18.43
12.24
13.99
3.5
–7.2
–10.2
–6.2
–13.0
11.3
11.0
10.4
23.7
10.0
18.2
–3.8
5.8
15.7
14.0
5.5
1.0
–3.9
7.7
I
9.4
9.5
4.7
11.8
I
7.7
8.6
6.2
10.9
I
12.4
1.9
7.0
15.1
12.3
CohenStrsSelPref&Income (PSF)
CohenStrsTaxAvPreSecs&I (PTA)
Cohen&Steers TotRet (RFI)(x)
CohenStrsREITPrefInc (RNP)
Columbia Sel Prm Tech Gr (STK)
20.35
19.94
11.96
20.77
29.05
18.90
18.01
11.75
20.16
31.60
–7.1
–9.7
–1.8
–2.9
8.8
6.6
5.5
14.6
20.2
19.2
9.9
11.6
4.5
7.8
47.4
–4.7
–4.2
4.6
4.8
15.5
3.7
I
10.5
11.2
24.3
6.0
I
8.6
10.9
20.0
7.6
7.6
12.2
12.2
39.1
Cornerstone Str Val (CLM)
Cornerstone Total Return (CRF)
CrSuisHighYld (DHY)
CSAM Income Fd (CIK)
Destra Multi-Altrntv (DMA)
6.77
6.49
2.18
2.96
11.15
7.19
7.06
1.98
3.13
6.23
6.2
8.8
–9.2
5.7
–44.1
–5.6
–6.6
7.9
23.9
4.2
21.4
23.6
24.1
37.1
–3.8
6.7
7.0
4.3
9.3
N/A
14.9
14.6
7.5
12.2
N/A
10.2
10.9
5.5
7.7
I
30.0
29.3
18.6
19.2
5.1
DNP Select Income (DNP)(x)
DoubleLine Inc Sol (DSL)
DoubleLine Yld Opps (DLY)
DoubleLine:Oppor Crdt Fd (DBL)
DTF Tax-Fr Inc 2028 Term (DTF)(x)
8.02
12.27
15.78
14.98
12.40
8.48
12.24
14.87
15.35
10.75
5.8
–0.2
–5.8
2.5
–13.3
–8.7
7.5
3.9
7.7
1.7
–17.2
23.5
25.4
13.2
2.1
2.3
0.9
1.6
–0.1
–7.0
4.5
3.8
I
3.9
0.7
7.6
4.7
I
5.3
1.8
–1.7
15.4
15.4
12.6
2.7
Duff&Ph Uti&Infra Inc Fd (DPG)
DWS Muni Inc (KTF)(x)
DWS Strat Mun (KSM)
Eagle Capital Growth (GRF)
Eagle Point Credit (ECC)
10.75
10.49
10.09
N/A
N/A
9.17
8.89
8.65
N/A
9.50
–14.7
–15.3
–14.3
N/A
N/A
8.7
16.5
16.0
N/A
–5.0
–24.5
7.1
10.3
N/A
9.3
0.9
–4.8
–4.6
N/A
16.0
5.6
1.4
1.2
N/A
9.7
2.2
2.3
2.0
N/A
I
–4.6
9.9
10.0
N/A
N/A
Eagle Point Income (EIC)
EVCAMuniBd (EVM)
EVCAMuniIncm (CEV)
EtnVncEqtyInc (EOI)
EtnVncEqtyIncoII (EOS)
N/A
10.56
11.94
17.13
19.71
14.57
9.15
10.34
16.58
18.72
N/A
–13.4
–13.4
–3.2
–5.0
3.6
13.9
14.1
6.8
11.1
18.5
10.3
8.2
20.7
22.6
11.2
–4.0
–4.9
8.9
2.8
I
2.8
3.0
13.3
13.1
I
3.8
3.8
10.6
11.7
N/A
7.6
7.0
24.3
35.3
EtnVncFltRteInc (EFT)
EVLmtDurIncm (EVV)
EVMuniInc2028 (ETX)
EVMuniBd (EIM)
EVMuniIncm (EVN)
13.22
10.71
18.98
11.67
11.45
12.55
9.58
17.34
10.13
9.82
–5.1
–10.6
–8.6
–13.2
–14.2
6.2
8.7
3.3
14.3
11.6
27.2
13.3
1.3
1.7
4.4
7.2
1.4
–5.8
–5.3
–5.5
8.1
5.3
2.2
2.3
1.8
5.2
4.2
6.2
3.9
4.8
17.4
13.0
4.3
7.6
7.1
EVNatMuniOpp (EOT)
Eaton Vance NY Muni Bd (ENX)
EVRskMnDvsEqInc (ETJ)
EV SenFlRtTr (EFR)
EVSnrIncm (EVF)(x)
18.53
11.04
8.49
12.98
6.19
16.92
9.65
7.84
12.66
6.31
–8.7
–12.6
–7.7
–2.5
1.9
5.6
17.6
4.4
8.7
11.2
7.7
11.3
14.2
29.3
34.5
–2.3
–4.0
–0.1
8.7
8.6
2.3
1.5
9.2
8.6
9.3
4.0
3.1
6.5
5.7
6.3
8.3
9.7
15.5
16.8
17.1
EtnVncStDivInc (EVG)
ETnVncTxMgdBuyWrtInc (ETB)
EtnVncTxMgdBuyWrtOpp (ETV)
EvTxMnDvsEqInc (ETY)
11.10
14.21
13.21
12.73
10.38
12.98
12.33
12.19
–6.5
–8.7
–6.7
–4.2
2.4
5.2
5.5
7.9
11.9
7.5
10.1
21.9
3.7
3.8
1.9
8.5
5.0
8.5
7.9
12.9
4.1
7.5
8.3
10.4
13.3
17.6
19.3
23.6
j — Rights offering expired, but Lipper data not yet adjusted.
o — Tender offer in process.
v — NAV is converted at the commercial Rand rate.
x — Leveraged fund.
y — NAV and market price are in Canadian dollars.
10 YRS
1-YRNAV
% RETURN
January 8, 2024
BARRON’S
•
L49
Funds Quarterly
s Copyright Lipper
For personal non-commercial use only. Do not edit or alter. Reproductions not permitted.
To reprint or license content, please contact Barron's reprints department at 800-843-0008 or www.djreprints.com
Closed-End Funds
FUND NAME (SYMBOL)
NAV
MARKET
($/SHR)
PRICE
12/29/23 12/29/23
PREM/
DISC
12/29/23
QTR
NAV RETURNS THROUGH 12/29
1 YR
3 YRS
5 YRS
(Annualized)
EVTxAdvDivIncm (EVT)
24.50
22.25
–9.2
7.3
5.8
5.5
11.6
9.8
10.6
EV TxAdvGlbDivInc (ETG)
EtnVncTxAdvOpp (ETO)
EtnVncTxMgdGlbB (ETW)
EVTxMnGblDvEqInc (EXG)
Ecofin S&S Impact Term (TEAF)
19.64
26.39
9.05
8.89
15.01
17.10
23.64
7.77
7.72
11.71
–12.9
–10.4
–14.1
–13.2
–22.0
13.3
12.8
4.1
7.1
0.0
22.0
21.6
9.4
11.5
–0.6
5.5
5.4
1.5
4.5
3.9
13.2
13.6
5.1
10.2
I
8.1
9.0
5.3
7.4
I
27.7
24.8
16.9
19.8
0.6
Ellsworth G&I Fund Ltd (ECF)
Equus II (EQS)(x)
European Equity Fund Inc (EEA)(x)
FedHrmsPremMuI (FMN)
First Trust Energy Inc G (FEN)
9.55
N/A
10.39
12.69
15.85
8.08
1.45
N/A
10.99
14.48
–15.4
N/A
N/A
–13.4
–8.6
2.1
–2.0
N/A
15.9
12.7
8.0
1.4
N/A
9.2
11.4
–9.8
–12.4
N/A
–5.3
20.5
7.3
–5.9
N/A
2.3
5.0
7.4
–3.1
N/A
3.3
1.3
7.7
N/A
19.9
8.3
11.8
First Tr Enhanced Eq (FFA)
First Tr Hi Inc Lng/Shrt (FSD)
First Tr Specialty Fn (FGB)
FT/Sr Fltg Rte Inc 2 (FCT)
First Tr/abrdn Glbl In (FAM)
18.74
12.90
4.13
11.17
6.92
18.27
12.09
3.58
10.09
6.29
–2.5
–6.3
–13.3
–9.7
–9.1
7.7
16.1
8.8
3.9
13.8
24.7
18.1
29.5
18.0
17.1
8.6
3.3
14.8
4.7
–6.9
15.3
8.0
2.8
7.2
1.7
10.9
5.3
2.5
4.1
1.3
20.5
13.6
26.2
11.8
14.4
FirstTrEnergyInfra (FIF)
First Trust HY Opp:2027 (FTHY)
FirstTrIntDurPref&Inc (FPF)
FirstTrMLPEner&Inc (FEI)
First Trust Mtge Inc (FMY)
17.45
15.96
18.52
9.40
12.57
16.46
13.93
16.31
8.57
12.12
–5.7
–12.7
–11.9
–8.8
–3.6
10.8
7.7
13.0
10.3
11.5
22.8
14.6
5.3
18.3
16.1
23.6
–3.1
–5.4
23.1
1.3
12.6
I
3.6
6.9
4.2
5.7
I
5.4
0.6
3.4
9.4
13.0
6.2
10.3
10.6
First Trust NewOppsMLP&E (FPL)
Firsthand Technology Val (SVVC)
FlrtyPfd and Inc (PFD)(x)
FFlrtyPfdandIncOpp (PFO)(x)
Flrty&CrmneDynPfd&Inc (DFP)
7.49
N/A
11.38
9.29
20.44
6.88
N/A
9.88
7.96
17.75
–8.1
N/A
–13.2
–14.3
–13.2
11.8
N/A
10.1
8.9
7.8
22.2
N/A
–4.8
–0.6
2.1
26.6
N/A
–13.7
–9.1
–8.2
7.5
N/A
3.9
1.5
5.0
I
N/A
5.3
5.1
6.6
13.0
N/A
7.3
7.4
8.2
Flrty&Crumrine Pf&In Sec (FFC)
Flrty&CrmneTotRet (FLC)
Foxby Corp. (FXBY)
Franklin Ltd Dur Income (FTF)
Franklin Univ (FT)(x)
15.81
16.99
23.65
7.18
7.55
13.90
14.55
13.12
6.22
6.65
–12.1
–14.4
–44.5
–13.4
–11.9
9.2
8.2
10.6
5.1
6.8
–0.2
–0.8
–0.5
12.2
6.5
–9.4
–8.5
11.4
–2.9
3.3
3.8
4.0
11.2
3.5
7.7
5.6
5.3
4.8
2.3
6.2
7.2
7.3
27.8
12.4
5.4
FS Credit Opportunities (FSCO)
Gabelli Conv Sec (GCV)(x)
GabelliDiv&IncTr (GDV)
Gabelli Equity Tr (GAB)(h)
Gabelli Gl Sm&Mid Cp Val (GGZ)
6.91
3.86
25.58
5.19
13.89
5.67
3.60
21.64
5.08
11.73
–17.9
–6.7
–15.4
–2.1
–15.6
7.9
–0.8
13.2
1.9
14.8
I
–15.3
11.9
4.2
10.6
I
–7.7
6.4
4.0
2.4
I
6.1
10.1
11.7
10.0
I
5.4
6.7
7.0
I
20.1
3.9
12.2
14.8
9.8
Gab Gl Util & Inc (GLU)(h)
Gabelli Healthcare (GRX)(h)
Gabelli Multimedia (GGT)(x)
Gab Utility (GUT)
GAMCOGlGold&NatRes (GGN)
14.87
11.58
3.74
2.94
3.97
13.18
9.33
5.67
5.42
3.76
–11.4
–19.4
51.6
84.4
–5.3
–0.2
10.5
2.0
7.7
5.2
2.0
–3.3
32.6
–13.2
14.1
–3.8
–1.9
5.5
2.5
12.7
3.2
6.4
11.3
14.0
12.5
2.7
5.0
5.5
12.4
3.8
1.2
1.6
20.3
–3.1
12.4
GDL Fund (GDL)
GeneralAmer (GAM)
Guggenheim Active Alloc (GUG)
Guggeneheim Strat Opps (GOF)
Guggenheim Tx MuB&Inv GD (GBAB)
10.19
51.91
16.66
12.34
15.97
8.04
42.95
14.66
12.80
16.19
–21.1
–17.3
–12.0
3.7
1.4
5.3
11.4
11.4
–9.4
6.8
9.0
26.8
20.6
0.3
8.9
3.1
11.3
I
1.5
–6.7
2.8
15.6
I
7.6
1.5
2.6
9.7
I
8.1
5.6
7.1
25.9
16.5
16.3
10.5
Herzfeld Caribb (CUBA)
HiIncBd (PCF)
Highland Global Alloc (HGLB)
Highland Oppty & Income (HFRO)
India Fund (IFN)
3.49
7.46
11.49
12.61
17.87
2.78
6.42
7.86
7.69
18.29
–20.3
–13.9
–31.6
–39.0
2.4
–12.8
6.8
1.6
–1.5
7.6
–13.6
10.5
–6.1
–16.9
36.7
–5.0
1.4
18.2
–0.6
12.0
3.7
3.2
I
–1.3
11.9
–1.2
4.9
I
I
10.9
–14.5
13.5
6.0
–2.8
21.4
Insight Select Income (INSI)
InvAdvMuIncTrII (VKI)(x)
InvescoBond (VBF)
InvCaValMuIncTr (VCV)(x)
InvDYCrOpp:AX (VTA)
17.59
9.95
16.45
11.49
11.18
15.97
8.45
15.21
9.80
N/A
–9.2
–15.1
–7.5
–14.7
N/A
9.1
15.4
6.8
17.5
N/A
11.1
3.1
2.3
7.9
N/A
–4.5
–4.7
–6.5
–5.4
N/A
3.7
1.9
3.9
1.6
N/A
3.8
3.5
4.2
3.6
N/A
8.8
9.7
7.8
9.8
10.7
Invesco HI 2024 Tgt Term (IHTA)
InvHighIncTrII (VLT)(x)
Invesco MuniOp (OIA)
InvescoMuOppTr (VMO)(x)
InvescoMuTr (VKQ)(x)
7.56
11.66
6.43
11.12
11.15
6.89
10.39
6.35
9.61
9.53
–8.9
–10.9
–1.2
–13.6
–14.5
0.7
7.6
10.8
18.1
15.6
–9.9
13.1
7.2
1.5
0.9
–2.5
0.9
–2.1
–4.6
–4.9
0.4
5.8
3.4
1.9
1.8
I
4.4
5.8
3.6
3.6
–5.1
11.6
8.3
9.6
9.6
InvPAValMuIncTr (VPV)(x)
InvescoQual Inc (IQI)(x)
InvSnrIncTr (VVR)(x)
InvTrInvGrMu (VGM)(x)
InvTrInvGrNYMu (VTN)(x)
11.80
11.22
4.10
11.47
12.22
10.00
9.51
4.10
9.89
10.41
–15.3
–15.2
0.0
–13.8
–14.8
12.8
14.7
8.0
17.7
15.4
6.1
5.9
20.9
3.0
7.3
–3.6
–5.5
11.8
–4.7
–3.2
1.7
1.6
10.3
1.9
1.7
3.4
3.9
5.8
3.5
2.8
6.1
9.5
13.4
9.5
9.3
InvescoValMunInc (IIM)(x)
J Han Finl Opptys (BTO)
J Han Hdgd Ety & Inc (HEQ)
J Han Income (JHS)
J Han Investors (JHI)
13.70
30.57
11.61
12.07
14.47
11.73
30.08
10.05
10.88
12.94
–14.4
–1.6
–13.4
–9.9
–10.6
14.1
17.2
7.7
7.3
8.8
2.1
–0.6
–3.2
6.1
10.6
–4.6
7.5
5.5
–6.9
–1.9
2.0
9.7
5.0
2.0
6.2
3.7
9.2
4.6
2.8
4.4
9.0
2.5
8.7
7.1
15.3
JHanPrefInc (HPI)
JHPrefIncII (HPF)
HnckJPfdInco III (HPS)
J Han Prm (PDT)(x)
JHancockTaxAdv Gl Sh Yld (HTY)
15.39
15.39
13.85
11.88
5.24
15.78
15.78
14.14
10.65
5.11
2.5
2.5
2.1
–10.4
–2.5
12.0
11.9
8.9
13.5
20.4
8.6
11.1
8.1
–9.5
18.2
1.3
2.4
1.9
–1.1
9.5
5.0
5.0
6.2
3.2
6.2
7.2
7.2
7.4
8.1
2.4
9.8
9.9
9.8
1.1
8.6
JHancockTaxAdvDiv (HTD)
Japan Smaller Cap (JOF)
KayneEnrgyInfraInc (KYN)
KKR Income Opportunities (KIO)
Korea (KF)
21.26
9.25
10.43
13.43
28.36
18.97
7.59
8.78
12.57
23.40
–10.8
–17.9
–15.8
–6.4
–17.5
9.4
10.6
4.4
8.3
11.3
–9.9
21.4
13.3
29.0
12.3
3.8
–1.9
25.3
5.5
–5.3
5.9
2.9
1.7
7.9
4.5
8.2
5.9
–4.6
6.5
2.4
–1.7
19.1
12.8
23.2
14.8
10 YRS
12
MONTH
YIELD
Data provided by
FUND NAME (SYMBOL)
NAV
MARKET
($/SHR)
PRICE
12/29/23 12/29/23
PREM/
DISC
12/29/23
LazardGlbTotRetInc (LGI)
Liberty All-Star Equity (USA)
Liberty All-Star Growth (ASG)
LMP CapInco (SCD)
Macquarie/FirstTr Gl (MFD)
17.93
6.75
5.75
15.57
9.05
15.32
6.38
5.28
14.01
7.87
–14.6
–5.5
–8.2
–10.0
–13.0
12.9
10.4
9.1
15.1
16.4
12.9
23.5
16.3
28.1
7.7
4.0
8.0
–4.8
15.8
7.2
11.4
14.7
14.2
16.1
6.4
7.6
10.9
9.8
8.2
1.9
19.7
26.1
19.0
23.4
8.1
Madison CovCall & Eq Str (MCN)
MexicoEqandIncmFd (MXE)
Mexico (MXF)
MFS Charter (MCR)(x)
MFS Govt Mkts (MGF)
7.06
15.23
23.52
6.97
3.40
7.53
11.20
19.08
6.46
3.18
6.7
–26.5
–18.9
–7.3
–6.5
9.3
22.3
17.4
12.8
5.9
7.5
31.0
35.8
14.6
3.8
14.5
5.7
16.4
–1.7
–4.5
15.8
2.9
12.7
6.2
0.7
9.5
–0.7
1.1
5.3
1.8
10.8
33.0
38.1
12.0
4.8
4.17
3.81
2.92
1.89
8.74
3.55
3.31
2.68
1.72
7.57
–14.9
–13.1
–8.2
–9.0
–13.4
15.1
6.9
2.3
12.4
8.1
6.4
10.3
6.3
11.8
10.4
–6.9
–4.8
–2.7
–3.1
–4.2
–0.5
0.1
2.8
5.6
1.6
3.2
3.2
2.6
4.7
3.6
7.3
7.7
5.7
15.4
8.0
MFS Multimkt (MMT)(x)
MFS Muni Inco (MFM)
MFS Special Value (MFV)
Miller/Howard High Inc E (HIE)
MS ChinaShrFd (CAF)(J)
5.12
6.04
4.43
11.14
14.87
4.55
5.17
4.09
10.61
12.74
–11.1
–14.4
–7.7
–4.8
–14.3
9.2
14.9
7.7
8.6
3.3
10.1
4.1
8.7
7.9
–9.4
–1.3
–4.1
–1.1
17.8
–14.8
6.4
1.1
6.5
10.9
–3.0
4.9
3.3
4.9
I
3.9
13.4
7.4
9.0
5.4
–12.2
MS EmMktDomDebt (EDD)
Ms EmMktDebtFd (MSD)(x)
MS India (IIF)
MS CBRE Gl In Mg Term (MEGI)
Neuberger Brmn Enrgy I&I (NML)
5.50
7.65
26.63
15.53
7.83
4.66
6.95
21.47
12.98
6.88
–15.3
–9.2
–19.4
–16.4
–12.1
11.5
10.3
10.2
13.7
2.6
14.1
19.1
21.3
5.5
14.6
–3.1
–1.8
12.9
I
35.0
2.1
3.5
8.8
I
8.0
–2.0
3.5
10.7
I
–2.6
13.8
12.0
21.1
2.3
5.7
NeubHgYldStrt (NHS)
NeubrgrBrm (NBH)
Neuberger Nxt Gen Conn (NBXG)
NubrgrRlEstSec (NRO)
New Amer Hi Inc (HYB)(h)
8.15
12.09
13.61
3.62
8.29
7.72
10.35
10.93
3.19
7.04
–5.3
–14.4
–19.7
–11.9
–15.1
6.3
13.7
7.9
18.1
11.3
3.9
4.0
34.9
15.1
14.7
–2.4
–7.5
I
–1.1
0.7
6.2
1.0
I
4.9
6.5
4.0
2.3
I
6.2
5.1
8.7
7.3
28.6
18.1
16.5
New Germany (GF)(x)
Nuv Dow 30 Dyn Overwrite (DIAX)
Nuveen AMT-Fr Mu Val (NUW)
Nuveen AMT-Fr Qlty Mun I (NEA)
Nuveen AMT-Fr Mu CI (NVG)
10.66
16.22
15.46
12.96
13.91
8.74
14.00
13.63
11.00
11.82
–18.0
–13.7
–11.8
–15.1
–15.0
7.7
4.3
2.7
15.0
16.2
11.7
–2.1
3.8
0.7
1.9
–8.3
4.7
–2.6
–5.8
–6.5
8.2
4.6
1.9
2.4
1.8
6.1
6.2
3.2
4.3
5.0
15.6
7.7
7.6
8.2
9.5
Nuveen AZ Qual Muni Inc (NAZ)(x)
Nuveen CA AMT-F Qual MI (NKX)
Nuveen CA Val (NCA)
NuveenCAQtyMuInc (NAC)
Nuveen CA Sel Tx-Free (NXC)
12.78
13.41
9.43
12.93
14.04
10.71
11.54
8.96
11.09
12.79
–16.2
–13.9
–5.0
–14.2
–8.9
12.3
13.9
10.3
16.3
6.2
–0.5
–1.9
10.4
4.5
–7.2
–8.7
–5.7
–2.7
–5.8
–4.1
2.0
2.5
3.1
1.7
2.8
3.3
4.5
3.6
3.7
3.5
6.6
7.3
6.3
6.9
6.3
NuvCorEqAlpha (JCE)
NuvCorePlusImpact (NPCT)
Nuveen Credit Strat Inc (JQC)
Nuveen Dyn Muni Opp (NDMO)
NuvFloatRateIncFd (JFR)
13.28
11.94
5.93
11.02
9.27
13.55
10.08
5.22
9.91
8.22
2.0
–15.6
–12.0
–10.1
–11.3
11.7
13.0
6.5
2.9
3.3
10.7
7.8
15.2
7.3
16.6
12.5
I
3.9
–8.0
7.2
14.1
I
5.8
I
6.3
10.1
I
3.5
I
4.0
21.8
6.2
14.0
9.4
14.0
Nuveen Global High Inc (JGH)
Nuveen MA Qual Muni Inc (NMT)(x)
Nuveen Minn Qual Mun Inc (NMS)(x)
Nuveen MO Qual Mun Inc (NOM)(x)
Nuveen Mortgage and Inc (JLS)
13.37
12.52
12.87
11.92
18.78
12.20
10.51
10.98
10.04
16.88
–8.8
–16.1
–14.7
–15.8
–10.1
9.6
11.9
13.9
10.0
9.1
20.9
2.6
1.6
–0.9
14.5
1.9
–7.1
–5.7
–7.1
1.4
7.2
1.4
2.2
1.2
0.6
I
2.8
1.8
2.0
4.3
15.2
6.9
6.3
7.4
7.9
Nuveen Mu Crdt Opps (NMCO)
Nuveen Multi-Asset Inc (NMAI)
Nuveen Multi-Market (JMM)(x)
Nuv Muni Credit Income (NZF)
NuvMuniHiIncOpp (NMZ)
11.43
13.76
6.49
13.87
11.14
9.97
12.30
5.91
11.82
9.88
–12.8
–10.6
–8.9
–14.8
–11.3
4.3
14.3
6.9
14.8
7.9
–4.2
19.5
6.5
2.5
0.7
–3.3
I
–1.1
–5.3
–6.8
I
I
2.2
2.5
2.2
I
I
3.4
5.0
4.1
2.4
12.8
7.7
9.7
8.6
Nuveen Muni Val (NUV)
Nuveen Nasdaq 100 Dyn Ov (QQQX)
NuvNJ Qual Muni Inc (NXJ)
Nuveen NY AMT/Fr Qual MI (NRK)
Nuveen NY Val (NNY)
9.47
24.68
14.00
12.28
9.10
8.60
23.15
11.78
10.53
8.28
–9.2
–6.2
–15.9
–14.3
–9.0
5.2
4.9
12.4
12.8
4.5
4.0
21.9
7.8
7.0
4.3
–4.8
3.7
–2.3
–3.9
–2.8
2.2
10.7
2.9
2.4
0.6
3.4
10.4
4.6
3.3
3.2
7.1
35.1
8.3
8.8
6.7
Nuveen NY Qual Muni Inc (NAN)
Nuveen NY Sel Tx-Free (NXN)
Nuveen PA Qual Muni Inc (NQP)(x)
Nuveen Pref & Inc Opp (JPC)
Nuveen Pref & Inc Term (JPI)
12.79
12.84
13.71
7.74
19.14
11.04
11.75
11.58
6.76
18.28
–13.7
–8.5
–15.5
–12.7
–4.5
15.6
2.9
14.9
9.1
8.3
7.7
5.6
7.4
0.7
5.4
–3.8
–2.7
–3.3
–3.7
–2.9
2.4
1.7
3.3
3.5
5.1
3.5
2.5
4.4
5.3
5.8
9.1
7.1
7.3
5.9
4.8
Nuveen Quality Muni Inc (NAD)
Nuv Real Est (JRS)
Nuveen Rl Asst Inc & Gro (JRI)
NuvS&P500DynOvFd (SPXX)
Nuveen Sel Mat (NIM)
13.33
8.84
13.69
16.29
10.07
11.45
7.82
11.72
15.04
8.82
–14.1
–11.5
–14.4
–7.7
–12.4
14.3
19.2
13.1
3.5
5.1
1.2
13.3
10.0
0.8
0.7
–5.0
6.0
4.0
6.8
–3.4
2.9
7.0
5.7
8.8
1.4
4.4
6.8
5.6
8.0
2.3
8.4
18.0
9.3
18.5
5.3
Nuveen Sel TF (NXP)
NuvSP500BuyIncFd (BXMX)
Nuveen Taxable Muni Inc (NBB)
Nuveen VA Qlty Mun Inc (NPV)(x)
Nuveen Var Rate P&I (NPFD)
14.76
13.94
17.01
12.69
19.44
14.78
12.83
15.79
10.78
16.25
0.1
–8.0
–7.2
–15.1
–16.4
12.3
3.2
13.6
14.7
5.5
10.7
9.1
7.6
0.4
–1.1
–2.4
7.0
–6.4
–8.5
I
4.8
8.7
2.3
2.4
I
5.4
7.7
4.9
3.6
I
7.6
18.9
13.0
8.9
6.0
NXG Cushing Mdstrm Enrgy (SRV)
NXG NextGen Infras Inc (NXG)
OFS Credit Company (OCCI)
PCM Fund (PCM)(x)
PGIM Global High Yield (GHY)
36.46
39.71
N/A
6.52
12.87
33.89
35.54
6.46
7.96
11.36
–7.0
–10.5
N/A
22.1
–11.7
–3.4
–0.5
–8.9
–7.1
9.4
17.2
4.5
–2.9
16.7
17.3
28.5
7.3
–3.0
2.2
1.9
10.6
1.3
0.8
6.7
7.3
–5.4
–1.2
I
7.5
5.1
7.7
–11.2
N/A
7.5
14.4
PGIM High Yield Bond (ISD)
PGIM Sh Dur Hi Yld Opp (SDHY)
13.93
17.48
12.32
15.00
–11.6
–14.2
8.3
6.6
15.0
11.4
2.8
–2.2
8.3
I
5.4
I
13.4
12.8
MFS HgIncMuniTr (CXE)
MFS HgYldMuniTr (CMU)
MFS Intmdt (MIN)
MFS IntmdHgInc (CIF)(x)
MFS Inv Gr (CXH)
QTR
NAV RETURNS THROUGH 12/29
1 YR
3 YRS
5 YRS
(Annualized)
10 YRS
12MONTH
YIELD
L50
BARRON’S
•
Funds Quarterly
January 8, 2024
Closed-End Funds
FUND NAME (SYMBOL)
NAV
MARKET
($/SHR)
PRICE
12/29/23 12/29/23
PREM/
DISC
12/29/23
PIMCO Access Income (PAXS)
PIMCO CA (PCQ)
PIMCOCAMuniII (PCK)
14.81
10.66
6.80
14.30
9.32
5.80
–3.4
–12.6
–14.7
6.4
13.1
16.9
9.4
–35.4
–10.7
I
–15.0
–9.6
I
–5.0
–1.0
I
2.9
1.5
6.6
7.8
8.3
Pimco CA Muni III (PZC)
PIMCO Corp & Inc Oppty (PTY)
PIMCO Corp & Inc Strat (PCN)
PIMCO Dynamic Inc Strat (PDX)
PIMCO Dynamic Income (PDI)
7.89
11.26
11.57
22.54
17.18
7.37
13.24
12.41
20.48
17.95
–6.6
17.6
7.3
–9.1
4.5
9.0
4.8
5.2
4.4
8.1
–7.5
25.7
18.2
44.5
13.2
–5.9
2.4
0.3
44.2
1.2
–0.3
9.5
7.4
I
3.3
3.6
9.9
8.5
I
8.6
7.3
17.6
16.1
32.1
13.1
PIMCO Dynamic Inc Opp (PDO)
PIMGlbStkPI (PGP)
PIMCOHilnco (PHK)
PIMCO IncmStrFd (PFL)
PIMCO IncmStrFd II (PFN)
12.42
7.45
4.64
8.08
7.11
12.24
7.50
4.99
8.44
7.23
–1.4
0.7
7.5
4.5
1.7
6.5
16.9
16.6
13.6
13.3
8.3
21.6
19.8
17.9
15.9
I
0.4
5.0
1.0
0.6
I
2.1
2.4
6.0
5.5
I
2.7
6.1
7.9
7.7
5.5
21.1
13.6
13.9
13.6
9.73
9.01
8.30
8.98
8.66
9.33
8.30
7.39
7.86
7.59
–4.1
–7.9
–11.0
–12.5
–12.4
12.7
9.6
15.9
10.5
19.8
–5.7
–3.0
–10.7
–8.6
0.2
–7.5
–11.3
–10.0
–8.1
–7.0
–0.4
–3.3
–2.8
–3.1
–1.8
3.5
3.9
3.1
2.8
2.6
7.9
8.6
8.7
8.1
9.0
Pimco NY Muni III (PYN)
PIMCO Stratg Inc (RCS)(x)
PionrDivHiInc (HNW)
PionrFltRate Tr (PHD)
PioneerHilncm (PHT)
6.88
4.38
12.18
10.16
8.04
5.96
6.08
10.73
9.17
N/A
–13.4
38.8
–11.9
–9.7
N/A
13.8
18.8
8.6
6.0
N/A
–8.4
41.8
19.2
18.2
N/A
–8.1
7.9
–0.1
5.9
N/A
–2.4
2.2
5.8
7.2
N/A
1.9
7.1
2.8
4.0
N/A
8.0
15.2
15.4
16.1
16.7
PioneerHilncAdv (MAV)
PionrMuniHiIncOppty (MIO)
PioneerMunHiIcm (MHI)
Principal Real Est Inc (PGZ)
Putnam Mgd Inc (PMM)(x)
9.43
12.60
10.12
10.85
6.71
8.02
10.57
8.63
9.45
6.08
–15.0
–16.1
–14.7
–12.9
–9.4
20.6
12.1
20.6
8.3
12.6
3.9
4.4
5.4
4.0
2.0
–7.2
I
–7.1
1.3
–4.1
0.1
I
0.0
–2.0
3.2
1.3
I
1.1
3.3
4.7
7.9
7.1
7.2
–3.4
10.4
Putnam Mas Int (PIM)
Putnam Muni Opp (PMO)(x)
Putnam Prem Inc (PPT)
ReavesUtilityIncome (UTG)
RENN Fund (RCG)
3.47
11.54
3.86
26.69
1.97
3.19
10.23
3.57
26.74
1.71
–8.1
–11.4
–7.5
0.2
–13.2
7.9
12.4
9.0
11.7
–3.6
8.4
–1.3
7.4
2.9
–4.7
–1.9
–4.6
–0.9
0.7
0.6
2.1
3.4
2.7
5.2
3.2
2.6
5.0
3.0
7.8
1.9
5.3
10.6
5.8
0.3
–5.9
RiverNorth Cap and Inc (RSF)
RiverNorth DL Str Oppty (OPP)
RiverNorth Flex Muni Inc (RFM)
RiverNorth Flx Mu Inc II (RFMZ)
RiverNorth Mgd Dur Mu II (RMMZ)
16.77
9.63
16.97
15.42
17.35
15.75
8.36
15.47
13.10
15.65
–6.1
–13.2
–8.8
–15.0
–9.8
6.2
9.8
10.4
8.5
11.3
3.8
11.4
6.5
4.5
11.2
9.2
–3.3
–3.1
I
I
I
1.1
I
I
I
I
I
I
I
I
8.5
11.7
3.3
6.7
6.9
RiverNorth Mgd Dur Mun I (RMM)
RiverNorth Opportunities (RIV)
RiverNorth Opps Muni Inc (RMI)
Royce Global Value Trust (RGT)
Royce Micro-Cap Tr (RMT)(x)
16.31
12.40
17.18
11.72
10.47
14.18
10.99
15.23
9.75
9.24
–13.1
–11.4
–11.4
–16.8
–11.7
5.4
8.4
8.2
13.8
14.5
5.9
2.6
0.2
14.6
15.9
–1.0
1.3
–3.3
–3.4
7.2
I
6.2
1.6
8.1
15.5
I
I
I
4.6
8.8
7.4
14.6
5.8
15.9
15.5
Royce Value Trust (RVT)(x)
Saba Capital Income & Op (BRW)(x)
Templtn Glbl Inc (SABA)
Source Capital (SOR)(x)
Special Opportunities (SPE)(x)
16.42
8.26
4.31
43.91
14.31
14.56
7.71
3.79
40.38
11.86
–11.3
–6.7
–12.1
–8.1
–17.1
15.6
6.4
0.4
6.3
11.1
18.9
18.4
–4.5
11.1
14.1
5.2
6.7
–4.2
8.1
4.8
13.3
6.1
–2.3
10.7
10.2
8.0
3.4
–1.1
6.9
5.9
20.6
11.1
0.0
15.4
18.8
Sprott Focus Trust (FUND)(x)
SRH Total Return (STEW)
Swiss Helvetia (SWZ)
Taiwan (TWN)
TCW Strat Income (TSI)
8.91
17.39
9.76
43.55
5.05
8.00
13.87
8.20
34.59
4.59
–10.2
–20.2
–16.0
–20.6
–9.1
8.0
7.9
9.1
16.8
1.5
6.9
13.5
15.5
51.7
4.6
12.9
11.5
4.0
13.8
–1.1
15.0
9.9
9.8
25.0
3.3
8.1
9.5
5.8
12.4
4.2
11.2
17.8
16.9
57.7
7.4
Tekla Health Inv (HQH)
Tekla Healthcare Opps (THQ)
Tekla Life Sciences Inv (HQL)
Tekla World Healthcare (THW)
Templeton Dragon (TDF)
19.82
21.20
16.18
11.99
9.42
16.57
18.11
13.46
11.67
8.17
–16.4
–14.6
–16.8
–2.7
–13.3
9.3
8.8
10.7
2.7
–4.3
1.3
–1.6
4.4
–10.8
–20.1
–3.3
2.7
–3.8
0.1
–24.0
7.5
8.8
7.1
11.1
–2.9
4.1
I
5.2
I
1.0
3.1
1.9
6.1
2.3
–21.1
Templeton Em Mkt (EMF)
Templeton Em Inc (TEI)
Thornburg Inc Bldr Opps (TBLD)
Tortoise Energy Ind (NDP)
Tortoise Enrgy Infra Crp (TYG)
13.53
5.90
18.09
34.94
35.64
11.68
5.10
15.51
28.66
28.77
–13.7
–13.6
–14.3
–18.0
–19.3
9.8
13.8
7.7
–7.6
2.1
8.7
3.9
17.1
7.1
–0.4
–7.8
–3.2
I
37.3
22.0
4.4
–3.1
I
–5.0
–11.3
2.8
–1.2
I
–9.4
–10.1
13.4
14.0
16.8
6.5
–1.8
Tortoise Midstream Enrgy (NTG)
Tortoise Pipelne & Enrgy (TTP)
Tortoise Pwr & Engy Infr (TPZ)
Tri-Continental (TY)(x)
United Corps Ltd (xy) (UNC)
42.45
34.53
16.33
32.65
180.13
34.76
28.11
14.01
28.83
111.31
–18.1
–18.6
–14.2
–11.7
–38.2
4.0
2.5
7.4
9.9
N/A
9.8
14.1
20.7
17.9
13.8
28.6
27.1
17.0
8.5
3.2
–15.4
–3.9
6.0
12.8
6.2
–11.4
–6.0
2.3
10.6
N/A
6.6
15.6
16.4
17.0
N/A
VDivInt&PremStr (NFJ)
Virtus Gl MSec Inc (VGI)
Virtus SH Emerg Mkts Inc (EDF)
VirtusTotalRetFd (ZTR)
Voya Asia Pac Hi Div Eq (IAE)
14.64
8.79
4.47
6.47
7.18
12.60
7.83
4.31
5.51
6.01
–13.9
–10.9
–3.6
–14.8
–16.3
13.5
10.3
1.9
18.2
9.6
21.3
14.6
22.9
–3.2
9.0
5.4
–3.6
–5.8
–2.2
–1.0
11.4
4.4
–1.8
5.6
3.9
5.2
3.9
1.6
6.5
2.8
20.2
10.9
25.7
2.5
10.2
Voya Em Mkts Hi Div Eqty (IHD)
Voya Gl Adv & Prem Opp (IGA)
Voya Gl Eq Div & Prem Op (IGD)
Voya Infr Indus & Matr (IDE)
V Art Int&Tech Opps (AIO)
6.11
9.92
5.83
11.85
20.26
5.29
8.52
4.97
10.18
17.40
–13.4
–14.1
–14.8
–14.1
–14.1
13.2
7.6
4.8
13.2
8.3
13.9
7.6
1.0
22.0
19.3
0.4
8.1
7.4
8.7
–1.0
4.6
7.5
6.1
7.6
I
2.6
6.0
4.3
4.7
I
13.1
8.0
5.9
17.0
16.4
V Conv & Inc 2024 TT (CBH)
V Conv & Inc (NCV)
V Conv & Inc II (NCZ)
V Div Inc & Conv (ACV)
9.18
3.86
3.44
21.36
8.72
3.37
2.98
20.98
–5.0
–12.7
–13.4
–1.8
0.9
11.9
11.5
15.7
7.5
12.7
17.7
26.2
3.1
–6.3
–6.3
0.2
9.1
2.8
3.2
16.2
I
1.4
1.0
I
8.4
13.3
13.7
19.5
s Copyright Lipper
For personal non-commercial use only. Do not edit or alter. Reproductions not permitted.
To reprint or license content, please contact Barron's reprints department at 800-843-0008 or www.djreprints.com
PIMCO MuniInc (PMF)
PIMCOMuniIncII (PML)
Pimco Muni III (PMX)
PIMCO NY (PNF)
PIMCONYMuniII (PNI)
QTR
MARKET RETURNS THROUGH 12/29
1 YR
3 YRS
5 YRS
(Annualized)
10 YRS
1-YRNAV
% RETURN
Data provided by
PREM/
DISC
12/29/23
QTR
MARKET RETURNS THROUGH 12/29
1 YR
3 YRS
5 YRS
(Annualized)
10 YRS
FUND NAME (SYMBOL)
NAV
MARKET
($/SHR)
PRICE
12/29/23 12/29/23
1-YRNAV
% RETURN
V Eqty & Conv Inc (NIE)
23.75
20.91
–12.0
7.7
26.7
3.3
14.1
10.3
22.9
Western Asset Dvsfd Inc (WDI)
WstAstEmergDebt (EMD)
Western Asset Gl Cr D Op (GDO)
WstAstGlHiInco (EHI)
WstAstHIF II (HIX)
15.54
10.57
13.19
7.51
4.87
14.10
9.21
12.77
7.23
4.96
–9.3
–12.9
–3.2
–3.7
1.8
8.8
14.3
10.6
11.9
14.9
23.8
12.2
10.4
19.3
16.1
I
–4.0
–3.1
–0.8
–0.3
I
3.7
4.9
6.8
7.3
I
2.7
4.5
4.4
4.0
16.2
13.1
10.4
10.3
11.1
Western Asset Hi Inc Opp (HIO)
Western Asset Hi Yld D O (HYI)
Western Asset Inf-Lk Inc (WIA)
Western Asset Inf-Lk O&I (WIW)
Western Asset Int Muni (SBI)
4.31
12.55
9.46
10.17
9.09
3.86
12.09
8.12
8.67
7.70
–10.4
–3.7
–14.2
–14.7
–15.3
9.1
7.9
5.8
7.6
8.7
8.0
6.7
5.0
5.1
5.4
0.3
0.5
–5.7
–2.6
–2.5
5.9
6.8
3.6
4.0
1.8
3.7
4.5
2.8
2.8
2.4
9.2
9.6
4.7
5.2
5.9
WA Investment Grade Inc (PAI)
Western Asset Mgd Muni (MMU)
Western Asset Mtg Oppty (DMO)
Western Asset Mun Hi Inc (MHF)
WesternAssetPremBd (WEA)
13.10
11.85
12.06
7.37
11.47
12.04
10.17
11.17
6.42
10.80
–8.1
–14.2
–7.4
–12.9
–5.8
8.4
15.3
7.7
6.5
9.2
9.1
5.6
16.8
4.5
9.6
–4.8
–3.5
2.4
–1.7
–2.2
2.5
–0.1
–1.7
2.2
4.3
3.8
3.2
5.5
3.7
3.9
9.1
8.7
10.6
8.0
9.8
Westn Asst IG Def Opp Tr (IGI)
XAI Octgn Flt Rt & Alt I (XFLT)
17.75
6.88
17.58
7.14
–1.0
3.8
12.5
6.8
13.4
31.1
–3.6
11.8
3.4
12.6
3.7
I
8.8
27.3
Continuously Offered Closed-End Funds
FUND NAME (SYMBOL)
NAV
MARKET
($/SHR)
PRICE
12/29/23 12/29/23
PREM/
DISC
12/29/23
QTR
NAV RETURNS THROUGH 12/29
1 YR
3 YRS
5 YRS
(Annualized)
10 YRS
12
MONTH
YIELD
1WS Credit Income;A2
1WS Credit Income;Inst
ACAP Strategic:A
18.51
18.86
N/A
N/A
N/A
N/A
N/A
N/A
N/A
2.3
2.5
N/A
11.6
12.3
N/A
I
7.0
N/A
I
I
N/A
I
I
N/A
7.0
6.9
N/A
ACAP Strategic:W
Accordant ODCE Index;A
Accordant ODCE Index;I
Accordant ODCE Index;Y
AFA Private Credit;Fndr
N/A
9.87
9.89
9.89
9.31
N/A
N/A
N/A
N/A
N/A
N/A
N/A
N/A
N/A
N/A
N/A
I
–4.8
I
2.1
N/A
I
I
I
8.4
N/A
I
I
I
I
N/A
I
I
I
I
I
I
I
I
I
N/A
I
I
I
7.9
AFA Private Credit;Inst
Alpha Alternative Assets
Alternative Credit Inc:A
Alternative Credit Inc:C
Alternative Credit Inc:I
9.34
6.20
9.68
9.79
9.69
N/A
N/A
N/A
N/A
N/A
N/A
N/A
N/A
N/A
N/A
2.0
0.4
0.8
0.5
0.8
8.4
2.0
4.9
4.1
5.1
I
–8.0
4.7
3.9
4.9
I
I
5.9
5.1
6.1
I
I
I
I
I
7.9
6.1
7.2
6.5
7.5
Alternative Credit Inc:L
Alternative Credit Inc:W
Alternative Strategies:A
Alternative Strategies:C
Alternative Strategies:I
9.68
9.67
17.44
16.52
17.64
N/A
N/A
N/A
N/A
N/A
N/A
N/A
N/A
N/A
N/A
0.7
0.8
2.7
2.8
2.8
4.7
4.8
4.5
4.4
4.6
4.4
4.7
1.2
0.7
1.3
5.6
5.8
–0.1
–0.6
0.1
I
I
0.2
I
I
7.0
7.2
13.1
12.9
13.1
AMG Pantheon:1
Angel Oak Str Crdt:FI
Angel Oak Str Crdt:Inst
Apollo Diversified Cd:A
Apollo Diversified Cd:C
N/A
20.69
20.68
21.75
21.75
N/A
N/A
N/A
N/A
N/A
N/A
N/A
N/A
N/A
N/A
N/A
2.8
2.8
3.1
2.9
N/A
11.9
11.9
14.1
13.4
N/A
I
7.6
4.1
3.9
N/A
I
6.3
5.2
5.1
I
I
I
I
I
N/A
8.4
8.4
8.9
8.2
Apollo Diversified Cd:F
Apollo Diversified Cd:I
Apollo Diversified Cd:L
Apollo Diversified Cd:M
Apollo Diversified RE:A
21.75
21.75
21.74
21.75
25.62
N/A
N/A
N/A
N/A
N/A
N/A
N/A
N/A
N/A
N/A
3.9
3.2
3.0
2.9
2.8
17.6
14.5
13.9
13.6
–3.3
5.4
4.2
4.0
I
6.0
6.0
5.3
5.2
I
4.6
I
I
I
I
I
12.0
9.2
8.7
8.4
5.5
Apollo Diversified RE:C
Apollo Diversified RE:I
Apollo Diversified RE:L
Apollo Diversified RE:M
Arca US Treasury
24.07
26.17
25.24
24.74
1.00
N/A
N/A
N/A
N/A
N/A
N/A
N/A
N/A
N/A
N/A
2.6
2.9
2.8
2.7
N/A
–4.0
–3.0
–3.5
–3.8
N/A
5.3
6.3
5.8
5.5
N/A
3.8
4.9
4.4
4.1
N/A
I
I
I
I
N/A
5.5
5.5
5.5
5.5
N/A
ARK Venture
Aspiriant Rsk-Mgd Cap Ap
Aspiriant Rsk-Mgd RA
Axonic Alternative Inc
BR Credit Strat;A
27.88
N/A
N/A
19.87
8.65
N/A
N/A
N/A
N/A
N/A
N/A
N/A
N/A
N/A
N/A
29.0
N/A
N/A
3.2
3.0
61.2
N/A
N/A
10.2
11.4
I
I
I
6.9
1.2
I
I
I
3.0
I
I
I
I
I
I
0.0
N/A
N/A
8.8
7.7
BR Credit Strat;Inst
BR Credit Strat;U
BR Credit Strat;W
BlackRock Mlt-Sctr Oppty
Blackstone FR EI D
8.62
8.64
8.65
65.34
21.99
N/A
N/A
N/A
N/A
N/A
N/A
N/A
N/A
N/A
N/A
3.2
2.9
3.0
2.1
3.5
12.1
11.3
11.4
7.4
16.7
1.9
I
I
–1.5
4.8
I
I
I
1.7
5.7
I
I
I
I
I
8.4
7.7
7.7
9.3
9.4
Blackstone FR EI I
Blackstone FR EI T
Blackstone FR EI T-I
Blackstone FR EI U
BlueBay Destra Itl E:A
21.97
21.93
22.47
22.89
22.84
N/A
N/A
N/A
N/A
N/A
N/A
N/A
N/A
N/A
N/A
3.7
3.5
3.5
3.5
1.9
17.0
16.5
16.5
16.4
12.6
5.1
4.6
4.6
4.6
16.7
5.9
5.4
I
I
14.4
I
I
I
I
I
9.6
9.1
9.1
9.1
7.4
BlueBay Destra Itl E:I
BlueBay Destra Itl E:L
BlueBay Destra Itl E:T
Bluerock HI Inst Crd:A
Bluerock HI Inst Crd:C
22.85
22.82
22.72
23.53
23.54
N/A
N/A
N/A
N/A
N/A
N/A
N/A
N/A
N/A
N/A
1.9
1.8
1.8
2.7
2.7
12.8
12.3
12.0
8.5
8.6
17.0
16.4
16.1
I
I
14.7
14.1
13.9
I
I
I
I
I
I
I
7.6
7.1
6.9
12.6
12.5
Bluerock HI Inst Crd:F
Bluerock HI Inst Crd:I
Bluerock Total Inc+ RE:A
23.54
23.54
29.43
N/A
N/A
N/A
N/A
N/A
N/A
2.8
2.7
–5.2
8.7
8.6
–11.7
I
I
5.7
I
I
5.1
I
I
6.2
12.6
12.6
5.8
January 8, 2024
BARRON’S
•
L51
Funds Quarterly
s Copyright Lipper
For personal non-commercial use only. Do not edit or alter. Reproductions not permitted.
To reprint or license content, please contact Barron's reprints department at 800-843-0008 or www.djreprints.com
Closed-End Funds
FUND NAME (SYMBOL)
NAV
MARKET
($/SHR)
PRICE
12/29/23 12/29/23
PREM/
DISC
12/29/23
Bluerock Total Inc+ RE:C
Bluerock Total Inc+ RE:I
27.40
30.23
N/A
N/A
N/A
N/A
–5.4
–5.2
–12.3
–11.5
4.9
5.9
4.4
5.4
I
I
5.8
5.8
Bluerock Total Inc+ RE:L
Bluerock Total Inc+ RE:M
BNYM Alcntr Glb MS Cr Fd
Calamos-Aksia ACI:A
Calamos-Aksia ACI:C
28.95
27.54
89.21
10.26
10.26
N/A
N/A
N/A
N/A
N/A
N/A
N/A
N/A
N/A
N/A
–5.3
–5.3
0.9
3.5
3.4
–11.9
–12.2
12.7
I
I
5.4
I
2.3
I
I
4.9
I
I
I
I
I
I
I
I
I
5.8
5.8
4.5
I
I
Calamos-Aksia ACI:I
Calamos-Aksia ACI:M
Cantor Fitzgerald SI:A
Cantor Fitzgerald SI:C
Cantor Fitzgerald SI:I
10.26
10.26
10.64
10.56
10.64
N/A
N/A
N/A
N/A
N/A
N/A
N/A
N/A
N/A
N/A
3.6
3.4
9.1
8.8
9.1
I
I
4.3
I
I
I
I
I
I
I
I
I
I
I
I
I
I
I
I
I
I
I
2.2
I
I
Carlyle AlpInv Pvt Mkt:A
Carlyle AlpInv Pvt Mkt:I
Carlyle Tact Pvt Cred:A
Carlyle Tact Pvt Cred:I
Carlyle Tact Pvt Cred:L
N/A
N/A
8.49
8.52
8.48
N/A
N/A
N/A
N/A
N/A
N/A
N/A
N/A
N/A
N/A
I
N/A
3.0
2.9
2.9
I
I
13.8
14.2
13.8
I
I
7.5
8.0
7.4
I
I
5.5
6.2
5.6
I
I
I
I
I
I
I
10.0
10.4
9.9
Carlyle Tact Pvt Cred:M
Carlyle Tact Pvt Cred:N
Carlyle Tact Pvt Cred:U
Carlyle Tact Pvt Cred:Y
CIM RA&C A
8.53
8.48
8.53
8.49
24.07
N/A
N/A
N/A
N/A
N/A
N/A
N/A
N/A
N/A
N/A
2.9
3.0
2.8
3.0
1.0
13.5
14.4
13.5
14.1
0.5
7.3
8.1
I
7.8
4.5
I
I
I
5.9
I
I
I
I
I
I
9.7
10.5
9.8
10.2
7.2
CIM RA&C C
CIM RA&C I
CIM RA&C L
CION Ares Dvsfd Crdt;A
CION Ares Dvsfd Crdt;C
23.43
24.29
23.84
24.96
24.77
N/A
N/A
N/A
N/A
N/A
N/A
N/A
N/A
N/A
N/A
1.0
1.0
1.0
3.9
3.7
–0.2
0.8
0.3
13.5
12.8
3.7
4.7
4.2
6.4
6.0
I
I
I
6.3
6.0
I
I
I
I
I
7.3
7.2
7.2
8.0
7.3
CION Ares Dvsfd Crdt;I
CION Ares Dvsfd Crdt;L
CION Ares Dvsfd Crdt;U
CION Ares Dvsfd Crdt:U2
CION Ares Dvsfd Crdt;W
25.23
25.04
25.08
25.05
25.23
N/A
N/A
N/A
N/A
N/A
N/A
N/A
N/A
N/A
N/A
3.9
3.8
3.8
3.8
3.8
13.8
13.3
13.1
13.1
13.3
6.8
6.5
6.3
6.3
6.5
6.6
6.3
I
I
6.5
I
I
I
I
I
8.3
7.8
7.5
7.5
7.8
Clarion Partners REI D
Clarion Partners REI I
Clarion Partners REI S
Clarion Partners REI T
CliffwaterClFd;I
11.82
11.83
11.82
11.81
10.54
N/A
N/A
N/A
N/A
N/A
N/A
N/A
N/A
N/A
N/A
0.6
0.7
0.4
0.5
3.2
1.5
1.9
0.8
0.9
12.7
10.8
11.2
10.1
10.2
9.8
I
I
I
I
I
I
I
I
I
I
6.2
6.6
5.7
5.6
11.0
CliffwaterElFd;I
CNR Select Strategies
CNR Strategic Credit
Constitution Cap Acs A
Constitution Cap Acs D
10.72
14.08
7.14
N/A
N/A
N/A
N/A
N/A
N/A
N/A
N/A
N/A
N/A
N/A
N/A
3.2
5.6
4.1
N/A
N/A
12.7
14.2
18.0
N/A
N/A
I
6.8
5.8
I
I
I
6.7
7.5
I
I
I
I
I
I
I
10.7
0.0
22.2
N/A
N/A
Constitution Cap Acs I
CPG Cooper Square IE A
CPG Cooper Square IE I
Eagle Point Instl Income
Floating-Rate Opps;A
N/A
N/A
N/A
N/A
10.18
N/A
N/A
N/A
N/A
N/A
N/A
N/A
N/A
N/A
N/A
N/A
N/A
N/A
N/A
I
N/A
N/A
N/A
N/A
I
I
N/A
N/A
I
I
I
I
I
I
I
I
I
I
I
I
N/A
N/A
N/A
N/A
I
Floating-Rate Opps;I
Floating-Rate Opps;U
Ecofin Tax-Exempt Prv Cr
Economic Inv Tr (xy)
Ellington Inc Opp:A
10.17
10.18
8.37
202.68
8.97
N/A
N/A
N/A
135.50
N/A
N/A
N/A
N/A
–33.1
N/A
4.0
I
2.2
9.7
N/A
I
I
–2.3
N/A
9.7
I
I
1.6
N/A
3.4
I
I
2.0
N/A
I
I
I
I
7.2
I
I
I
4.2
2.9
2.5
Ellington Inc Opp:M
Equalize Community Dev
FedProj&TrFinanceTendr
Fid MS Cr;A
Fid MS Cr;C
8.84
9.22
9.86
10.24
10.24
N/A
N/A
N/A
N/A
N/A
N/A
N/A
N/A
N/A
N/A
N/A
0.8
2.3
4.7
4.5
9.8
3.0
8.6
I
I
3.7
0.1
4.7
I
I
3.2
2.4
4.1
I
I
I
2.3
I
I
I
2.8
3.6
5.9
I
I
Fid MS Cr;I
Fid MS Cr;L
First Eagle Crdt Opps A
First Eagle Crdt Opps A2
First Eagle Crdt Opps I
10.24
10.24
23.78
23.69
23.64
N/A
N/A
N/A
N/A
N/A
N/A
N/A
N/A
N/A
N/A
4.7
4.6
3.4
3.3
3.5
I
I
12.1
11.6
12.5
I
I
6.2
I
6.7
I
I
I
I
I
I
I
I
I
I
I
I
10.0
9.7
10.5
First Tr Real Assets;I
First Trust Alt Opps;A
First Trust Alt Opps;A
First Trust Hdg Strat;A
First Trust Hdg Str;I
9.31
26.15
26.46
10.20
10.20
N/A
N/A
N/A
N/A
N/A
N/A
N/A
N/A
N/A
N/A
–0.7
2.3
2.4
3.4
3.6
–0.4
8.8
9.6
I
I
I
I
8.2
I
I
I
I
7.9
I
I
I
I
I
I
I
4.0
6.9
7.5
I
I
First Trust Private Cr;A
First Trust Private Cr;I
Flat Rock Core Income
Flat Rock Enhanced Inc
Flat Rock Opportunity
10.35
10.33
20.52
21.41
19.21
N/A
N/A
N/A
N/A
N/A
N/A
N/A
N/A
N/A
N/A
3.1
3.3
2.6
3.0
5.6
I
14.6
12.5
I
18.7
I
I
8.1
I
13.0
I
I
I
I
13.3
I
I
I
I
I
I
8.1
8.6
I
14.3
Forum RE Income;Founders
Forum RE Income;I
Franklin BSP Pvt Cr:A
Franklin BSP Pvt Cr:Adv
FS Credit Income;A
9.36
9.36
10.30
10.31
12.20
N/A
N/A
N/A
N/A
N/A
N/A
N/A
N/A
N/A
N/A
3.1
3.2
3.1
3.3
5.9
12.2
I
10.8
11.5
13.9
I
I
I
I
4.0
I
I
I
I
6.5
I
I
I
I
I
9.3
I
6.4
6.8
7.3
FS Credit Income;I
FS Credit Income;T
FS Credit Income;U
FS Credit Income;U-2
GL Beyond Income
12.24
12.22
12.18
12.28
0.40
N/A
N/A
N/A
N/A
N/A
N/A
N/A
N/A
N/A
N/A
6.0
5.8
5.8
6.0
N/A
14.2
13.5
13.3
13.7
N/A
4.2
3.7
3.4
3.9
N/A
6.8
6.2
I
I
N/A
I
I
I
I
N/A
7.5
7.1
6.8
7.1
N/A
QTR
NAV RETURNS THROUGH 12/29
1 YR
3 YRS
5 YRS
(Annualized)
10 YRS
12
MONTH
YIELD
FUND NAME (SYMBOL)
Data provided by
NAV
MARKET
($/SHR)
PRICE
12/29/23 12/29/23
PREM/
DISC
12/29/23
QTR
NAV RETURNS THROUGH 12/29
1 YR
3 YRS
5 YRS
(Annualized)
10 YRS
12MONTH
YIELD
GS Real Est Div Inc:A
GS Real Est Div Inc:C
GS Real Est Div Inc:I
GS Real Est Div Inc:L
GS Real Est Div Inc:P
9.16
9.16
9.65
9.17
9.66
N/A
N/A
N/A
N/A
N/A
N/A
N/A
N/A
N/A
N/A
4.0
3.8
4.1
4.0
4.1
–0.5
–1.3
–0.3
–0.8
–0.3
4.8
4.1
5.1
4.5
I
4.4
3.7
4.7
4.2
I
6.1
I
I
I
I
6.6
5.8
6.5
6.3
6.5
GS Real Est Div Inc:W
InvDYCrOpp:A
InvDYCrOpp:R6
InvDYCrOpp:Y
Invesco Sr Loan A
9.33
11.19
11.19
11.19
5.86
N/A
N/A
N/A
N/A
N/A
N/A
N/A
N/A
N/A
N/A
3.9
1.9
2.0
2.0
1.9
–0.5
10.4
10.8
10.7
11.5
4.8
I
I
I
5.3
4.4
I
I
I
4.9
I
I
I
I
4.1
6.4
10.1
10.4
10.3
9.6
Invesco Sr Loan C
Invesco Sr Loan IB
Invesco Sr Loan IC
Invesco Sr Loan Y
Jackson Credit Opps:I
5.87
5.86
5.86
5.86
10.17
N/A
N/A
N/A
N/A
N/A
N/A
N/A
N/A
N/A
N/A
1.7
1.9
1.9
1.9
I
10.7
12.0
11.8
11.8
I
4.5
5.6
5.4
5.5
I
4.1
5.1
5.0
5.1
I
3.3
4.3
4.1
4.3
I
8.8
9.8
9.7
9.8
I
Lind Cap Pt Mun Cred Inc
Lord Abbett Cred Opps Fd
Lord Abbett Cred Opps Fd
Lord Abbett Crd Op:U
Lord Abbett FR Hi Inc:A
8.73
8.88
8.88
8.88
10.21
N/A
N/A
N/A
N/A
N/A
N/A
N/A
N/A
N/A
N/A
5.3
3.1
3.3
3.1
3.3
6.2
10.3
11.2
10.3
I
I
4.1
4.8
4.1
I
I
I
I
I
I
I
I
I
I
I
6.1
8.8
9.5
8.8
I
Lord Abbett FR Hi Inc:I
Lord Abbett Spec Sit I:A
Lord Abbett Spec Sit I:I
Monachil Credit Income:I
NexPointRlEstStrat;A
10.21
9.24
9.24
10.03
17.38
N/A
N/A
N/A
N/A
N/A
N/A
N/A
N/A
N/A
N/A
3.5
4.1
4.3
1.8
–2.9
I
15.5
16.3
10.7
–5.0
I
I
I
I
10.9
I
I
I
I
5.9
I
I
I
I
I
I
9.5
10.2
10.1
8.2
NexPointRlEstStrat;C
NexPointRlEstStrat;Z
Nomura Alt Inc;I
Nuveen En HY Muni Bd:A1
Nuveen En HY Muni Bd:A2
17.60
17.61
10.04
7.29
7.30
N/A
N/A
N/A
N/A
N/A
N/A
N/A
N/A
N/A
N/A
–3.0
–2.8
3.0
8.6
8.6
–5.7
–4.8
I
8.4
8.7
10.0
10.5
I
I
I
5.2
6.3
I
I
I
I
I
I
I
I
7.3
8.4
I
5.4
5.6
Nuveen En HY Muni Bd:I
Oaktree Dvsfd Income;D
Opprtnstc Crdt Intrvl;I
Palmer Square Opp Inc
PGIM Credit Income;A
7.29
8.89
11.75
17.53
25.19
N/A
N/A
N/A
N/A
N/A
N/A
N/A
N/A
N/A
N/A
8.8
3.9
1.9
4.1
I
9.3
11.9
14.5
18.9
I
I
I
I
6.6
I
I
I
I
6.7
I
I
I
I
I
I
6.1
7.8
11.6
9.5
I
PGIM Credit Income;C
PGIM Credit Income;Z
PIMCO CA FMI;A-1
PIMCO CA FMI;Inst
PIMCO Flexible Cr I;A-1
25.19
25.19
10.26
10.26
6.83
N/A
N/A
N/A
N/A
N/A
N/A
N/A
N/A
N/A
N/A
I
I
8.0
8.1
5.7
I
I
I
8.2
7.8
I
I
I
I
I
I
I
I
I
I
I
I
I
I
I
I
I
I
3.5
10.7
PIMCO Flexible Cr I;A-2
PIMCO Flexible Cr I;A-3
PIMCO Flexible Cr I;A-4
PIMCO Flexible Cr I;Inst
PIMCO Flexible EM I;Inst
6.83
6.83
6.83
6.83
8.33
N/A
N/A
N/A
N/A
N/A
N/A
N/A
N/A
N/A
N/A
5.7
5.6
5.6
5.8
8.3
7.8
7.5
7.5
8.3
9.2
0.9
0.6
0.6
1.4
I
I
I
3.4
4.2
I
I
I
I
I
I
10.7
10.5
10.5
11.2
6.9
PIMCO Flex Mun Inc;A-3
PIMCO Flex Mun Inc:A1
PIMCO Flex Mun Inc;A2
PIMCO Flex Mun Inc;Inst
PIMCO Flexible REI;Inst
10.22
10.22
10.22
10.22
10.39
N/A
N/A
N/A
N/A
N/A
N/A
N/A
N/A
N/A
N/A
9.4
9.5
9.5
9.6
3.8
8.4
8.7
8.7
9.2
10.4
–1.1
–0.8
–0.8
–0.3
I
I
I
I
I
I
I
I
I
I
I
3.5
3.8
3.8
4.3
6.6
PionrILSInterval
PREDEX;I
PREDEX;T
PREDEX;W
Primark Priv Eq Inv:I
8.51
24.83
24.94
24.94
12.15
N/A
N/A
N/A
N/A
N/A
N/A
N/A
N/A
N/A
N/A
4.3
–4.6
–4.7
–4.7
6.2
18.7
–13.8
–14.0
–14.0
10.7
5.9
4.0
3.9
3.9
4.1
5.5
3.2
3.1
3.1
I
I
I
I
I
I
12.8
4.8
4.8
4.8
0.0
Principal Real Asst A
Principal Real Asst Ins
Principal Real Asst Y
Redwood Rl Est;I
SEI Alternative Income:F
25.23
25.32
25.57
25.03
10.05
N/A
N/A
N/A
N/A
N/A
N/A
N/A
N/A
N/A
N/A
3.2
3.3
3.3
1.7
I
1.9
2.2
2.5
I
I
5.0
5.4
5.6
I
I
I
I
I
I
I
I
I
I
I
I
1.9
2.1
2.1
I
I
SEI Alternative Income:Y
SS Priv Venture & Gr:D
SS Priv Venture & Gr:I
SS Priv Venture & Gr:S
SS Priv Venture & Gr;T
10.05
N/A
N/A
N/A
N/A
N/A
N/A
N/A
N/A
N/A
N/A
N/A
N/A
N/A
N/A
I
N/A
N/A
N/A
N/A
I
N/A
N/A
N/A
N/A
I
I
I
I
I
I
I
I
I
I
I
I
I
I
I
I
N/A
N/A
N/A
N/A
Sweater Cashmere
The Private Shares;A
The Private Shares;I
The Private Shares;L
Thirdline Real EstateI
21.18
37.91
38.52
37.32
10.08
N/A
N/A
N/A
N/A
N/A
N/A
N/A
N/A
N/A
N/A
0.3
–4.0
–3.9
–4.0
1.7
5.6
–8.4
–8.2
–8.6
8.1
I
4.5
4.7
4.2
I
I
8.2
8.5
8.0
I
I
I
I
I
I
0.2
0.0
0.0
0.0
6.3
USQ Core Real Estate:I
USQ Core Real Estate:IS
Variant Altrntv Inc:Inst
Variant Impact;Instl
Versus Cap MMgr RE Inc:I
24.11
24.18
28.31
27.96
25.79
N/A
N/A
N/A
N/A
N/A
N/A
N/A
N/A
N/A
N/A
–4.9
–4.8
2.7
4.2
N/A
–12.7
–12.6
9.5
13.0
N/A
3.3
3.4
10.1
I
N/A
2.8
2.9
9.6
I
N/A
I
I
I
I
N/A
4.4
4.4
10.3
6.6
N/A
Versus Capital Real Asst
Voya Credit Income:A
Voya Credit Income:C
Voya Credit Income:I
Voya Credit Income:W
27.76
9.76
9.73
9.71
9.77
N/A
N/A
N/A
N/A
N/A
N/A
N/A
N/A
N/A
N/A
2.5
3.9
3.8
4.0
4.1
4.8
12.7
12.1
12.9
13.0
6.0
3.1
2.6
3.3
3.4
5.5
2.1
1.6
2.3
2.3
I
2.3
1.8
2.6
2.6
2.7
8.1
7.6
8.4
8.3
8.71
9.12
N/A
N/A
N/A
N/A
–11.7
1.2
–31.8
7.7
–10.7
5.8
–5.3
I
I
I
1.5
8.8
Wildermuth:I
Yieldstreet Alt Inc
L52
BARRON’S
For personal non-commercial use only. Do not edit or alter. Reproductions not permitted.
To reprint or license content, please contact Barron's reprints department at 800-843-0008 or www.djreprints.com
Market
Insights.
In the
Palm
of Your
Hand.
Download the
Barron’s app
for investment
analysis, real
time stock
picks, and
breaking
business
news.
Download the App.
barrons.com/barronsapp
© 2024 Dow Jones & Co.,Inc. All rights reserved. 6DJ0136
•
Funds Quarterly
January 8, 2024