


Похожие


Текст
CLINICAL AND
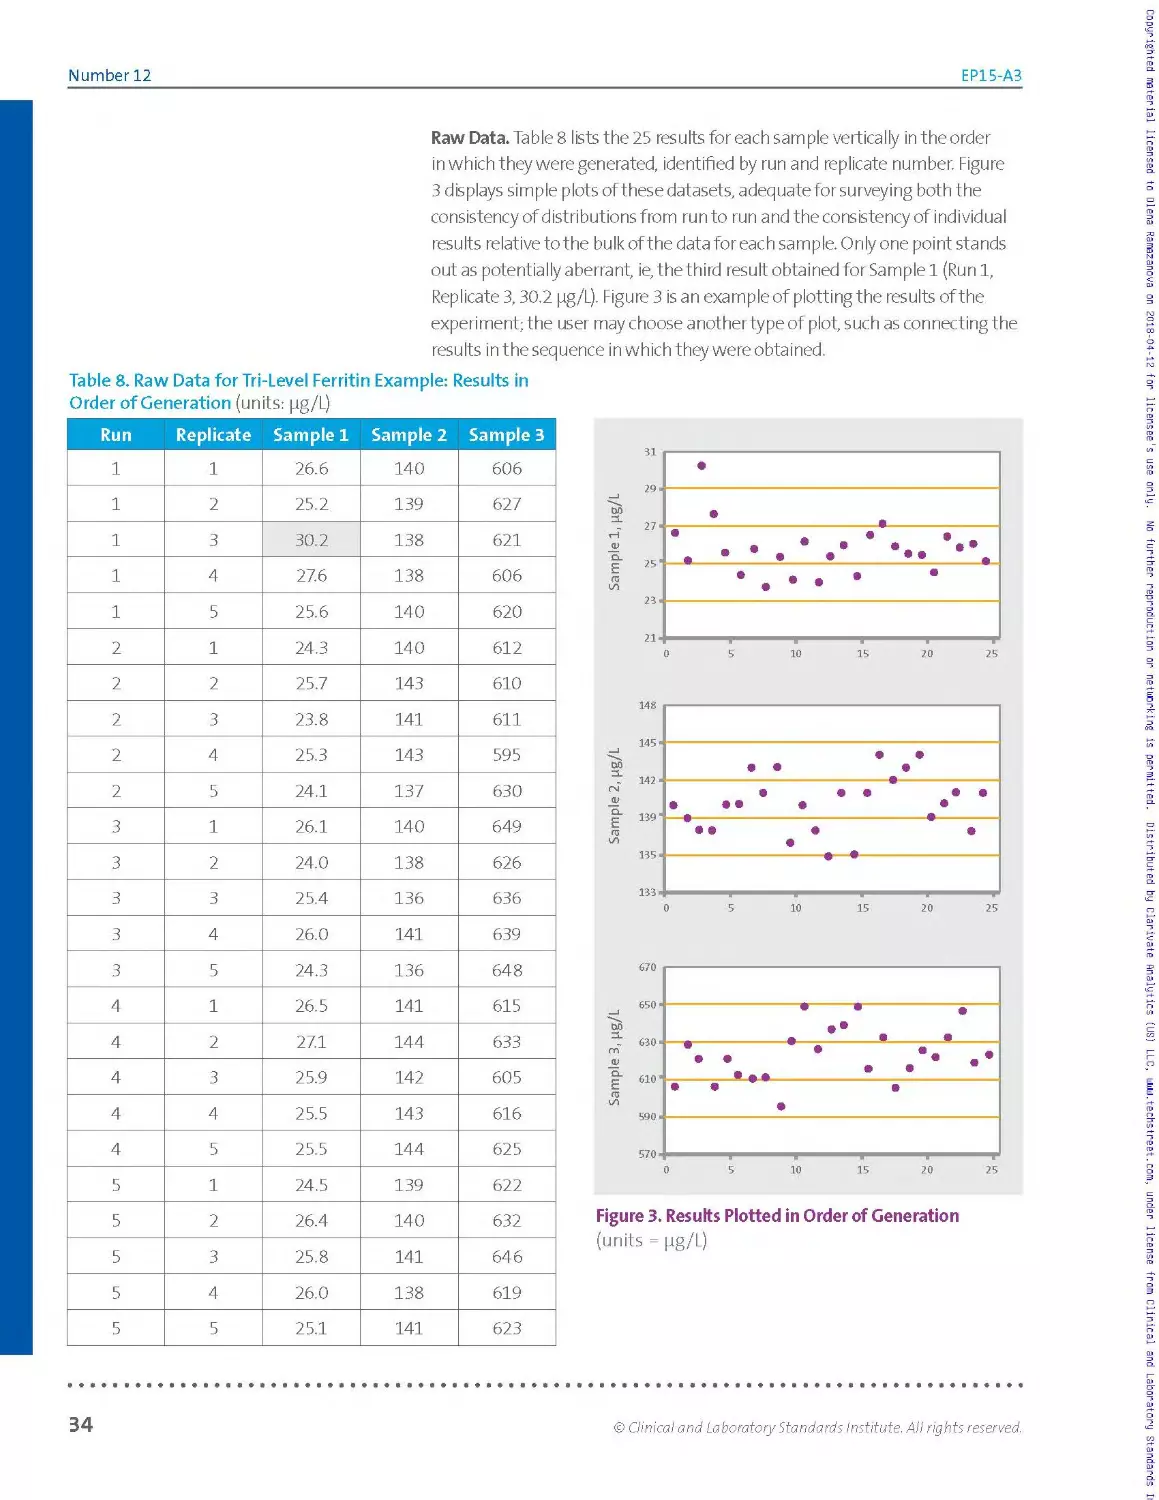
LABORATORY
STANDARDS
Institute*
September 2014
EP15-A3
User Verification of Precision and Estimation
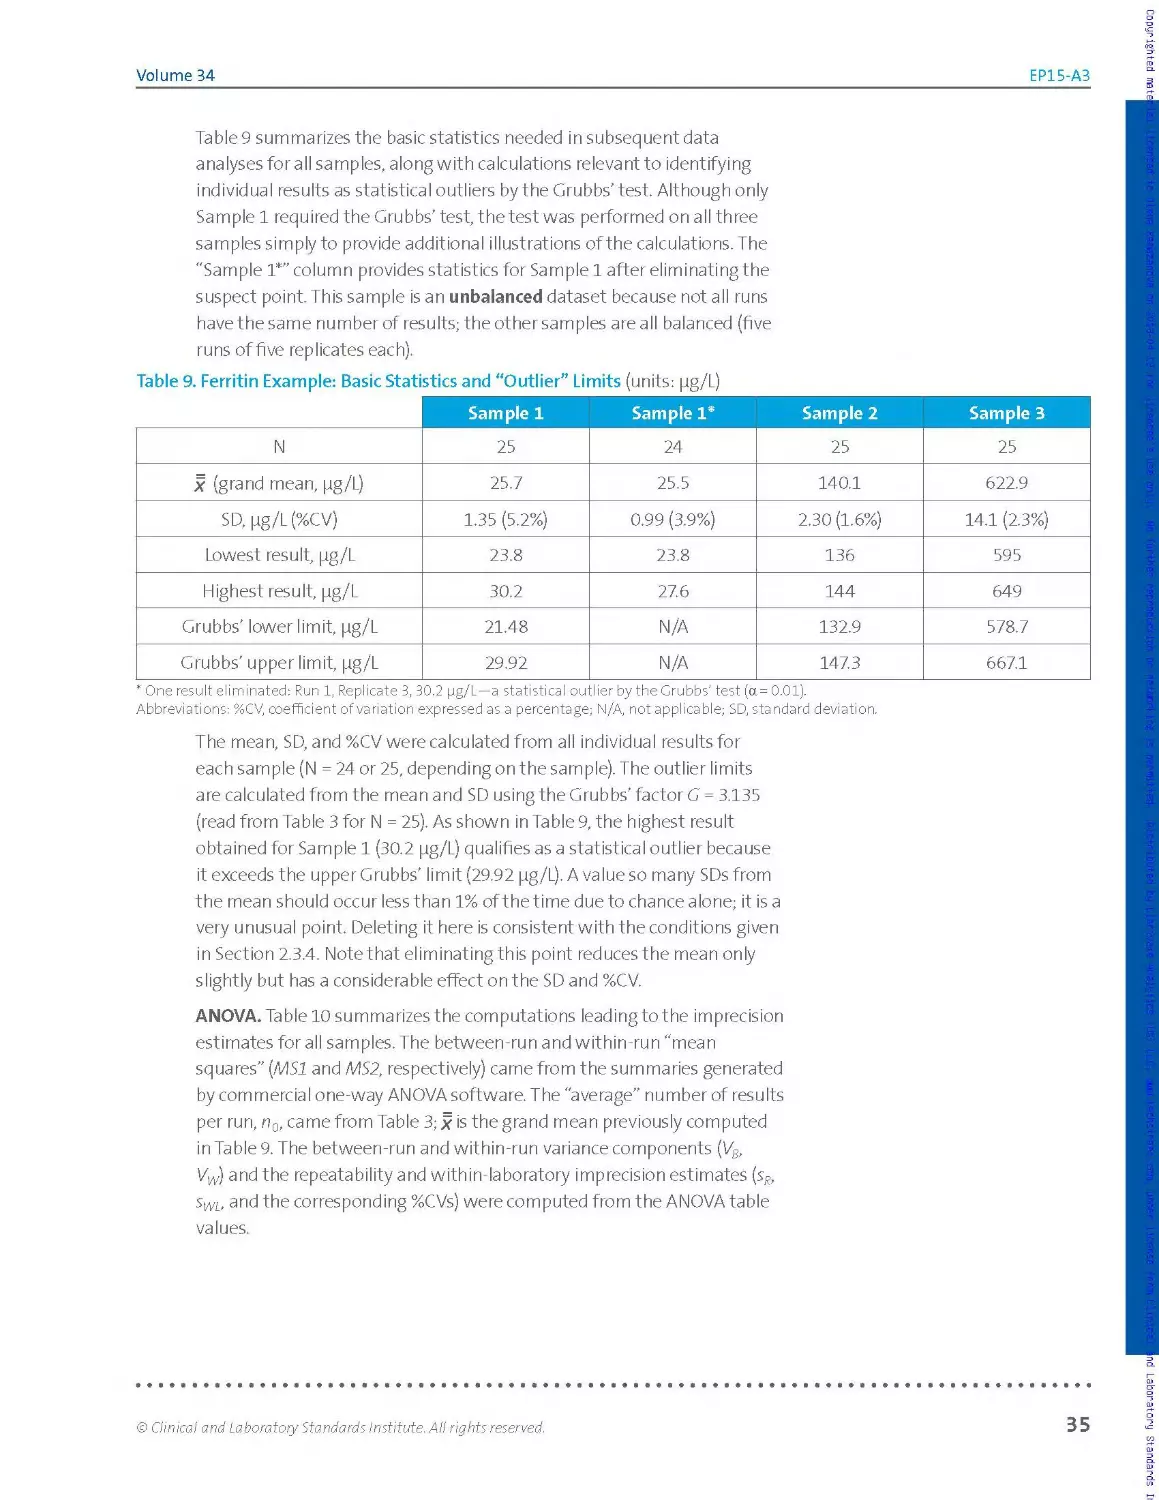
of Bias; Approved Guideline—Third Edition
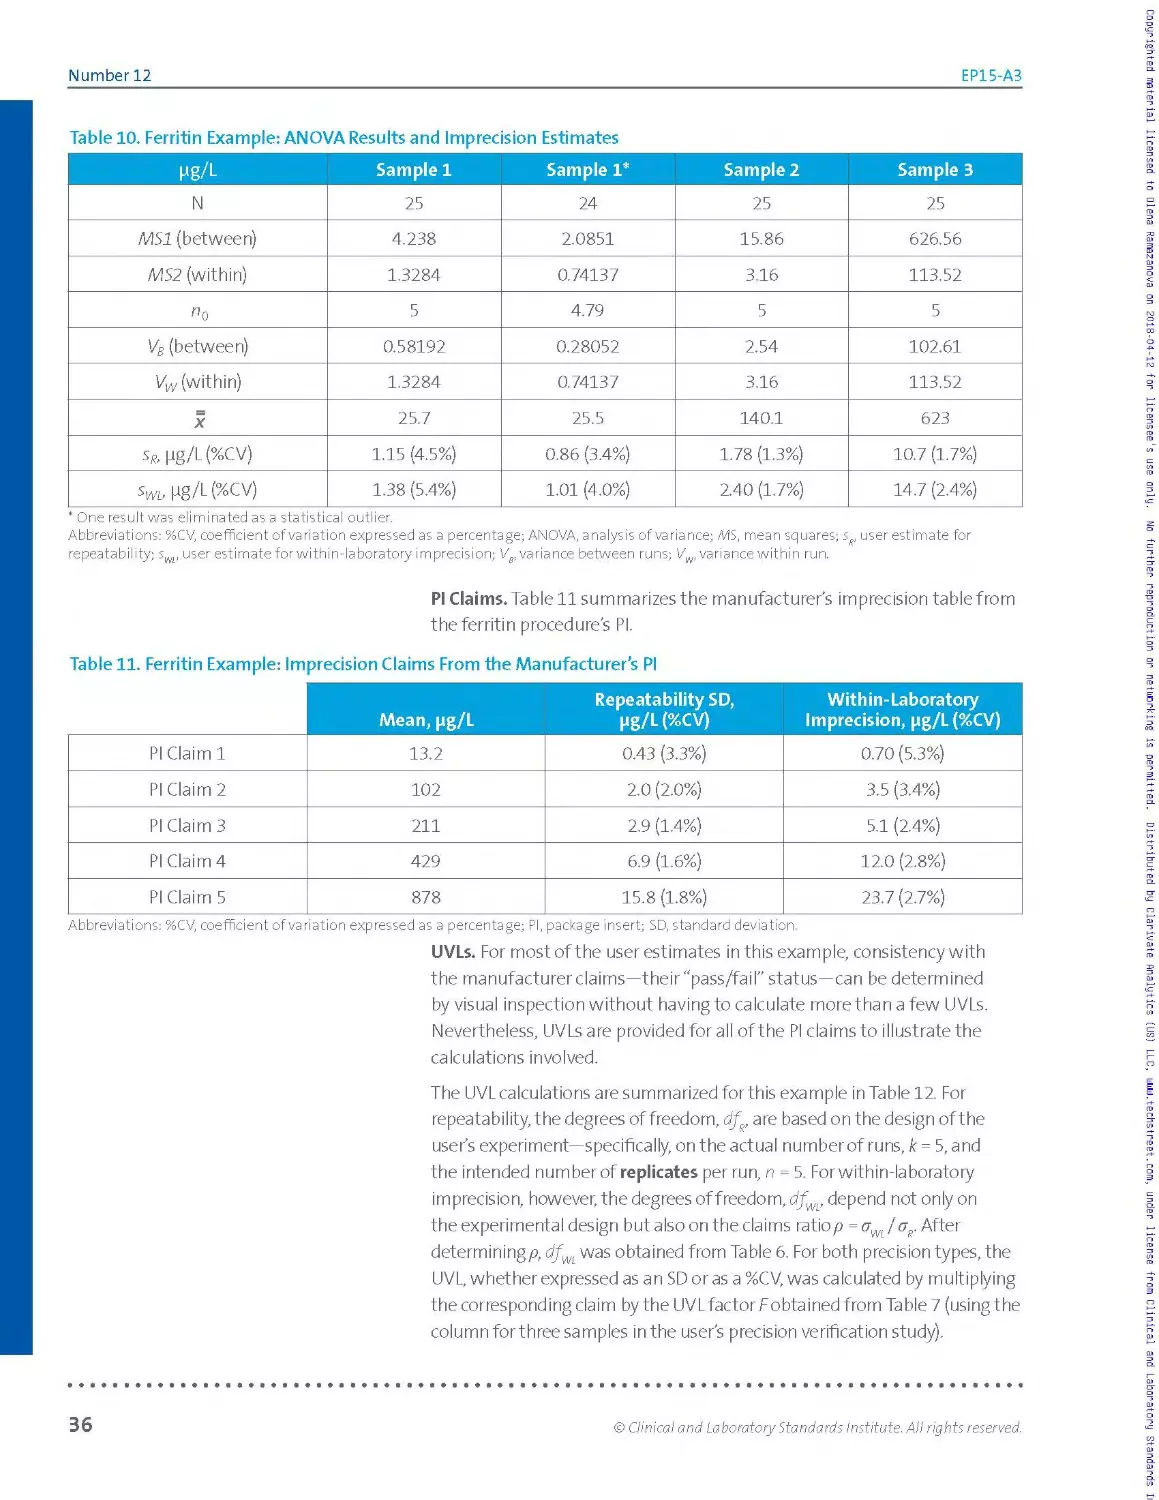
This document describes the estimation of imprecision and of bias
for clinical laboratory quantitative measurement procedures using
a protocol that can be completed within as few as five days.
A guideline for global application developed through the Clinical and Laboratory Standards Institute consensus process.
Copyrighted raterial Licensed to Diena Rarasanova on 2018-04-12 tor Licensee's use only. No further reproduction or networking is permitted - Distributed by Clarivate Analytics (US) LLE, uajui.techstreet.com, under license from Clinical and Laborator
Clinical and Laboratory Standards Institute
Setting the standard for quality in medical laboratory testing around the world.
The Clinical and Laboratory Standards Institute (CLSI) is a not-for-profit membership organization that brings
together the varied perspectives and expertise of the worldwide laboratory community for the advancement of a
common cause: to foster excellence in laboratory medicine by developing and implementing medical laboratory
standards and guidelines that help laboratories fulfill their responsibilities with efficiency, effectiveness, and global
applicability.
Consensus Process
Consensus—the substantial agreement by materially affected, competent, and interested parties—is core to the
development of all CLSI documents. It does not always connote unanimous agreement, but does mean that the
participants in the development of a consensus document have considered and resolved all relevant objections
and accept the resulting agreement.
Commenting on Documents
CLSI documents undergo periodic evaluation and modification to keep pace with advancements in technologies,
procedures, methods, and protocols affecting the laboratory or health care.
CLSI’s consensus process depends on experts who volunteer to serve as contributing authors and/or as participants
in the reviewing and commenting process. At the end of each comment period, the committee that developed
the document is obligated to review all comments, respond in writing to all substantive comments, and revise the
draft document as appropriate.
Comments on published CLSI documents are equally essential, and may be submitted by anyone, at any time, on
any document. All comments are managed according to the consensus process by a committee of experts.
Appeals Process
When it is believed that an objection has not been adequately considered and responded to, the process for
appeals, documented in the CLSI Standards Development Policies and Processes, is followed.
All comments and responses submitted on draft and published documents are retained on file at CLSI and are
available upon request.
Get Involved—Volunteer!
Do you use CLSI documents in your workplace? Do you see room for improvement? Would you like to get
involved in the revision process? Or maybe you see a need to develop a new document for an emerging
technology? CLSI wants to hear from you. We are always looking for volunteers. By donating your time and talents
to improve the standards that affect your own work, you will play an active role in improving public health across
the globe.
For additional information on committee participation or to submit comments, contact CLSI.
Clinical and Laboratory Standards Institute
950 West Valley Road, Suite 2500
Wayne, PA 19087 USA
P: +1.610.688.0100
F: +1.610.688.0700
www.clsi.org
standard@clsi.org__________________________________________________________________________________
ISBN 1-56238-965-3 (Print)
ISBN 1-56238-966-1 (Electronic)
ISSN 1558-6502 (Print)
ISSN 2162-2914 (Electronic)
EP15-A3
Vol. 34 No. 12
Replaces EP15-A2
Vol. 25 No. 17
Volume 34 Number 12
User Verification of Precision and Estimation of Bias; Approved
Guideline—Third Edition
R. Neill Carey, PhD, FACB
A. Paul Durham
Walter W. Hauck, PhD
Anders Kaliner, MD, PhD
Marina V. Kondratovich, PhD
Jonathan Guy Middle, PhD
James F. Pierson-Perry
Merle B. Smith, MBA, MS, MT(ASCP)
Aparna Srinivasan, PhD
Abstract
Clinical and Laboratory Standards Institute document EP15-A3—User Verification of Precision and Estimation of Bias;
Approved Guideline—Third Edition describes the verification of precision claims and estimation of relative bias for
quantitative methods performed within the laboratory. Included are guidelines for duration, experimental designs,
materials, data analysis summarization, and interpretation—techniques adaptable for the widest possible range of
analytes and device complexity. A balance is created in the document between the complexity of design and formulae,
and the simplicity of operation. The protocol is designed to be completed within five working days based on a uniform
experimental design yielding estimates of imprecision and bias.
Clinical and Laboratory Standards Institute (CLSI). User Verification of Precision and Estimation of Bias; Approved
Guideline—Third Edition. CLSI document EP15-A3 (ISBN 1-56238-965-3 [Print]; ISBN 1-56238-966-1 [Electronic]). Clinical
and Laboratory Standards Institute, 950 West Valley Road, Suite 2500, Wayne, Pennsylvania 19087 USA, 2014.
The Clinical and Laboratory Standards Institute consensus process, which is the mechanism for moving a document through two
or more levels of review by the health care community, is an ongoing process. Users should expect revised editions of any given
document. Because rapid changes in technology may affect the procedures, methods, and protocols in a standard or guideline,
users should replace outdated editions with the current editions of CLSI documents. Current editions are listed in the CLSI catalog
and posted on our website at www.clsi.org.
If you or your organization is not a member a nd would like to become one, and to request a copy of the catalog, contact us at:
P: 610.688.0100 F: 610.688.0700 E: customerservice@clsi.org W: www.dsi.org.
CLINICAL AND
/// LABORATORY
Jf STANDARDS
\ INSTITUTE*
Copyrighted material licensed to Olena Ramazanova on 2018-04-12 for licensee's use only. No further reproduction or networking is permitted. Distributed by Clarivate Analytics (US) LLC, www.techstreet.com, under license from Clinical and Laboratory Standards
Number 12
EP15-A3
Copyright ©2014 Clinical and Laboratory Standards Institute. Except as stated below,
any reproduction of content from a CLSI copyrighted standard, guideline, companion
product, or other material requires express written consent from CLSI. All rights
reserved. Interested parties may send permission requests to permissions@clsi.org.
CLSI hereby grants permission to each individual member or purchaser to make a
single reproduction of this publication for use in its laboratory procedure manual ata
single site.To request permission to use this publication in any other manner, e-mail
permissions@clsi.org.
Suggested Citation
CLSI. User Verification of Precision and Estimation of Bias; Approved Guideline— Third
Edition. CLSI document EP15-A3. Wayne, PA: Clinical and Laboratory Standards
Institute; 2014.
Proposed Guideline
December 1998
Approved Guideline
December 2001
Approved Guideline—Second Edition
June 2005
Second Printing
April 2006
Approved Guideline—Third Edition
September 2014
ISBN 1-56238-965-3 (Print)
ISBN 1-56238-966-1 (Electronic)
ISSN 1558-6502 (Print)
ISSN 2162-2914 (Electronic)
Volume 34
EP15-A3
Committee Membership
Consensus Committee on Evaluation Protocols
James F. Pierson-Perry
Chairholder
Siemens Healthcare Diagnostics, Inc.
Newark, Delaware, USA
Mitchell G. Scott, PhD
Vice-Chairholder
Barnes-Jewish Hospital
St. Louis, Missouri, USA
Karl DeVore
Bio-Rad Laboratories
Irvine, California, USA
Robert J. McEnroe, PhD
Roche Diagnostics, Inc.
Indianapolis, Indiana, USA
James H. Nichols, PhD, DABCC, FAC В
Vanderbilt University Medical Center
Nashville, Tennessee, USA
Gene Pennello, PhD
FDA Center for Devices
and Radiological Health
Silver Spring, Maryland, USA
Megan E. Sawchuk, MT(ASCP)
Centers for Disease Control and
Prevention
Atlanta, Georgia, USA
Document Development Committee on Verification of Performance for Precision and Trueness
R. Neill Carey, PhD, FACB
Chairholder
Peninsula Regional Medical Center
Salisbury, Maryland, USA
Marina V. Kondratovich, PhD
FDA Center for Devices
and Radiological Health
Silver Spring, Maryland, USA
WalterW. Hauck, PhD
USP
Rockville, Maryland, USA
Anders Kaliner, MD, PhD
Karolinska Hospital
Stockholm, Sweden
Merle B. Smith, MBA, MS, MT(ASCP)
Siemens Healthcare Diagnostics, Inc.
Newark, Delaware, USA
Aparna Srinivasan, PhD
Abaxis
Union City, California, USA
Staff
Clinical and Laboratory Standards
Institute
Wayne, Pennsylvania, USA
Luann Ochs, MS
Senior Vice President - Operations
Staff Liaison
Ron S. Quicho, MS
Project Manager
Megan L.Tertel, MA
Editorial Manager
Joanne P. Christopher, MA
Editor
Patrice E. Polgar
Editor
Number 12
EP15-A3
Acknowledgment
CLSI and the Consensus Committee on Evaluation Protocols gratefully acknowledge the following individuals for
their help in preparing this document:
A. Paul Durham
APD Consulting
Culver City, California, USA
Jonathan Guy Middle, PhD
Birmingham, United Kingdom
James F. Pierson-Perry
Siemens Healthcare Diagnostics, Inc.
Newark, Delaware, USA
Volume 34
EP15-A3
Contents
Abstract...........................................................................................i
Committee Membership................................................................................... iii
Foreword................................................................................................vii
Chapter 1: Introduction.................................................................................. 1
1.1 Scope......................................................................................... 2
1.2 Background.................................................................................... 3
1.3 Standard Precautions.......................................................................... 3
1.4 Terminology................................................................................... 4
1.5 Overview of the Protocol...................................................................... 8
1.6 Performance Standards........................................................................ 10
Chapter 2: Precision Verification Study..................................................................11
2.1 Familiarization Period....................................................................... 12
2.2 Overview and Limitations of the Precision Verification Study................................. 14
2.3 Experimental Procedure Design................................................................ 17
Chapter 3: Estimation of Bias by Testing Materials With Known Concentrations.............................41
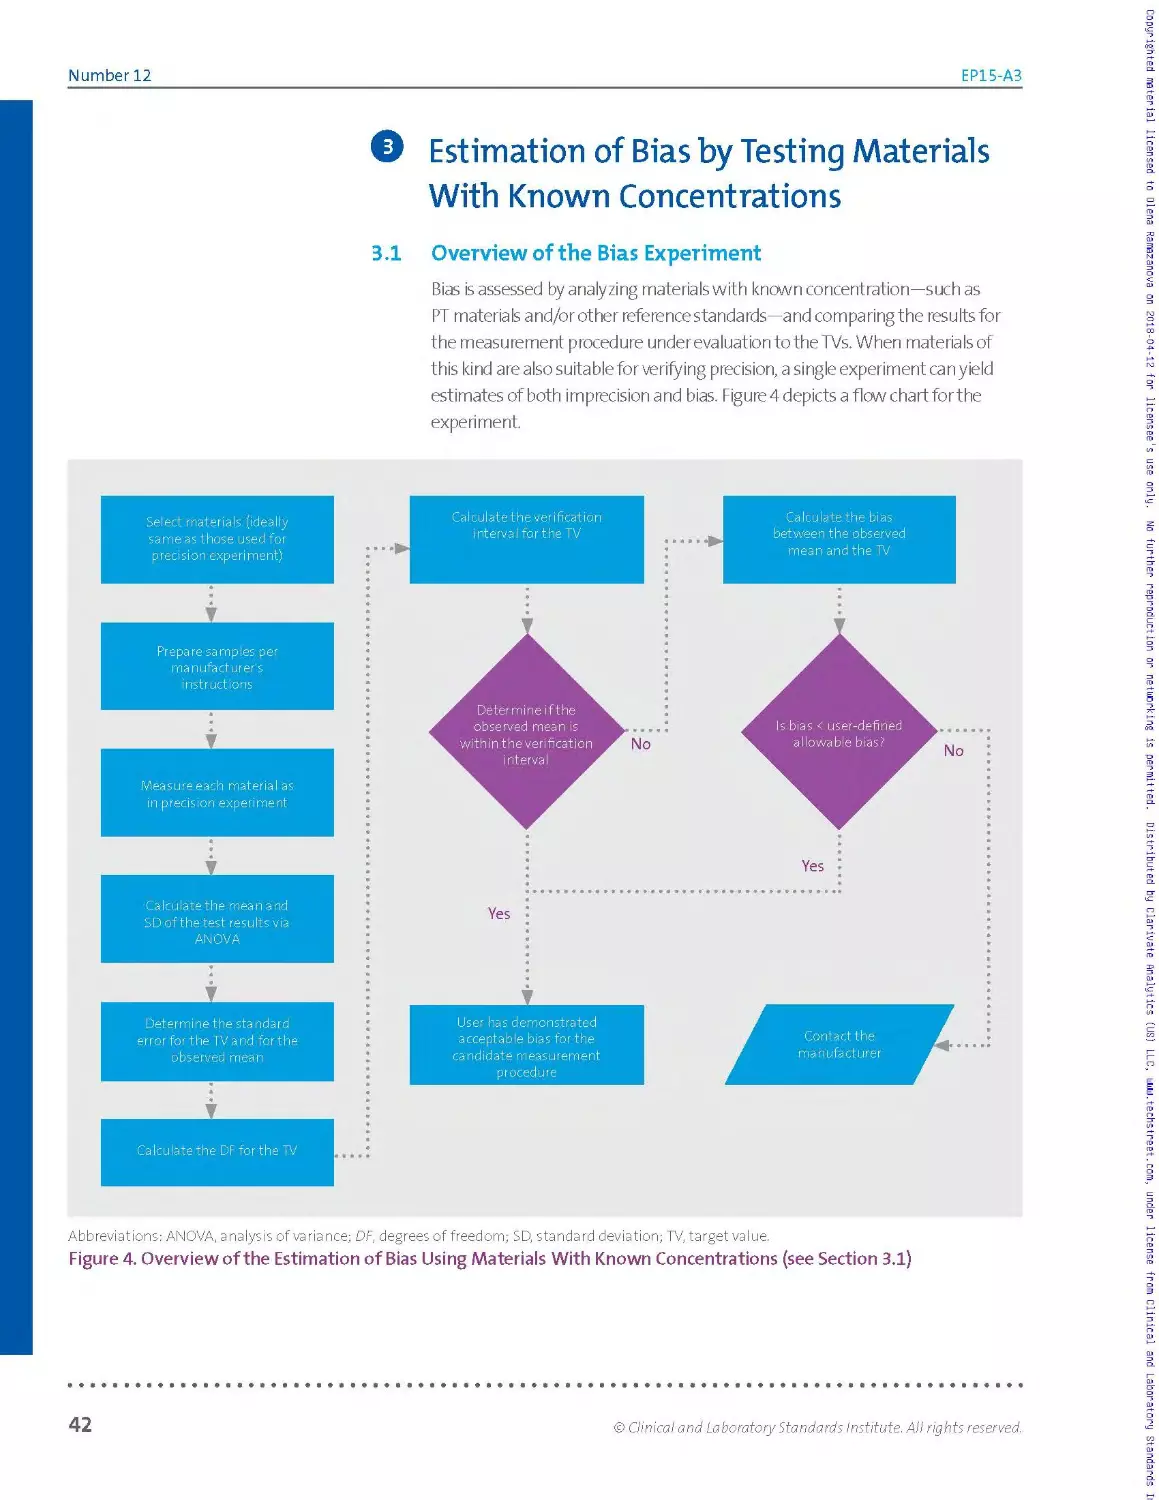
3.1 Overview of the Bias Experiment...............................................................42
3.2 Selecting Reference Materials.................................................................44
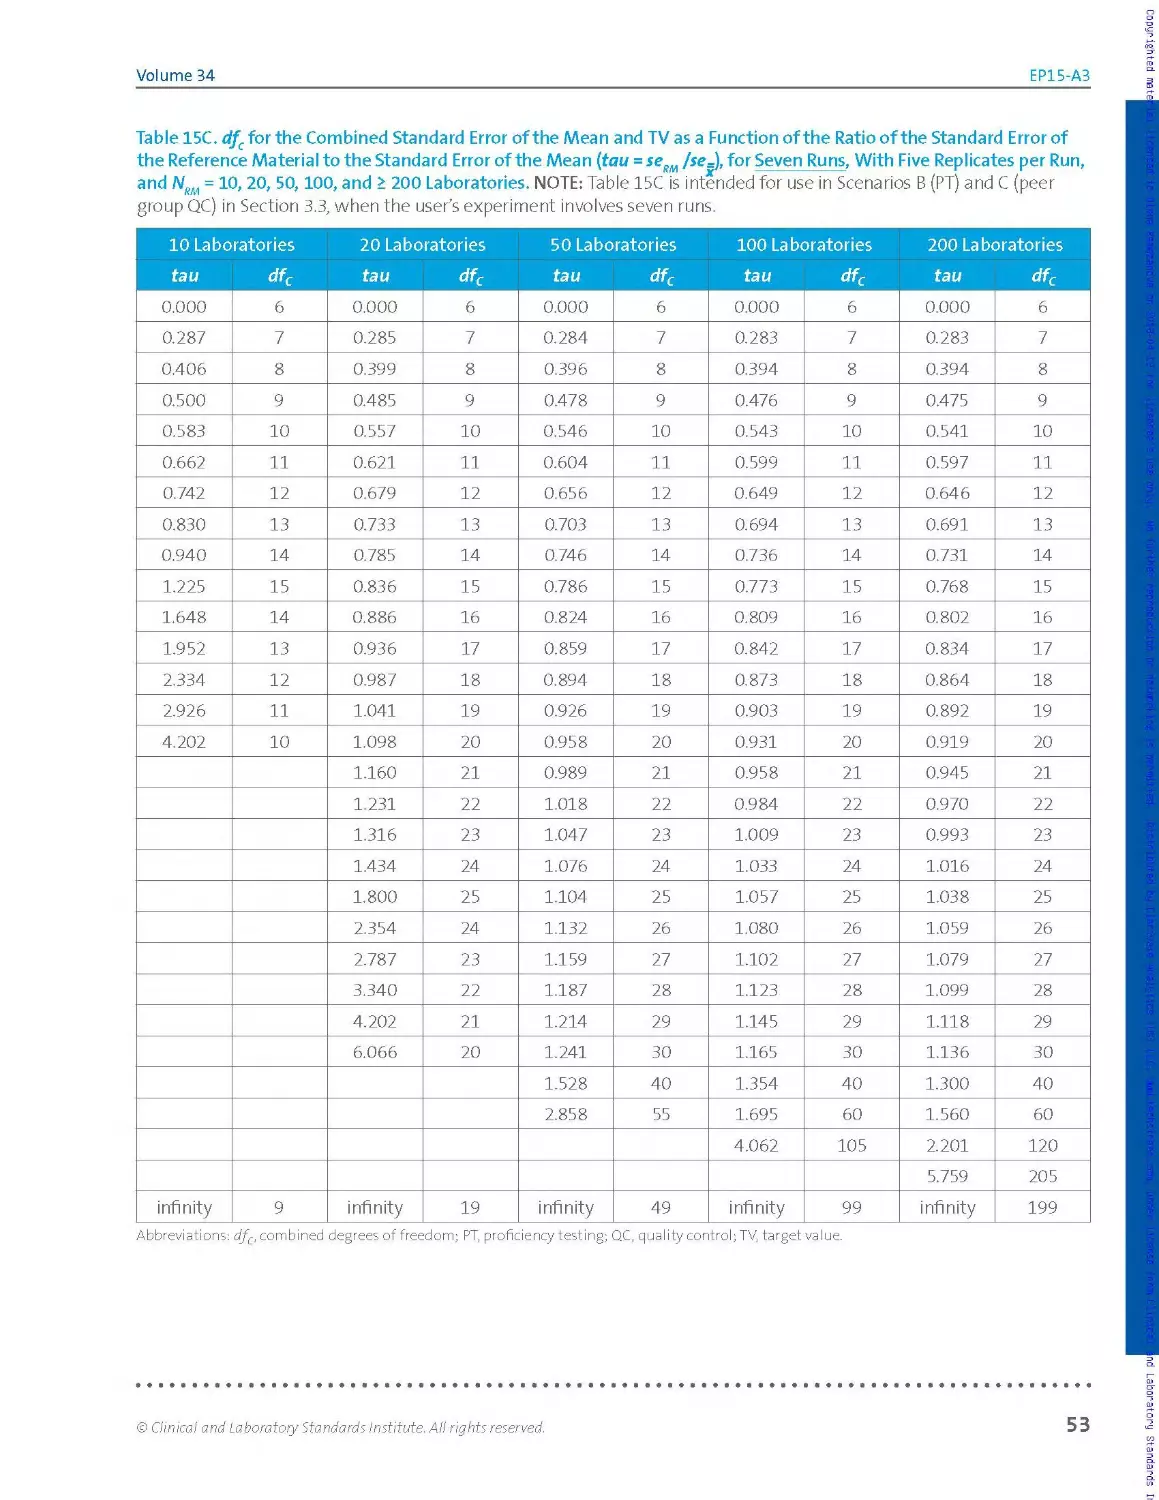
3.3 Target Values and Their Standard Errors...................................................... 47
3.4 Mean Values and Their Standard Errors.........................................................48
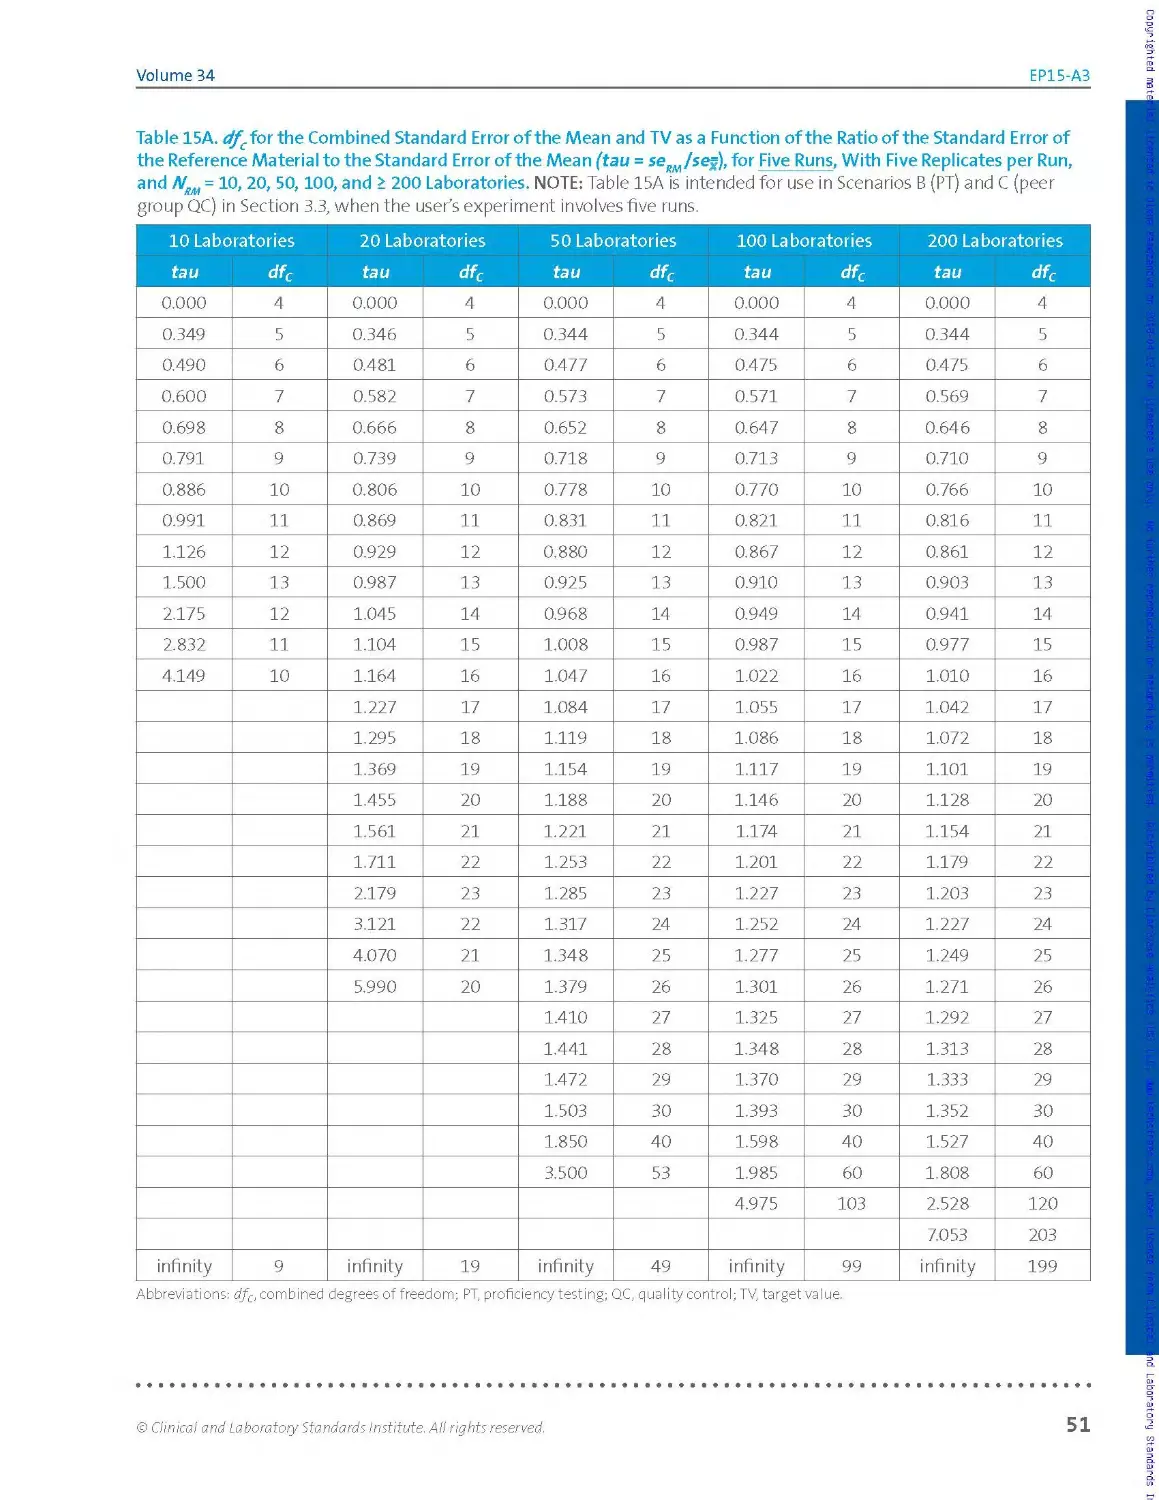
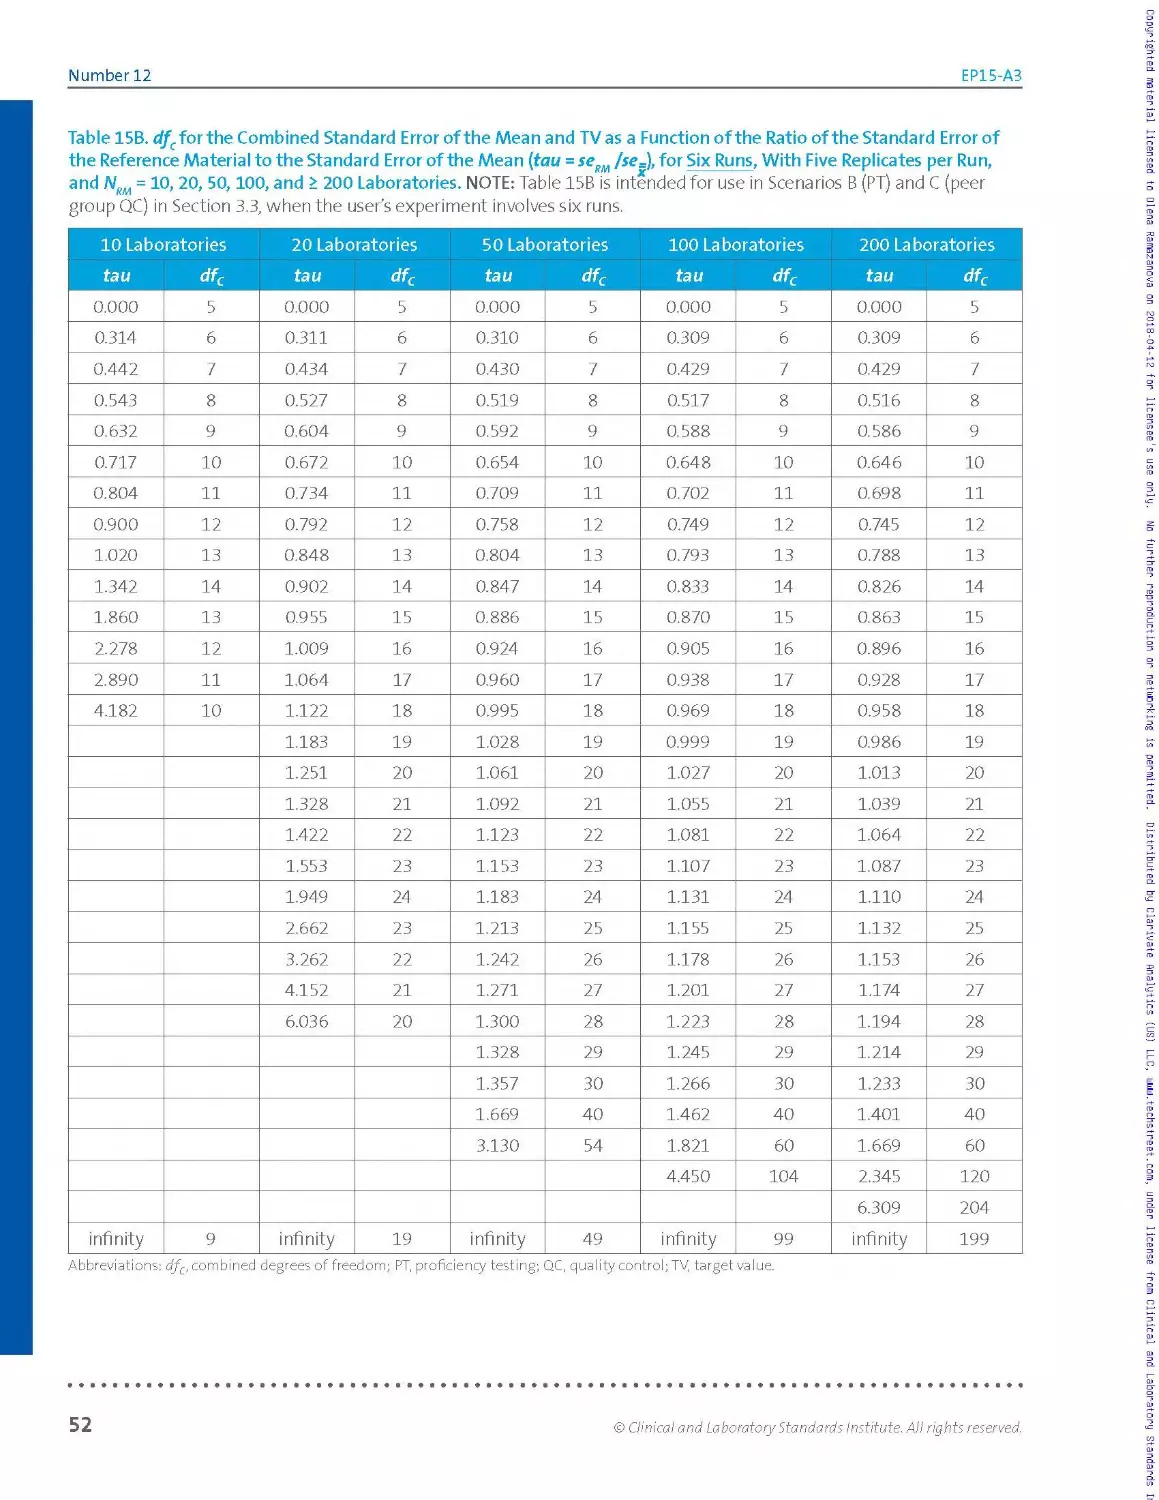
3.5 The Verification Interval.................................................................... 49
3.6 Interpretation............................................................................... 54
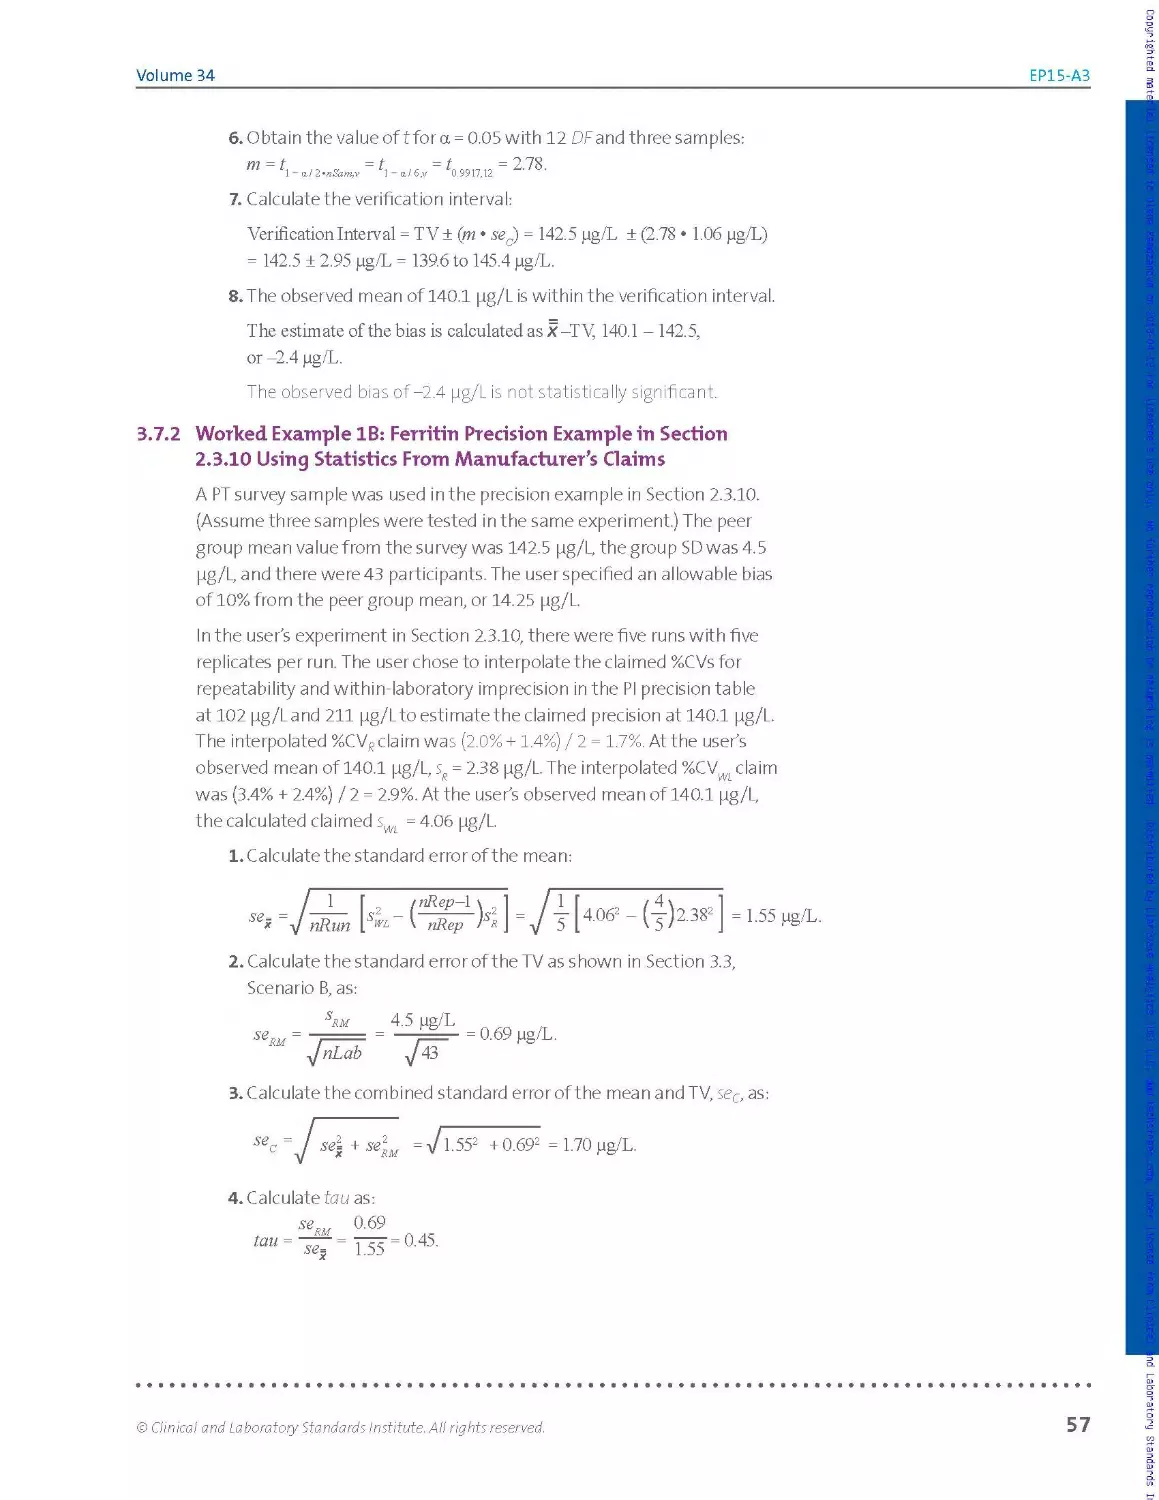
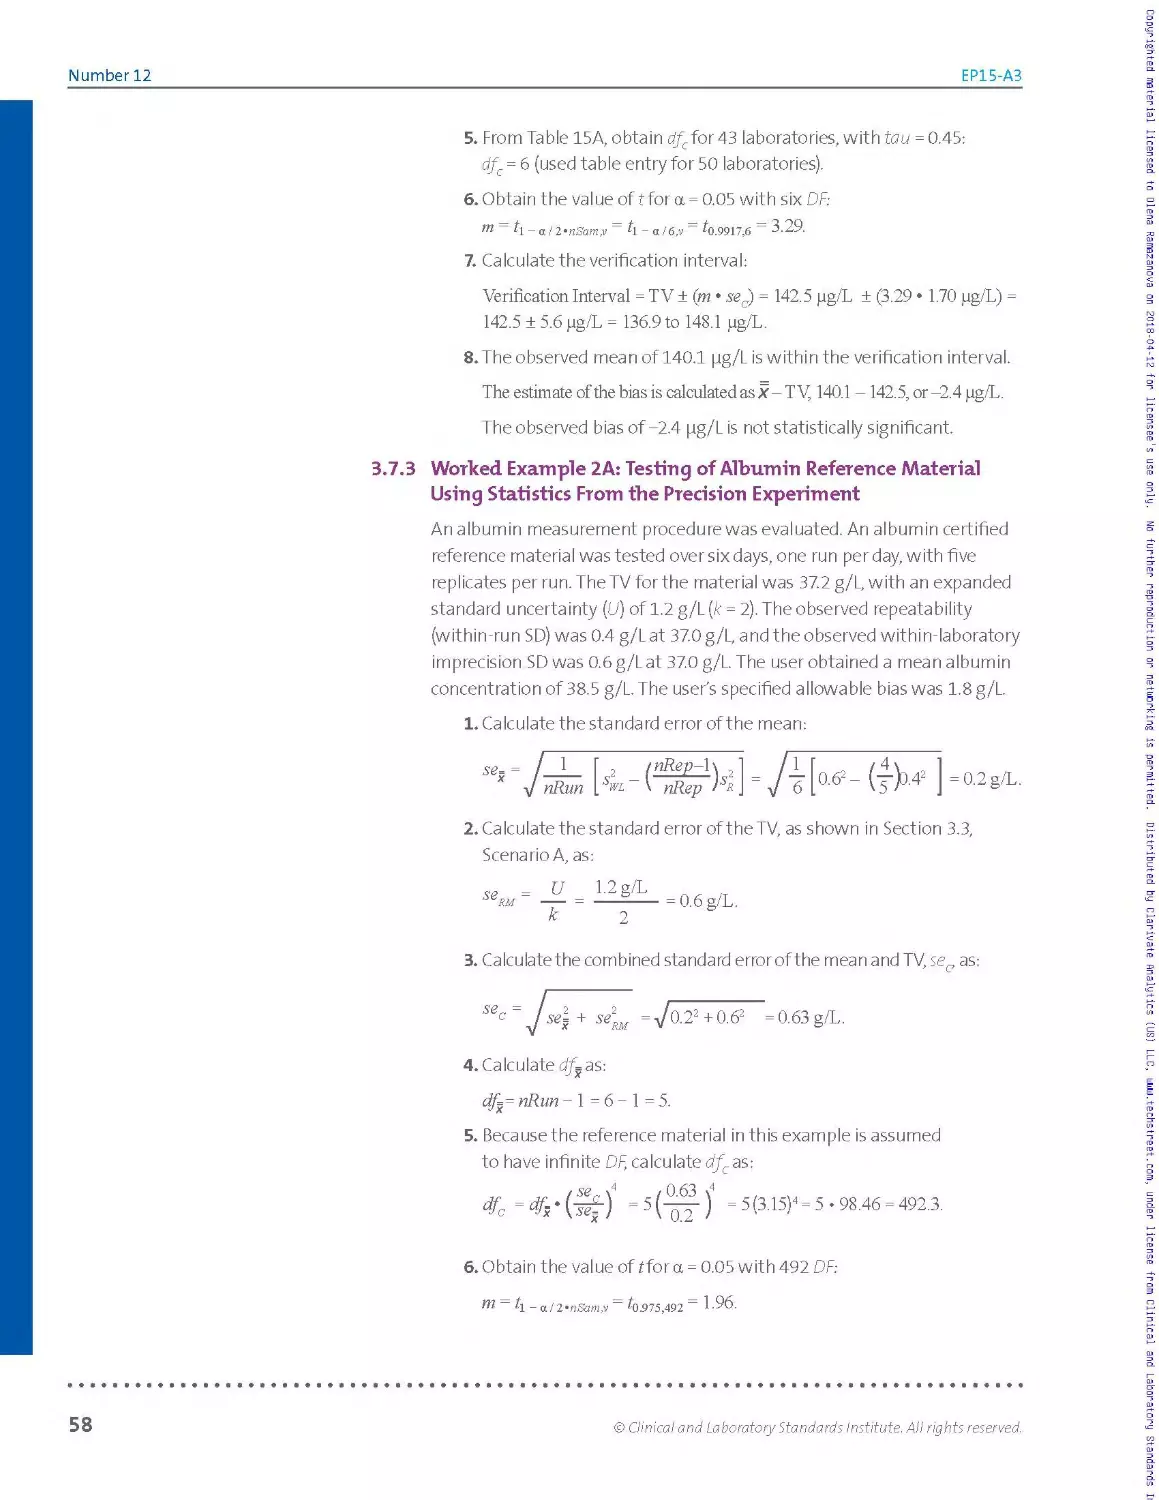
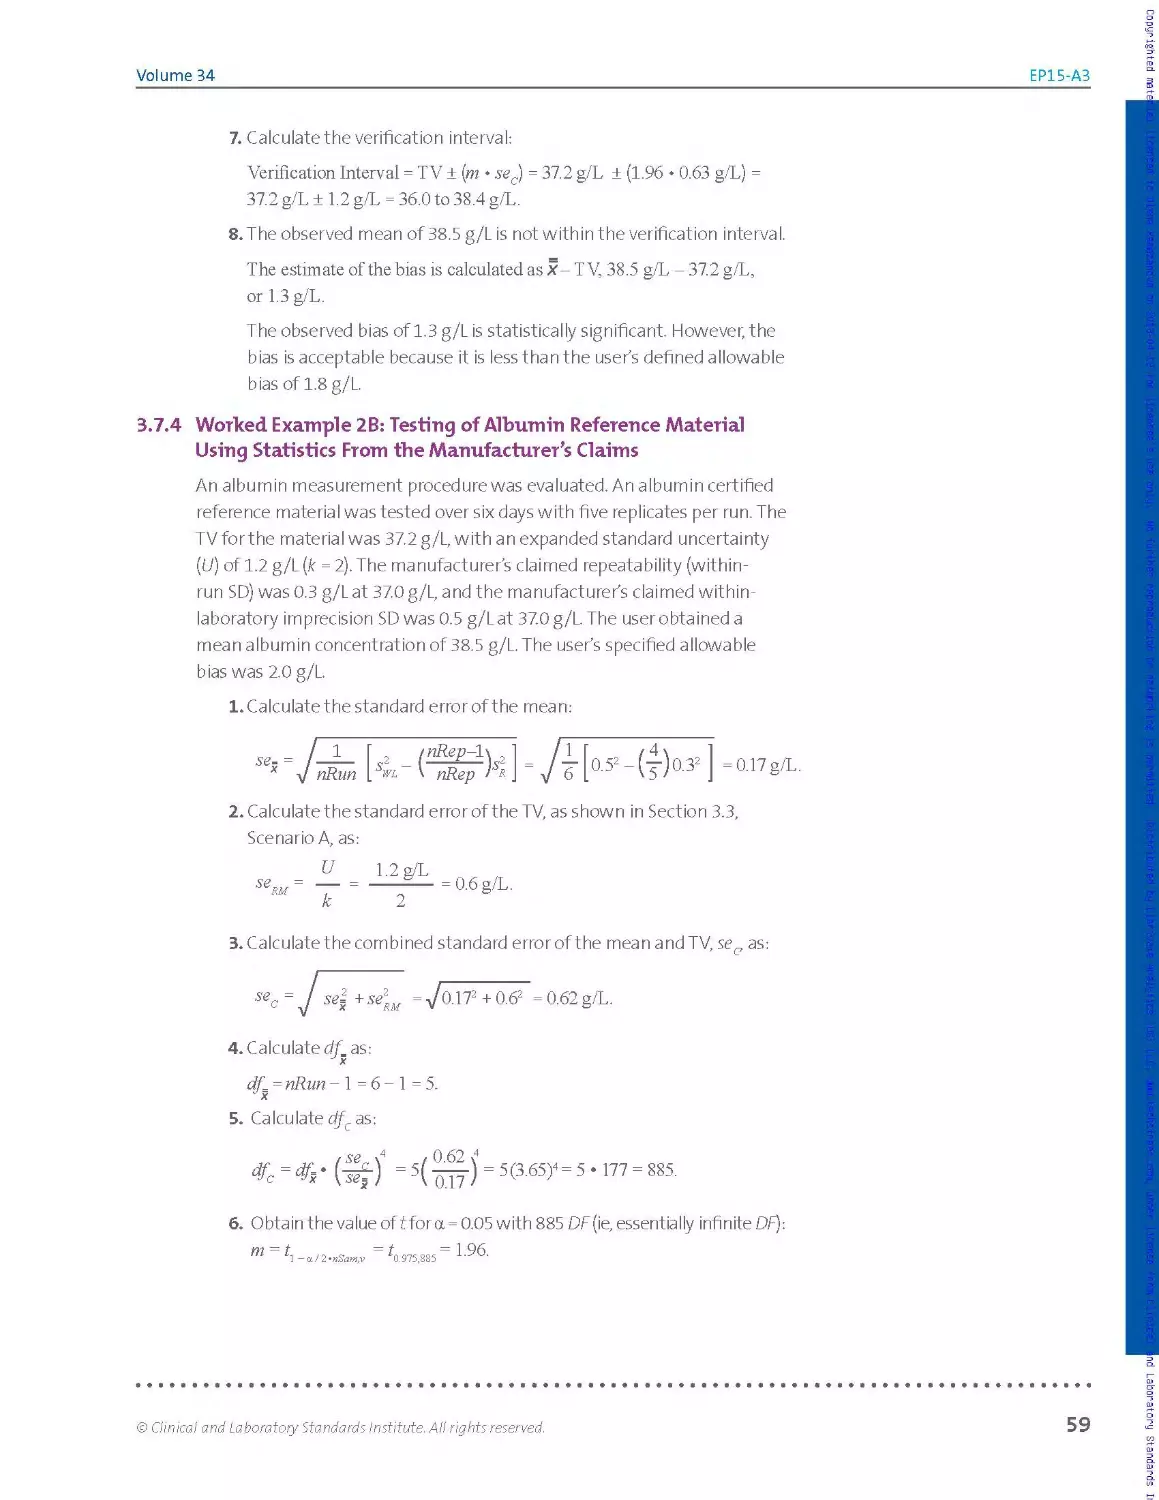
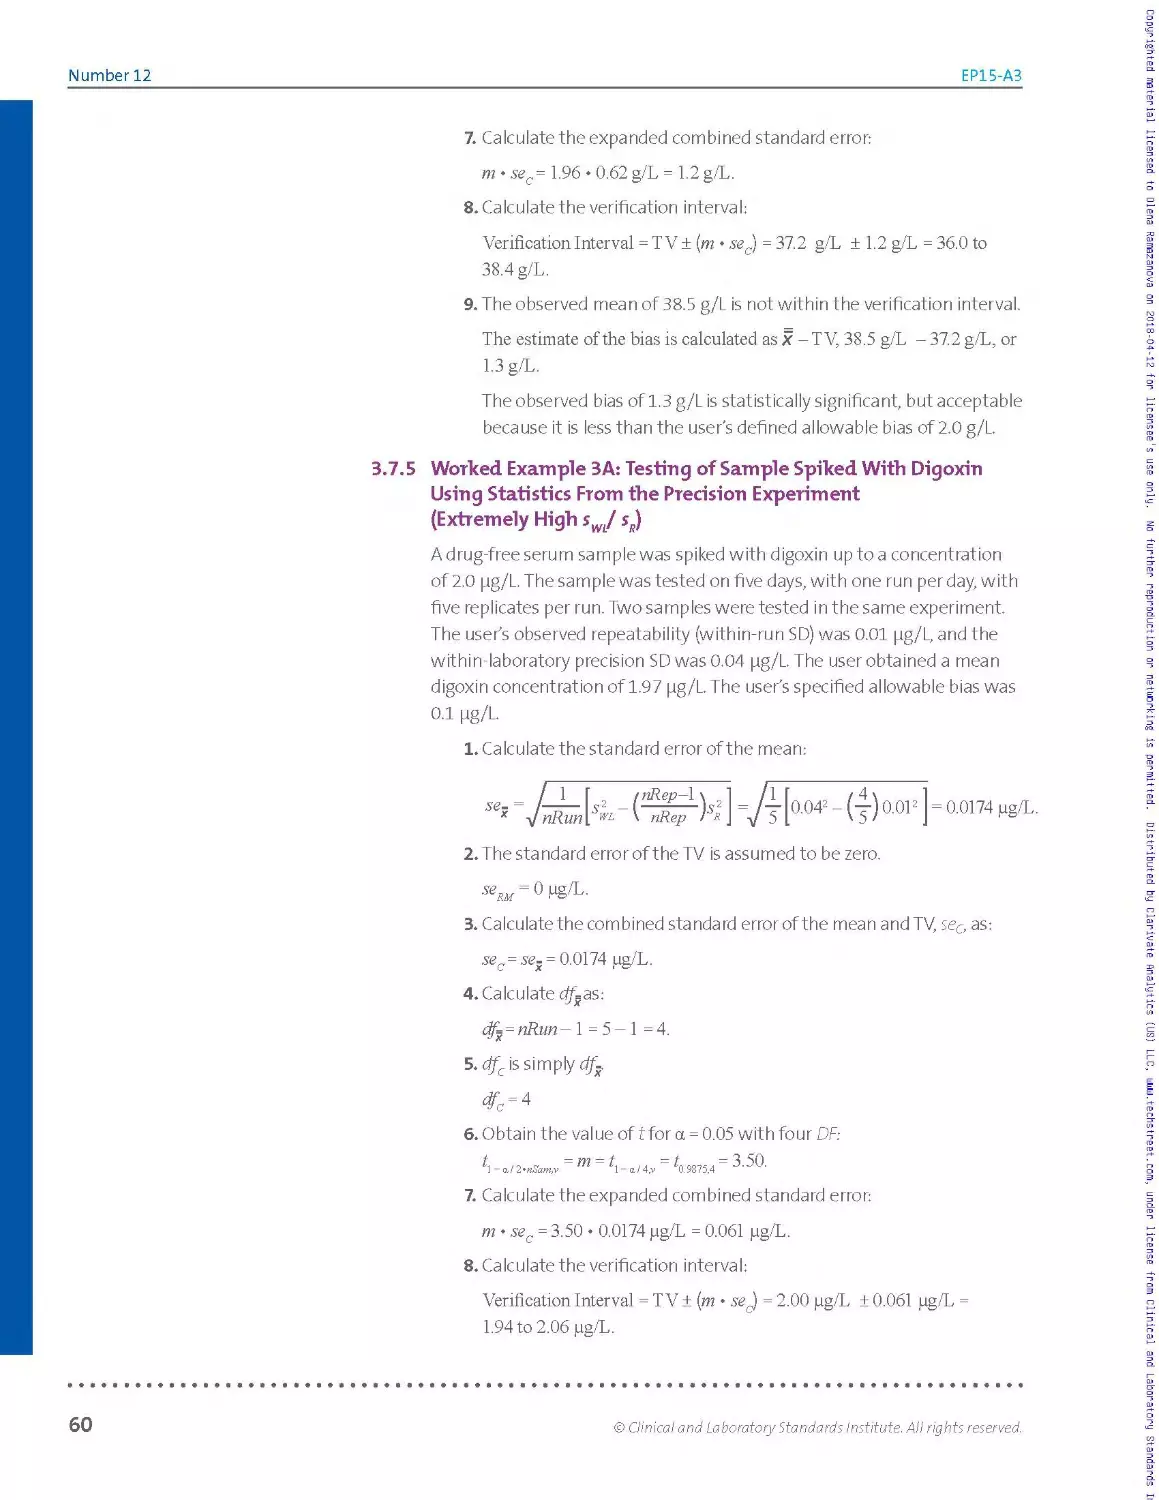
3.7 Worked Examples.............................................................................. 55
Chapter 4: Conclusion....................................................................................63
Number 12 EP15-A3
Contents (Continued)
Chapter 5: Supplemental Information............................................................65
References.............................................................................. 66
Appendix A. Precision Verification Study: Experimental Designs and Missing Values....... 68
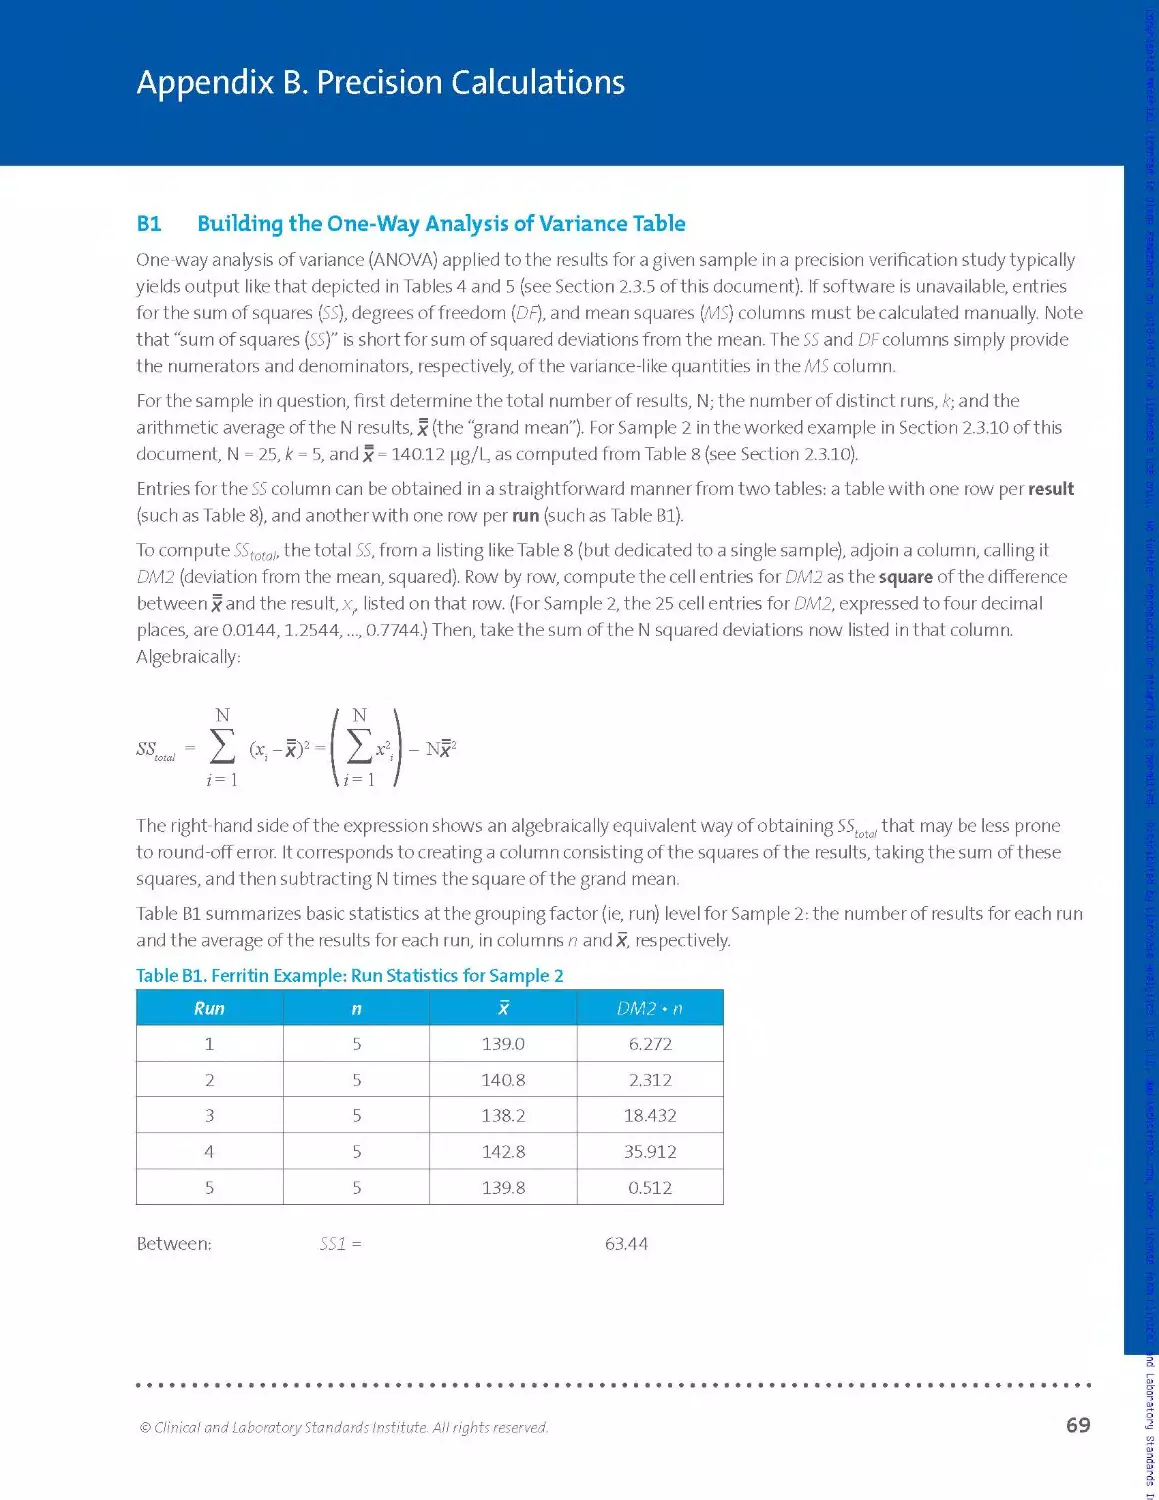
Appendix B. Precision Calculations...................................................... 69
Appendix C. Materials With Known Concentrations......................................... 76
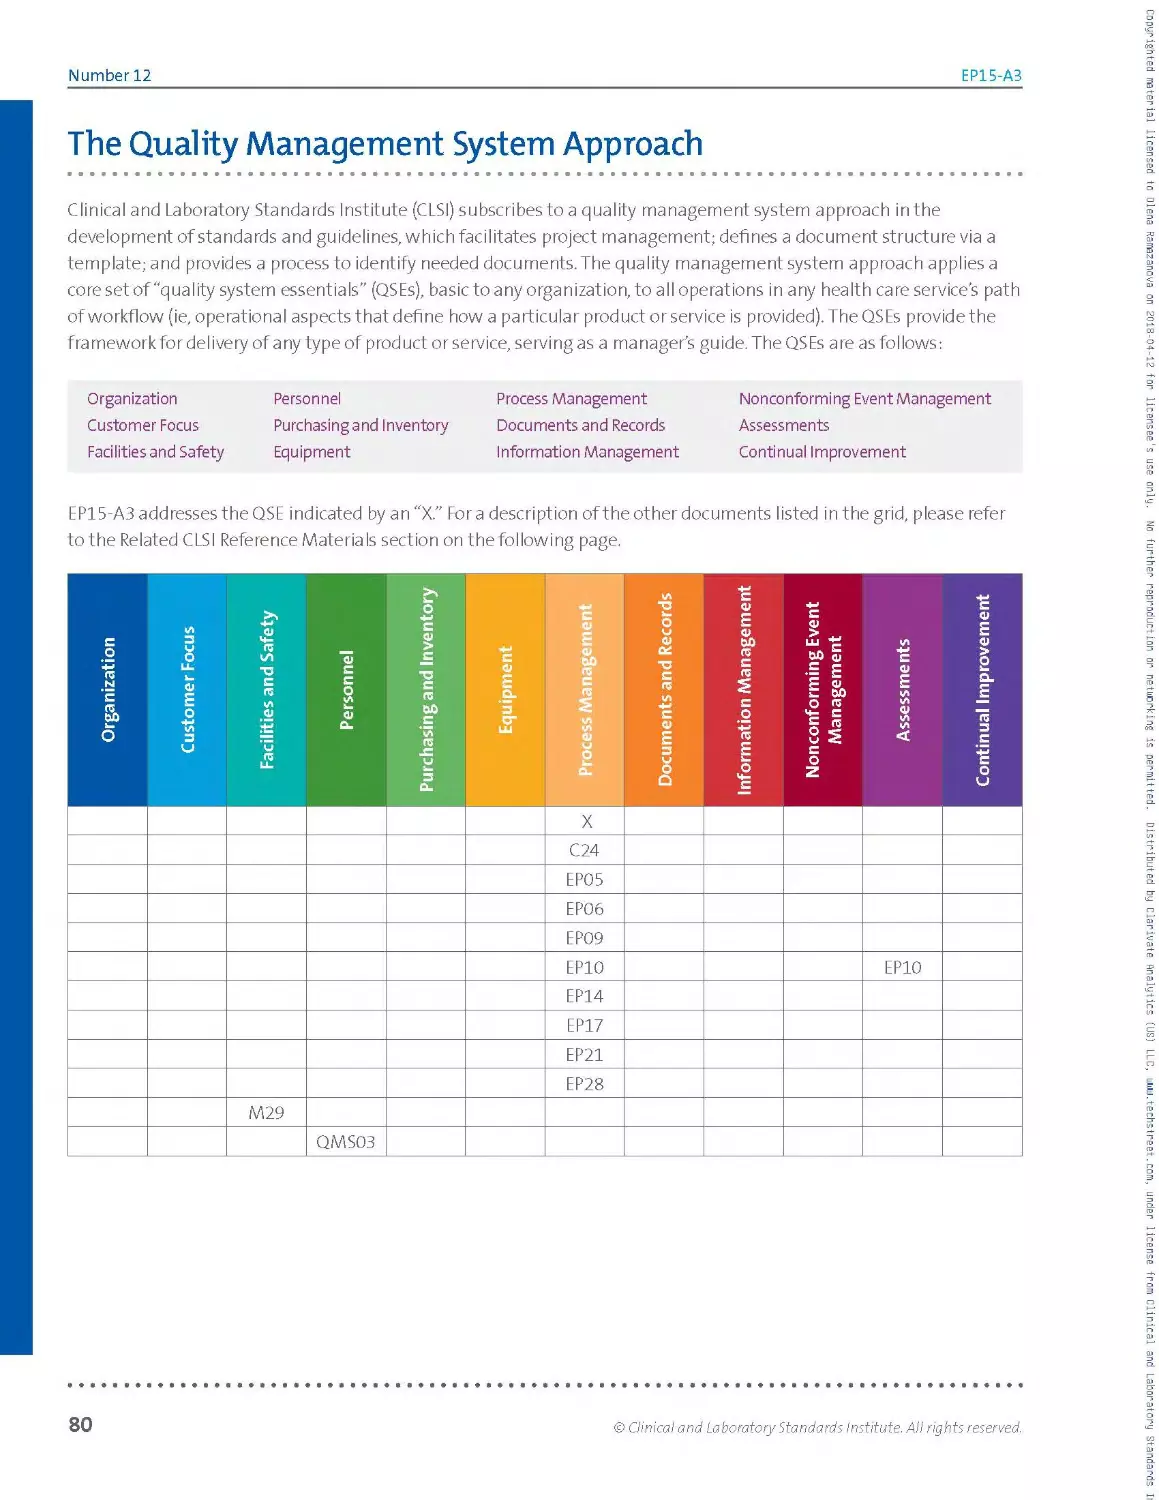
The Quality Management System Approach.................................................. 80
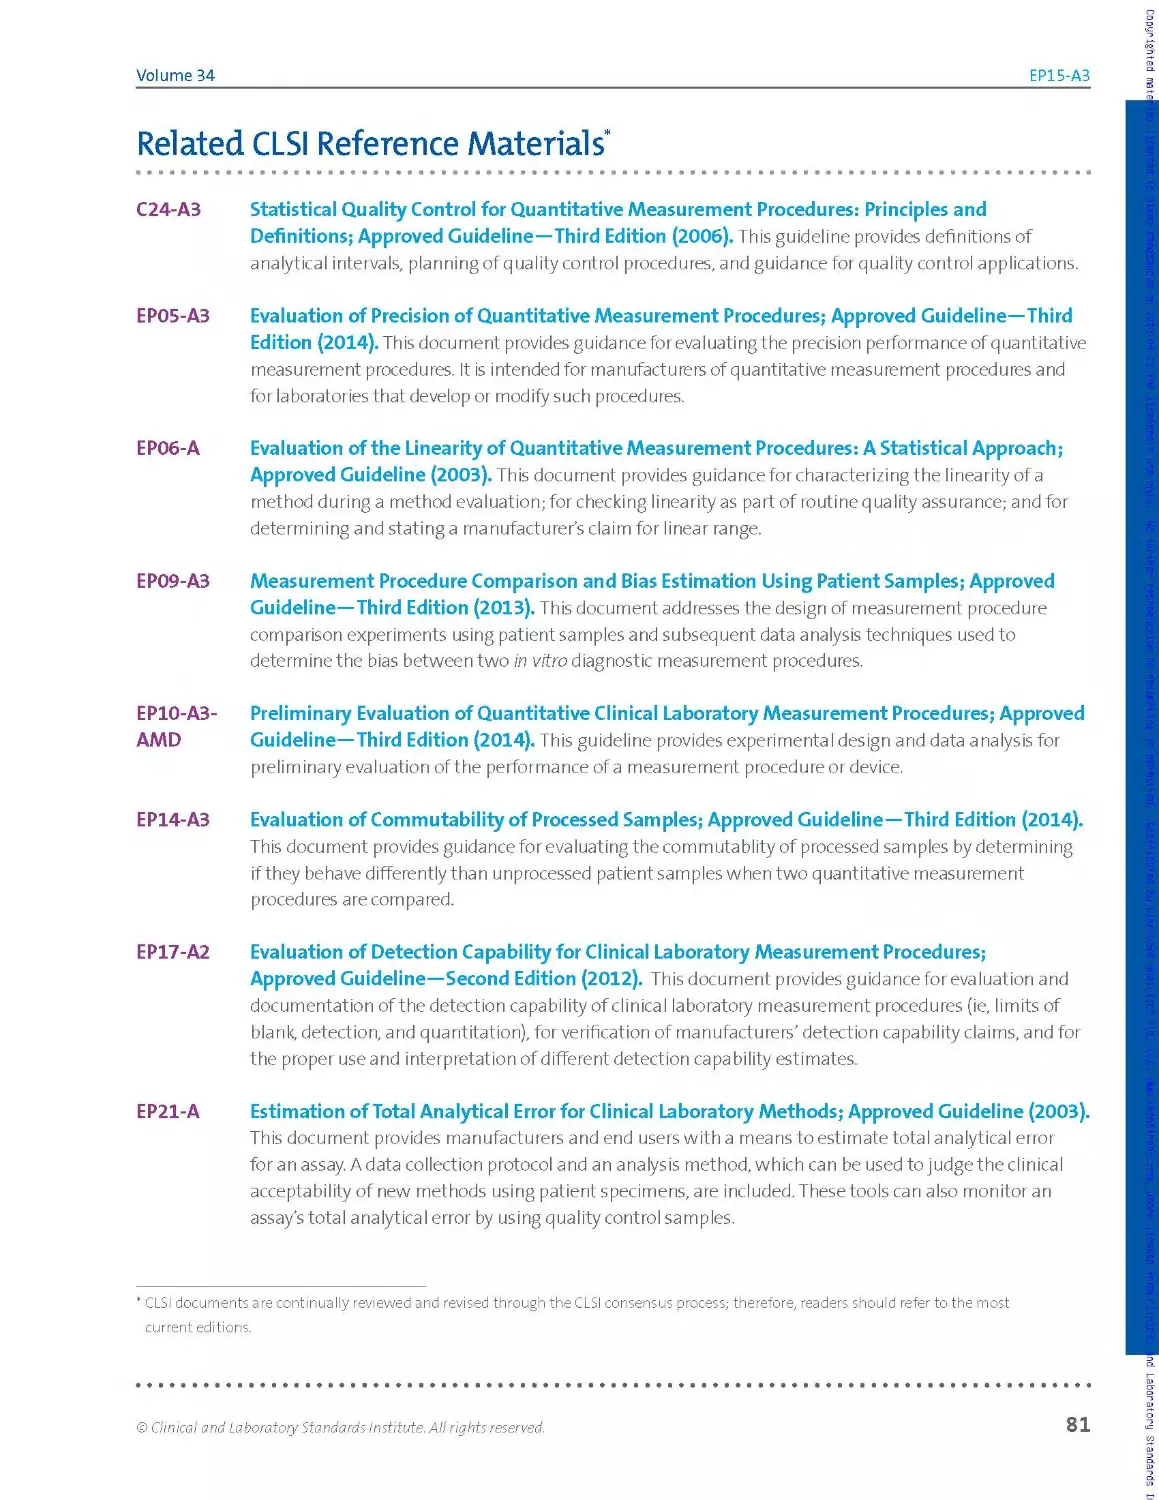
Related CLSI Reference Materials........................................................ 81
vi
Copyrighted material licensed to Olena Ramazanova on 2018-04-12 for licensee's use only. No further reproduction or networking is permitted. Distributed by Clarivate Analytics (US) LLC, www.techstreet.com, under license from Clinical and Laboratory Standards
Volume 34
EP15-A3
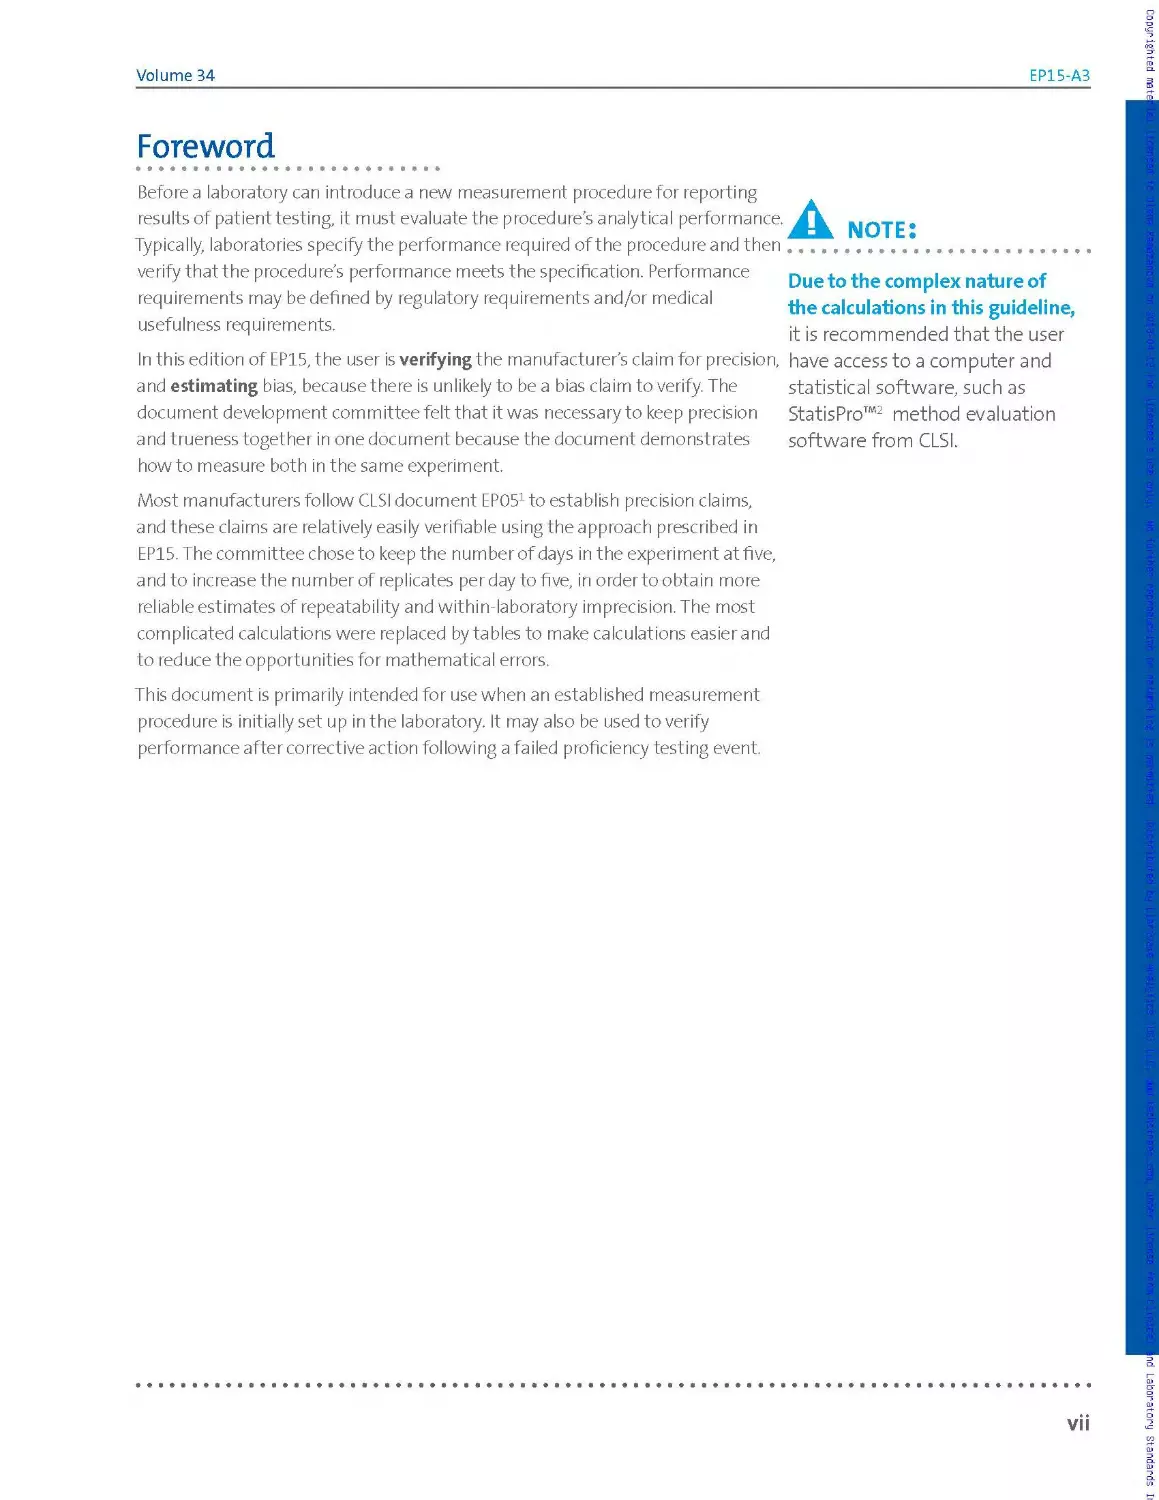
Foreword
Before a laboratory can introduce a new measurement procedure for reporting
results of patient testing, it must evaluate the procedure's analytical performance. NOTE *
Typically, laboratories specify the performance required of the procedure and then......................
verify that the procedure's performance meets the specification. Performance
requirements may be defined by regulatory requirements and/or medical
usefulness requirements.
Due to the complex nature of
the calculations in this guideline,
it is recommended that the user
In this edition of EP15,the user is verifying the manufacturer's claim for precision, have access to a computer and
and estimating bias, because there is unlikely to be a bias claim to verify. The
document development committee felt that it was necessary to keep precision
and trueness together in one document because the document demonstrates
how to measure both in the same experiment.
statistical software, such as
StatisPro™2 method evaluation
software from CLSI.
Most manufacturers follow CLSI document EPO51 to establish precision claims,
and these claims are relatively easily verifiable using the approach prescribed in
EP15. The committee chose to keep the number of days in the experiment at five,
and to increase the number of replicates per day to five, in order to obtain more
reliable estimates of repeatability and within-laboratory imprecision. The most
complicated calculations were replaced by tables to make calculations easier and
to reduce the opportunities for mathematical errors.
This document is primarily intended for use when an established measurement
procedure is initially set up in the laboratory. It may also be used to verify
performance after corrective action following a failed proficiency testing event.
Number 12
EP15-A3
KEY WORDS
Bias
Imprecision
Repeatability
Trueness
Verification of
performance
Within-laboratory
imprecision
A. note:
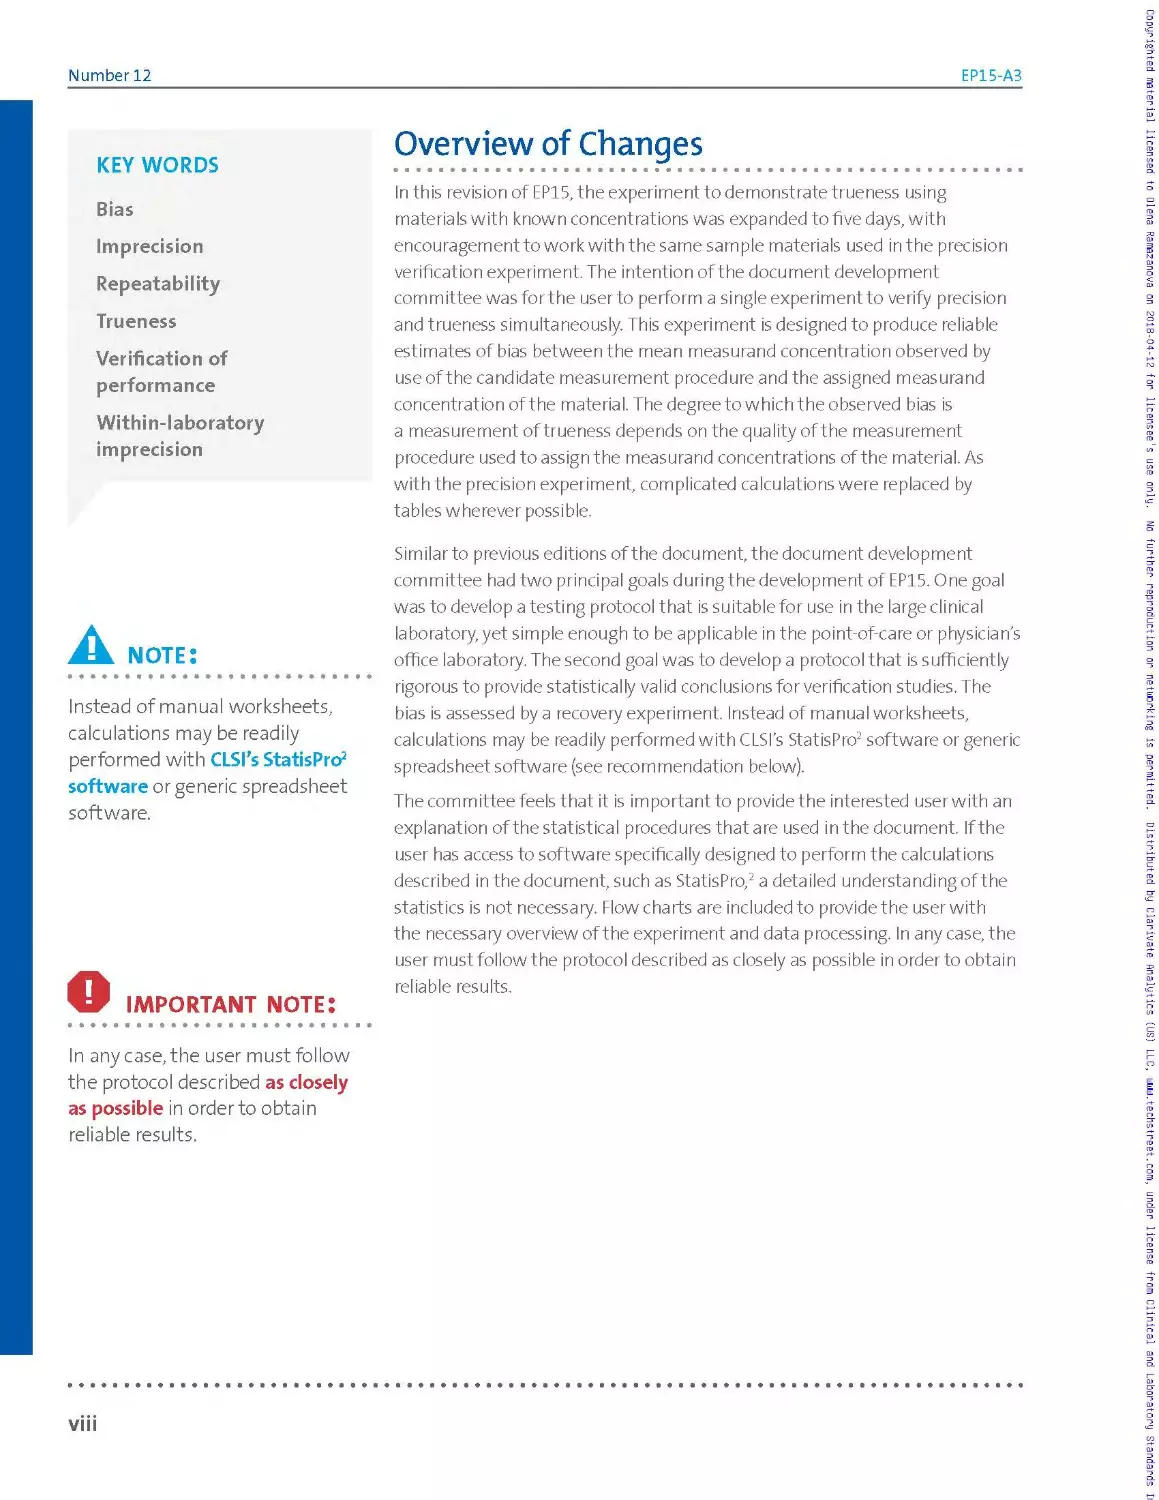
Instead of manual worksheets,
calculations may be readily
performed with CLSI’s StatisPro2
software or generic spreadsheet
software.
О IMPORTANT note:
In any case, the user must follow
the protocol described as closely
as possible in order to obtain
reliable results.
Overview of Changes
In this revision of EP15, the experiment to demonstrate trueness using
materials with known concentrations was expanded to five days, with
encouragement to work with the same sample materials used in the precision
verification experiment. The intention of the document development
committee was for the user to perform a single experiment to verify precision
and trueness simultaneously. This experiment is designed to produce reliable
estimates of bias between the mean measurand concentration observed by
use of the candidate measurement procedure and the assigned measurand
concentration of the material. The degree to which the observed bias is
a measurement of trueness depends on the quality of the measurement
procedure used to assign the measurand concentrations of the material. As
with the precision experiment, complicated calculations were replaced by
tables wherever possible.
Similar to previous editions of the document, the document development
committee had two principal goals during the development of EP15. One goal
was to develop a testing protocol that is suitable for use in the large clinical
laboratory,yet simple enough to be applicable in the point-of-care or physician's
office laboratory. The second goal was to develop a protocol that is sufficiently
rigorous to provide statistically valid conclusions for verification studies. The
bias is assessed by a recovery experiment Instead of manual worksheets,
calculations may be readily performed with CLSI’s StatisPro2 software or generic
spreadsheet software (see recommendation below).
The committee feels that it is important to providethe interested user with an
explanation of the statistical procedures that are used in the document. If the
user has access to software specifically designed to perform the calculations
described in the document, such as StatisPro,2 a detailed understanding of the
statistics is not necessary. Flowcharts are included to providethe user with
the necessary overview of the experiment and data processing. In any case, the
user must fol low the protocol described as closely as possible in order to obtain
reliable results.
• • •
VIII
Copyrighted material licensed to Olena Ramazanova on 2018-04-12 for licensee's use only. No further reproduction or networking is permitted. Distributed by Clarivate Analytics (US) LLC, wwui.techstreet.com, under license from Clinical and Laboratory Standards
Chapter
Introduction
This chapter includes:
► Document scope and applicable exclusions
► Background information pertinent to the
document content
► Standard Precautions information, as
applicable
► Terms and definitions used in the
document
e on Terminology
particular use and/or v
► Abbreviations and a
document
hat highlights
riation in u
wh
applicabl
s used in the
ivate Analytics (US) LLC, шшш.techstreet.com, under license
Number 12
EP15-A3
User Verification of Precision and Estimation of Bias; Approved
Guideline—Third Edition
О Introduction
© IMPORTANT NOTE:
This document is not intended
to establish or validate the
precision performance of a
measurement procedure.
JJk note:
• ••••••••♦•••••♦♦•••♦•♦•I
Because this document’s
scope is limited to verification
of precision and estimation
of bias, other more rigorous
CLSI protocols (eg, see CLSI
documents EP06,3 EP17,4 and
EP285) are employed to validate
the measurement procedures
performance against the users
needs. CLSI documents EPO51
and EPO96 were developed
to assist manufacturers in
establishing the performance
of a diagnostic device for
precision and trueness,
respectively. (Also, see CLSI
documents EP06,3 EP17,4
EP28,5 and EP10.7) CLSI
document EP107 is intended
for the rapid preliminary
evaluation of precision, bias,
sample carryover, drift, and
nonlinearity.
1.1 Scope
This guideline was developed as a protocol for simultaneously verifying a
manufacturer's claims for precision of a measurement procedure and the
trueness of the measurement procedure relative to the assigned values of
materials with known concentrations.
The precision verification section of the guideline was developed for
situations in which the performance of the procedure has been previously
established and documented by experimental protocols with larger scope
and duration. It has relatively weak power to reject precision claims with
statistical confidence, and should only be used to verify that the procedure
is operating in accordance with the manufacturer’s claims. This document
is not intended to establish or validate the precision performance of a
measurement procedure.
The bias estimation section of the guideline relies on 25 or more
measurements by the candidate procedure, made over five or more days,
to estimate the measurand concentrations of materia Is with known
concentrations. These estimated measurand concentrations are compared
to the assigned measurand concentrations of the materials to estimate bias.
The observed bias is a measure of trueness if a high-quality measurement
procedure was used to assign the concentrations of the materials.
Because this document's scope is limited to verification of precision
and estimation of bias, other more rigorous CLSI protocols (eg, see
CLSI documents EP06,3 EP17,4 and EP285) are employed to validate the
measurement procedure’s performance against the user’s needs. CLSI
documents EPO5xand EP096 were developed to assist manufacturers in
establishing the performance of a diagnostic device for precision and
trueness, respectively. (Also, see CLSI documents EPO6,3 EP17/EP28,5
and EPIO.7) CLSI document EPIO7 is intended for the rapid preliminary
evaluation of precision, bias, sample carryover, drift, and nonlinearity.
One may also note that the EPl 5 protocol has an implicit assumption:
Namely, that if the estimated precision and bias are acceptable, then the
overall error (eg, total analytical error) of the measurement procedure is
acceptable. This implied modelcan leadtoan underestimation of the total
analytical error8 in cases in which other effects are important. Besides
conducting more extensive evaluations mentioned above, one could
also consider performing the protocol within CLSI document EP21.9This
protocol is a direct estimation of total analytical error, and does not rely on
a model.
2
© Clinical and Laboratory Standards Institute. All rights reserved.
Volume 34
EP15-A3
1.2 Background
This guideline was written to assist the laboratory in verifying an
established measurement procedure. This guideline provides a minimum
implementation protocol to verify that a particular example of a procedure
is operating in accordance with the manufacturer's claims. The laboratory
must test the procedure against these targets for the protocols in this
guideline to be applicable.
This guideline can also be used as a protocol to demonstrate acceptable
performance when corrective actions are taken, eg, after failing proficiency
testing/external quality assessment (PT/EQA).
The specific characteristics (quantities) addressed in this document
are repeatability, within-laboratory imprecision, and bias relative
to an accepted value. Upon successful completion of the protocols
recommended in this guideline, the laboratory will have verified that the
procedure is operating in accordance with the manufacturer claims for
precision, and can compare the estimated bias relative to materials with
known concentration to a specified allowable bias.
This document leads the userthrough the process of determining the
match between the laboratory's actual performance and the expected
performance of the procedure. If the laboratory's performance is not
consistent with the expected level of performance, remedial actions may
be required.
Underlying this protocol is an assumption that the laboratory can operate
the procedure properly.
1.3 Standard Precautions
Because it is often impossible to know what isolates or specimens
might be infectious, all patient and laboratory specimens are treated
as infectious and handled according to "standard precautions."
Standard precautions are guidelines that combine the major feature of
"universal precautions and body substance isolation" practices. Standard
precautions cover the transmission of all known infectious agents
and thus are more comprehensive than universal precautions, which
are intended to apply only to transmission of bloodborne pathogens.
The Centers for Disease Control and Prevention address this topic in
published guidelines that address the daily operations of diagnostic
medicine in human and animal medicine while encouraging a culture
of safety in the laboratory.10 For specific precautions for preventing
the laboratory transmission of all known infectious agents from
laboratory instruments and materials and for recommendations for the
management of exposure to all known infectious diseases, refer to CLSI
document M29.11
О IMPORTANT NOTE:
This guideline can also be used
as a protocol to demonstrate
acceptable performance when
corrective actions are taken,
eg, after failing proficiency
testing/external quality
assessment (PT/EQA).
A note:
♦ •••••••••••••«•••••••••I*»
Underlying this protocol is an
assumption that the laboratory
can operate the procedure
properly.
© Clinical and Laboratory Standards Institute. All rights reserved.
3
Number 12
EP15-A3
1.4 Terminology
1.4.1 A Note on Terminology
CLSI, as a global leader in standardization, is firmly committed to achieving
global harmonization wherever possible. Harmonization is a process of
recognizing, understanding, and explaining differences while taking steps
to achieve worldwide uniformity. CLSI recognizes that medical conventions
in the global metrological community have evolved differently in the
United States, Europe, and elsewhere; that these differences are reflected
in CLSI, International Organization for Standardization (ISO), and European
Committee for Standardization (CEN) documents; and that legally required
use of terms, regional usage, and different consensus timelines are all
important considerations in the harmonization process. In light of this,
CLSI's consensus process for development and revision of standards and
guidelines focuses on harmonization of terms to facilitate the global
application of standards and guidelines.
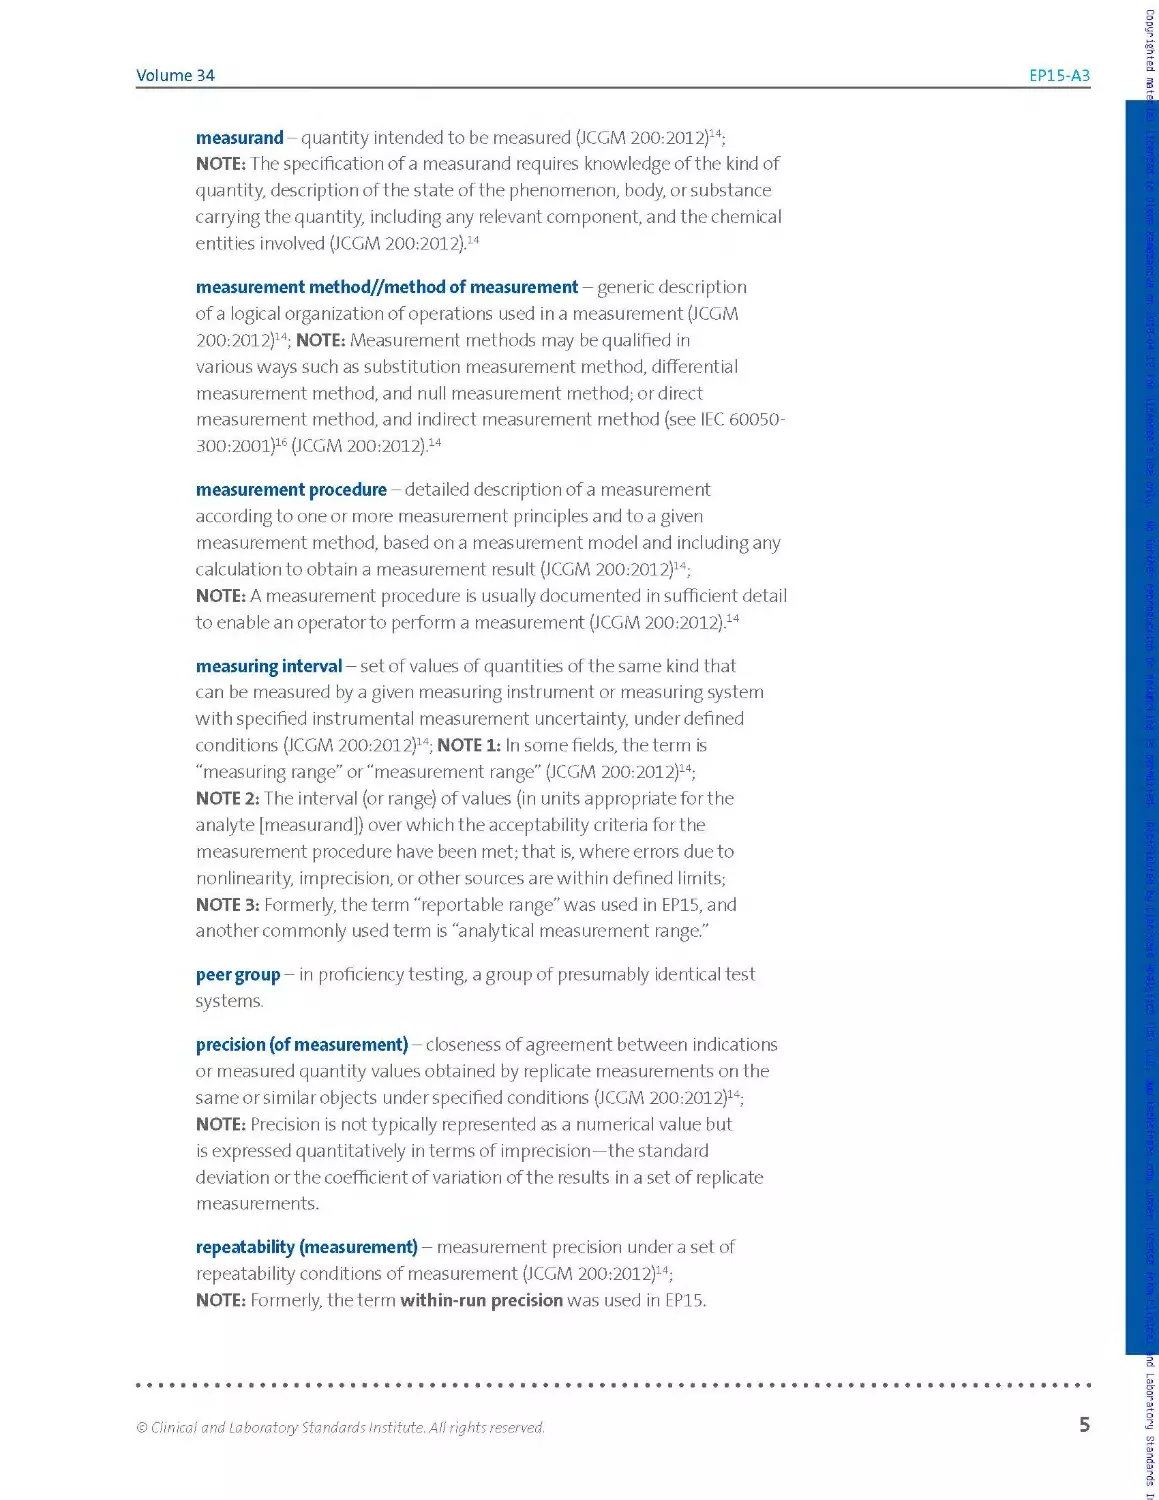
1.4.2 Definitions
analyte - component represented in the name of a measurable quantity
(ISO 17511)12; NOTE 1: In the type of quantity "mass of protein in 24-hour
urine," "protein" is the analyte. In "amount of substance of glucose in
plasma," "glucose" is the analyte. In both cases, the long phrase represents
the measurand (ISO 17511)12; NOTE 2: In the type of quantity "catalytic
concentration of lactate dehydrogenase isoenzyme 1 in plasma," "lactate
dehydrogenase isoenzyme 1" is the analyte. The long phrase designates
the measurand (ISO 18153)13; NOTE 3: This includes any element, ion,
compound, substance, factor, infectious agent, cell, organelle, activity
(enzymatic, hormonal, or immunological), or property, the presence or
absence, concentration, activity, intensity, or other characteristics of which
are to be determined.
bias (of measurement) - estimate of a systematic measurement error
(JCGM 200-.2012).14
conventional quantity value - quantity value attributed by agreement to
a quantity for a given purpose (JCGM 200:2012)14; NOTE 1: Sometimes a
conventional quantity value is an estimate of a true quantity value (JCGM
200:2012)14; NOTE 2: A conventional quantity value is generally accepted
as being associated with a suitably small measurement uncertainty, which
might be zero (JCGM 200:2012).14
intermediate precision conditions - conditions where test results or
measurement results are obtained with the same measurement procedure, on
identical test/measurement items in the same test or measurement facility,
under some different operating conditions (modified from ISO 3534-2)15;
NOTE: There are four elements to the operating conditions: time, calibration,
operator, and equipment (ISO 3534-2).15
4
© Clinical and Laboratory Standards Institute. All rights reserved.
Volume 34
EP15-A3
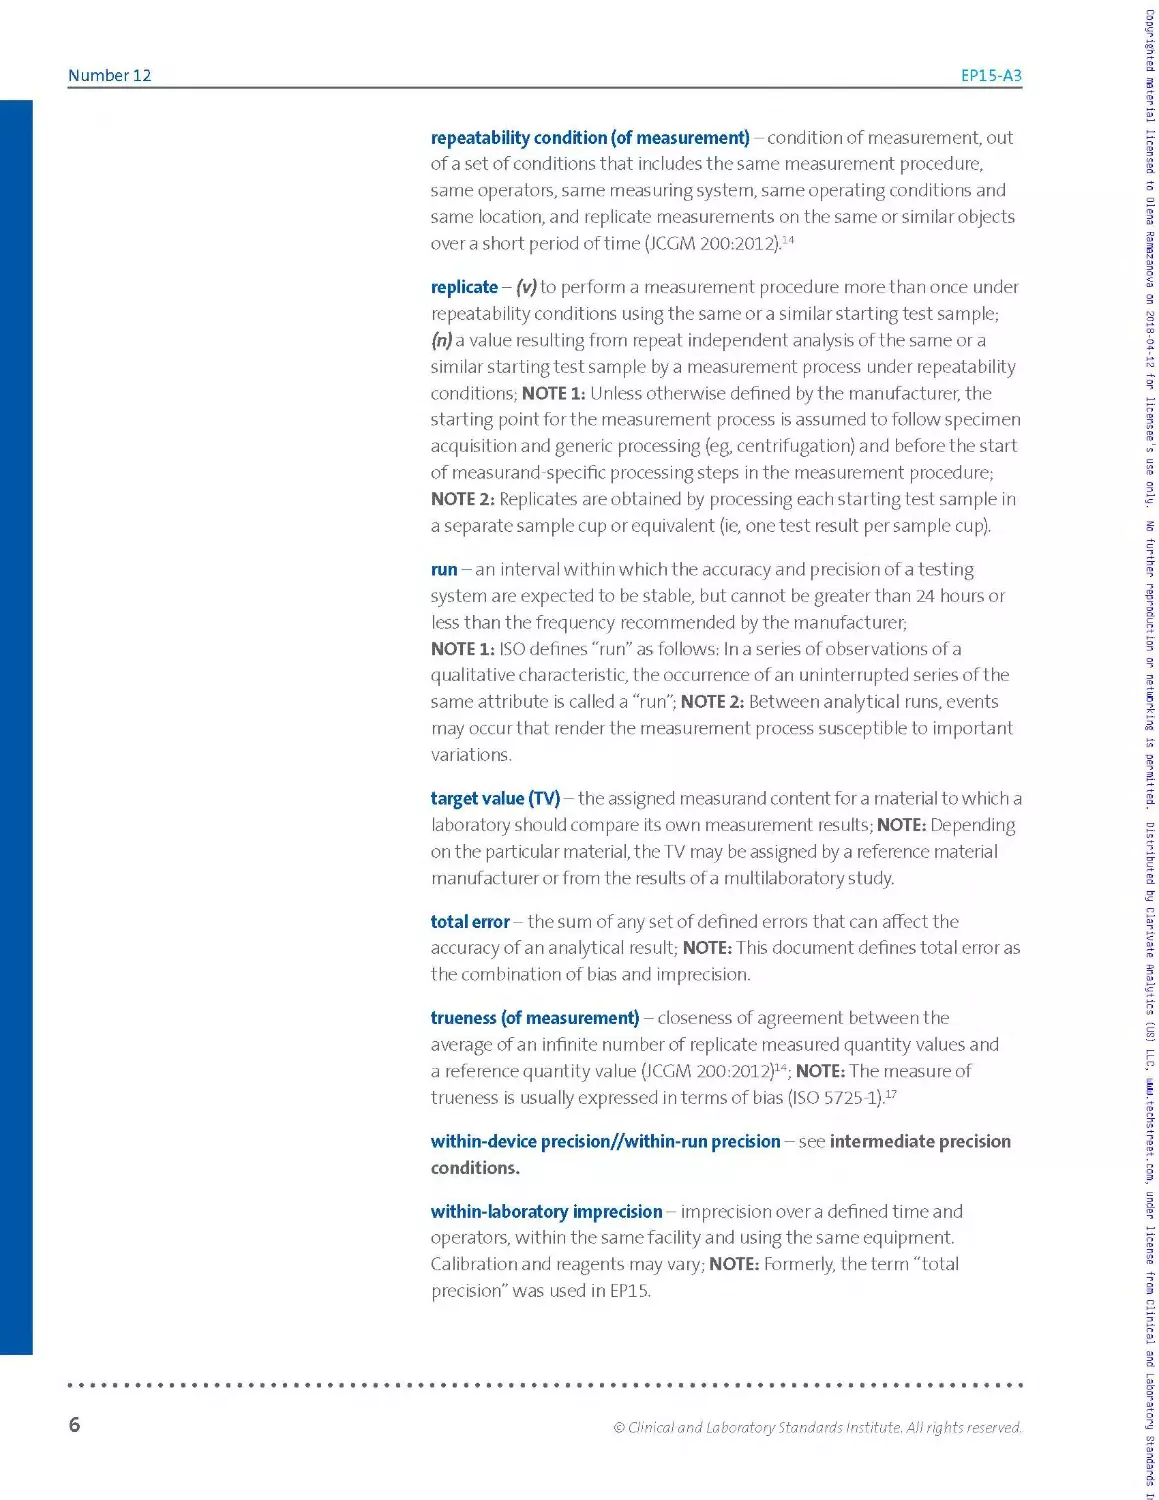
measurand - quantity intended to be measured (JCGM 200:2012)14;
NOTE: The specification of a measurand requires knowledge of the kind of
quantity, description of the state of the phenomenon, body, or substance
carrying the quantity, including any relevant component, and the chemical
entities involved (JCGM 200:2012).14
measurement method//method of measurement - generic description
of a logical organization of operations used in a measurement (JCGM
200:2012)14; NOTE: Measurement methods may be qualified in
various ways such as substitution measurement method, differential
measurement method, and null measurement method; or direct
measurement method, and indirect measurement method (see I EC 60050-
300:2001)16 (JCGM 200:2012)14
measurement procedure -detailed description of a measurement
according to one or more measurement principles and to a given
measurement method, based on a measurement model and including any
calculation to obtain a measurement result (JCGM 200:2012)14;
NOTE: A measurement procedure is usually documented in sufficient detail
to enable an operatorto perform a measurement (JCGM 200-.2012).14
measuring interval-set of values of quantities of the same kind that
can be measured by a given measuring instrument or measuring system
with specified instrumental measurement uncertainty, under defined
conditions (JCGM 200:2012)14; NOTE 1: In some fields, the term is
"measuring range" or "measurement range" (JCGM 200:2012)14;
NOTE 2: The interval (or range) of values (in units appropriate for the
analyte [measurand]) over which the acceptability criteria forthe
measurement procedure have been met; that is, where errors due to
nonlinearity, imprecision, or other sources are within defined limits;
NOTE 3: Formerly, the term "reportable range" was used in EP15, and
another commonly used term is "analytical measurement range."
peer group - in proficiency testing, a group of presumably identical test
systems.
precision (of measurement) - closeness of agreement between indications
or measured quantity values obtained by replicate measurements on the
same or similar objects underspecified conditions (JCGM 200:2012)14;
NOTE: Precision is not typically represented as a numerical value but
is expressed quantitatively in terms of imprecision—the standard
deviation orthe coefficient of variation of the results in a set of replicate
measurements.
repeatability (measurement) - measurement precision under a set of
repeatability conditions of measurement (JCGM 200:2012)14;
NOTE: Formerly, the term within-run precision was used in EP15.
© Clinical and Laboratory Standards Institute. All rights reserved.
5
Number 12
EP15-A3
repeatability condition (of measurement) - condition of measurement, out
of a set of conditions that includes the same measurement procedure,
same operators, same measuring system, same operating conditions and
same location, and replicate measurements on the same or similar objects
over a short period of time (JCGM 200:2012).14
replicate - (v) to perform a measurement procedure more than once under
repeatability conditions using the same or a similar starting test sample;
(n)a value resulting from repeat independent analysis of the same ora
similar starting test sample by a measurement process under repeatability
conditions; NOTE 1: Unless otherwise defined by the manufacturer, the
starting point for the measurement process is assumed to follow specimen
acquisition and generic processing (eg, centrifugation) and before the start
of measurand-specific processing steps in the measurement procedure;
NOTE 2: Replicates are obtained by processing each starting test sample in
a separate sample cup or equivalent (ie, one test result per sample cup).
run - an interval within which the accuracy and precision of a testing
system are expected to be stable, but cannot be greater than 24 hours or
less than the frequency recommended by the manufacturer;
NOTE 1: ISO defines "run" as follows: In a series of observations of a
qualitative characteristic, the occurrence of an uninterrupted series of the
same attribute is called a "run" NOTE 2: Between analytical runs, events
may occur that render the measurement process susceptible to important
variations.
target value (TV) - the assigned measurand content for a material to which a
laboratory should compare its own measurement results; NOTE: Depending
on the particular material, the TV may be assigned by a reference material
manufacturer or from the results of a multilaboratory study.
total error - the sum of any set of defined errors that can affect the
accuracy of an analytical result; NOTE: This document defines total error as
the combination of bias and imprecision.
trueness (of measurement) - closeness of agreement between the
average of an infinite number of replicate measured quantity values and
a reference quantity value (JCGM 200:2012)14; NOTE: The measure of
trueness is usually expressed in terms of bias (ISO 5725-1).17
within-device precision//within-run precision - see intermediate precision
conditions.
within-laboratory imprecision - imprecision over a defined time a nd
operators, within the same facility and using the same equipment.
Calibration and reagents may vary; NOTE: Formerly, the term "total
precision" was used in EP15.
6
© Clinical and Laboratory Standards Institute. All rights reserved.
Volume 34
EP15-A3
1.43 Abbreviations and Acronyms
ANOVA analysis of variance
CEN Co mite Euro peen de Normalisation
(European Committee for Standardization)
Cl confidence interval
%CV coefficient of variation expressed as a percentage
%CVg between-day standard deviation expressed as percentage
of the mean
%CVR repeatability standard deviation expressed as percentage
of the mean
%CVm within-laboratory standard deviation expressed as percentage
of the mean
DF degrees of freedom
dfc combined degrees of freedom
dfR degrees of freedom for repeatability
dfRM degrees of freedom for reference materia Is
dfWL degrees of freedom for within-laboratory imprecision
EQA external quality assessment
IS International Standard(s)
ISO International Organization for Standardization
JCTLM Joint Committee for Traceability in Laboratory Medicine
MS mean squares
nSam number of samples
NIST National Institute of Standards and Technology
PI package insert
PT proficiency testing
QC quality control
<jR ma n ufact u rer’s c la i m fo r re peata b i I ity
manufacturer's claim for within-laboratory imprecision
SD standard deviation
SI Systeme International d'Unites (International System of Units)
$R user estimate for repeatability
SS sum of squares
user estimate for within-laboratory imprecision
© Clinical and Laboratory Standards Institute. All rights reserved.
7
Number 12
EP15-A3
TV target value
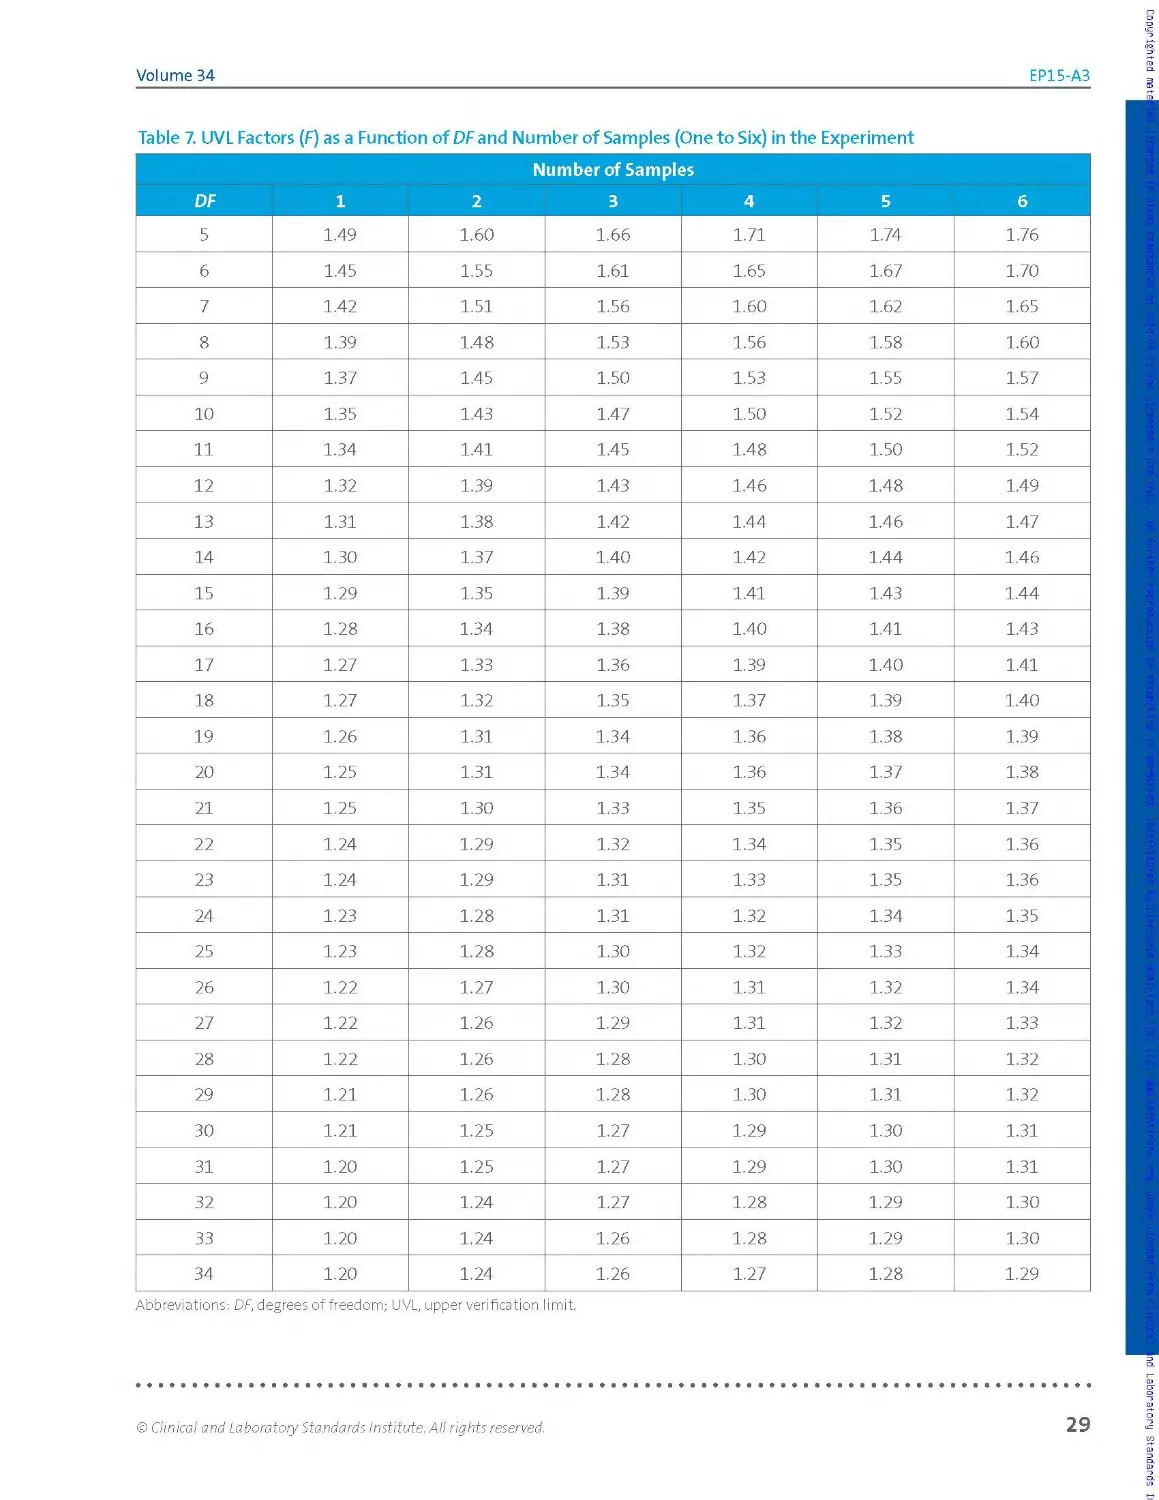
UVL upper verification limit
VB variance between runs
Vw variance within run
WHO World Health Organization
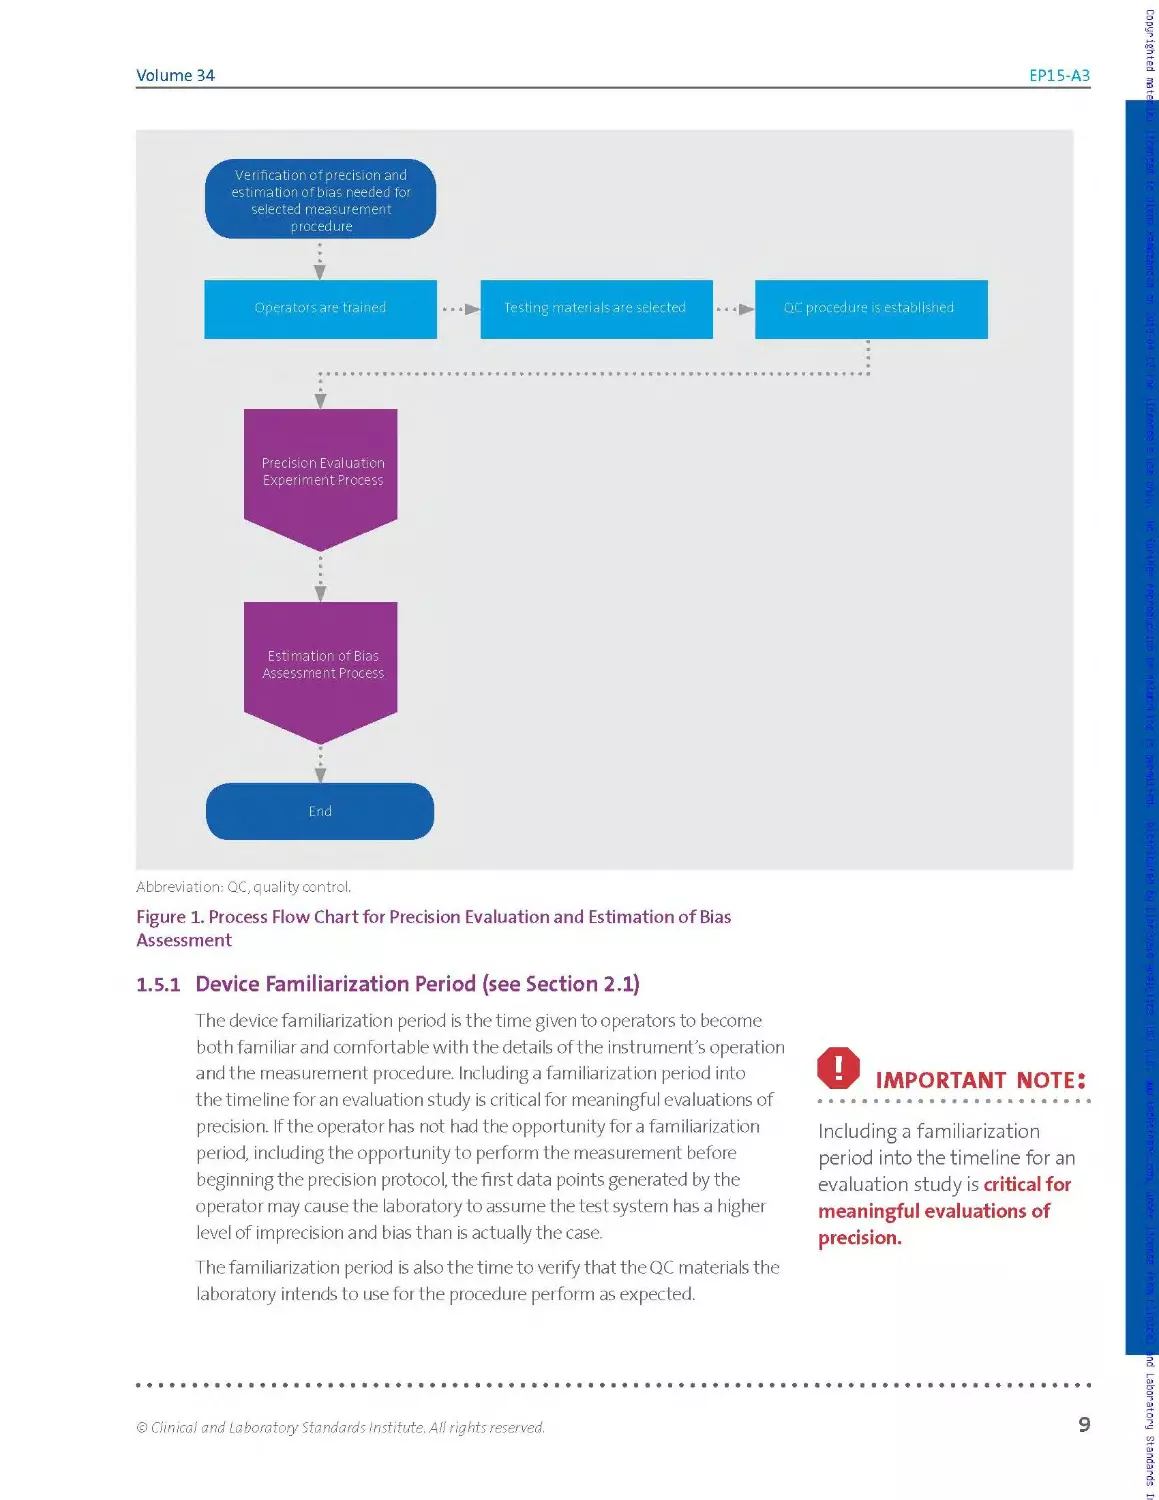
1.5 Overview of the Protocol
The EPl 5 protocols for precision verification and demonstration of
trueness involve repeated measurement of samples over five working
days. With proper planning and judicious choice of samples, the bench
work can be completed in a single week, though additional days are
recommended when greater reliability is important. If samples with known
concentrations are used for the precision experiment, results from a single
experiment can be analyzed for bias (a measure of trueness) as well as
for precision. Figure 1 shows a basic overview of the process involved in
precision evaluation and estimation of bias.
Copyrighted material licensed to Olena Ramazanova on 2018-04-12 for licensee's use only. No further reproduction or networking is permitted. Distributed by Clarivate Analytics (US) LLC, www.techstreet.com, under license from Clinical and Laboratory Standards
© Clinical and Laboratory Standards Institute. All rights reserved.
Volume 34
EP15-A3
Estimation of Bias
Assessment Process
End
Abbreviation: QC, quality control.
Figure 1. Process Flow Chart for Precision Evaluation and Estimation of Bias
Assessment
1.5.1 Device Familiarization Period (see Section 2.1)
The device familiarization period is the time given to operators to become
both familiar and comfortable with the details of the instrument's operation
and the measurement procedure. Including a familiarization period into
the timeline for an evaluation study is critical for meaningful evaluations of
precision. If the operator has not had the opportunity for a familiarization
period, including the opportunity to perform the measurement before
beginning the precision protocol, the first data points generated by the
operator may cause the laboratory to assume the test system has a higher
level of imprecision and bias than is actually the case.
The familiarization period is a Iso t he time to verify that the QC materials the
laboratory intends to use for the procedure perform as expected.
О IMPORTANT note:
Including a familiarization
period into the timeline for an
evaluation study is critical for
meaningful evaluations of
precision.
© Clinical and Laboratory Standards Institute. All rights reserved.
9
Number 12
EP15-A3
1.6
IMPORTANT note:
Lists of medically based
performance standards are
provided in the references.1819
Performance Standards
Before selecting a specific procedure for measuring the concentration of an
analyte and evaluating that procedure's performance, the laboratory must
establish minimum performance specifications based on the clinical needs
of the laboratory’s clients. Lists of medically based performance standards
are provided in the references.18'19 Some regulatory and accreditation
programs3 specify minimum standards for performance in PT. If regulatory
performance standards apply, these standards define the maximum
allowable measurement errorthe measurement procedure may deliver.
These standards are expressed in terms of total allowable difference (total
error) from an accepted target value (TV). Discussions of the relationship
between allowable error and allowable imprecision and bias are included
in the references.15'16 The user can also refer to CLSI document EP21.9
For the performance characteristics evaluated in this document, the
following performance goal formats are recommended in order to conform
tothe evaluation result formats:
Precision. Precision goals should be stated as the maximum allowable
imprecision, SD, and/or CV expressed as a percentage (%CV) at each
analyte concentration to be tested. Where appropriate, the user compares
the manufacturer claims to these performance goals. Ideally, the
laboratory can select a measurement procedure whose manufacturer
claims for imprecision are within the limits of the performance
specifications of the laboratory. If the manufacturer’s imprecision claims
exceed the specified imprecisions, the user should not attempt to verify
the imprecision claims. The user has the choice of select!ng another
candidate procedure, or relaxing the specification in the situation in which
no measurement procedure meets the specification.
Trueness (bias). Trueness goals for bias should be stated as the maximum
allowable bias, at each analyte concentration to be tested, that is not
exceeded with certain probability. Maximum allowable bias may be
expressed in either absolute or relative terms—that is, either as a deviation,
in concentration units, or as a percent deviation, as either an absolute
concentration or as a percentage of the concentration.
a For example, in the United States, the Clinical Laboratory Improvement Amendments and the College of American Pathologists.
Copyrighted material licensed to Olena Ramazanova on 2018-04-12 for licensee's use only. No further reproduction or networking is permitted. Distributed by Clarivate Analytics (US) LLC, www.techstreet.com, under license from Clinical and Laboratory Standards
10
© Clinical and Laboratory Standards Institute. All rights reserved.
Chapter
This chapter includes:
permitted. Distribute^^^marivate Analytics (US) LLC, шшш.techstreet.com, under license from Clinical and Labora
Precision Verification S’
► General guidance on operator training and
QC procedures
designs
► Overview and limitations of the precision
verification study
Number 12
EP15-A3
G Precision Verification Study
2.1 Familiarization Period
After the system has been inspected by the manufacturer, staff must
become familiar with the operation, maintenance procedures, methods of
sample preparation, calibration, and monitoring functions. The length of
time required for this process is variable, depending on the complexity of
the device. If appropriate, calibration should be verified during this period
(see CLSI document EPO63). At the end of this period, the operator(s) should
be confident in the operation of the device.
О IMPORTANT NOTE:
Training should include the
use of actual sample material,
including pools, controls,
leftover patient samples,
or any other test materials
appropriate for the device.
О IMPORTANT NOTE:
Data should not be collected
during the familiarization
period. Operator training is not
complete until the user can
confidently operate the device
(see CLSI document QMSO320).
A note:
For guidance on establishing
ongoing QC procedures, refer
to CLSI document C24.21
2.1.1 Operator Training
The operation, maintenance procedures, methods of sample preparation,
and calibration and monitoring functions must be learned. Some
manufacturers provide this training. The device should be set up and
operated in the individual laboratory long enough for operators to
understand all of the procedures involved in order to avoid problems
during the evaluation of its performance. Training should include the use of
actual sample material, including pools, controls, leftover patient samples,
or any other test materials appropriate for the device.
All possible contingencies (eg, error flags, error correction, calibration)
that may arise during routine operation should be carefully monitored.
Data should not be collected during this period. Operator training is not
complete until the user can confidently operate the device (see CLSI
document QMSO320).
2.1.2 Quality Control Procedures
QC procedures to be followed during the protocol are established during
the familiarization period. It is important to verify that the device is
operating in control, according to the manufacturer’s specifications. To
demonstrate this fact, use the control procedures recommended by the
manufacturer. Due to the short duration of this protocol, the estimated
SDs should not be used by themselves to establish QC limits. For guidance
on establishing ongoing QC procedures, refer to CLSI document C24.21
2.13 Documenting the Studies
Follow good documentation practices. Ensure traceability of the data
analyses and conclusions to the experimental testing and manufacturer
claims along with observations, interpretations, and troubleshooting.
Documentation should address the study as a whole, and also at the
individual sample run and replicate levels.
12
© Clinical and Laboratory Standards Institute. All rights reserved.
Volume 34
EP15-A3
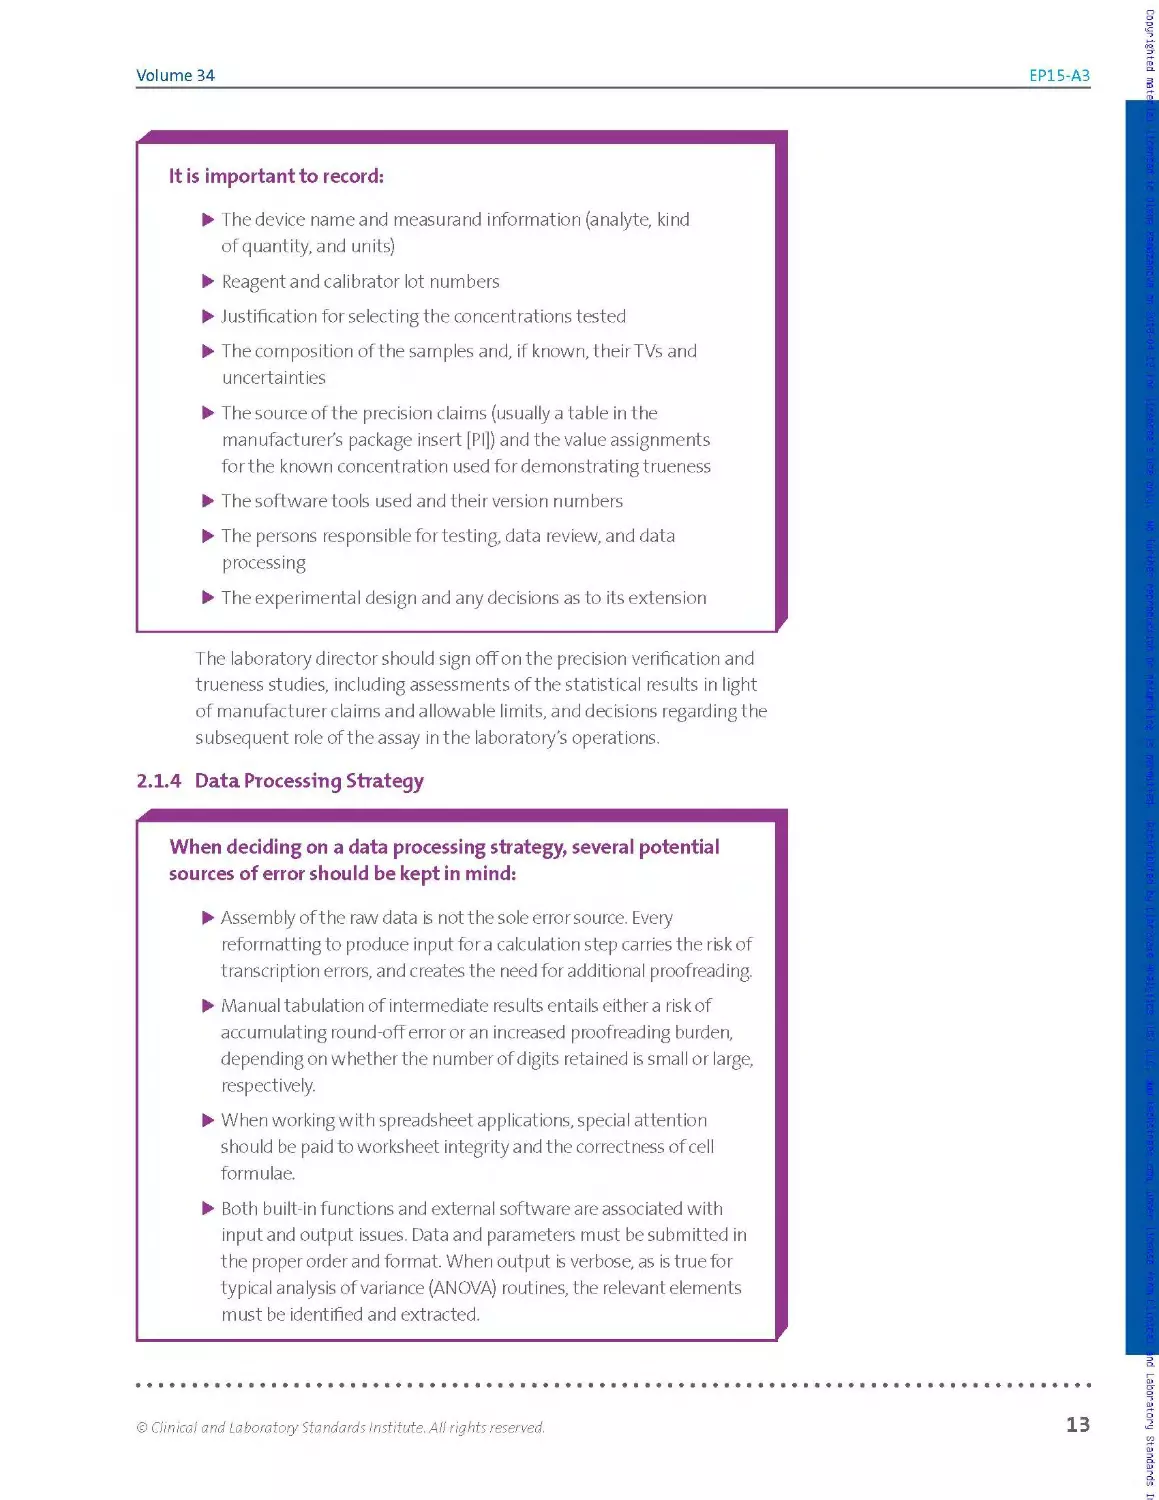
It is important to record:
► The device name and measurand information (analyte, kind
of quantity, and units)
► Reagent and calibrator lot numbers
► Justification for selecting the concentrations tested
► The composition of the samples and, if known, their TVs and
uncertainties
► The source of the precision claims (usually a table in the
manufacturer's package insert [PI]) and the value assignments
for the known concentration used for demonstrating trueness
► The software tools used and their version numbers
► The persons responsible for testing, data review, and data
processing
► The experimental design and any decisions as to its extension
The laboratory director should sign off on the precision verification and
trueness studies, including assessments of the statistical results in light
of manufacturer claims and allowable limits, and decisions regarding the
subsequent role of the assay in the laboratory’s operations.
2.1.4 Data Processing Strategy
When deciding on a data processing strategy, several potential
sources of error should be kept in mind:
► Assembly ofthe raw data is not the sole error source. Every
reformatting to produce input fora calculation step carries the risk of
transcription errors, and creates the need for additional proofreading.
► Manual tabulation of intermediate results entails either a risk of
accumulating round-off error or an increased proofreading burden,
depending on whether the number of digits retained is small or large,
respectively.
► When working with spreadsheet applications, special attention
should be paid to worksheet integrity and the correctness of cell
formulae.
► Both built-in functions and external software are associated with
input and output issues. Data and parameters must be submitted in
the proper order and format. When output is verbose, as is true for
typical analysis of variance (ANOVA) routines, the relevant elements
must be identified and extracted.
© Clinical and Laboratory Standards Institute. All rights reserved.
13
Number 12
EP15-A3
jfik note:
The precision verification
study described in this
document has three parts:
► Repeated measurements
over five days
► Calculations of
repeatability and within-
laboratory precision
estimates
2.2
► Assessment of consistency
of estimates with the
claims
A note:
Uses of a precision verification
study:
► Assess consistency of
observed assay precision
performance vs pre-
established claims before
introducing assay into
routine use.
► Assess precision
performance as part of
a corrective action plan
following a PT failure.
► Assess precision during
assay optimization studies.
► Use as part of instrument
or assay troubleshooting
efforts.
Accordingly, the calculations are presented wherever possible in the form
of look-up tables or in relatively simple algebraic form, avoiding the use of
matrix notation. This presentation is meant to facilitate 1) implementing
and verifying routines in a programming language or generic spreadsheet
environment, and/or 2) confirming the suitability of off-the-shelf software
routines. It is strongly recommended that users test their software against
the numerical examples provided in ordertospot checkthe software's
fitness for use in this context. (The examples supplied are too limited to
serve as a basis for validating the software routines.)
Overview and Limitations of the Precision
Verification Study
The precision verification study described in this document is a small
experiment, involving repeated measurements of two or more samples
over (at least) five days, calculation of repeatability and within-laboratory
imprecision estimates, and assessment of their consistency with
the claims. It is primarily intended for use by laboratorians to assess
consistency of observed measurement procedure imprecision performance
vs pre-established claims before introducing the assay into routine use.
However, the study may be used for other purposes, such as assessing
precision performance as part of a corrective action plan following a PT
failure, assessment of precision during assay optimization studies, or as a
part of instrument or troubles hooting efforts, among other applications.
The study design represents a compromise between costs to the user
associated with time and materials, and the riskofan inadequate or
misleading assessment of the procedure's precision. While estimates
of repeatability and within-laboratory imprecision could be generated
through separate experiments, the integrated (single experiment)
approach recommended in this document offers significant advantages
in terms of efficiency, computational rigor, and robustness of the
repeatability estimates.
This section describes a process for verifying precision claims made by
a manufacturer for a measurement procedure, which could beeithera
commercially developed procedure ora laboratory-developed test. Fora
commercially developed procedure, such claims typically are presented
within the assay's PI as a table of experimentally determined repeatability
and within-laboratory imprecision estimates, expressed as SDs and/or as
%CVs, at several measurand concentrations.
"Repeatability" refers to variability due solely to within-run (within-batch)
factors. It reflects inherent variability overa short period of time under
conditions minimizing other sources of variation. "Within-laboratory
imprecision" (or "within-device imprecision")—also referred to by the
outdated term "total precision" in some Pls—refers to variability due to
run-to-run and day-to-day factors in addition to repeatability sources.
14
© Clinical and Laboratory Standards Institute. All rights reserved.
Volume 34
EP15-A3
Accordingly, at any given measurand concentration, a procedure's within-
laboratory imprecision usually exceeds repeatability and cannot be less.
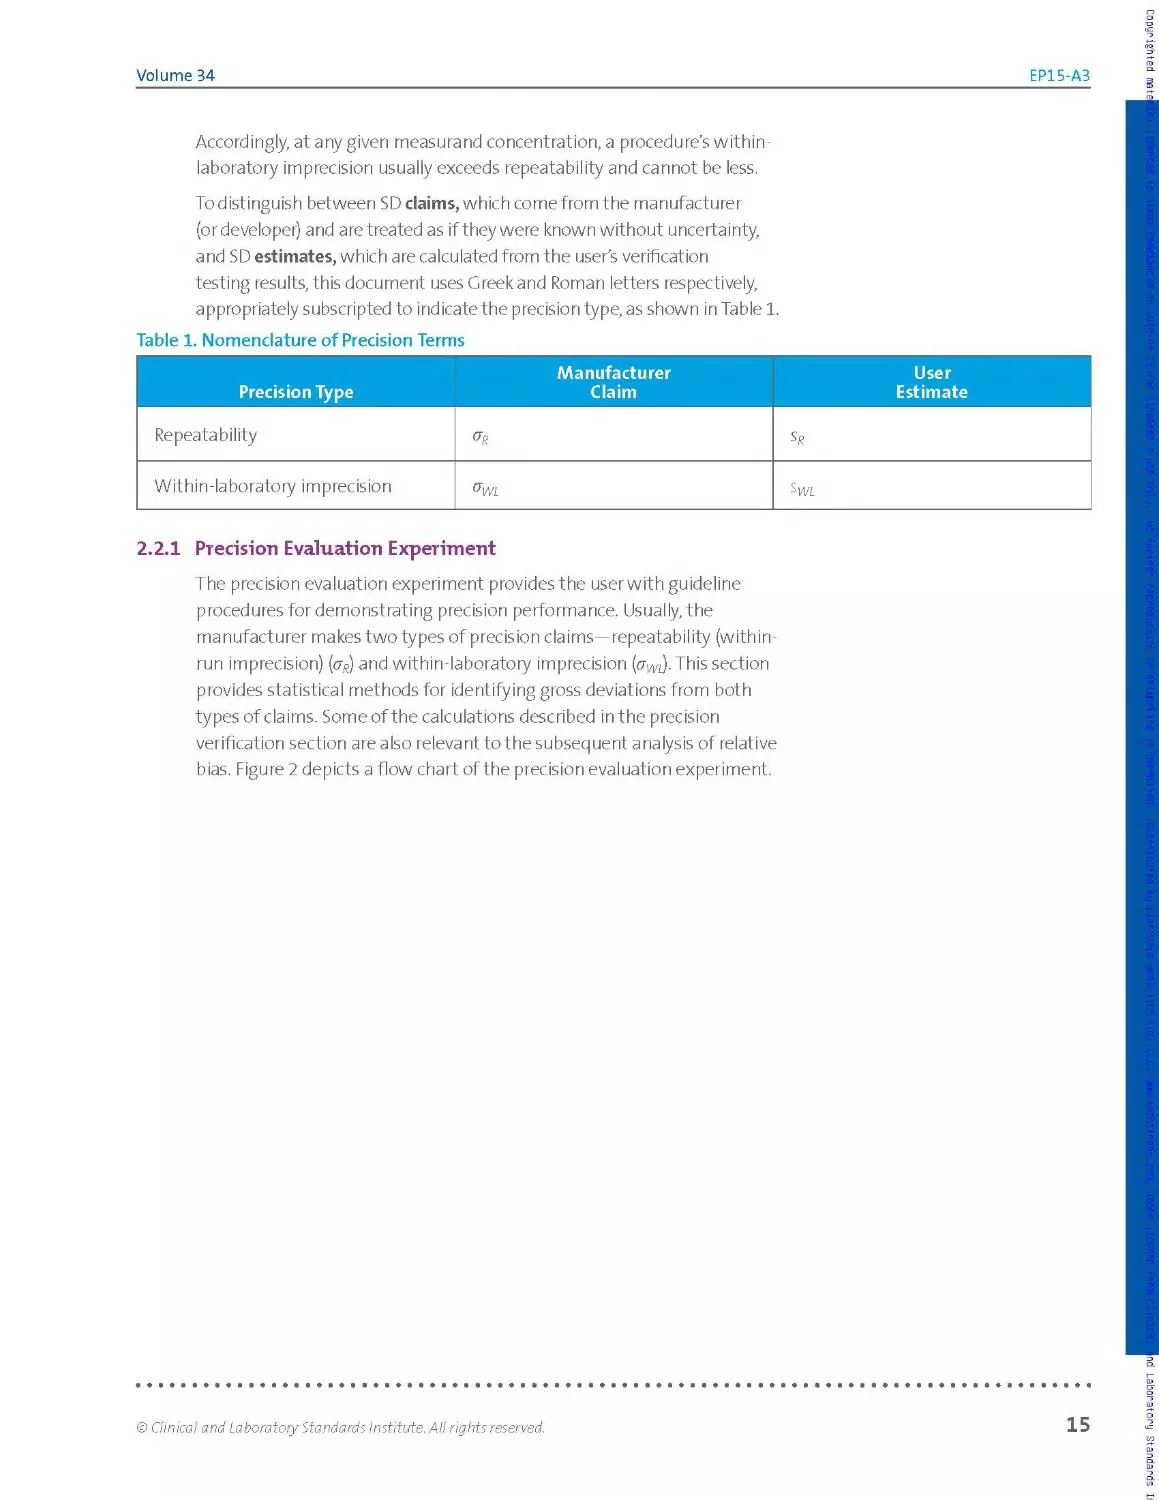
To distinguish between SD claims, which come from the manufacturer
(or developer) and are treated as if they were known without uncertainty,
and SD estimates, which are calculated from the user's verification
testing results, this document uses Greek and Roman letters respectively,
appropriately subscripted to indicate the precision type, as shown in Table 1.
Table 1. Nomenclature of Precision Terms
Precision Type Manufacturer Claim User Estimate
Repeatability
Within-laboratory imprecision
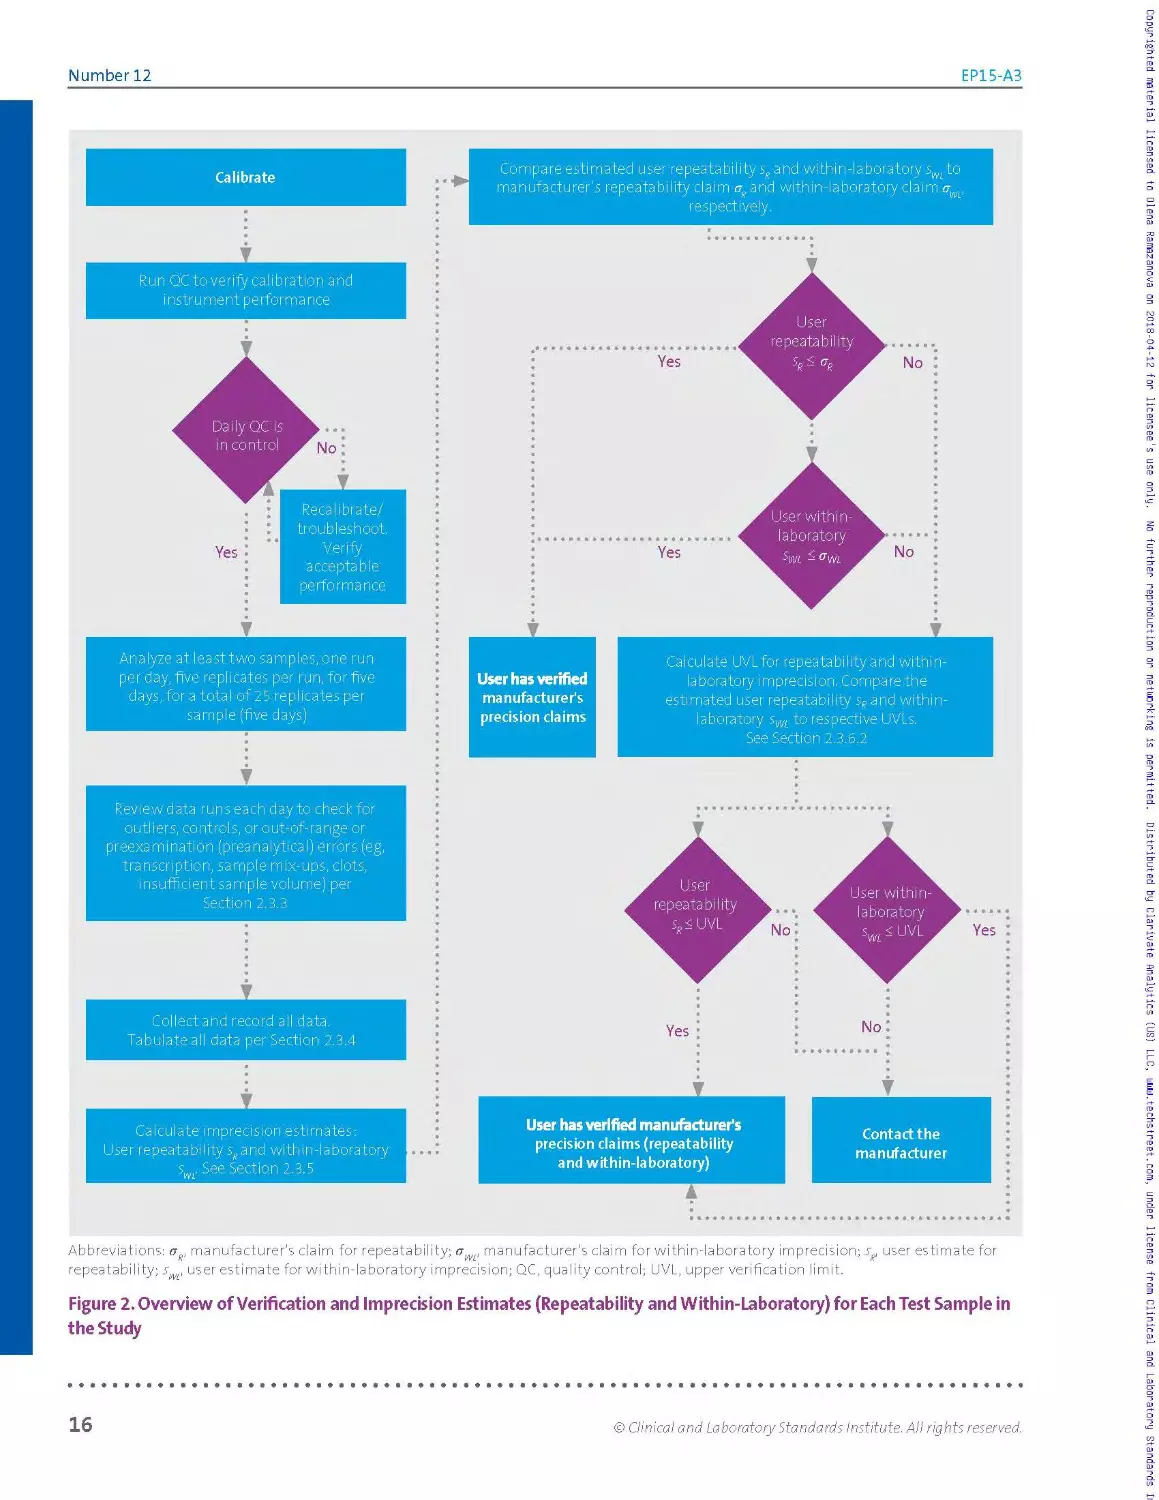
2.2.1 Precision Evaluation Experiment
The precision evaluation experiment provides the user with guideline
procedures for demonstrating precision performance. Usually, the
manufacturer makes two types of precision claims—repeatability (within-
run imprecision) (py) and with in-laboratory imprecision (crm).This section
provides statistical methods for identifying gross deviations from both
types of claims. Some of the calculations described in the precision
verification section are also releva nt to the subsequent analysis of relative
bias. Figure 2 depicts a flow chart of the precision evaluation experiment.
© Clinical and Laboratory Standards Institute. All rights reserved.
15
Number 12
EP15-A3
Abbreviations: ag, manufacturer's claim for repeatability; owe manufacturer’s claim for within-laboratory imprecision; sR, user estimate for
repeatability; s , user estimate for within-laboratory imprecision; QC, quality control; UVL, upper verification limit.
Figure 2. Overview of Verification and Imprecision Estimates (Repeatability and Within-Laboratory) for Each Test Sample in
the Study
Copyrighted material licensed to Olena Ramazanova on 2018-04-12 for licensee's use only. No further reproduction or networking is permitted. Distributed by Clarivate Analytics (US) LLC, www.techstreet.com, under license from Clinical and Laboratory Standards
16
© Clinical and Laboratory Standards Institute. All rights reserved.
Volume 34
EP15-A3
The experimental design and data analyses a re similar to those described
in CLSI document EPO5,1 which is regularly used by manufacturers to
establish precision claims. In particular, both studies use ANOVAto
calculate estimates of imprecision from multiday studies.
The amount of testing for EP15 is substantially reduced compared to that
in CLSI document EPO5,1 in order to be practical for end users. Because of
the substantially reduced amount of testing, however, and because the
EP15 consistency check is designed to protect the user from failing more
than approximately 5% of the time simply due to chance, discrepancies
between manufacturer claims and user observed precision performance
will not be reliably flagged unless they are quite large.
23 Experimental Procedure Design
The precision verification study calls for repeatedly testing at least two
samples with different measurand concentrations. The basic 5x5 design-
five days, one run per day, five replicates per run—should yield a total of 25
results per sample.
To improve the rigor of the estimates, the experiment could be extended
to include additional runs, preferably on additional days, for any one or
more of the samples. Alternatively, for example, just four replicates could
be tested for each sample on each one of seven days, in order to obtain a
somewhat more reliable within-laboratory imprecision estimate, without
compromising the repeatability estimate.
Judicious design modifications of th is nature are acceptable, and the
calculations described in this guideline can accommodate them. In no case,
however, may a design use less than five days per sample. Note, however,
that five replicates must be tested in each run if the same samples
and experiment are used to estimate imprecision and bias, and the
experimenter will use Tab les 15A, 15 B, and 15C of Section 3.5, because the
tables support five, six, and seven runs of five replicates each, respectively
(no fewer replicates).
The operational definition of a "run" for the verification study should
follow what the manufacturer did in establishing the claims. Most
commonly, this means processingall replicates contiguously fora given
sample and day, ie, in the shortest possible time period. Alternative
approaches could involve processing the replicates distributed over an
eight-hour shift or other time period, depending on how the manufacturer
defines a run for its precision study.
О reminder:
C LSI's Stat is Pro2 software
provides a complete, user-
friendly implementation of
the EP15 data analysis, but
this can also be handled by
combining readily available
AN OVA software with
table look-ups and simple
spreadsheet calculations.
© Clinical and Laboratory Standards Institute. All rights reserved.
17
Number 12
EP15-A3
О IMPORTANT NOTE:
Selecting samples with levels
close to those reported in the PI
may greatly simplify identifying
the claims relevant to the final
consistency checks. In any case,
avoid extreme levels that
would require extrapolating
beyond the interval spanned by
the PI levels or that might yield
results outside the measuring
interval for some replicates.
Jk note:
Sample processing days need
not be consecutive calendar
days, nor is it essential that all
samples be processed in the
same runs or even on the
same days.
О IMPORTANT note:
Do not simply preprocess
a sample or aliquot once
and then perform replicate
analyses on it. Perform the
preprocessing as was done by
the manufacturer to establish
the precision claims.
2.3.1 Samples
Select at least two samples for the study preferably individual patient
samples, pools thereof, or commercial QC materials consistent with those
used by the manufacturer to establish the precision claims.
The samples should have different measurand concentrations, preferably
ones that represent clinical decision points (cutoffs) or reference limits,
or simply fall in normal and abnormal regions. If the goal is to verify
manufacturer claims across all or most of the procedure’s stated
measuring interval, optimal choices forthe numberof samples and their
concentration levels will depend on how imprecision varies across that
interval. Selecting samples with levels close to those reported in the PI
may greatly simplify identifying the claims relevant to the final consistency
checks. In any case, avoid extreme levels that would require extrapolating
beyond the interval spanned by the PI levels, or that might yield results
outside the measuring interval for some replicates.
Samples should be prepared and stored in order to ensure their stability
throughout the study. A common practice is to aliquot and freeze the
samples, providing this is appropriate for the measurand. In deciding on
the size and number of the aliquots, be sure to a I low for "dead volumes"
and the possibility that additional runs may be needed.
2.3.2 Processing
At the beginning of the study, calibrate the procedure according to the
manufacturer's instructions. If the precision claims were generated during
multiple calibration cycles, consider incorporating additional calibration
events during the study.
Schedule daily work assignments so that testing is representative across
operators. This consideration is important even for fully automated
procedures, which may be affected by operator-related sources of
variation, such as sample handling.
For each sample, process five replicates in a single run, on each of five or
more days. These need not be consecutive calendar days, nor is it essential
that all samples be processed in the same runs or even on the same days.
In each run, include QC materials with predetermined criteria for accepting
or rejecting the run, if they are available.
For procedures that require sample processing before analysis (eg,
extraction or dilution), ensure that each replicate undergoes all steps in
the procedure, ie, the preprocessing as well as the subsequent analysis.
Do not simply preprocess a sample or aliquot once and then perform
replicate analyses on it. Perform the preprocessing as was done by the
manufacturer to establish the precision claims.
18
© Clinical and Laboratory Standards Institute. All rights reserved.
Volume 34
EP15-A3
2.3.3 Data Integrity
Examine all results each testing day—double-checking the entry of
extreme results—in orderto identify errors not reflective of expected
assay performance. If an entire run is flagged as bad by the assay system,
or if it is rejected by the internal QC criteria, discard all results forthat
run. After correcting for transcription errors, clear-cut sample mix-ups,
and the like, exclude any other results determined, ie, known, to have
arisen from non performance-related errors, such as the presence ofclots,
system processing errors, insufficient sample volume, etc. Do not rely on
presumption or speculation, and do not reject or repeat results merely
because they seem aberrant. Carefully document the circumstances
and reasons for the corrections, exclusions, missing values, and repeats,
account!ng for aII runs and all replicates.
If the new results can be considered part of the same "run," individual
results identified as missing or erroneous may immediately be repeated.
Otherwise, schedule additional runs as needed in order to ensure that the
overall minimal requirements for the final dataset are met or exceeded.
For each sample, there must be results from at least five runs and the total
number of individual results minus the number of runs must be no less
than 18, but preferably 19 or more. Decisions to extend the duration of the
study may be made even after the study is started.
2.3.4 Data Analysis for Individual Samples
NOTE: This section assumes that the user's experiment conforms to the
basic 5 x 5 design, with possibly one ortwo additional runs, and that the
calculations are being performed using one-way ANOVA software. For
other designs, consult Appendix B, and/or use comprehensive statistical
software such as CLSI's StatisPro.2
О IMPORTANT NOTE:
Do not rely on presumption
or speculation, and do not
reject or repeat results merely
because they seem aberrant.
Carefully document the
circumstances and reasons
for the corrections, exclusions,
missing values, and repeats,
accounting for all runs and all
replicates.
Once the experimental work is completed and checked for data
integrity, analyze the results for each sample as follows:
► Tabulate the results.
► Inspect the results for discordant values; if discordant values are
found, test for outliers.
► Calculate estimates for repeatability and within-laboratory
imprecision.
► Compare these estimates to their corresponding precision claims
© Clinical and Laboratory Standards Institute. All rights reserved.
19
Number 12
EP15-A3
Tabulation and Inspection of Results
The best way to tabulate the dataset for each sample can de pend in part
on the input format expected by the ANOVA software. Table 2 (left table)
shows oneway to list the data. The results are from the ferritin worked
example in Section 2.3.10, which follows the basic 5x5 design.
Table 2. Ferritin Example: Raw Data Listing (Left); Simple Tally, by Run (Right)
Pg/L Run 1 Run 2 Run 3 Run 4 Run 5
Rep 1 140 140 140 141 139
Rep 2 139 143 138 144 140
Rep 3 138 141 136 142 141
Rep 4 138 143 141 143 138
Rep 5 140 137 136 144 141
Abbreviation: rep, replicate.
Pg/L Run 1 Run 2 Run 3 Run 4 Run 5
136 XX
137 X
138 XX X X
139 X X
140 XX X X X
141 X X X XX
142 X
143 XX X
144 XX
Inspection of the raw data listing shows no missing values. The dataset is
said to be balanced, because every run has the same number of results.
If the number of results per run was varied due to missing values or
results suppressed as statistical outliers, the dataset would be said to be
unbalanced.
It is useful to visualize the distribution of results in order to inspect for
individual values or entire runs that are highly discordant relative to the
bulk of the data. Table 2 (right table) illustrates one of many ways to
visualize this distribution: a simple manual tally. Other approaches such
as plots or simple sorted lists may be more readily implemented with a
spreadsheet. For this example, the tally in Table 2 (right table) shows no
apparent outliers and reasonable consistency from run to run in the scatter
of values.
After correcting typographical errors and the like, proceed directly to the
calculations to estimate imprecision (see Section 2.3.5) with all bona fide
data available, ski ppi ng the discuss ion of forma I outlier tests (see Section
2.3.4.1). At this stage, do not remove any measurements as statistical
outliers from the analysis; an analysis based on all the data, with no points
excluded, will be required in any case. If the precision verification test
passes, no outlier-related calculations will be necessary. If the precision
verification test fails, a nd the dataset includes a highly discordant
measurement, then apply the formal test described in Section 2.З.4.1. If,
and only if, the measurement qualifies as an outlier by that test, repeat the
calculations in order to estimate imprecision, omitting the discordant result.
20
© Clinical and Laboratory Standards Institute. All rights reserved.
Volume 34
EP15-A3
23.4.1 Potential Outliers
Even after co erecting or excluding all results known to be spurious (see
Section 2.3.3), a result may stand out as discordantly high or low. This
might be due to a nonperformance-related cause, which, if known, would
have justified excluding the result. Alternatively, the apparently extreme
result might genuinely represent the assay's measurement procedure
performance and would not be so discordant if viewed in the distribution
of results from a larger study. The trade-off is that retaining an apparent
outlier risks calculating inflated imprecision estimates, while excluding it
risks calculating unduly optimistic estimates.
This guideline allows for treating such highly discordant results as
"statistical outliers" but imposes certain conditions to ensure objectivity:
► At most, one result per sample may be treated as a statistical outlier.
► The result must qualify as an outlier by a suitable test (eg, the
Grubbs' test described in Section 2.3.4.2).
► At most, two results may be treated as statistical outliers across all
samples in the full study.
When a result is to be treated as a statistical outlier, good practice calls
for analyzing the sample's data twice: both before and after excluding
the result. If multiple outliers are observed—mo re than one for a given
sample, or more than two in the entire study—the user should consider
repeating the entire precision verification study and/or contacting the
rn a n ufact u re r fo r s u p po rt.
NOTE: Even if a result formally qualifies as a statistical outlier, it does not
have to be treated as such if the practical outcome of its presence does
not affect the outcome of the verification study. If the suspected outlier
must be removed in orderforthe procedure's imprecision (seediscussion
of bias in Chapter 3) to be acceptable, it is good practice to perform the
calculations with the suspected outlier included, as well as without it.
Assess the clinical effect of the suspected outlier, and investigate further
to try to determine the cause of the suspected outlier. The handling of
any suspected outlier must be documented in the evaluation report for
the laboratory director's review.
О IMPORTANT NOTE:
Retaining an apparent outlier
risks calculating inflated
imprecision estimates, while
excluding it risks calculating
unduly optimistic estimates.
О IMPORTANT note:
The handling of any suspected
outlier must be documented in
the evaluation report for the
laboratory director's review.
© Clinical and Laboratory Standards Institute. All rights reserved.
21
Number 12
EP15-A3
23.4.2 Grubbs’ Test for Outliers
Although any suitable test may be used tojustify treating a result as a
statistical outlier, this guideline recommends a version of the Grubbs'
test.22'23 In this approach, a result qualifies as a statistical outlier if, and
only if, it lies more than G SDs from the sample mean, where:
► The mean and SDare based upon all N results for the sample,
including the suspected outlier.
► The G ru b bs' facto xG (which de pends on N) comes from Table 3.
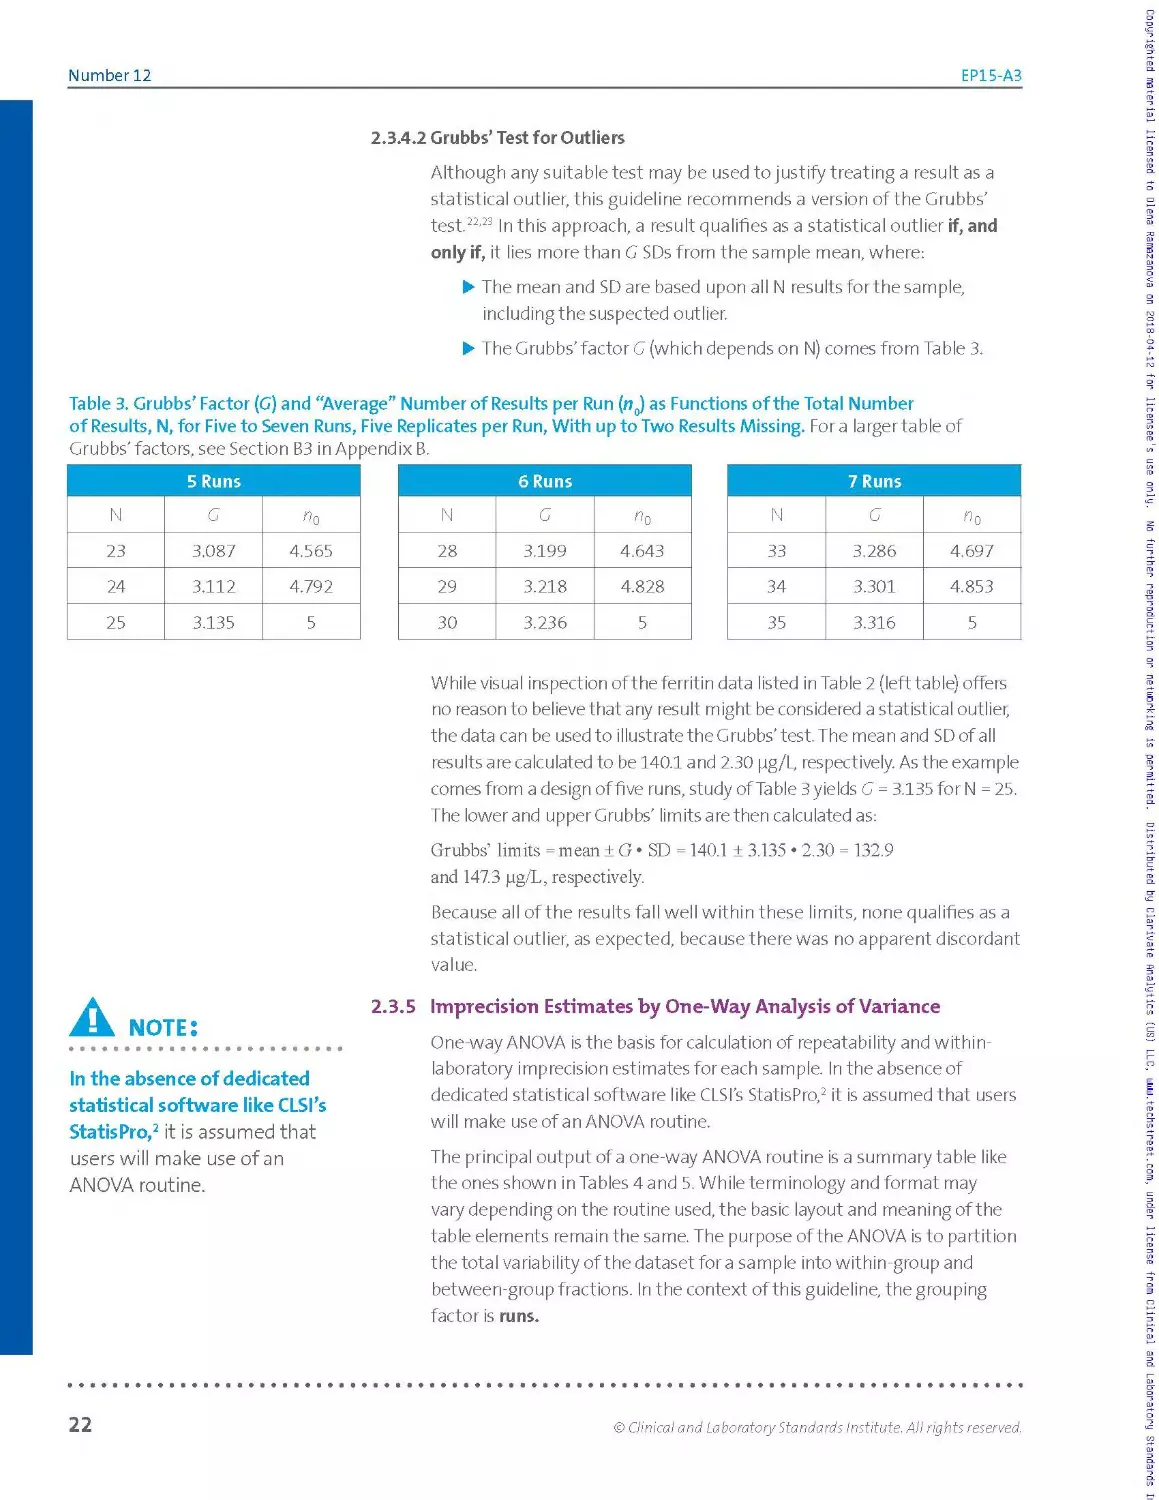
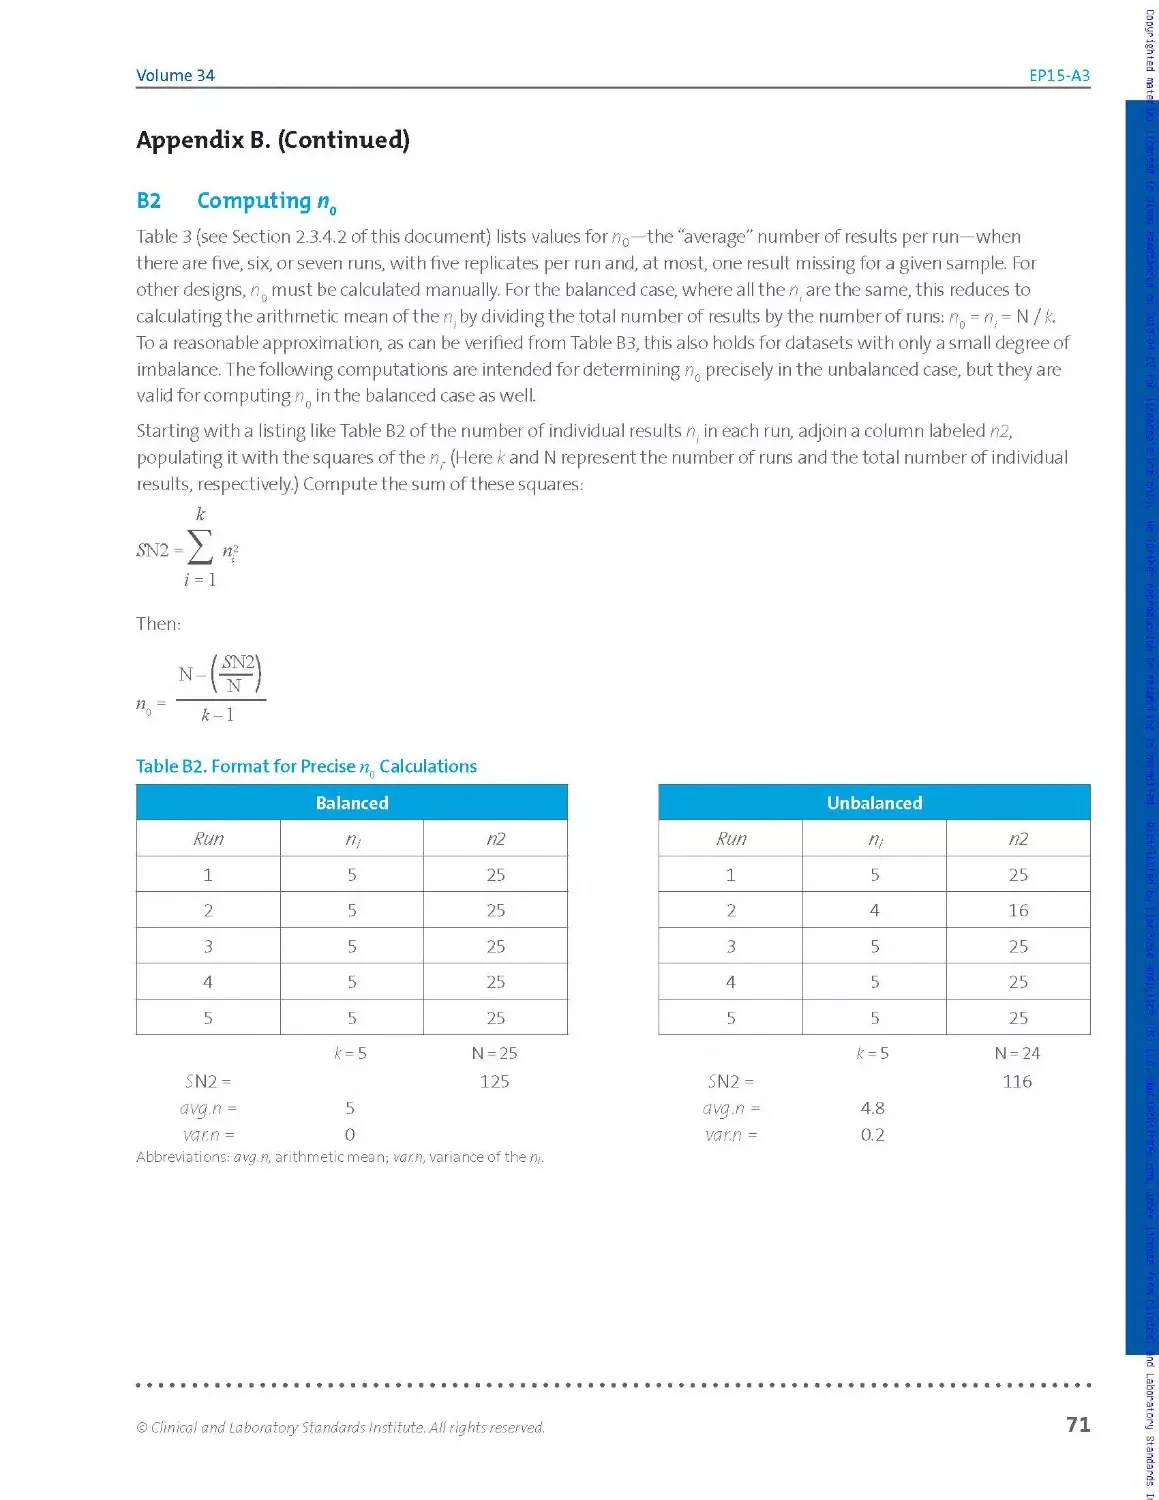
Table 3. Grubbs’ Factor (G) and “Average” Number of Results per Run (n0) as Functions of the Total Number
of Results, N, for Five to Seven Runs, Five Replicates per Run, With up to Two Results Missing. Fora larger table of
Grubbs’ factors, see Section B3 in Appendix B.
5 Runs
N G «6
23 3.087 4.565
24 3.112 4.792
25 3.135 5
6 Runs
N G «0
28 3.199 4.643
29 3.218 4.828
30 3.236 5
7 Runs
N G ^0
33 3.286 4.697
34 3.301 4.853
35 3.316 5
While visual inspection of the ferritin data listed in Table 2 (left table) offers
no reason to believe that any result might be considered a statistical outlier,
the data can be used to illustrate the Grubbs’test. The mean and SDofall
results are calculated to be 140.1 and 2.30 pg/L, respectively. As the example
comes from a design of five runs, study of Table 3 yields G = 3.135 for N = 25.
The lower and upper Grubbs' limits a re then calculated as:
Grubbs’ limits = mean ± G • SD = 140.1 ± 3.135 ♦ 2.30 = 132.9
and 147.3 pg/L, respectively.
Because all of the results fall well within these limits, none qualifies as a
statistical outlier, as expected, because there was no apparent discordant
value.
A note:
♦ ••••••••♦«••••••♦•••••I
In the absence of dedicated
statistical software like CLSI’s
StatisPro,2 it is assumed that
users will make use of an
ANOVA routine.
2.3.5 Imprecision Estimates by One-Way Analysis of Variance
One-way ANOVA is the basis for calculation of repeatability and within-
laboratory imprecision estimates for each sample. In the absence of
dedicated statistical software like CLSI’s StatisPro,2 it is assumed that users
will make use of an ANOVA routine.
The principal output of a one-way ANOVA routine is a summary table like
the ones shown in Tables 4 and 5. While terminology and format may
vary depending on the routine used, the basic layout and meaning of the
table elements remain the same. The purpose of the ANOVA is to partition
the total variability of the dataset for a sample into within-group and
between-group fractions. In the context of this guideline, the grouping
factor is runs.
Copyrighted material licensed to Olena Ramazanova on 2018-04-12 for licensee's use only. No further reproduction or networking is permitted. Distributed by Clarivate Analytics (US) LLC, www.techstreet.com, under license from Clinical and Laboratory Standards
22
© Clinical and Laboratory Standards Institute. All rights reserved.
Volume 34
EP15-A3
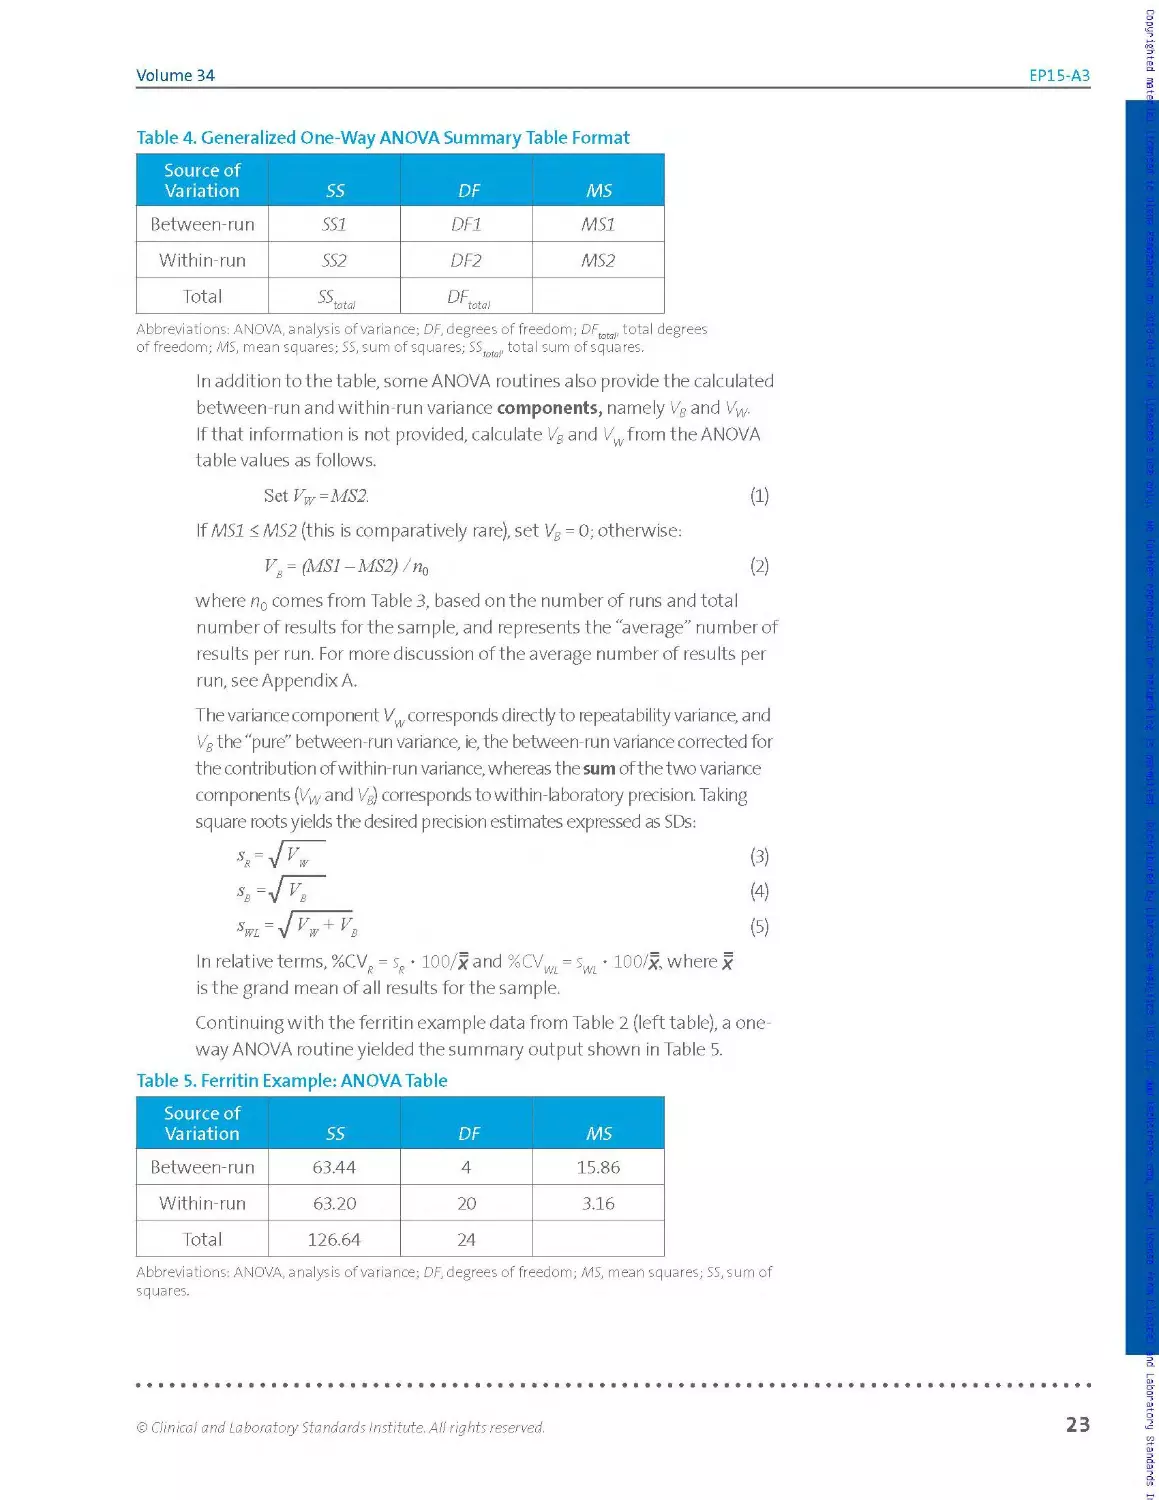
Table 4. Generalized One-Way ANOVA Summary Table Format
Source of Variation SS DF MS
Between-run SSI DF1 MSI
Within-run SS2 DF2 MS2
Total SS 'Mota! DF... tot a!
Abbreviations: ANOVA, analysis of variance; DF, degrees of freedom; DFtotal, total degrees
of freedom; MS, mean squares; SS, sum of squares; SS r total sum of squares.
In addition to the table, some ANOVA routines also providethe calculated
between-run and within-run variance components, namely Vs and Vw.
If that information is not provided, calculate VB and Vwfrom the ANOVA
table values as follows.
3tiVw=MS2. (1)
If MSI < MS2 (this is comparatively rare), set VB = 0; otherwise:
v8 = (MSI -MS2) /пй (2)
where n0 comes from Table 3, based on the number of runs and total
n u m be r of res u Its for the sa m p le, a nd re p rese nts t he' a ve rage" n u m ber of
results per run. For more discussion of the average number of results per
run, see Appendix A.
The variance component Vw corresponds directly to repeatability variance, and
V8 the "pure" between-run variance, ie, the between-run variance corrected for
the contribution of within-run variance, whereas the sum of the two variance
components (Vwand V8) corresponds to within-laboratory precision. Taking
square roots yields the desired precision estimates expressed as SDs:
In relative terms, %CV? = sR • 100/x and %CVWi = • 100/x, where x
is the grand mean of a II results for the sample.
Continuing with the ferritin example data from Table 2 (left table), a one-
way ANOVA routine yielded the summary output shown in Table 5.
Table 5. Ferritin Example: ANOVA Table
Source of Variation SS DF MS
Between-run 63.44 4 15.86
Within-run 63.20 20 3.16
Total 126.64 24
Abbreviations: ANOVA, analysis of variance; OF, degrees of freedom; MS, mean squares; 55, sum of
squares.
© Clinical and Laboratory Standards Institute. All rights reserved.
23
Number 12
EP15-A3
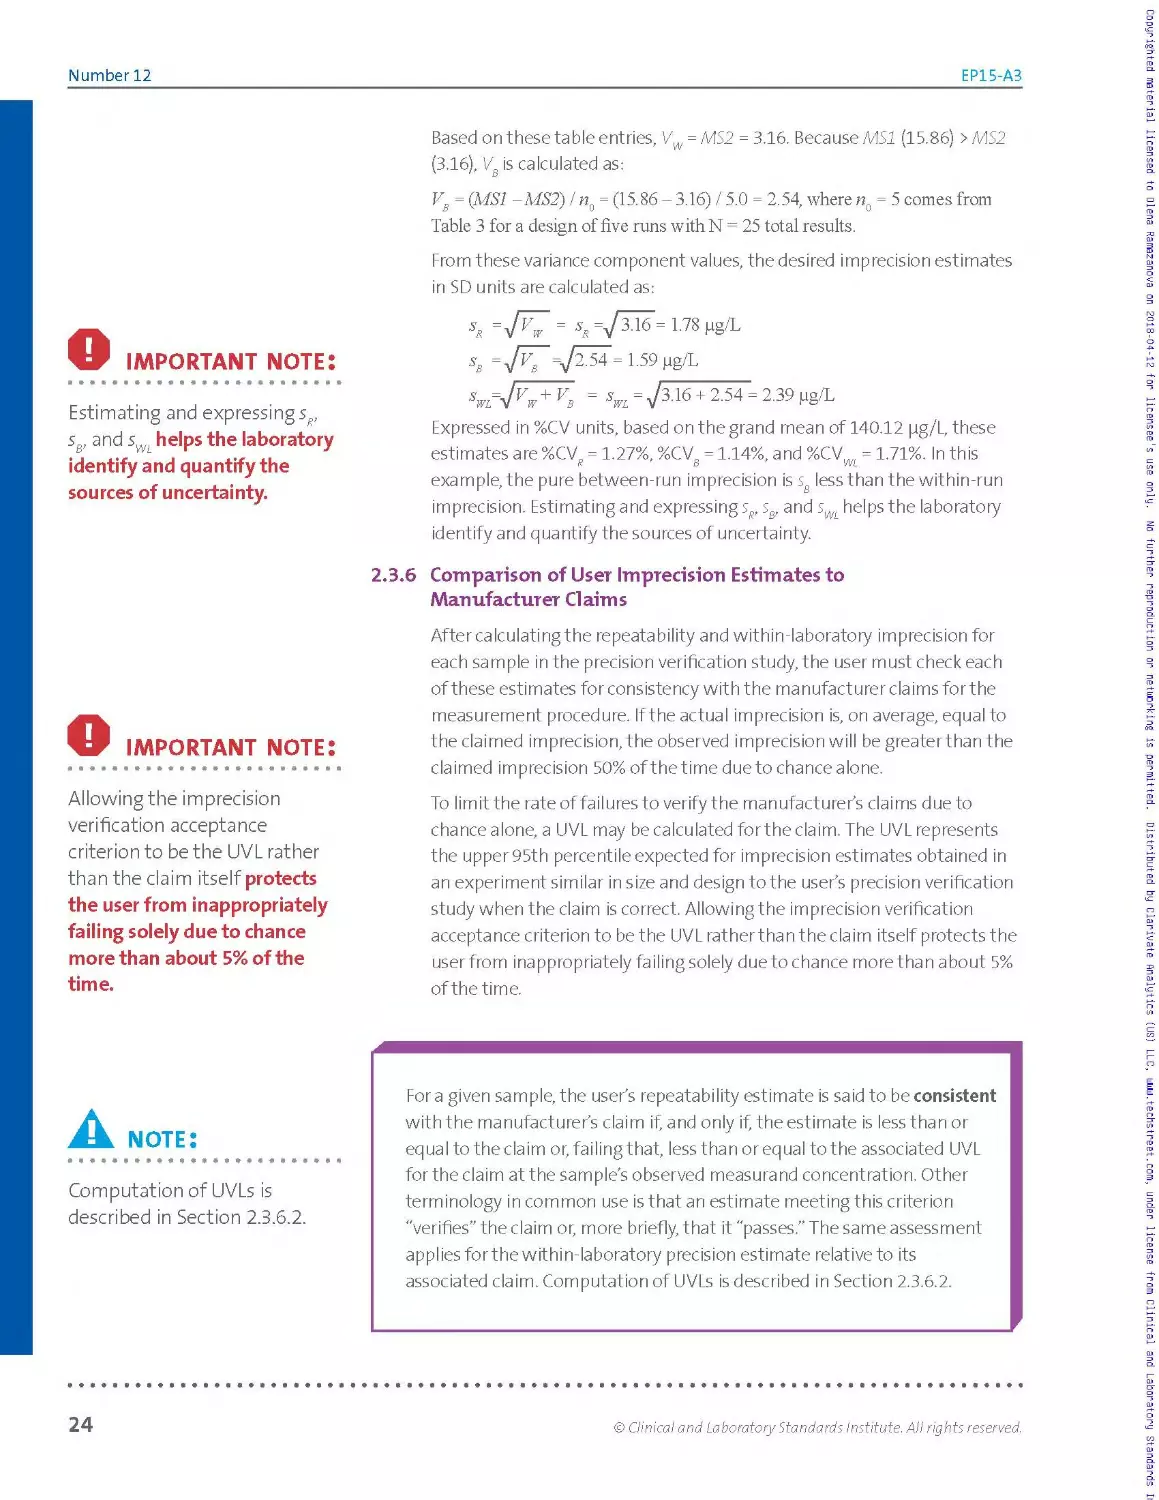
Based on these table entries, VW = MS2 = 3.16. Because MSI (15.86) >MS2
(3.16), VB is calculated as:
Vs = (MSI -MS2) / n() = (15.86 - 3.16) / 5.0 = 2.54, where n() = 5 comes from
Table 3 for a design of five runs with N = 25 total results.
From these variance component values, the desired imprecision estimates
in SD units are calculated as:
О IMPORTANT note:
Estimating and expressing sR,
sB, and sWL helps the laboratory
identify and quantify the
sources of uncertainty.
sx = JaS = ss=/3^6 = 1.78pg/L
s, LS9 g8/L
5 = -7316 + 254 - 2 39
Expressed in %CV units, based on the grand mean of 140.12 pg/L, these
estimates are %CV? = 1.27%, %CVg = 1.14%, and %CVW. = 1.71%. In this
example, the pure between-run imprecision is sg less than the within-run
imprecision. Estimating and expressing s?, ss, and sWL helps the laboratory
identify and quantify the sources of uncertainty.
2.3.6 Comparison of User Imprecision Estimates to
Man ufactur er Cl aim s
О IMPORTANT note:
Allowing the imprecision
verification acceptance
criterion to be the UVL rather
than the claim itself protects
the user from inappropriately
failing solely due to chance
more than about 5% of the
time.
After calculating the repeatability and within-laboratory imprecision for
each sample in the precision verification study, the user must check each
of these estimates for consistency with the manufacturer claims for the
measurement procedure. If the actual imprecision is, on average, equal to
the claimed imprecision, the observed imprecision will be greater than the
claimed imprecision 50% of the time due to chance alone.
To limit the rate of failures to verify the manufacturer’s claims due to
chance alone, a UVL may be calculated for the claim. The UVL represents
the upper 95th percentile expected for imprecision estimates obtained in
an experiment similar in size and design to the user’s precision verification
study when the claim is correct. Allowing the imprecision verification
acceptance criterion to be the UVL rat her than the claim itself protects the
user from inappropriately failing solely due to chance more than about 5%
of the time.
A. note:
Computation of UVLs is
described in Section 2.3.6.2.
Fora given sample, the user’s repeatability estimate is said to be consistent
with the manufacturer's claim if, and only if, the estimate is less than or
eq ua I to the cla im оr, fai Iing that, less tha n оr eq uaI to t he associated UVL
for the claim at the sample’s observed measurand concentration. Other
terminology in common use is that an estimate meeting this criterion
"verifies” the claim or, more briefly, that it "passes.” The same assessment
applies for the within-laboratory precision estimate relative to its
associated claim. Computation of UVLs is described in Section 2.3.6.2.
24
© Clinical and Laboratory Standards Institute. All rights reserved.
Volume 34
EP15-A3
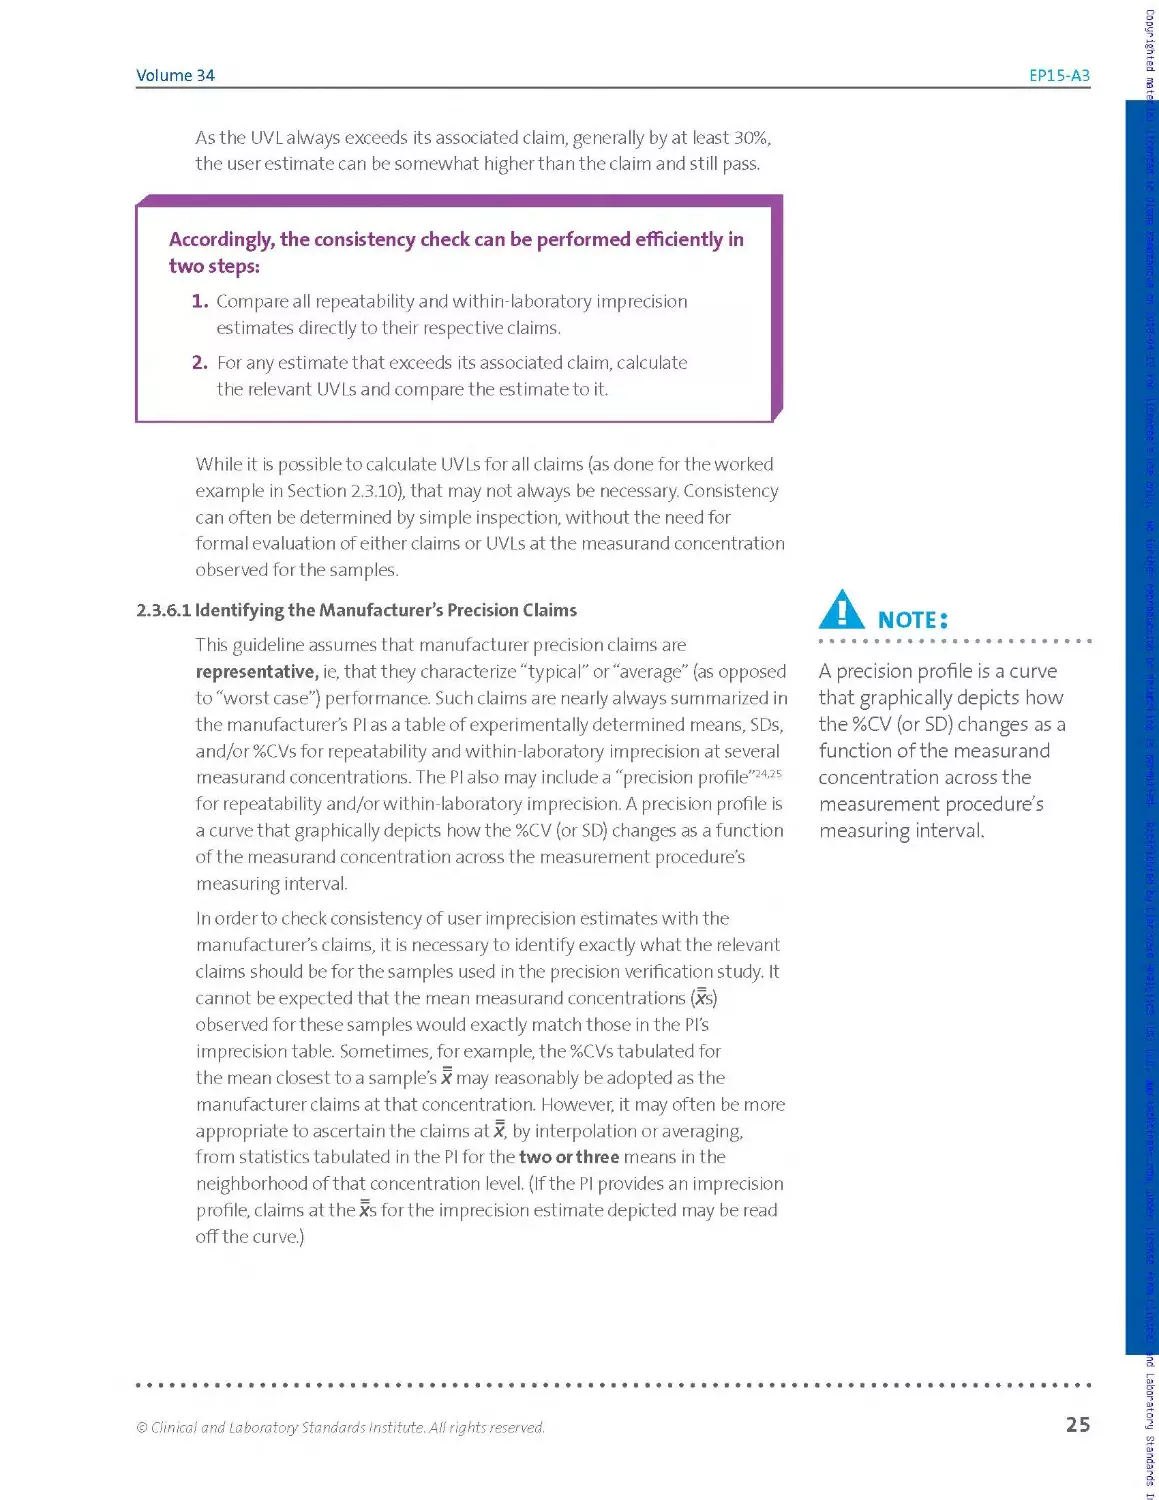
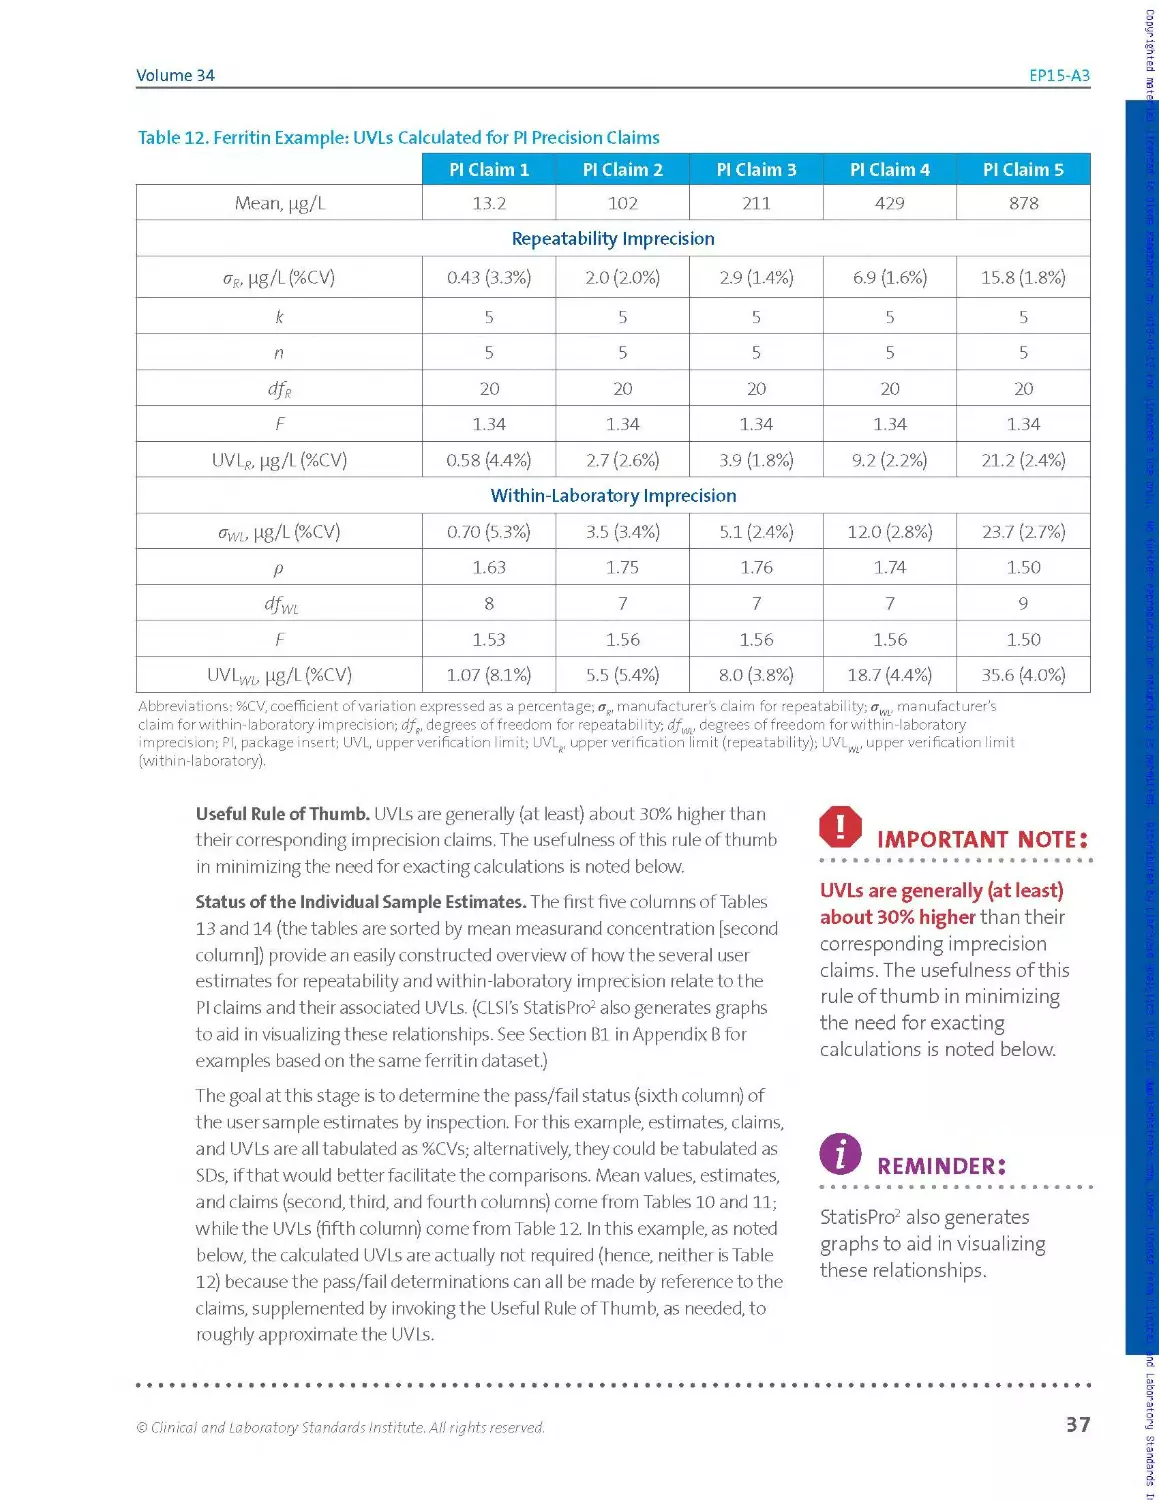
As the UVL always exceeds its associated claim, generally by at least 30%,
the user estimate can be somewhat higher than the claim and still pass.
Accordingly, the consistency check can be performed efficiently in
two steps:
1. Compare all repeatability and within-laboratory imprecision
estimates directly to their respective claims.
2. For any estimate that exceeds its associated claim, calculate
the relevant UVLs and compare the estimate to it.
While it is possible to calculate UVLs for all claims (as done for the worked
example in Section 2.3.10), that may not always be necessary. Consistency
can often be determined by simple inspection, without the need for
formal evaluation of either claims or UVLs at the measurand concentration
observed for the samples.
23.6.1 Identifying the Manufacturer’s Precision Claims
This guideline assumes that manufacturer precision claims are
representative, ie, that they characterize "typical" or "average” (as opposed
to "worst case”) performance. Such claims are nearly always summarized in
the manufacturer's Plasa table of experimentally determined means, SDs,
and/or %CVs for repeatability and within-laboratory imprecision at several
measurand concentrations. The PI also may include a "precision profile”24'25
for repeatability and/or within-laboratory imprecision. A precision profile is
a curve that graphically depicts how the %CV (or SD) changes as a function
of the measurand concentration across the measurement procedure’s
measuring interval.
In order to check consistency of user imprecision estimates with the
manufacturer's claims, it is necessary to identify exactly what the relevant
claims should be for the samples used in the precision verification study. It
cannot be expected that the mean measurand concentrations (xs)
observed for these samples would exactly match those in the Pl’s
imprecision table. Sometimes, for example, the %CVs tabulated for
the mean closest to a sample’s x may reasonably be adopted as the
manufacturer claims at that concentration. However, it may often be more
appropriate to ascertain the claims atx, by interpolation or averaging,
from statistics tabulated in the PI for the two or three means in the
neighborhood of that concentration level. (If the PI provides an imprecision
profile, claims at the xs for the imprecision estimate depicted may be read
off the curve.)
A. note:
A precision profile is a curve
that graphically depicts how
the %CV (or SD) changes as a
function of the measurand
concentration across the
measurement procedures
measuring interval.
© Clinical and Laboratory Standards Institute. All rights reserved.
25
Number 12
EP15-A3
23.6.2 Performing the Comparisons
If an imprecision estimate does not exceed the corresponding claim, it
meets the consistency criterion. The user estimate passes and directly
verifies the manufacturer’s claims.
If an estimate does exceed the manufacturer’s claim, the user should
implement the second part of the consistency check and compare the
estimate to the corresponding UVLforthat claim.
A three-step table look-up approach to calculating UVLs is
described as follows.
1. Determine the degrees of freedom, df, for the type of imprecision
estimate inquestion (dfR for repeatability or dfWL for within-
laboratory imprecision).
2. Determine the UVL factor f from Table 7.
3. Calculate the UVLfrom the UVLfactor/7and the manufacturer
claim.
Compare estimated imprecision with UVL.
Degrees of Freedom
For a repeatability comparison, calculate the degrees of freedom, dfR,
directly as dfR = N - k, where N is the total number of results and к is the
number of runs.
For a within-laboratory imprecision comparison, first calculate the claims
ratio,/?, rho at the test sample average concentration x as:
P = °wJ °R = °/oCVWL I %CVS’ (6)
which is the manufacturer’s within-laboratory imprecision claim divided
by the manufacturer’s repeatability claim, either expressed in SD units or
in %CV units. Then, determine the approximate degrees of freedom,
from Table 6. Select the column representing the number of runs in the
precision verification study for the particular test sample, scan down the
table entries to find thep value that most closely matches the calculated
value, and then read off the associated dfWL value.
26
© Clinical and Laboratory Standards Institute. All rights reserved.
Volume 34
EP15-A3
Table 6. dfWL as a Function of the Claims Ratio (p = / сгД for Five to Seven Runs, Five Replicates per Run
5 Runs
P dfwL
2.74 5
2.06 6
1.78 7
1.62 8
1.51 9
1.43 10
1.37 11
1.32 12
1.28 13
1.24 14
1.21 15
1.19 16
1.16 17
1.14 18
1.12 19
1.10 20
1.08 21
1.05 22
1.03 23
1.00 24
6 Runs
dfwL
3.02 6
2.25 7
1.93 8
1.74 9
1.62 10
1.52 11
1.46 12
1.40 13
1.35 14
1.32 15
1.28 16
1.25 17
1.23 18
1.20 19
1.18 20
1.16 21
1.14 22
1.12 23
1.11 24
1.09 25
1.07 26
1.05 27
1.03 28
1.00 29
7 Runs
P dfwL
3.27 7
2.42 8
2.06 9
1.85 10
1.71 11
1.61 12
1.54 13
1.48 14
1.42 15
1.38 16
1.35 17
1.31 18
1.29 19
1.26 20
1.24 21
1.22 22
1.20 23
1.18 24
1.16 25
1.14 26
1.13 T1
1.11 28
1.10 29
1.08 30
1.07 31
1.05 32
1.03 33
1.00 34
Abbreviations: a , manufacturer's claim for repeatability; cr manufacturer's claim for within-
laboratory imprecision; dfWL, degrees of freedom for within-laboratory imprecision.
© Clinical and Laboratory Standards Institute. All rights reserved.
27
Number 12
EP15-A3
Upper Verification Limit
Using the degrees of freedom, df = dfR or df= dfWL, as appropriate,
determine the UVL factor/7 from Table 7 at the entry corresponding to the
intersection of the djwith the total number of test samples used in the
entire precision verification study.
Finally, calculate the UVLas the UVL factor Ftimes the relevant claim, with
the claim expressed, as needed for the comparison, either as an SD (cr =
or a = a J or as a %CV (%CV = %CVP or %CV = %CVj:
UVL = F ♦ a or UVL = F • %CV (7)
Copyrighted material licensed to Olena Ramazanova on 2018-04-12 for licensee's use only. No further reproduction or networking is permitted. Distributed by Clarivate Analytics (US) LLC, www.techstreet.com, under license from Clinical and Laboratory Standards
28
© Clinical and Laboratory Standards Institute. All rights reserved.
Volume 34
EP15-A3
Table 7. UVL Factors (F) as a Function of DF and Number of Samples (One to Six) in the Experiment
Number of Samples
DF 1 2 3 4 5 6
5 1.49 1.60 1.66 1.71 1.74 1.76
6 1.45 1.55 1.61 1.65 1.67 1.70
7 1.42 1.51 1.56 1.60 1.62 1.65
8 1.39 1.48 1.53 1.56 1.58 1.60
9 1.37 1.45 1.50 1.53 1.55 1.57
10 1.35 1.43 1.47 1.50 1.52 1.54
11 1.34 1.41 1.45 1.48 1.50 1.52
12 1.32 1.39 1.43 1.46 1.48 1.49
13 1.31 1.38 1.42 1.44 1.46 1.47
14 1.30 1.37 1.40 1.42 1.44 1.46
15 1.29 1.35 1.39 1.41 1.43 1.44
16 1.28 1.34 1.38 1.40 1.41 1.43
17 1.27 1.33 1.36 1.39 1.40 1.41
18 1.27 1.32 1.35 1.37 1.39 1.40
19 1.26 1.31 1.34 1.36 1.38 1.39
20 1.25 1.31 1.34 1.36 1.37 1.38
21 1.25 1.30 1.33 1.35 1.36 1.37
22 1.24 1.29 1.32 1.34 1.35 1.36
23 1.24 1.29 1.31 1.33 1.35 1.36
24 1.23 1.28 1.31 1.32 1.34 1.35
25 1.23 1.28 1.30 1.32 1.33 1.34
26 1.22 1.27 1.30 1.31 1.32 1.34
27 1.22 1.26 1.29 1.31 1.32 1.33
28 1.22 1.26 1.28 1.30 1.31 1.32
29 1.21 1.26 1.28 1.30 1.31 1.32
30 1.21 1.25 1.27 1.29 1.30 1.31
31 1.20 1.25 1.27 1.29 1.30 1.31
32 1.20 1.24 1.27 1.28 1.29 1.30
33 1.20 1.24 1.26 1.28 1.29 1.30
34 1.20 1.24 1.26 1.27 1.28 1.29
Abbreviations: DF, degrees of freedom; UVL, upper verification limit.
© Clinical and Laboratory Standards Institute. All rights reserved.
29
Number 12
EP15-A3
.A note:
• •♦•••♦•••••••••♦•••♦••в
Because of the limited
sample size, these statistical
procedures are subject to false
passes, and false failures.
2.3.7 Interpreting Precision Verification Results
After aII data analyses and consistency checks are complete, the user will
have:
► Repeatability and within-laboratory imprecision estimates for each
test sample in the study
► Results of the consistency checks (pass or fail) for each of these
imprecision estimates
The final task is to assess the results of all consistency checks across all
samples in the precision verification study. If all results are within the
verification limits, the user precision is consistent with the manufacturer's
claims. (NOTE: Because of the limited sample size, these statistical
procedures are subject to false passes, and false failures.)
There are three principal scenarios:
► Scenario 1A: All estimates passed a nd were nea r or below the
corresponding claims or UVLs. The overall study is consistent with the
claims, and the data demonstrate that imprecision in the user's laboratory
is comparable to what the manufacturer claims.
Scenario IB: All estimates passed, but some passed just barely a nd t he
distribution of results suggests that the imprecision exhibited in the user's
laboratory could exceed the manufacturer claims, either overall or in a
region of the stated measuring interval. Nevertheless, the study as a whole
is statistically consistent with the claims. Due to the presence of results
close to the UVL, however, daily QC results should be monitored carefully to
ensurethat the procedure's imprecision remains consistent with the claims.
► Scenario 2: Most estimates passed, but there were failures. The laboratory
director should review the study as a whole in order to determine whether
or not the procedure's imprecision, while apparently not fully consistent with
the manufacturer claims, is still acceptable for use. Ifso, when signing off on
the study, the director should include a rationale forthe acceptability of the
procedures precision performance, and the imprecision exhibited by daily
QC results should be carefully monitored.
► Scenario 3: Several estimates failed. The study as a whole is not consistent
with the claims. The laboratory has several options. Besides rejecting the
procedure outright, it may opt to troubleshoot the assay, perhaps with
assistance from the manufacturer, and then repeat the entire precision
verification study. Alternatively, the laboratory may opt to perform a larger
study, using an experimental design consistent with recommendations in
CLSI document EPO5,1 in orderto characterize the procedure's imprecision
performance with greater rigor.
30
© Clinicci! and Laboratory Standards Institute. All rights reserved.
Volume 34
EP15-A3
2.3.8 Postverification Considerations
After the precision verification study is successfully completed and the
procedure is put into routine operation, internal QC results often serve as
the principal source of feed back of ongoing procedure precision (unless
patient samples are regularly processed in duplicate or frequently repeated
as described in CLSI document C2421).
Assigned QC limits should be in agreement with the manufacturer claims
and the verification study’s estimates for within-laboratory imprecision.
The precision verification study yields estimates of within-laboratory
imprecision over the course of approximately just one week, whereas
monitoring results from testing control materials over longer periods
yields estimates fora timeframe more similar to that within which
the manufacturer’s claims were likely established. Indeed, statistics
accumulated daily from testing control materials overtime represent
independent estimates of within-laboratory imprecision if the controls are
processed in singlicate.
Overtime, however, it is possible that imprecision estimates based on daily
QC results may exceed the manufacturer’s claims. This may reflect the
presence of additional sources of variation that were not accounted for in
the original precision study, such as reagent or calibrator lot changes, major
maintenance events, changes in reagent stability, changes to laboratory
environmental factors, effect of new operators or preexamination
(preanalytical) factors, and so on.
2.3.9 Some Possible Causes of Poor Performance or Failures
The UVLfactors in Table 7 were constructed to maintain a 95% confidence
level, hence a 5% false rejection rate, independent of the number of
samples used in the study. Thus, for a given set of samples and precision
type, the probability of a failure due to chance should be one in 20. For
a given set of samples, the probability of failing due to chance for either
repeatability or within-laboratory imprecision could therefore approach
10%, but this depends on the degree to which the two imprecision
estimates are correlated, as well as other considerations.
Poor results in the precision verification study may reflect inadequate
technique in performing the procedure or in managing systems
components associated with the procedure.
о IMPORTANT note:
Statistics accumulated
daily from testing control
materials overtime represent
independent estimates of
within-laboratory imprecision
if the controls are processed in
singlicate.
О IMPORTANT note:
Poor results in the precision
verification study may reflect
inadequate technique in
performing the procedure
or in managing systems
components associated with
the procedure.
© Clinical and Laboratory Standards Institute. All rights reserved.
31
Number 12
EP15-A3
Poor results may be caused by:
► I m proper storage of reagents I
► Improper handling of the reagents I
► Improper sample handling or stability issues I
► Matrix differences between the user's samples and those used by I
the manufacturer to develop the precision claim, eg, plasma vs I
non plasma liquid control materials I
► Poor pipetting technique, if the procedure requires manual pipetting I
► Substandard maintenance of the instrumentation used for the I
procedure I
► Testing environment in the user laboratory, such as temperature, I
humidity, electrical, or rad io frequency interference I
Any of these causes may increase the apparent variability of the procedure
in ways that do not reflect on the inherent variability of the procedure itself.
Advice from the manufacturer may help determine the source of poor
precision results.
If within-laboratory precision claims are verified while repeatability claims
are not, this outcome may reflect benign differences in the operational
definition of a "run." In particular, the manufacturer's repeatability estimates
may often arise from testing a pair of adjacent replicates, whereas the user’s
experimental design could involve a greater time frame.
This guideline assumes that the manufacturer’s precision claims accurately
represent the procedure's current performance; it a Iso assumes that the claims
are known without appreciable uncertainty. There is uncertainty associated
with the imprecision statistics tabulated in the PI. There is additional
uncertainty associated with extracting from the PI table claims for measurand
concentrations of the samples in the precision verification study, because the
guideline assumes that straightforward interpolation can provide accurate
estimates of imprecision at measurand levels other than those reported in the
PI. Hence, one or both of the claims used in analyzing that study, namely and
and their ratio,/?, may be somewhat in error.
The precision study tabulated in the procedure's PI may have been determined
from a less rigorous experiment involving fewer days than the classical CLSI
document EPO51 design. Within-laboratory imprecision estimates obtained
inthis mannerare less robust than those developed overthe minimum time
period specified for the classic experiment within CLSI document EPO5,1 which
calls for assaying each of several samples on at least 20 days, with two runs
per day, and two replicates per run.
Iffora given measurand concentration and precision type, the manufacturer's
claim is much betterthan the clinically allowable limit of variability, it can
happen that the user precision estimate likewise falls within this limit while
32
© Clinical and Laboratory Standards Institute. All rights reserved.
Volume 34
EP15-A3
exceeding the UVL calculated from the claim. In this situation, the laboratory
d irector may choose to accept the procedure's precision performance, even
though the precision verification study failed to verify the claim. This can lead
to the occurrence of Scenario 2, as described in Section 2.3.7.
Essentially, the same situation may arise if the PI includes both "worst-
case" and typical ("representative") claims. Fora given sample, one or both
of the user precision estimates may exceed the UVL calculated from the PI
typical performance table, but still fall within the limits claimed for worst-
case performance. It would be wise to consult with the manufacturer
because the precision verification study suggests that the results observed
by the user are incompatible with what the manufacturer presents as
representative precision performance for the procedure.
23.10 Worked Example: Serum Ferritin Procedure
To illustrate the entire process, from planning to final resolution, this
section works through a complete precision verification study. As noted below,
in order to provide a complete set of numerical examples suitable
for checking software results, more computations are provided than
necessary in this example to evaluate the data and determine the status
of the individual precision estimates.
Context, Study Design, Implementation. The study was performed by a
laboratory in the process of switchingfrom a manual procedure for ferritin
to a fully automated procedure with a measuring interval of 10 to 1000 pg/L.
The laboratory adopted the recommended 5x5 study design—five days,
five replicates per run—with all samples processed in a single run each day.
О IMPORTANT NOTE:
In order to provide a complete
set of numerical examples
suitable for checking software
results, more computations
are provided than necessary in
this example to evaluate the
data and determine the status
of the individual precision
estimates.
Due to the apparent dependency of precision on measurand concentration
and because both low and high deviations from "normal" are of clinical
interest for circulating ferritin, the laboratory opted to use three test samples.
Rather than rely on the manufacturer’s buffer-based controls, the laboratory
prepared samples by pooling and aliquotting remnant patient sera, providing
enough materia Is to a I low two additional runs (if needed) beyond the five
runs planned. Pooling based on results previously obtained with the manual
procedure yielded samples with mid-range and abnormally elevated levels and
a third level close to the lower reference limits, addressing the new procedure's
measuring interval while remaining within the interval spanned by the PI table.
Runs were scheduled for alternating morning and afternoon sessions, in order
to obtain data representative across shifts and operators, with manufacturer's
controls included in each run. Because the precision claims in the PI were
described as reflecting multiple calibration events, the laboratory decided
(after consultation with the manufacturer) to calibrate the procedure before
each run, even though the PI requires calibration only once per month.
Individual sample and QC results were reviewed on a daily basis immediately
afterthe completion of each run, and again (by a different reviewer) at the end
of the study, before the data analysis. No errors were noted, and there were no
missing results.
© Clinical and Laboratory Standards Institute. All rights reserved.
33
Number 12
EP15-A3
Raw Data. Table 8 lists the 25 results for each sample vertically in the order
in which they were generated, identified by run and replicate number. Figure
3 displays simple plots of these datasets, adequate for surveying both the
consistency of distributions from run to run and the consistency of individual
results relative to the bulk of the data for each sample. Only one point stands
out as potentially aberrant, ie, the third result obtained for Sample 1 (Run 1,
Replicate 3,30.2 pg/L). Figure 3 is an example of plotting the results of the
experiment; the user may choose anothertype of plot, such as connecting the
results in the sequence in which they were obtained.
Table 8. Raw Data for Tri-Level Ferritin Example: Results in
Order of Generation (units: pg/L)
Replicate Sample 1 Sample 2 Sample 3
Run
1 1 26.6 140 606
1 2 25.2 139 627
1 3 30.2 138 621
1 4 27.6 138 606
1 5 25.6 140 620
2 1 24.3 140 612
2 2 25.7 143 610
2 3 23.8 141 611
2 4 25.3 143 595
2 5 24.1 137 630
3 1 26.1 140 649
3 2 24.0 138 626
3 3 25.4 136 636
3 4 26.0 141 639
3 5 24.3 136 648
4 1 26.5 141 615
4 2 27.1 144 633
4 3 25.9 142 605
4 4 25.5 143 616
4 5 25.5 144 625
5 1 24.5 139 622
5 2 26.4 140 632
5 3 25.8 141 646
5 4 26.0 138 619
5 5 25.1 141 623
Figure 3. Results Plotted in Order of Generation
(units = pig/L)
Copyrighted material licensed to Olena Ramazanova on 2018-04-12 for licensee's use only. No further reproduction or networking is permitted. Distributed by Clarivate Analytics (US) LLC, www.techstreet.com, under license from Clinical and Laboratory Standards
34
© Clinical and Laboratory Standards Institute. All rights reserved.
Volume 34
EP15-A3
Table 9 summarizes the basic statistics needed in subsequent data
analyses for all samples, along with calculations relevant to identifying
individual results as statistical outliers by the Grubbs' test. Although only
Sample 1 required the Grubbs' test, the test was performed on all three
samples simply to provide additional illustrations of the calculations. The
"Sample Г" column provides statistics for Sample 1 after eliminating the
suspect point. This sample is an unbalanced dataset because not all runs
have the same number of results; the other samples are all balanced (five
runs of five replicates each).
Table 9. Ferritin Example: Basic Statistics and "Outlier” Limits (units: pg/L)
Sample 1 Sample 1* Sample 2 Samples
N 25 24 25 25
X (grand mean, pg/L) 25.7 25.5 140.1 622.9
SD, pg/L (%CV) 1.35 (5.2%) 0.99 (3.9%) 2.30 (1.6%) 14.1 (2.3%)
Lowest result, pg/L 23.8 23.8 136 595
Highest result, pg/L 30.2 27.6 144 649
Grubbs' lower limit, pg/L 21.48 N/A 132.9 578.7
Grubbs' upper limit, pg/L 29.92 N/A 147.3 667.1
* One result eliminated: Run 1, Replicate 3, 30.2 pg/L—a statistical outlier by the Grubbs' test (<x= 0.01).
Abbreviations: %CV, coefficient of variation expressed as a percentage; N/A, not applicable; SD, standard deviation.
The mean, SD, and %CV were calculated from all individual results for
each sample (N = 24 or 25, depending on the sample). The outlier limits
are calculated from the mean and SD using the Grubbs' factor G = 3.135
(read from Table 3 for N = 25). As shown in Table 9, the highest result
obtained for Sample 1 (30.2 pg/L) qualifies as a statistical outlier because
it exceeds the upper Grubbs' limit (29.92 pg/L). A value so many SDs from
the mean should occur less than 1% of the time due to chance alone; it is a
very unusual point. Deleting it here is consistent with the conditions given
in Section 2.3.4. Note that eliminating this point reduces the mean only
slightly but has a considerable effect on the SD and %CV.
ANOVA. Table 10 summarizes the computations leading to the imprecision
estimates for all samples. The between-run and within-run "mean
squares" (MSI and MS2, respectively) came from the summaries generated
by commercial one-way ANOVA software. The "average" number of results
per run, n0, came from Table 3; x is the grand mean previously computed
in Table 9. The between-run and within-run variance components (VB,
Уи/) and the repeatability and within-laboratory imprecision estimates (%
sWL, and the corresponding %CVs) were computed from the ANOVA table
values.
© Clinical and Laboratory Standards Institute. All rights reserved.
35
Number 12
EP15-A3
Table 10. Ferritin Example: ANOVA Results and Imprecision Estimates
pg/L Sample 1 Sample 1* Sample 2 Sample 3
N 25 24 25 25
MSI (between) 4.238 2.0851 15.86 626.56
MS2 (within) 1.3284 0.74137 3.16 113.52
"o 5 4.79 5 5
Vg (between) 0.58192 0.28052 2.54 102.61
Vw (within) 1.3284 0.74137 3.16 113.52
25.7 25.5 140.1 623
fe pg/L (%CV) 1.15 (4.5%) 0.86 (3.4%) 1.78 (1.3%) 10.7(1.7%)
Pg/L (%CV) 1.38 (5.4%) 1.01 (4.0%) 2.40 (1.7%) 14.7 (2.4%)
* One result was eliminated as a statistical outlier.
Abbreviations: %CV, coefficient of variation expressed as a percentage; ANOVA, analysis of variance; MS, mean squares; s, user estimate for
repeatability; sWL, user estimate for within-laboratory imprecision; Vg, variance between runs; Vw, variance within run.
PI Claims. Table 11 summarizes the manufacturer's imprecision table from
the ferritin procedure's PI.
Table 11. Ferritin Example: Imprecision Claims From the Manufacturer’s PI
Mean, pg/L Repeatability SD, pg/L (%CV) With in-Laboratory Imprecision, pg/L (%CV)
PI Claim 1 13.2 0.43 (3.3%) 0.70 (5.3%)
PI Claim 2 102 2.0 (2.0%) 3.5 (3.4%)
PI Claim 3 211 2.9 (1.4%) 5.1 (2.4%)
PI Claim 4 429 6.9 (1.6%) 12.0 (2.8%)
PI Claim 5 878 15.8 (1.8%) 23.7(2.7%)
Abbreviations: %CV, coefficient of variation expressed as a percentage; PI, package insert; SD, standard deviation.
UVLs. For most of the user estimates in this example, consistency with
the manufacturer claims—their "pass/faiT status—can be determined
by visual inspection without having to calculate more than a few UVLs.
Nevertheless, UVLs are provided for all of the PI claims to illustrate the
calculations involved.
The UVL calculations are summarized for this example in Table 12. For
repeatability, the degrees of freedom, dfR, are based on the design of the
user’s experiment—specifically, on the actual number of runs, к = 5, and
the intended number of replicates per run, n = 5. For within-laboratory
imprecision, however, the degrees of freedom, dfWL, depend not only on
the experimental design but also on the claims ratiop = awt IuR. After
determining/?, dfWL was obtained from Table 6. For both precision types, the
UVL, whether expressed as an SDorasa%CV, was calculated by multiplying
the corresponding claim by the UVL factor/7 obtained from Table 7 (using the
column for three samples in the user’s precision verification study).
36
© Clinical and Laboratory Standards Institute. All rights reserved.
Volume 34
EP15-A3
Table 12. Ferritin Example: UVLs Calculated for PI Precision Claims
PI Claim 1 PI Claim 2 PI Claim 3 PI Claim 4 PI Claim 5
Mean, pg/L 13.2 102 211 429 878
Repeatability Imprecision
aR, pg/L (%CV) 0.43 (3.3%) 2.0 (2.0%) 2.9 (1.4%) 6.9 (1.6%) 15.8 (1.8%)
к 5 5 5 5 5
n 5 5 5 5 5
dfR 20 20 20 20 20
F 1.34 1.34 1.34 1.34 1.34
UVL„, pg/L (%CV) 0.58 (4.4%) 2.7 (2.6%) 3.9 (1.8%) 9.2 (2.2%) 21.2 (2.4%)
Within-Laboratory Imprecision
От, pg/L (%CV) 0.70 (5.3%) 3.5 (3.4%) 5.1 (2.4%) 12.0 (2.8%) 23.7 (2.7%)
p 1.63 1.75 1.76 1.74 1.50
dfwL 8 7 7 7 9
F 1.53 1.56 1.56 1.56 1.50
UVLwl,pg/L(%CV) 1.07 (8.1%) 5.5 (5.4%) 8.0 (3.8%) 18.7 (4.4%) 35.6 (4.0%)
Abbreviations: %CV, coefficient of variation expressed as a percentage; aR, manufacturer's claim for repeatability; oWL, manufacturer's
claim for within-laboratory imprecision; dfR, degrees of freedom for repeatability; dfWL, degrees of freedom for within-laboratory
imprecision; PI, package insert; UVL, upper verification limit; UVLS, upper verification limit (repeatability); UVL , upper verification limit
(within-laboratory).
Useful Rule of Thumb. UVLs are generally (at least) about 30% higher than
their corresponding imprecision claims. The usefulness of this rule of thumb
in minimizing the need for exacting calculations is noted below.
Status of the Individual Sample Estimates. The first five columns of Tables
13 and 14 (the tables are sorted by mean measurand concentration [second
column]) provide an easily constructed overview of how the several user
estimates for repeatability and within-laboratory imprecision relate to the
PI claims and their associated UVLs. (CLSI's StatisPro2 also generates graphs
to aid in visualizing these relationships. See Section Bl in Appendix В for
examples based on the same ferritin dataset.)
The goal at this stage is to determine the pass/faiI status (sixth column) of
the user sample estimates by inspection. For this example, estimates, claims,
and UVLs are all tabulated as %CVs; alternatively, they could be tabulated as
SDs, if that would better facilitate the comparisons. Mean values, estimates,
and claims (second, third, and fourth columns) come from Tables 10 and 11;
while the UVLs (fifth column) come from Table 12. In this example, as noted
below, the calculated UVLs are actually not required (hence, neither is Table
12) because the pass/fail determinations can all be made by reference to the
claims, supplemented by invoking the Useful Rule of Thumb, as needed, to
roughly approximate the UVLs.
О IMPORTANT NOTE:
UVLs are generally (at least)
about 30% higher than their
corresponding imprecision
claims. The usefulness of this
rule of thumb in minimizing
the need for exacting
calculations is noted below.
О reminder:
StatisPro2 also generates
graphs to aid in visualizing
these relationships.
© Clinical and Laboratory Standards Institute. All rights reserved.
37
Number 12
EP15-A3
Table 13. Ferritin Example: Repeatability: User Sample Estimates, Expressed as %CVs, Merged With PI Claims and UVLs
pg/L Mean Estimate Claim UVL Status
PI Claim 1 13.2 3.3% 4.4%
Sample Г 25.5 3.4% Pass
Sample 1 25.7 4.5% - Fail-
PI Claim 2 102 2.0% 2.6%
Sample 2 140 1.3% Pass
PI Claim 3 211 1.4% 1.8%
PI Claim 4 429 1.6% 2.2%
Sample 3 623 1.7% Pass
PI Claim 5 878 1.8% 2.4%
* One result was eliminated as a statistical outlier.
Abbreviations: %CV, coefficient of variation expressed as a percentage; PI, package insert; UVL, upper verification limit.
Sample 1. With an observed mean (x) of just over 25 pg/L, this sample
might be regarded as sufficiently close to the 13.2 pg/L mean for PI
Claim 1 to warrant comparison to just that claim, on a "nearest neighbor"
basis. If so, the 3.4% repeatability estimate obtained after eliminating the
statistical outlier rates a pass because, even though slightly higher than
the 3.3% claim (invoking the Rule of Thumb here) it is well within 30% of
that claim. Arguably, however, the sample is better regarded as falling
in between the means for PI Claims 1 and 2 (and closer to the first claim
than the second), making interpolation the more appropriate evaluation
method. If so, the 3.4% repeatability estimate obtained for Sample 1
after eliminating the outlier again rates a pass, though perhaps just
barely, on interpolating between the UVLs calculated—or simply roughly
approximated by the Useful Rule of Thumb—for PI Claims 1 and 2.
(The 4.5% estimate obtained without eliminating the outlier fails, because
it exceeds both of the neighboring UVLs.)
Sample 2. The 1.3% repeatability estimate clearly passes because it is less
than any of the claims forthis precision type.
Sample 3.The 1.7% repeatability estimate (NOTE: no calculation
performed) falls in between the claims (1.6% and 1.8%) at bracketing
concentration levels, and it passes easily with respect to the calculated
or estimated UVLs for PI Claims 4 and 5.
38
© Clinical and Laboratory Standards Institute. All rights reserved.
Volume 34
EP15-A3
Table 14. Ferritin Example: Within-Laboratory Imprecision: User Sample Estimates, Expressed as %CVs, Merged With PI
Claims and UVLs
pg/L Mean Estimate Claim UVL Status
PI Claim 1 13.2 5.3% 8.1%
Sample Г 25.5 4.0% Pass
Sample 1 25.7 5.4% Pass
PI Claim 2 102 3.4% 5.4%
Sample 2 140 1.7% Pass
PI Claim 3 211 2.4% 3.8%
PI Claim 4 429 2.8% 4.4%
Sample 3 623 2.4% Pass
PI Claim 5 878 2.7% 4.0%
* One result was eliminated as a statistical outlier.
Abbreviations: %CV, coefficient of variation expressed as a percentage; PI, package insert; UVL, upper verification limit.
Sample 1. The 4.0% within-laboratory imprecision estimate obtained
after eliminating the statistical outlier falls well below PI Claim 1, namely
5.3%, and also below the average of the two claims, (5.3 + 3.4) / 2 = 4.35%,
on either side of the sample. So, the estimate passes, no matter whether
a nearest neighbor rule or an interpolation rule is regarded as more
appropriate. (Indeed, even the 5.4% estimate obtained without eliminating
the outlier passes, because it does not exceed the calculated UVLs for PI
Claims 1 and 2.)
Sample 2. The 1.7% within-laboratory imprecision estimate passes, being
less than any of the claims for this precision type.
Sample 3. The 2.4% within-laboratory imprecision estimate passes, being
less than the two neighboring claims (2.8% and 2.7%).
Conclusion. With the aberrant resuIt for Sample 1 justifiably treated
as a statistical outlier, the user estimates for repeatability and within-
laboratory imprecision pass for all three of the samples. Because all six
estimates pass individually, the precision verification study as a whole
also passes; that is, in aggregate, the estimates are consistent with the
manufacturer’s PI claims. Looking more closely at the data, one can see
that performance in the study at mid-range and elevated ferritin levels
appears entirely unproblematic (good confirmation of the claims), whereas
careful monitoring of precision at very low levels may be advisable.
© Clinical and Laboratory Standards Institute. All rights reserved.
39
Copyrighted material licensed to Olena Ramezanova on 2018-04-12 for licensee's use only. No further reproduction or networking is permitted. Distributed by Clarivate Analytics (US) LLC, www.techstreet.com, under license from Clinical and Laboratory Standards It
ЕР15-АЗ
Clinical and Laboratory Standards Institute. All rights reserved.
Chapter
Estimation of Bias
Concentrations
This chapter includes
cation interval c
ations
materials with known concentrations
target value, mean value, and standard
errors
Number 12
EP15-A3
© Estimation of Bias by Testing Materials
With Known Concentrations
3.1 Overview of the Bias Experiment
Bias is assessed by analyzing materials with known concentration—such as
PT materials and/or other reference standards—and comparing the results for
the measurement procedure under evaluation to the TVs. When materials of
this kind are also suitable for verifying precision, a single experiment can yield
estimates of both imprecision and bias. Figure 4 depicts a flow chart for the
experiment.
Abbreviations: ANOVA, analysis of variance; DF, degrees of freedom; SD, standard deviation; TV, target value.
Figure 4. Overview of the Estimation of Bias Using Materials With Known Concentrations (see Section 3.1)
Copyrighted material licensed to Olena Ramazanova on 2018-04-12 for licensee's use only. No further reproduction or networking is permitted. Distributed by Clarivate Analytics (US) LLC, www.techstreet.com, under license from Clinical and Laboratory Standards
42
© Clinical and Laboratory Standards Institute. All rights reserved.
Volume 34
EP15-A3
Before initiating the experiment, the user should specify the allowable
bias, as described in Chapter 1. Even if the bias observed in this experiment
is statistically significant, it may still be clinically acceptable. This can be
determined by comparison with the allowable bias limits.
О reminder:
This section describes a process, involving repeated measurements of
materials ("reference materials") with known concentrations, herein
called its TV, for verifying that the bias of a measurement procedure
is within allowable limits at one or more clinically relevant measurand
concentrations. This type of experiment for "demonstrating trueness"
is also called a "recovery" or "bias estimation" study. For the bias
estimation study, two statistics must be derived from the data:
► The overall mean,x, of the experiment (eg, "5 x 5" measurements)
► The overall mean's standard error (se=).
Section 3.4 describes the calculations involved.
Before initiating the
experiment, the user should
specify the allowable bias,
as described in Chapter 1.
Even if the bias observed in
this experiment is statistically
significant, it may still be
clinically acceptable. This can
be determined by comparison
with the allowable bias limits.
In brief, having the TV and the calculated x, the first step is to calculate
the difference (bias) between the two. The next step is to calculate the
standard error of this difference (sej. The final calculation is defining a
verification interval (V7)that has a 95% probability of containing the true
difference. This calculation is achieved by multiplying the standard error
by a "coverage factor," k,VI = к ♦ sec. The multiplier, k, typically has a value
on the order of 2 or 3 to reach a probability of 95% and 99%, respectively.
The calculated bias is then assessed in light of the verification interval and
allowable error limit. Section 3.5 describes the calculations involved, and it
includes tables simplifying the computations for experiments consisting
of five to seven runs, with five replicates per run. Section 3.6 discusses
the interpretation of results, and Section 3.7 presents several worked
examples.
Depending on what materials with known concentration are adopted,
the study can serve one or more of several purposes, including to:
► Demonstrate agreement with the stated value of a recognized
standard material by estimating the bias of a measurement
procedure.
► Verify the trueness of a measurement procedure relative to its peer
group by estimating bias using PT or peer group QC materials.
► Verify the recovery of an assigned concentration of a material
especially prepared for this purpose by a manufacturer.
► Estimate the measurement procedure's bias when there are not
enough patient samples to perform an adequate measurement
procedure comparison (see CLSI document EP096), or when no
suitable reference measurement procedure is available.
► Obtain additional verification of trueness at specific concentrations
after performing a patient sample-based method comparison.
© Clinical and Laboratory Standards Institute. All rights reserved.
43
Number 12
EP15-A3
Besides havinga suitable composition (matrix), each reference material
must have a known concentration assigned by a reference measurement
procedure, for exam pie, or based on peer group data from PT or
interlaboratory QC programs. (There are several options.) It is also essential
to have an estimate of the TV's uncertainty, expressible as a standard error
(se?/M). Sections 3.2 and 3.3 provide guidance on selecting the best available
reference materials and determining their standard errors, respectively.
The experimental design described here is essentially the same as the
design described in Chapter 2 for verifying precision claims, and some
elements of the data analysis are also the same, making it desirable to
implement both studies as a single experiment. The "5 x 5" experimental
design described for the precision verification study in Chapter 2 is likewise
recommended for processing the reference materials with the procedure
in question as a basis for estimating its biases relative to the TVs of the
reference materials. This process entails assaying each of the reference
materials over five or more (not necessarily consecutive) days, with one run
per day and five replicates per run, yielding a total of 25 results per sample,
assuming there are no missing values and no results treated as statistical
outliers.
A note:
Processing the samples
for both studies (precision
verification and bias
estimation) in tandem, that
is, in the same runs, makes
for efficient bench work
and data analysis, because
the calculations described in
Chapter 2 can yield estimates
needed in the bias assessment
calculations.
Accordingly, processing the samples for both studies (precision verification
and bias estimation) in tandem, that is, in the same runs, makes for
efficient bench work and data analysis, because the calculations
described in Chapter 2 can yield estimates needed in the bias assessment
calculations.
3.2 Selecting Reference Materials
Ordinarily, forthe precision verification study discussed in Chapter 2,
patient samples or pools thereof a re clearly the "best available materials”
for analysis. For the study discussed in this section, however, the choice
is farfrom clear, becausethere are several competing considerations. It
is up to the user laboratory to justify its choice of materials in light of
considerations such as those below.
The laboratory's reasons for performing the recovery study are relevant
to the choice of materials:
► Is the study being undertaken with the goal of verifying that bias
exhibited by the measurement procedure in the user laboratory is
consistent with expectations forthe measurement procedure, ie,
expectations set by peer group results from interlaboratory QC or
PT? In this case, samp les from a peer group QC program ora PT/EQA
program and/or commercial controls with appropriate procedure-
specific value assignments may represent the best choice.
► Is the goal to assess the procedure's bias relative to a particular
reference standard? This goal will usually dictate the choice of
materia l(s).
Copyrighted material licensed to Olena Ramazanova on 2018-04-12 for licensee's use only. No further reproduction or networking is permitted. Distributed by Clarivate Analytics (US) LLC, www.techstreet.com, under license from Clinical and Laboratory Standards
44
© Clinical and Laboratory Standards Institute. All rights reserved.
Volume 34
EP15-A3
► Does the study's interest lie in assessing bias relative to some
other commercial or laboratory-developed assay for the
measurand in question, or perhaps to the same assay in use in
another laboratory or at another site? In this case, the goal may
be better served by performing a split-sample measurement
procedure comparison study.
When the purpose of the evaluation is to introduce a new assay in the
laboratory, the materials should represent at least two clinically relevant
concentration levels, although the design of the experiment is suitable for
use with only one material. The materials should either represent or be as
fully commutable as possible with the patient sample types intended for
analysis by the procedure; and they must be stable enough for the
multiday experiment described in this section.
A note:
More information on split-
sample method comparison
studies can be found in CLSI
document EP09.6
A note:
• «««••••««•«•«•«••««••••a
The materials must have TVs. Th is requirement generally rules out the
use of freshly prepared patient sample pools.
Moreover, the quality of the TV assignments is important. How rigorously
have they been determined? And, a re the uncertainties associated with
the TVs (uncertainties expressed quantitatively as "standard errors" [see
Section 3.3]) either declared or estimable from the experimental data
or statistics associated with the value assignments? If not, the assigned
values must be treated as if they were known without uncertainty,
analogous to the way estimates of imprecision tabulated in the
manufacturer's PI are treated in the precision verification study.
Finally, practical issues cannot be ignored. For example, are the materials
available in sufficient quantity, and at a reasonable cost?
Some sources of testing materials with known concentrations are listed
below, along with a few notes on their suitability or shortcomings.
See CLSI document EP1426
for more information on
com mutability of samples.
► Materials for which concentrations can be adjusted to stated
levels with negligible imprecision, eg, by spiking a therapeutic drug
into patient sample pools known to be analyte free, will have TVs
associated practically speaking, with no uncertainty and thus with
standard errors appropriately set to zero.
► Reference standards are high order standards that are recognized
by a professional body such as the International Federation
of Clinical Chemistry and Laboratory Medicine, the National
Institute of Standards and Technology (NIST), the Institute for
Reference Materials and Measurements, or the Joint Committee
for Traceability in Laboratory Medicine (JCTLM). For some analytes,
certified reference materials are available from NIST and other
internationally recognized providers. A partial list of these materials
is available from JCTLM (http://www.bipm.org/jctlm). Bear in
mind the metrological traceability issues involved with different
measu rands (see Appendix C) and the state of the art for reference
measurement procedures (http://www.bipm.org/jctlm). Some
© Clinical and Laboratory Standards Institute. All rights reserved.
45
Number 12
EP15-A3
reference materials may not be appropriate for routine user
laboratories due to considerations of commutability, stability,
availability, or cost. They also may not be optimal for verifying
performance relative to expectations for the assay in question or
relative to experience with the user's previous assay.
► Survey materials from PT/EQA programs may consist of
unadulterated patient sample-based materials with TVs assigned
by the program organizers, based either on reference measurement
procedures or on spiking with International Standards. If so, the
uncertainties (standard errors) associated with the TVs can usually
be obtained from the organizers if they are based on reference
measurements, or else treated as negligible. In any case, survey
materials from PT programs typically have both average values
and SDs that reflect testing by a large, identifiable number of
laboratories with a given measurement procedure (often across
several reagent lots) or with a relevant family of procedures deemed
essentially equivalent. It is often reasonable to adopt these averages
as TVs representing expectations for the procedure in question.
Moreover, reasonable estimates for the standard errors of these TVs
can be derived from the reported SDs and the relevant numbers of
participating laboratories.
► Similarly, materials used in interlaboratory QC programs have peer
group means that can be adopted as TVs, providing the number
of participants in the peer group is adequate. (In general, 10 [but
desirably 20 or more] is considered the minimum fora reliable
TV.) SDs are also reported, but estimating standard errors for the
peer group-based TVs is somewhat problematic because the
participating laboratories may differ markedly from one another in
the number of values contributed by each to the database.
► Materials intended for routine internal QC or calibration
verification of the measurement procedure in question generally
have preassigned procedure-specific TVs and either SDs or
expected "ranges" (concentration intervals) as well. However, the
uncertainties associated with these TVs are rarely declared or
estimable from the information supplied or available from the assay
manufacturer of the measurement procedure or the third-party
control vendor. In particular, the standard errors cannot be identified
with SDs supplied by the manufacturer or back-calculated from
the "ranges." This means that the user must treat the targets as if
they were known without uncertainty, ie, as if they had standard
errors of zero, which is seldom realistic. Moreover, without credible
estimates of their uncertainty, the quality of the TVs remains in
doubt, because there is no objective basis for judging their reliability.
46
© Clinical and Laboratory Standards Institute. All rights reserved.
Volume 34
EP15-A3
► Patient sample pools orQC materials that have been repeatedly
measured over a substantial period of time in one or more
laboratories using the procedure in question or using an assay
deemed essentially equivalent may constitute suitable materials for
the recovery study described, providing the assembled database has
been suitably tracked and analyzed (using techniques described in
Section 2.2 or Section 3.4) toyield both means and statistics from
which standard errors can be estimated. Thus, a central reference
laboratory could establish TVs and standard errors for subsequent
use by satellite laboratories, or a laboratory with a substantial
backlog of QC results fora given procedure could use the same
samples and relevant statistics extracted from the database for
checkingthe bias of a new procedure relative to the procedure
currently in use.
► Patient samples whose target concentrations have been established
by use of a traceable reference quality measurement procedure
may serve as reference materials. For example, a laboratory could
submit a group of patient samples to a participating laboratory in the
Cholesterol Reference Method Laboratory Network for lipid analyses
and certificates oftraceability.
3.3 Target Values and Their Standard Errors
At least two statistics, TV and seRM, must be determined for each reference
material, independent of the recovery (bias estimation) study. Depending
on circumstances, an additional statistic—reflecting N-sizeorDF—may also
be required, as indicated below.
► Scenario A. For bona fide reference materials, there should be no
difficulty identifying TV. To reflect the extensive testing associated
with value assignments for materials of this kind, set the DFto
<™ = infinity-AsforsQM:
- If the manufacturer supplies a "standard error" or "standard
uncertainty" (abbreviated by lowercase "u") or "combined standard
uncertainty" (often denoted by "uc")fortheTV,setsewequal
to the stated standard error, standard uncertainty, or combined
standard uncertainty.
- If the manufacturer supplies an "expanded uncertainty"
(abbreviated by uppercase "D") fortheTV, then eitherthe
"coveragefactor" (abbreviated by "k") orthe"coverage" (eg, 95%
or 99%) will be specified as well. If к is the coverage factor, set
= U / к; if the coverage is 95%, set seRM = U / 1.96; if the coverage is
99%, set = tl/2.58.
- If the manufacturer reports the lower and upper limits of a 95%
or 99% confidence interval (Cl) for the TV, ie, 2 ♦ U (k = 1.96 and к =
2.58, respectively), set seRM = [Upper - Lower) / (2 • 1.96) for a 95%
Cl; and set seRM = [Upper - Lower) I (2 ♦ 2.58) for a 99% Cl.
© Clinical and Laboratory Standards Institute. All rights reserved.
47
Number 12
EP15-A3
► Scenario В. If the reference material has a TV determined by PT
consensus results, then both an SD (identified as SDPM) based on
these results and the number of laboratories reporting (identified as
nLab) should also be available. In this scenario, set sePM=
SD^/JnLab and NPM= nLab.
► Scenario G If the reference material has a TV determined by peer
group results from an inter laboratory QC program, set seRM and NRM
as described above for the PT scenario. In this case, the statistics
must be considered somewhat problematic, as the dataset will
likely reflect multiple results from most laboratories, and some
laboratories may contribute far more results than others.
► Scenario D. If the TV represents a conventional quantity value, set
seRM = ° and = infinity.
► Scenario E. When working with a commercial QC material supplied
with a TV for which the standard error cannot be estimated, set sePM
= 0. In effect, this scenario defaults to assuming that the material's
concentration is known without any uncertainty (see Scenario
D). Accordingly, the verification interval will be narrower, and the
probability of the user’s average result, x, falling outside that interval
will be higher than if the TV’s uncertainty were known.
О IMPORTANT note:
This approach may be superior
when analysis of the precision
verification study indicates
that performance in the user's
laboratory is consistent with
the manufacturer’s precision
claims, which can be assumed
to reflect a larger, more
definitive study. On the other
hand, this advantage may be
offset by uncertainties arising
from the need to interpolate
from the PI table.
3.4 Mean Values and Their Standard Errors
Set x to the mean of a II results obtained for the sample in the recovery
study, and set the DF to d/= = nRun - 1.
se% can be calculated in several ways, which, for present purposes, should
yield equally good (roughly equivalent) estimates:
► In the formula below, nRun is the number of runs in the experiment
and nRep is the number of replicates per run. (In case of any missing
values, set nRep to the average number of results per run to allow
the use of balanced ANOVA calculations or perform ANOVA directly
if the analysis software supports use of unbalanced data sets.) Using
estimates obtained in the study for the sample's repeatability (sj
and within-laboratory imprecision (s J, set:
sex J nRun
(8)
► Perform calculations as above, but substitute for and sV(/. the
measurement procedure manufacturer's repeatability (<7?) and
within-laboratory imprecision (<rm) claims derived from the precision
table in the procedure's PI, as discussed in Section 2.З.6.1. This
approach may be superior when analysis of the precision verification
study indicates that performance in the user's laboratory is
consistent with the manufacturer’s precision claims, which can be
assumed to reflect a larger, more definitive study.
«•••••••«••••••••••••♦•«••«••••••••««•••••••••••«••••••••••••«•«•••••••••••««••••«•♦I
48
© Clinical and Laboratory Standards Institute. All rights reserved.
Volume 34
EP15-A3
On the other hand, this advantage may be offset by uncertainties
arising from the need to interpolate from the PI table.
► If sWL a nd the DF of x a re known, an equ iva lent eq nation for
calculating se= is given by:
S4=SWL
3.5 The Verification Interval
First, calculate the combined standard error (se) from se-and se-.
(J ft I I/I
se
RM
(10)
When seRM = 0, this reduces to sec= se=.
Then, to determine the combined DF (df.) from df= and dfRM in accordance
with Satterthwaite’s approximation, evaluate the following equation.-
De- + se2 P
^Rm)
Фс= ~ T (11)
It should rarely be necessary to evaluate the Satterthwaite formula directly,
as the following shortcuts will be applicable in many situations:
► When seRM = 0, as in Scenario E in Section 3.3, this formula
reduces to dfc = df-.
► When se > 0 but dfRM= infinity, as in Scenarios A and D in
Section 3.3, the formula reduces to:
dfc = df.-(sec/sey (12)
► In Scenarios В (PT) and C (peer group QC) in Section 3.3, providing
that the experimental design involved five, six, or seven runs with
five replicates per run, Table 15A, 15B, or 15C, respectively, can
obviate the need to evaluate the Satterthwaite formula. Enter
the appropriate table with NRM set to the number of laboratories
and tau = seRM / se=, and read off dfc The tables stop at 200
laboratories because the width of the verification interval changes
only minimally after the number of laboratories exceeds 200.
Interpolation of numbers of laboratories is not necessary; use the
table entry that most closely matches the number of laboratories
(see Worked Example 1A in Section 3.7.1).
note:
The tables stop at 200
laboratories because the width
of the verification interval
changes only minimally after
the number of laboratories
exceeds 200. Interpolation of
numbers of laboratories is not
necessary; use the table entry
that most closely matches the
number of laboratories
(see Worked Example 1A in
Section 3.7.1).
© Clinical and Laboratory Standards Institute. All rights reserved.
49
Number 12
EP15-A3
Now set the multiplier m to the Student's t quantile fora probability of
0.975 (this corresponds to a confidence level of 95%) and dfc.
m = /(0.975,0
О
(13)
NOTE: When a 95% confidence level is desired, the use of a probability of
0.975 is correct for recovery experiments involvingjust one sample, but
experiments of this kind often involve multiple samples. (In particular,
for demonstrations of trueness, as when introducing a new assay into
the laboratory, this guideline recommends testing at least two samples
representing different, medically relevant concentration levels.) To
maintain a family-wise confidence level of 95% when the recovery
experiment involves a number of samples given as nSam, assuming that all
samples are of similar importance, use a probability of 1.0 - (0.025 / nSam);
ie, use 0.975 for one sample, 0.9875 for two, 0.9917 for three, 0.9938 for
four, 0.995 for five, and so on.
Finally, calculate the verification interval (V7) as:
VI = TV ± (m • = TV ± (t0 • sec)
(14)
50
© Clinical and Laboratory Standards Institute. All rights reserved.
Volume 34
EP15-A3
Table 15A. ^.for the Combined Standard Error of the Mean and TV as a Function of the Ratio of the Standard Error of
the Reference Material to the Standard Error of the Mean (tau = seRM/se%), for Five Runs, With Five Replicates per Run,
and Nrm - 10, 20, 50,100, and > 200 Laboratories. NOTE: Table 15A is intended for use in Scenarios В (PT) and C (peer
group QC) in Section 3.3, when the user’s experiment involves five runs.
10 Laboratories 20 Laboratories 50 Laboratories 100 Laboratories 200 Laboratories
tau dfc tau dfc tau dfc tau dfc tau dfc
0.000 4 0.000 4 0.000 4 0.000 4 0.000 4
0.349 5 0.346 5 0.344 5 0.344 5 0.344 5
0.490 6 0.481 6 0.477 6 0.475 6 0.475 6
0.600 7 0.582 7 0.573 7 0.571 7 0.569 7
0.698 8 0.666 8 0.652 8 0.647 8 0.646 8
0.791 9 0.739 9 0.718 9 0.713 9 0.710 9
0.886 10 0.806 10 0.778 10 0.770 10 0.766 10
0.991 11 0.869 11 0.831 11 0.821 11 0.816 11
1.126 12 0.929 12 0.880 12 0.867 12 0.861 12
1.500 13 0.987 13 0.925 13 0.910 13 0.903 13
2.175 12 1.045 14 0.968 14 0.949 14 0.941 14
2.832 11 1.104 15 1.008 15 0.987 15 0.977 15
4.149 10 1.164 16 1.047 16 1.022 16 1.010 16
1.227 17 1.084 17 1.055 17 1.042 17
1.295 18 1.119 18 1.086 18 1.072 18
1.369 19 1.154 19 1.117 19 1.101 19
1.455 20 1.188 20 1.146 20 1.128 20
1.561 21 1.221 21 1.174 21 1.154 21
1.711 22 1.253 22 1.201 22 1.179 22
2.179 23 1.285 23 1.227 23 1.203 23
3.121 22 1.317 24 1.252 24 1.227 24
4.070 21 1.348 25 1.277 25 1.249 25
5.990 20 1.379 26 1.301 26 1.271 26
1.410 T1 1.325 T1 1.292 T1
1.441 28 1.348 28 1.313 28
1.472 29 1.370 29 1.333 29
1.503 30 1.393 30 1.352 30
1.850 40 1.598 40 1.527 40
3.500 53 1.985 60 1.808 60
4.975 103 2.528 120
7.053 203
infinity 9 infinity 19 infinity 49 infinity 99 infinity 199
Abbreviations: combined degrees of freedom; PT, proficiency testing; QC, quality control; TV, target value.
© Clinical and Laboratory Standards Institute. All rights reserved.
51
Number 12
EP15-A3
Table 15B. dfc for the Combined Standard Error of the Mean and TV as a Function of the Ratio of the Standard Error of
the Reference Material to the Standard Error of the Mean {tau = $eRA1 /se-), for Six Runs, With Five Replicates per Run,
and Nrm = 10,20, 50,100, and > 200 Laboratories. NOTE: Table 15B is intended for use in Scenarios В (PT) and C (peer
group QC) in Section 3.3, when the user’s experiment involves six runs.
10 Laboratories 20 Laboratories 50 Laboratories 100 Laboratories 200 Laboratories
tau dfc tau dfc tau dfc tau tau dfc
0.000 5 0.000 5 0.000 5 0.000 5 0.000 5
0.314 6 0.311 6 0.310 6 0.309 6 0.309 6
0.442 7 0.434 7 0.430 7 0.429 7 0.429 7
0.543 8 0.527 8 0.519 8 0.517 8 0.516 8
0.632 9 0.604 9 0.592 9 0.588 9 0.586 9
0.717 10 0.672 10 0.654 10 0.648 10 0.646 10
0.804 11 0.734 11 0.709 11 0.702 11 0.698 11
0.900 12 0.792 12 0.758 12 0.749 12 0.745 12
1.020 13 0.848 13 0.804 13 0.793 13 0.788 13
1.342 14 0.902 14 0.847 14 0.833 14 0.826 14
1.860 13 0.955 15 0.886 15 0.870 15 0.863 15
2.278 12 1.009 16 0.924 16 0.905 16 0.896 16
2.890 11 1.064 17 0.960 17 0.938 17 0.928 17
4.182 10 1.122 18 0.995 18 0.969 18 0.958 18
1.183 19 1.028 19 0.999 19 0.986 19
1.251 20 1.061 20 1.027 20 1.013 20
1.328 21 1.092 21 1.055 21 1.039 21
1.422 22 1.123 22 1.081 22 1.064 22
1.553 23 1.153 23 1.107 23 1.087 23
1.949 24 1.183 24 1.131 24 1.110 24
2.662 23 1.213 25 1.155 25 1.132 25
3.262 22 1.242 26 1.178 26 1.153 26
4.152 21 1.271 27 1.201 27 1.174 27
6.036 20 1.300 28 1.223 28 1.194 28
1.328 29 1.245 29 1.214 29
1.357 30 1.266 30 1.233 30
1.669 40 1.462 40 1.401 40
3.130 54 1.821 60 1.669 60
4.450 104 2.345 120
6.309 204
infinity 9 infinity 19 infinity 49 infinity 99 infinity 199
Abbreviations: df-, combined degrees of freedom; PT, proficiency testing; QC, quality control; TV, target value.
Copyrighted material licensed to Olena Ramazanova on 2018-04-12 for licensee's use only. No further reproduction or networking is permitted. Distributed by Clarivate Analytics (US) LLC, www.techstreet.com, under license from Clinical and Laboratory Standards
52
© Clinical and Laboratory Standards Institute. All rights reserved.
Volume 34
EP15-A3
Table 15C. dfc for the Combined Standard Error of the Mean and TV as a Function of the Ratio of the Standard Error of
the Reference Material to the Standard Error of the Mean (tau = seRM /se-), for Seven Runs, With Five Replicates per Run,
and Nrm = 10,20, 50,100, and > 200 Laboratories. NOTE: Table 15C is intended for use in Scenarios В (PT) and C (peer
group QC) in Section 3.3, when the user's experiment involves seven runs.
10 Laboratories 20 Laboratories 50 Laboratories 100 Laboratories 200 Laboratories
tau dfc tau tau dfc tau tau dfc
0.000 6 0.000 6 0.000 6 0.000 6 0.000 6
0.287 7 0.285 7 0.284 7 0.283 7 0.283 7
0.406 8 0.399 8 0.396 8 0.394 8 0.394 8
0.500 9 0.485 9 0.478 9 0.476 9 0.475 9
0.583 10 0.557 10 0.546 10 0.543 10 0.541 10
0.662 11 0.621 11 0.604 11 0.599 11 0.597 11
0.742 12 0.679 12 0.656 12 0.649 12 0.646 12
0.830 13 0.733 13 0.703 13 0.694 13 0.691 13
0.940 14 0.785 14 0.746 14 0.736 14 0.731 14
1.225 15 0.836 15 0.786 15 0.773 15 0.768 15
1.648 14 0.886 16 0.824 16 0.809 16 0.802 16
1.952 13 0.936 17 0.859 17 0.842 17 0.834 17
2.334 12 0.987 18 0.894 18 0.873 18 0.864 18
2.926 11 1.041 19 0.926 19 0.903 19 0.892 19
4.202 10 1.098 20 0.958 20 0.931 20 0.919 20
1.160 21 0.989 21 0.958 21 0.945 21
1.231 22 1.018 22 0.984 22 0.970 22
1.316 23 1.047 23 1.009 23 0.993 23
1.434 24 1.076 24 1.033 24 1.016 24
1.800 25 1.104 25 1.057 25 1.038 25
2.354 24 1.132 26 1.080 26 1.059 26
2.787 23 1.159 27 1.102 27 1.079 27
3.340 22 1.187 28 1.123 28 1.099 28
4.202 21 1.214 29 1.145 29 1.118 29
6.066 20 1.241 30 1.165 30 1.136 30
1.528 40 1.354 40 1.300 40
2.858 55 1.695 60 1.560 60
4.062 105 2.201 120
5.759 205
infinity 9 infinity 19 infinity 49 infinity 99 infinity 199
Abbreviations: dfc, combined degrees of freedom; PT, proficiency testing; QC, quality control; TV, target value.
© Clinical and Laboratory Standards Institute. All rights reserved.
53
Number 12
EP15-A3
3.6 Interpretation
If the verification interval includes the observed mean, Я bias is not
statistically significant (not shown to be different from zero) within the
limitations of the experiment.
To demonstrate that the experiment had sufficient precision and enough
replicates to detect bias exceeding the specified allowable bias, compare
the defined allowable bias to the expanded combined uncertainty (half
width of the Cl for the bias, • seJ.
If the expanded combined uncertainty exceeds the specified allowable
bias, the experiment lacks sufficient data to detect clinically significant
bias. More runs are necessary.
If the expanded combined uncertainty is less than the specified allowable
bias, the experiment should have sufficient data to detect significant bias.
However, if the duration of the experiment was only one day or two days,
the true uncertainty may be very different from the estimated uncertainty.
(Accordingly, this guideline recommends a study involving measurements
on at least five days.) This condition is most likely to occur when the
between-run SD, a8, is equal to or greater than the repeatability SD, aR. Use
caution when interpreting results. as can be calculated from the aR and aWL
given in the manufacturer's PI. may also be estimated via the precision
verification experiment. In any case, if cc, is close to or exceeds aR, more
runs may be necessary to detect bias.
If the verification interval does not include x, the estimated bias is
statistically different from zero.
1. Determine whether the bias, x-TV, is acceptable for the
laboratory's needs by comparing ittothe user-specified allowable
bias (see Chapter 1). The bias may be statistically significant, but
clinically acceptable.
2. Investigate, and, if necessary, contact the manufacturer for
assistance.
NOTE 1: Df will be between nRun -1 (ie, four in the precision experiment
with five runs) and nRep - nRun (the total number of replicates minus the
number of runs, ie, 20 in the precision experiment with five runs). If the
within-laboratory SD is large relative to the repeatability SD, the DF will be
low, whereas if the within-laboratory SD is approximately equal to or just
slightly higher than the repeatability SD, the DF will be high.
NOTE 2: The upper limit of se* is If the calculated se* exceeds this
limit, there is a calculation error. v
NOTE 3: A lower limit of seg isnRep * nRun- A calculated se% value below
this limit indicates a calculation error.
54
© Clinical and Laboratory Standards Institute. All rights reserved.
Volume 34
EP15-A3
The calculation of standard errors and the verification interval should be
reliable when the manufacturer of the reference material provides the
uncertainty of the material's assigned value, or when the material is from a
PT event, and the peer group SD and number of participants are given.
Calculation of the standard error of the assigned value of the reference
material is less reliable when the material is a QC material or the peer
group SD and number of laboratories are used in the calculations. A peer
group’s statistics can be skewed by one or more laboratories that submit
many more data points than most participants. In some pools, one very
large laboratory may submit half or more of the data. Such information
about the peer group is not usually available to participating laboratories.
When the standard error of the reference material is assumed to be zero,
the verification interval may be falsely narrow due to unknown imprecision
or bias in the assigned value. The falsely narrow verification interval
may lead to erroneously concluding that there is a real bias between the
observed mean and the assigned mean when there is none. This situation
can occur when "assayed controls” are used as the reference material and
no uncertainty is provided, or when analyte concentrations have been
adjusted by spiking with drugs or endogenous substances.
Some PT and QC materials do not perfectly match the matrix of native
samples. This does not invalidate their use as reference materials, however,
if the user laboratory is interested in assessing bias relative to peer means
in order to predict PT performance (see CLSI document EP1426).
It is possible, in the same experiment, for bias to be undetectable with
one or more of the reference materials, and for bias to be statistically
significant for one or more of the other reference materials. When this
occurs, compare the statistically significant biases to allowable bias. If one
or more of the biases exceeds allowable bias, investigation is necessary.
3.7 Worked Examples
Several hypothetical examples are provided to illustrate the calculations
used in this experiment, including calculation of the verification interval
from results of the precision experiment and by using the manufacturer’s
precision claims.
Worked Examples 1A and IB are based on the ferritin example used in
Section 2.3.10 for the precision verification study. In Worked Example 1A,
the s0 and values calculated in Section 2.3.10 are used to calculate the
verification interval. In Worked Example IB, the manufacturer-supplied
values are used. These examples demonstrate estimation of bias using PT
materials and calculation of the verification interval when three samples
are tested.
Worked Examples 2A and 2B are based on testing of an international
reference material for albumin. In Worked Example 2A,the user-
determined sDand values are used to calculate the verification interval.
К Vvl.
О IMPORTANT note:
Some PT and QC materials do
not perfectly match the matrix
of native samples.
© Clinical and Laboratory Standards Institute. All rights reserved.
55
Number 12
EP15-A3
In Worked Example 2B,the manufacturer-supplied values are used. The
verification interval is calculated assuming one sample is tested.
Worked Examples ЗА and 3B are based on a user's repeated measurements
of a sample spiked with digoxin up to a concentration of 2.0 pg/L. The
/ ss ratio is 4.0 in Worked Example ЗА, and 1.00 in Worked Example 3B.
These examples demonstrate the estimation of bias using materials whose
assigned values are assumed to have no uncertainty and infinite DF. The
verification interval is calculated assuming two samples are tested.
Worked Example 4 is a second digoxin spiking exam pie, th is time to a
concentration of 1.0 pg/L, using the manufacturer-supplied s^and
values. Again, the assigned value of the material is assumed to have zero
standard error and infinite DF. The verification interval is assuming two
samples are tested.
3.7.1 Worked Example 1A: Ferritin Precision Example in Section
2.3.10 Using Statistics From Precision Experiment
A PT survey sample was used in the precision example in Section 2.3.10.
(Assume three samples were tested in the same experiment.) The peer
group mean value for ferritin from the survey was 142.5 pg/L, the group
SD was 4.5 pg/L, and there were 43 participants. The user specified an
allowable bias of 10% from the peer group mean, or 14.2 pg/L.
In the user's experiment in Section 2.3.10, there were five runs with five
replicates per run. From Table 10 in Section 2.3.10, the user calculated a
grand mean of 140.1 pg/L, an of 1.78 pg/L, and sW£ of 2.40 pg/L. The
user's estimates of s^and svl/( are used in the example calculations below.
1. Calculate the standard error of the mean:
sex = /~W~ [4- 'Ml = A [2.402-(4) 1.782 = 0.80 pg/L.
x nRun WL ' nRep / й V 5 ' 5 >
2. Calculate the standard error of the TV, as shown in Section 3.3,
Scenario B, as:
™ - SrM ~ 45 - 0 6Q na/T
seRM i
,/nLab J 43
3. Calculate the combined standard error of the mean and TV, seCt as:
sec / sel +se" = -7 0.802 + 0.692
n/ x RM V
= 1.06 pg/L.
4. Calculate tau as:
se0!l,
tau = ——
se--
0.69
080
= 0.86.
5. From Table 15A, obtain d/_for43 laboratories, with tau = 0.86:
dfc = 12 (used table entry for 50 laboratories).
56
© Clinical and Laboratory Standards Institute. All rights reserved.
Volume 34
EP15-A3
6. Obtain the value of t for a = 0.05 with 12 Df and three samples:
A - al 2 'nSam,v ^1 —a/6,v ^0.9917,12 2.78.
7. Calculate the verification interval:
Verification Interval = TV ± (m * se?) = 142.5 pg/L ± (2.78 * 1.06 pg/L)
= 142.5 ± 2.95 pg/L = 139.6 to 145.4 pg/L.
8. The observed mean of 140.1 pg/L is within the verification interval.
The estimate of the bias is calculated as X-TV, 140.1 - 142.5,
or -2.4 pg/L.
The observed bias of-2.4 pg/L is not statistically significant.
3.7.2 Worked Example IB: Ferritin Precision Example in Section
2.3.10 Using Statistics From Manufacturer’s Claims
A PT survey sample was used in the precision example in Section 2.3.10.
(Assume three samples were tested in the same experiment.) The peer
group mean value from the survey was 142.5 pg/L the group SD was 4.5
pg/L and there were 43 participants. The user specified an allowable bias
of 10% from the peer group mean, or 14.25 pg/L.
In the user's experiment in Section 2.3.10, there were five runs with five
replicates per run. The user chose to interpolate the claimed %CVsfor
repeatability and within-laboratory imprecision in the PI precision table
at 102 pg/Land 211 pg/L to estimate the claimed precision at 140.1 pg/L.
The interpolated %CV^claim was (2.0%+ 1.4%) /2 = 1.7%. At the user’s
observed mean of 140.1 pg/L, = 2.38 pg/L. The interpolated %CVm claim
was (3.4% + 2.4%) / 2 = 2.9%. At the user's observed mean of 140.1 pg/L,
the calculated claimed sWL = 4.06 pg/L.
1. Calculate the standard error of the mean:
2. Calc ulate the standard error of the TV as shown in Section 3.3,
Scenario B, as:
srm 4.5 pg/L .
seRM ’
43
3. Calc ulate the combined standard error of the mean and TV, sec, as:
/ sei + se* = /1.552 + 0.692 = 1.70 pg/L.
xf X z\M * * °
4. Calculate tau as:
tau =
SeRM
0.69
L55 =0-45’
© Clinical and Laboratory Standards Institute. All rights reserved.
57
Number 12
EP15-A3
5. From Table 15A, obtain dfifor 43 laboratories, with tau = 0.45:
dfc = 6 (used table entry for 50 laboratories).
6. Obtain the value of tfor a = 0.05 with six DF:
m ~ t\- al2*nSam,v ~ К - a/6,v — A.9917,6 — 3.29.
7. Calculate the verification interval:
Verification Interval = TV ± (rn ♦ se^) = 142.5 pg/L ± (3.29 ♦ 1.70 pgZL) =
142.5 ± 5.6 pg/L = 136.9 to 148.1 pg/L.
8. The observed mean of 140.1 pg/L is within the verification interval.
The estimate of the bias is calculated as X- TV, 140.1 -142.5, or -2.4 pg/L.
The observed bias of-2.4 pg/L is not statistically significant.
3.73 Worked Example 2A: Testing of Albumin Reference Material
Using Statistics From the Precision Experiment
An albumin measurement procedure was evaluated. An albumin certified
reference material was tested over six days, one run per day, with five
replicates per run. The TV for the material was 37.2 g/L, with an expanded
standard uncertainty (U) of 1.2 g/L (k = 2). The observed repeatability
(within-run SD) was 0.4 g/L at 37.0 g/L, and the observed within-laboratory
imprecision SD was 0.6 g/L at 37.0 g/L The user obtained a mean albumin
concentration of 38.5 g/L. The user's specified allowable bias was 1.8 g/L.
1. Calculate the standard error of the mean:
’’ = J rib = /И062- (j)°-42 ] = 0.2g/L.
2. Calculate the standard error of the TV, as shown in Section 3.3,
Scenario A, as:
. = U 1.2 g/L
RM ------ = ----------
= 0.6 g/L.
3. Calculate the combined standard error of the mean and TV, sec, as:
sec + .yZ, = Jo.22 + O.62 =0.63 g/L.
yi X KM *
4. Calculate df=as:
X
df== nRun -1=6-1= 5.
5. Because the reference material in this example is assumed
to have infinite DF, calculate dfcas:
/se d /063 ?
dfc =5(ът“) = 5(3.15)4= 5 >98.46 = 492.3.
X U. Z-
6. Obtain the value of /for a = 0.05 with 492 DF:
m = h- a/2-nSam,v = Cl .975,492 = 1 -96.
Copyrighted material licensed to Olena Ramazanova on 2018-04-12 for licensee's use only. No further reproduction or networking is permitted. Distributed by Clarivate Analytics (US) LLC, www.techstreet.com, under license from Clinical and Laboratory Standards
58
© Clinical and Laboratory Standards Institute. All rights reserved.
Volume 34
EP15-A3
7. Calculate the verification interval:
Verification Interval = TV ± (m * sec) = 37.2 g/L ± (1.96 ♦ 0.63 g/L) =
37.2 g/L ± 1.2 g/L = 36.0 to 38.4 g/L.
8. The observed mean of 38.5 g/L is not within the verification interval.
The estimate of the bias is calculated as X- TV, 38.5 g/L - 37.2 g/L,
or 1.3 g/L.
The observed bias of 1.3 g/L is statistically significant. However, the
bias is acceptable because it is less than the user's defined allowable
bias of 1.8 g/L
3.7.4 Worked Example 2B: Testing of Albumin Reference Material
Using Statistics From the Manufacturer's Claims
An albumin measurement procedure was evaluated. An albumin certified
reference material was tested over six days with five replicates per run. The
TV for the material was 37.2 g/L, with an expanded standard uncertainty
(U) of 1.2 g/L (k = 2). The manufacturer's claimed repeatability (within-
run SD) was 0.3 g/L at 37.0 g/L, and the manufacturer's claimed within-
laboratory imprecision SD was 0.5 g/L at 37.0 g/L. The user obtained a
mean albumin concentration of 38.5 g/L. The user's specified allowable
bias was 2.0 g/L.
1. Calculate the standard error of the mean:
,л - I 1 П /nRep-l\ . 11 Г ” / 4 \ 71
2. Calculate the standard error of the TV, as shown in Section 3.3,
Scenario A, as:
u 1-2 g/L
sen«‘ — = —^-=0.6 g/L.
к 2
3* Calculate the combined standard error of the mean a nd TV, as:
- / «4
= т/0.17;+06; = 0.62 g/L.
4. Calculate df, as:
df= = nRun - 1 = 6 - 1 = 5.
5. Calculate dfc as:
. se л o 62 7
C = dfx* ЬЙ = 5 7777 = 5(W = 5 * 177 = 885.
c x ' ^x ' '0.1/'
6. Obtain the value of tfor a = 0.05 with 885 DF(ie, essentially infinite DC):
m = t, „ = A o„ = 1.96.
\—vJ2*nSam,v 0.975,885
© Clinical and Laboratory Standards Institute. All rights reserved.
59
Number 12
EP15-A3
7. Calculate the expanded combined standard error:
m ♦ sec= 1.96 ♦ 0.62 g/L = 1.2 g/L.
8. Calculate the verification interval:
Verification Interval = T V ± (m ♦ sec) = 37.2 g/L ±1.2 g/L = 36.0 to
38.4 g/L.
9. The observed mean of 38.5 g/L is not within the verification interval.
The estimate of the bias is calculated as X-TV, 38.5 g/L - 37.2 g/L, or
1.3 g/L.
The observed bias of 1.3 g/L is statistically significant, but acceptable
because it is less than the user’s defined allowable bias of 2.0 g/L
3.7.5 Worked Example ЗА: Testing of Sample Spiked With Digoxin
Using Statistics From the Precision Experiment
(Extremely High sWL/ sR)
A drug-free serum sample was spiked with digoxin up to a concentration
of 2.0 pg/L. The sample was tested on five days, with one run per day, with
five replicates per run. Two samples were tested in the same experiment.
The user’s observed repeatability (within-run SD) was 0.01 pg/L, and the
within-laboratory precision SD was 0.04 pg/L The user obtained a mean
digoxin concentration of 1.97 pg/L. The user’s specified allowable bias was
0.1 pg/L
1. Calculate the standard error of the mean:
Г /nRep—I \ 1 /1 ' / 4 \ ~
sex= /-"k2 =/T 0.042 - (-HO.Ol2 =0.0174 pg/L.
* у/nRun{ WL ' nRep I R у 5 '5'
2. The standard error of the TV is assumed to be zero.
se™ = 0 pg/L.
3. Calculate the combined standard error of the mean and TV, seG as:
se„ = se- = 0.0174 pg/L.
4. Calculate df=as:
df==nRun- 1 = 5 - 1 = 4.
5. dfc is simply df-.
6. Obtain the value of t for a = 0.05 with four DF:
К - a/2'nSam,v ~ ~ ^l-a/4,v ~ ^0.9875,4 “ ^-50.
7. Calculate the expanded combined standard error:
m « sec = 3.50 ♦ 0.0174 pg/L = 0.061 pg/L.
8. Calculate the verification interval:
Verification Interval = TV± (m ♦ sec) = 2.00 pg/L ± 0.061 pg/L =
1.94 to 2.06 pg/L.
Copyrighted material licensed to Olena Ramazanova on 2018-04-12 for licensee's use only. No further reproduction or networking is permitted. Distributed by Clarivate Analytics (US) LLC, www.techstreet.com, under license from Clinical and Laboratory Standards
60
© Clinical and Laboratory Standards Institute. All rights reserved.
Volume 34
EP15-A3
9.The observed mean of 1.97 pg/L is within the verification interval.
The estimate of the bias is calculated as X - TV, 1.97 pg/L - 2.00 pg/L,
or-0.03 pg/L.
The observed bias of-0.03 pg/L is not statistically significant.
3.7.6 Worked Example 3B: Testing of Sample Spiked With Digoxin
Using Statistics From the Precision Experiment (Extremely Low
SWL !
A drug-free serum sample was spiked with digoxin up to a concentration
of 2.0 pg/L. The sample was tested on five days, withone run per day, with
five replicates per run. Two samples were tested in the same experiment.
The user’s observed repeatability (within-run SD) was 0.04 pg/L, and the
within-laboratory imprecision SDwas 0.04 pg/L. The user obtained a mean
digoxin concentration of 1.96 pg/L. The user’s specified allowable bias was
0.1 pg/L.
1. Calculate the standard error of the mean:
M - Л П HiRep-\\ J ГГ\ „ /4ч J
- -Б~ 4,- = /V 0.042 -Ы0.042 =0.008 pg/L.
V nRun WL ' nRep i R y] 3 \ 5' , b
2. The standard error of the TV is assumed to be zero.
sec = 0 pg/L
3. Calculate the combined standard error of the mean and TV, seo as:
se... = se= = 0.008 pg/L.
4. Calculate df-as:
df= = nRun -1 = 5 - 1 = 4.
5. dfc is simply dfe
6. Obtain the value of f for a = 0.05 with four DF:
m ~ A -0./2‘nSam,v “ A - a/4-v “ 4) 9875,4 ” 3-50.
7. Calculate the expanded combined standard error.
m * se„ = 3.50 ♦ 0.008 pg/L = 0.028 pg/L.
8. Calculate the verification interval:
Verification Interval = TV ± (m * sec) = 2.00 pg/L ± 0.028 pg/L =
1.97 to 2.03 pg/L.
9. The observed mean of 1.96 pg/L is not within the verification interval.
The estimate of the bias is calculated as X - TV, 1.96 pg/L - 2.00 pg/L,
or -0.04 pg/L.
The observed bias of-0.04 pg/L is statistically significant, but is less
than the user’s specified allowable bias.
© Clinical and Laboratory Standards Institute. All rights reserved.
61
Number 12
EP15-A3
3.7.7 Worked Example 4: Testing of Sample Spiked With Digoxin
Using Statistics From the Manufacturer's Claims
A drug-free serum sample was spiked with digoxin up to a concentration
of 1.0 pg/L. The sample was tested on seven days, with one run per
day, with five replicates per run. Two samples were tested in the same
experiment. The manufacturer made claims for %CV for repeatability
and within-laboratory imprecision of 4.81% and 1.58%, respectively, at
0.54 pg/L, and 6.48% and 1.91%, respectively, at 1.52 pg/L. The user chose
to interpolate the claimed %CVs for repeatability and within-laboratory
imprecision at 0.54 pg/L and 1.52 pg/L to estimate the claimed precision
at 1.0 pg/L. The interpolated %CV? claim was (4.81% +1.58%) / 2 = 3.2%. At
the spiked sample’s digoxin concentration of 1.0 pg/L, = 0.032 pg/L. The
interpolated %CVm claim was (6.48% + 1.91%) / 2 =4.20%. At the spiked
sample’s digoxin concentration of 1.0 pg/L, = 0.042 pg/L.
The user’s specified allowable bias was 0.04 pg/L.
The user observed a mean digoxin concentration of 0.94 pg/L.
1. Calculate the standard error of the mean:
=ЛЬк- VI [°0422 -(4)003221=0012
2. The standard error of the TV is assumed to be zero.
= 0 pg/L
3. Calculate the combined standard error of the mean and TV, sec, as:
se=se== 0.012 pg/L.
4. Calculate dfc as:
ctf~=riRun- 1 = 7 -1 = 6.
5. dfc\s simply dfy.
<#c = 6
6. Obtain the value of tfor a = 0.05 with eight DF:
m — t = t — t = x, 97
l-a/2*«^v l-ot/4,v 0.9874,6
7. Calculate the expanded combined standard error:
m « sec = 2.97 ♦ 0.012 pg/L = 0.036 pg/L.
8. Calculate the verification interval:
Verification Interval = TV ± (m ♦ se J = 1.00 pg/L ± 0.036 pg/L =
0.96 to 1.04 pg/L.
9. The observed mean of 0.94 pg/L is not within the verification interval.
The estimate of the bias is calculated as X - TV, 0.94 pg/L - 1.00 pg/L,
or-0.06 pg/L.
The observed bias of-0.06 pg/L exceeds the user’s allowable bias.
The user should investigate (possibly preparing a fresh spiked
sample) and contact the manufacturer for assistance, if necessary.
62
© Clinical and Laboratory Standards Institute. All rights reserved.
niy. No further reproduct ion or networking is permitted. Distributed by Clarivate Analytics (US) LLC:, www. techstreet .cwrtr-under license trijoi Clinical
1
Id Labora
A
\
Conclusion
Number 12
EP15-A3
О Conclusion
At the successful conclusion of the EP15 protocol, the user will have
demonstrated that the precision of the measurement procedure in
the user's laboratory is consistent with the manufacturer's claims for
precision, and will have demonstrated that the measurement procedure
demonstrates no significant bias (or an acceptable amount of bias) relative
to the target value of the chosen reference material.
Copyrighted material licensed to Olena Ramazanova on 2018-04-12 for licensee's use only. No further reproduction or networking is permitted. Distributed by Clarivate Analytics (US) LLC, www.techstreet.com, under license from Clinical and Laboratory Standards
64
© Clinical and Laboratory Standards Institute. All rights reserved.
Chapter
This chapter includes:
Approach
Supplemental Inform
► References
► Appendixes
► Related CLSI R<
Number 12 EP15-A3
References
1 CLSI. Evaluation of Precision of Quantitative Measurement Procedures; Approved Guideline-
Third Edition. CLSI document EPO5-A3. Wayne, PA: Clinical and Laboratory Standards Institute; 2014.
2 CLSI. StatisPro™ [computer program]. Version 2.5. Wayne, PA: Clinical and Laboratory Standards Institute; 2013.
3 CLSI. Evaluation of the Linearity of Quantitative Measurement Procedures: A Statistical Approach; Approved
Guideline. CLSI document EP06-A. Wayne, PA: Clinical and Laboratory Standards Institute; 2003.
4 CLS I. Evaluation of Detection Capability for Clinical Laboratory Measurement Procedures; Approved Guideline—
Second Edition. CLSI document EP17-A2. Wayne, PA: Clinical and Laboratory Standards Institute; 2012.
5 CLSI. Defining, Establishing, and Verifying Reference Intervals in the Clinical Laboratory; Approved Guideline-
Third Edition. CLSI document EP28-A3c. Wayne, PA: Clinical and Laboratory Standards Institute; 2010.
6 CLSI. Measurement Procedure Comparison and Bias Estimation Using Patient Samples; Approved Guideline—
Third Edition. CLSI document EP09-A3. Wayne, PA: Clinical and Laboratory Standards Institute; 2013.
7 CLSI. Preliminary Evaluation of Quantitative Clinical Laboratory Measurement Procedures; Approved Guideline-
Third Edition. CLSI document EP10-A3-AMD. Wayne, PA: Clinical and Laboratory Standards Institute; 2014.
8 Krouwer JS. Setting performance goals and evaluating total analytical error for diagnostic assays. Clin Chern.
2002;48(6 Pt l):919-927.
9 CLSI. Estimation of Total Analytical Error for Clinical Laboratory Methods; Approved Guideline. CLSI document
EP21-A. Wayne, PA; Clinical and Laboratory Standards Institute; 2003.
10 Miller JM,Astles JR, BaszlerT, et al.; National Center for Emerging and Zoonotic Infectious Diseases, CDC.
Guidelines for safe work practices in human and animal medical diagnostic laboratories. MMWR Surveill Summ.
2012;61 Suppl:l-102.
11 CLSI. Protection of Laboratory Workers From Occupationally Acquired Infections; Approved Guideline—Fourth Edition.
CLSI document M29-A4. Wayne, PA: Clinical and Laboratory Standards Institute; 2014.
12 ISO. In vitro diagnostic medical devices - Measurement of quantities in biological samples - Metrological traceability
of values assigned to calibrators and control materials. ISO 17511. Geneva, Switzerland: International Organization
for Standardization; 2003.
13 ISO. In vitro diagnostic medical devices—Measurement of quantities in biological samples - Metrological traceability
of values for catalytic concentration of enzymes assigned calibrators and control materials. ISO 18153. Geneva,
Switzerland: International Organization for Standardization; 2003.
14 В urea u I nternationa I des Poids et Mesu res (В IPM). International Vocabulary of Metrology - Basic and General
Concepts and Associated Terms (VIM, 3rd edition, JCGM 200:2012). http://www.bipm.org/en/publications/guides/
vim.html. Accessed August 15, 2014.
66 © Clinical and Laboratory Standards Institute. All rights reserved.
Copyrighted material licensed to Olena Ramazanova on 2018-04-12 for licensee's use only. No further reproduction or networking is permitted. Distributed by Clarivate Analytics (US) LLC, www.techstreet.com, under license from Clinical and Laboratory Standards
Volume 34
EP15-A3
15
16
17
18
19
20
21
22
23
24
25
26
* • • * *
ISO. Statistics- Vocabulary and symbols - Part 2: Applied statistics. ISO 3534-2. Geneva, Switzerland: International
Organization for Standardization; 2006.
I EC. International electrotechnical vocabulary - Electrical and electronic measurements and measuring instruments.
IEC 60050-300. Geneva, Switzerland: International Electrotechnical Commission; 2001.
ISO. Accuracy (trueness and precision) of measurement methods and results - Part 1: General principles and
def nitions. ISO 5725-1. Geneva, Switzerland: International Organization for Standardization; 1994.
Garber CC, Carey RN. Evaluation of methods. In: Kaplan LA, PesceAJ, eds. Clinical Chemistry: Theory, Analysis,
and Correlation. 5th ed. St. Louis, MO: Mosby, Inc.; 2010:480-506.
Linnet K, Boyd JC. Selection and analytical evaluation of methods—with statistical techniques. In: Burtis CA,
Ashwood ER, eds. Tietz Textbook of Clinical Chemistry and Molecular Diagnostics. 5th ed. St. Louis, MO: Elsevier
Saunders; 2012:7-48.
CLSI. Training and Competence Assessment; Approved Guideline—Third Edition. CLSI document QMS03-A3. Wayne,
PA: Clinical and Laboratory Standards Institute; 2009.
CLSI. Statistical Quality Control for Quantitative Measurement Procedures: Principles and Def nitions; Approved
Guideline—Third Edition. CLSI document C24-A3. Wayne, PA: Clinical and Laboratory Standards Institute; 2006.
Iglewicz B, Hoaglin DC. How to Detect and Handle Outliers. Milwaukee, Wl: ASQC Quality Press; 1993.
Barnett V, Lewis T. Outliers in Statistical Data. 3rd ed. West Sussex, UK: John Wiley & Sons Ltd.; 1994.
Sadler WA. Imprecision profiling. Clin Biochem Rev. 2008;29 Suppl l:S33-6.
Sadler WA, Australasian Association of Clinical Biochemists. Variance function program (version 11.0).
http://www.aacb.asn.au/professionaldevelopment/useful-tools/variance-function-program-version-110.
Accessed August 15, 2014.
CLSI. Evaluation of Commutability of Processed Samples; Approved Guideline—Third Edition. CLSI document
EP14-A3. Wayne, PA: Clinical and Laboratory Standards Institute; 2014.
© Clinical and Laboratory Standards Institute. All rights reserved.
67
Appendix A. Precision Verification Study: Experimental Designs
and Missing Values
A note:
When sample volume is
limited, the requirement
for balance may be relaxed
if the study is extended to
include additional runs.
The basic 5x5 experimental design advocated in this guideline involves, for every
sample, к = 5 runs, each performed on a different day, with n = 5 replicates per run.
This is a balanced design, because the same number of replicates is specified for
each run. Other balanced designs are equally acceptable if they involve at least as
many days and at least as many degrees of freedom for repeatability, dfR. In the
5x5 design, dfR = к (n -1) = 5 (5 -1) = 20, increasing the number of runs, k, to 7,
10, or 20, would a I low for decreasing the number of replicates per run, n, to 4,3,
or 2, respectively, while maintaining a dfR of 20 or 21. Accordingly, these and larger
balanced designs are acceptable, if the runs are performed on at least five distinct
days. (When sample volume is limited, the requirement for balance may be relaxed
if the study is extended to include additional runs.)
A balanced design does not guarantee a balanced dataset. Individual results
may go missing due to inadequate sample volume or to other documentable,
nonprecision-related errors. Additional bench work may be necessary. Missing
values and suppression of statistical outliers induce imbalance in the resulting
datasets, thereby complicating the statistical analysis. It may be necessary to
exclude an entire run from the analysis if, for example, the QC results indicate that
it was a bad run ("not in control"). This exclusion will not induce imbalance—it
merely requires compensating forthe missing run by processing another, not
necessarily on the same day, assuming there is sufficient sample volume remaining
to continue the experiment.
The dataset for any given sample is acceptable if, and only if, it involves results for
at least five days and a dfpof 19 or higher after exclusion of any statistical outliers.
Shortfalls must be remedied by extending the study for that sample to additional
runs until these two minimum requirements are met.
The user may extend the study by performing additional runs, preferably on
different days—and, if necessary, with fewer (eg, two or three) replicates per run if
sample volume is limited—because this will tend to improve the reliability of the
estimates, especially the estimates of within-laboratory imprecision. Furthermore,
when there is an apparent outlier, additional runs may yield more convincing
evidence for the result's true stat us and/or dam pen its effect on the precision
estimates.
68
© Clinical and Laboratory Standards Institute. All rights reserved.
id to Olena Ramazanova on 2018-04-12 for licensee's use only. No further reproduction or networking is permitted. Distributed by Clarivate Analytics (US) LLC, www.techstreet.com, under license from Clinical and Laboratory Standards It
Appendix В. Precision Calculations
Bl Building the One-Way Analysis of Variance Table
One-way analysis of variance (ANOVA) applied to the results for a given sample in a precision verification study typically
yields output like that depicted in Tables 4 and 5 (see Section 2.3.5 of this document). If software is unavailable, entries
forthe sum of squares (SS), degrees of freedom [DF), and mean squares (MS) columns must be calculated manually. Note
that "sum of squares (SS)" is short for sum of squared deviations from the mean. The SS and DF columns simply provide
the numerators and denominators, respectively, of the variance-like quantities in the MS column.
For the sample in question, first determine the total number of results, N; the number of distinct runs, k; and the
arithmetic average of the N results, x (the "grand mean"). For Sample 2 in the worked example in Section 2.3.10 of this
document, N = 25, к = 5, and x = 140.12 pg/L, as computed from Table 8 (see Section 2.3.10).
Entries forthe SS column can be obtained in a straightforward manner from two tables: a table with one row per result
(such as Table 8), and a not her with one row per run (such as Table Bl).
To compute SSfofo/, the total SS,from a listing like Table 8 (but dedicated to a single sample), adjoin a column, calling it
DM2 (deviation from the mean, squared). Row by row, compute the cell entries for DM2 as the square of the difference
between x and the result, listed on that row. (For Sample 2, the 25 cell entries for DM2, expressed to four decimal
places, are 0.0144,1.2544,..., 0.7744.) Then, take the sum of the N squared deviations now listed in that column.
Algebraically:
The right-hand side of the expression shows an algebraically equivalent way of obtaining SStotal that may be less prone
to round-off error. It corresponds to creating a column consisting of the squares of the results, taking the sum of these
squares, and then subtracting N times the square of the grand mean.
Table Bl summarizes basic statistics at the grouping factor (ie, run) level for Sample 2: the number of results for each run
and the average of the results for each run, in columns n and x, respectively.
Table Bl. Ferritin Example: Run Statistics for Sample 2
Run n X DM2 • n
1 5 139.0 6.272
2 5 140.8 2.312
3 5 138.2 18.432
4 5 142.8 35.912
5 5 139.8 0.512
Between:
63.44
nd Laboratory standards It
© Clinical and Laboratory Standards Institute. All rights reserved.
69
Number 12
EP15-A3
Appendix В. (Continued)
To compute SSI, the between-run SS, from Table Bl, adjoin a column, calling it DM2 * n, as shown. Compute the entry for
any given row in this column as the difference between and the run average, x, listed on that row, with the difference
squared and then multiplied by the number of results for that run, namely n. SSI is the sum of the Gentries in the
column. Algebraically:
The right-hand side of the expression shows an algebraically equivalent way of obtaining SSI. Forthe balanced case
(where n. are all the same), this simplifies to:
к
SSI =^(x-x)2
i = 1
SS2, the within-run SS, can be obtained by subtraction from the two SS already computed. Alternatively, it could be
computed by summing up the squared deviations of each result from its run mean:
n.
SS2 = SStll-SSl =
total
2
For Sample 2, SSI = 63.44, SS2 = 63.20, and SSfoto/ = 126.64, as shown in Table 5 (see Section 2.3.5 of this document).
Using N and k, calculate the entries forthe Df column as follows, again taking advantage of the fact that the first two
entries must add up to the third:
DF =N-1
total
DFl=k-\
DF2 = DFtotal - DF1 = (N - 1) - (k- 1) = N-k
The need to subtract 1 from N and 1 from к to obtain Dftote. and DPI, respectively, can be ascribed to the loss of one DF in
having to compute a mean from the data, ie, from the totality of individual results or from the run averages, respectively.
Because there аге к = 5 sets of within-run data, each requiring computation of a mean, subtracting к from N to obtain
DF2 makes sense on the same basis. Note that the Df column entries are necessarily positive integers (whole numbers).
For Sample 2, where к = 5 and N = 25, Dfl = 4, DF2 = 20, and DFtota. = 24, as shown in Table 5 (see Section 2.3.5 of this
document).
To compute the two "mean squares," simply divide the component "SS" by their Df:
MSI = SSI /DF1
MS2=SS2/DF2
For Sample 2, MSI = 15.86 and MS2 = 3.16, as shown in Table 5 (see Section 2.3.5 of this document).
70
© Clinical and Laboratory Standards Institute. All rights reserved.
Volume 34
EP15-A3
Appendix В. (Continued)
B2 Computing n0
Table 3 (see Section 2.3.4.2 of this document) lists values for n0—the "average" number of results per run—when
there are five, six, or seven runs, with five replicates per run and, at most, one result missing for a given sample. For
other designs, n0 must be calculated manually. Forthe balanced case, where all the are the same, this reduces to
calculating the arithmetic mean ofthe/т by dividing the total number of results by the number of runs: n0 = nj = N /к.
To a reasonable approximation, as can be verified from Table B3, this also holds for datasets with only a small degree of
imbalance. The following computations are intended for determining n0 precisely in the unbalanced case, but they are
valid for computing n0 in the balanced case as well.
Starting with a listing like Table B2 of the number of individual results r?. in each run, adjoin a column labeled n2,
populating it with the squares of the n, (Here к and N represent the number of runs and the total number of individual
results, respectively.) Compute the sum of these squares:
k
i = 1
Then:
£-1
Table B2. Format for Precise n() Calculations
Balanced
Unbalanced
k=5 N = 25 k = 5 N = 24
w = 125 SN2 = 116
avg,n = 5 avg.n = 4.8
varn = 0 var.n = 0.2
Abbreviations: avg.n, arithmetic mean; var.n, variance of the П/.
© Clinical and Laboratory Standards Institute. All rights reserved.
71
Number 12
EP15-A3
Appendix В. (Continued)
Equivalently, using basic statistical functions, determine the arithmetic mean and (sample) variance of the njf calling
these avg.n and var.n, respectively, as indicated beneath the table. Note that var.n could also be obtained as the square of
the (sample) SD of the n.. Then:
nQ = avg-n - (var.n IN)
For the right side of Table B2, illustrating a relatively common unbalanced situation—the dataset is complete except for
one missing or suppressed result—n0 = (24-[116 / 24]) /(5 -1) = 4.7917. Forthe balanced situation illustrated on the
left, n0 = (25 - [125 / 25]) / (5 -1) = 5 = n., as expected, because here, the number of results per run is trivially the average
number of results per run. The a Iter native formulation yields exactly the same values: nQ = 4.8 - (0.2 / 24) = 4.7917 forthe
unbalanced case, and n0= 5-(0.0/25) = 5 forthe balanced case.
Table B3 provides numerical examples illustrating the effect on n0 of missing values. Their number and distribution are
relevant, but not their order.
Table B3. Examples of n Calculations
"i N avg.n "o Replicates
5 25 5 5 5 5 5 5 5
5 24 4.8 4.792 5 5 5 54
5 23 4.6 4.587 5 5 544
5 23 4.6 4.565 5 5 5 5 3
Abbreviation: avg.n, arithmetic mean.
N avg.n "o Replicates
6 30 5 5 555555
6 29 4.833 4.828 555554
6 28 4.667 4.657 555544
6 28 4.667 4.643 555553
The two algebraically equivalent methods presented here for precisely determining n0 represent the standard textbook
approach used in one-way ANOVA for variance decomposition. Slightly different approaches have also been advocated1
and may be implemented in off-the-shelf software, but the numerical effect of such differences is inconsequential in this
context. Note that Table 3 (see Section 2.3.4.2 of this document) ignores the difference between the cases represented
by the third and fourth rows in Table B3, which differ, slightly, with respect to degree of imbalance, though the number of
missing values is the same.
B3 Grubbs’ Factors
Table 3 (see Section 2.3.4.2 of this document) lists values forthe Grubbs' factor G, which figures in the recommended test
for statistical outliers, only for N = 23 to 25, 28 to 30, and 33 to 35. Table B4 provides a more extensive tabulation.
72
© Clinical and Laboratory Standards Institute. All rights reserved.
Volume 34
EP15-A3
Appendix В. (Continued)
Table B4. Grubbs’ Factors (99% Confidence Level)
N G N G N G N G N G
1 N/A 21 3.031 41 3.392 61 3.567 81 3.678
2 N/A 22 3.060 42 3.404 62 3.573 82 3.682
3 1.155 23 3.087 43 3.415 63 3.580 83 3.687
4 1.496 24 3.112 44 3.425 64 3.586 84 3.691
5 1.764 25 3.135 45 3.435 65 3.592 85 3.695
6 1.973 26 3.158 46 3.445 66 3.598 86 3.700
7 2.139 27 3.179 47 3.455 67 3.604 87 3.704
8 2.274 28 3.199 48 3.464 68 3.610 88 3.708
9 2.387 29 3.218 49 3.474 69 3.616 89 3.712
10 2.482 30 3.236 50 3.482 70 3.622 90 3.716
11 2.564 31 3.253 51 3.491 71 3.627 91 3.720
12 2.636 32 3.270 52 3.500 72 3.633 92 3.724
13 2.699 33 3.286 53 3.508 73 3.638 93 3.728
14 2.755 34 3.301 54 3.516 74 3.643 94 3.732
15 2.806 35 3.316 55 3.524 75 3.648 95 3.736
16 2.852 36 3.330 56 3.531 76 3.653 96 3.740
17 2.894 37 3.343 57 3.539 77 3.658 97 3.743
18 2.932 38 3.356 58 3.546 78 3.663 98 3.747
19 2.968 39 3.369 59 3.553 79 3.668 99 3.750
20 3.001 40 3.381 60 3.560 80 3.673 100 3.754
Abbreviation: N/A, not applicable.
B4 Degrees of Freedom for Within-laboratory Imprecision
Table 6 (see Section 2.3.6.2 of this document) lists DF for within-laboratory imprecision (d/J as a function of the
manufacturer’s claims ratio (p = awt / but only for experimental designs involving five to seven runs, with five
replicates per run. This section describes how to calculate dfWL directly, and the calculations underlying Table 6 of this
document.
© Clinical and Laboratory Standards Institute. All rights reserved.
73
Number 12
EP15-A3
Appendix В. (Continued)
Calculating dfWL Directly
The within-laboratory variance, VM.. = (sWi)2, represents a linear combination of the variance components, namely
VB + VB, extracted from a one-way ANOVA table, and dfWL represents the DF associated with this linear combination.
The approach taken in this guideline relies on the widely used approximation for dfWL introduced by Satterthwaite.2 It is
constructed from ANOVA table elements:
► The mean squares, MSI and MS2
► The mean squares' degrees of freedom, DF1 and DF2
► n0, the "average" number of results per run
To calculate the Satterthwaite approximation from these elements, first express the within-laboratory variance estimate
as a linear combination (weighted sum) cd MSI and MS2 from the ANOVA table, ie, in the form cqMSl + a2MS2, where аг
and a2 are suitable weights (multipliers):
Vwl = Vw+ Vb = MS2 + №S1 ~MS2^ 4 = f1NMSl + 0 - 1 /n0)MS2
Hence, cl = 1 / n0 and a2 = 1 -1 / n0 = (nn -1) / n0. The DFassociated with MSI and MS2 are, respectively, DF1 = к-1 and
DF2 = N-k, where к and N are the numberof runs and the total number of results. For V^,, the linear combination of
MSI and MS2, Satterthwaite2 argued that the following should be approximately true:
(a^MSl + a2MS2)2 (a^MSF)2 (a^dS2)2
~DF~r ~ DF1 + DF2
WL
This equation can be rearranged to solve for the quantity of interest, namely dfWL = DFWL, for example, as DFm = num
/ (deni + den2), where num = (a^MSl + g,MS2)2, deni = (aJVSl)2 /DF1, and den2 = (aJV\S2)2 / DF2. (For Sample 2 in the
ferritin example, n0 = 5, c?x = 0.2, a2 = 0.8, num = 32.49, deni = 2.5154, den2 = 0.3195, dfw. = 11.46.)
The Calculations Underlying Table 6
These calculations are based on p (the claims ratio, <jwl / aR) and three elements of the user’s experimental design, namely
к (the numberof runs), N (the total number of replicates), and n. (the "average" number of replicates per run). For a fully
balanced design, the latter should be related as n0 = N /к.
Set Mean = 1.0 and %CV? = 1.0 (arbitrary values). Then:
%CVWL=p^%CVR.
Back-calculate the within-run and between-run variance components:
/w,= (%CV?*Me^/100)2
VWL = (%CVWL* Mean / \0Q)2
V = V -V
В WL W
74
© Clinical and Laboratory Standards Institute. All rights reserved.
Volume 34
EP15-A3
Appendix В. (Continued)
Reconstruct the ANOVA table/US and DF:
MSI = VW +nQ* VB
MS2 = VW
DFl=k-\
DF2=F-k
Calculate elements of the Satterthwaite formula:
a.= 1 /^o
а2 = (и0-1)/к0
num = (a^MSl + afi4S2}2
den} = {axMSl}2 / DF1
deni = {a.MS2]2 / DF2
Finally,
dfWL = DFwl = num / (deni + denfi
B5 Determining the Upper Verification Limit Factor, F
Table 7 (see Section 23.6.2 of this document) lists values for F, the upper verification limit (UVL) factor, as a function of
Df and the number of samples, nSam, in the precision verification experiment, for nSam = 1 to 6.
To calculate the UVL factor manually, first determine X2, the value ("quantile" or "percentage point") for the chi-
square distribution with dfand a confidence level set at 1-0.05 / nSam, which evaluates to 95% (ie, 0.95) for nSam = 1
corresponding to a false rejection rate of 5% (a = 0.05)—and to 97.5%, 9833%, 98.75%, and so on for nSam = 2, 3,4, etc.
(For example, in a study involving two samples, if df = 20, then X2 = 34.17). Then, calculate the UVL factor,
References for Appendix В
1 Burdick RK, Graybill FA. The one-fold nested design. In: Owen DB, Cornell RG, Kshirsagar AM, Kennedy WJ, Schilling
EG, eds. Confidence Intervals on Variance Components. New York, NY: Marcel Dekker, Inc.; 1992:68-76.
2 Satterthwaite FE. Synthesis of variance. Psychometrika. 1941 ;6(5)309-316.
© Clinical and Laboratory Standards Institute. All rights reserved.
75
Jk note:
The organization that
maintains databases of
reference materials and
reference measurement
procedures is the Joint
Committee for Traceability
in Laboratory Medicine
(JCTLM).1 Analytes are
classified by JCTLM as Type 1
if they are single, well-defined
chemical entities that have
the same structure in the
standard, calibrant, and body
fluid, and Type 2 if they are
less well defined and/or are
heterogeneous.
Absolute trueness of laboratory results, while assumed by some users of a
laboratory service and by virtually all patients, is impossible to achieve because
there will always be uncertainty. It is, however, possible to establish relative
trueness in relation to a defined standard with varying degrees of certainty,
depending on the kind of quantity (measurand) involved and the state of the art
of its measurement. This appendix attempts to clarify some of the issues involved
so as to set in context how a user may verify the trueness of a measurement
procedure.
Cl Principles
Trueness of a result can only be established by reference to a standard with a
defined content of the quantity (measurand). This standard may then be used
to calibrate a high order reference measurement procedure (usually involving
some variant of isotope dilution gas chromatography mass spectrometry), which,
in turn, may be used to assign values to secondary standards in an appropriate
clinically relevant matrix. Accordingly, this reference measurement procedure
may be used to calibrate lower order manufacturers' comparison measurement
procedures, which may be used to assign values to working calibrators infield
procedures. This sequence of reference procedures and materials is known as a
traceability chain, and if this chain is unbroken, end results are said to be traceable
back to the standard. (The chain is broken if a noncom mutable material is used.)
The organization that maintains databases of reference materials and reference
measurement procedures istheJoint Committee for Traceability in Laboratory
Medicine (JCTLM).1 Analytes are classified by JCTLM as Type 1 if they are single,
well-defined chemical entities that have the same structure in the standard,
calibrant, and body flu id, and Type 2 if they are less well defined and/or are
heterogeneous.
C2 Role of the Manufacturer
The manufacturer has the primary responsibility to establish trueness, using
established reference measurement systems, to ensure traceability of their results.
End users are utterly reliant on this responsibility being undertaken properly
during the development of an assay and maintained throughout its lifetime,
especially when batches of reagents change. Where an established high order
reference measurement system exists, it must be used by the manufacturer.
This requirement is embodied in the European Union's in vitro diagnostic devices
directive.2
76
© Clinical and Laboratory Standards Institute. All rights reserved.
Volume 34
EP15-A3
Appendix C (Continued)
C3 Role of the Proficiency Testing/External Quality Assessment Service Provider
Proficiency testing/external quality assessment (PT/EQA) service providers have a key role in postmarket surveillance of
assay system trueness and comparability. This role, however, may only be effective if the design of the service includes
authentic, commutable materials and challenging exercises to assess important analytical characteristics such as
analytical specificity, recovery of added analyte, and linearity. PT/EQA can be most effective when it employs a single
validated target value (TV) for performance assessment, as use of peer group (method mean) TVs can perpetuate
measurement procedure differences.
C4 Type 1 Measurands
If the measurand is a well-defined chemical entity, which is always identical in structure wherever it is encountered,
assay systems can be devised that give measurement procedure-independent results that are traceable to an
International System of Units (SI) definition of the measurand, usually embodied in an internationally recognized primary
standard. Highly purified crystalline material may be prepared and weighed into a matrix with optimal accuracy and
precision. The main uncertainties involved here are those associated with measuring volumes and masses, which can be
reduced to a minimum.
Thus, for Type 1 measurands, the achievement oftraceability and trueness should be a relatively straightforward matter
where high order reference measurement systems exist. However, traceability and trueness of the end result of the
field measurement procedure is critically dependent on the analytical specificity of the measurement procedure for the
measurand. Where specificity is inadequate, accurate calibration cannot be achieved, because the system is responding
to other entities. Even if the calibrants used have traceable TVs, if the detection system is nonspecific, the end result will
not be traceable.
In an ideal situation, the following procedure should be in place for all Type 1 measurands:
1. Prepare and value assign a panel of unprocessed, single donation, patient sera with a wide range of endogenous
analyte concentrations, including those around important clinical decision points. They should be prepared
and values assigned by the established high order reference measurement procedure undertaken by a certified
reference laboratory that is a member of a certified reference laboratory network.
2. Store the samples from the panels ata recognized reference materials institution.
-An example of this arrangement is the cortisol reference panel prepared at the United Kingdom National
External Quality Assessment Service Birmingham, which is lodged at the Institute for Reference Materials and
Measurements in Belgium.3
3. Allow manufacturers to use samples of these panels in a classical split sample exercise at procedure launch and
each time they make revisions to the procedure calibrants. The slope of the regression line, and scatter about the
line and intercept, provide valuable information about analytical specificity, accuracy of calibration, and baseline
security.
4. Publish data in Pls and on manufacturer websites in the form of regression and difference plots in an agreed
standard format, so that users can compare the characteristics of measurement procedures.
© Clinical and Laboratory Standards Institute. All rights reserved.
77
Number 12
EP15-A3
Appendix G (Continued)
If this program were in place, assay system users would have a secure knowledge base with which they might compare
and assess their procedure's PT/EQA performance and that of their measurement procedure. PT/EQA providers can use
the same reference measurement system to assign TVs to their materials for performance assessment rather than using
peergroup means, whichdo nothingto improve comparability. It would also provide a strong incentive for the diagnostic
industry to improve trueness ratherthan perpetuatean unsatisfactory situation where different measurement
procedures within the same company can have markedly different results.
Verification of trueness bythe userforTypel measu rands would require access to the same high order reference
materials used bythe manufacturer. However, for cost and commutability reasons, routine laboratories would not
normally purchase these high order reference materials. They might also not be able to acquire reference panels such
as those described above, because the limited volumes available would require them to be reserved for manufacturers.
Nevertheless, procedures involving a variety of materials are given below. It might also be possible for laboratories to
perform recovery and linearity exercises if pure measurand is available off the shelf a nd can be spiked into a suitable
patient-like matrix. Similarly, interference exercises may be conducted. However, if a laboratory's EQA provider regularly
undertakes such exercises, then the laboratory only needs to participate to gain valuable information to assess trueness.
C5 Type 2 Measurands
If the measurand is not a single, well-defined chemical entity, but is ill defined and/or heterogeneous, having different
isoforms or biologically active fragments or precursors, then traceability of a result to an SI definition of the quantity
is impossible. The measurand contained in a standard cannot be asserted to have the same composition as that in a
biological fluid and the assay system may have different specificity forthe different forms of the measurand that produce
a signal in the assay system. A semantic difficulty exists here, in that one may use a name for a measurement (eg, human
chorionic gonadotropin), which gives the impression to the user that a single entity exists, but this practice is misleading.
A family of molecules with varying biological activity is involved, to which different assay systemswill usually have
varying reactivity.
For Type 2 measurands, standards are usually the World Health Organization (WHO) International Biological Reference
Preparation or International Standards (IS),4 prepared bythe National Institute for Biological Standards and Control5 in
the United Kingdom. These standards are sometimes of considerable age and often impure, with TVs that have been
established through a process of consensus of available field measurement procedures (often no longer in existence)
with varying specificity. Unitage is usually arbitrary (eg, U/L, mU/L), although there is a trend now with the advent of
recombinant materials and advanced mass spectrometry and amino acid analysis techniques to assign mass or molar
values to the newer materials. High order reference measurement procedures usually do not exist and a full traceability
chain cannot be established.
For Type 2 measurands, the user laboratory may be able to acquire samples of the IS from the WHO/National Institute
for Biological Standards and Control and use them as reference materials subject to the above caveats. However, if the
laboratory participates in a well-designed PT/EQA program that is routinely and regularly probing the calibration and
specificity of fie Id procedures, then there may be no need for these exercises, unless marked shifts in results indicate a
quality issue.
78
© Clinical and Laboratory Standards Institute. All rights reserved.
Volume 34
EP15-A3
Appendix C (Continued)
C6 Conclusion
Whichever type of measurand is involved, and whether or not reference measurement systems exist, all stakeholders
should aim to collaborate in efforts to improve trueness and comparability. It should be unacceptable for assay systems
to give markedly different results for common measurands. Highly mobile populations and the emergence of electronic
health care records require long-term stability and comparability of results across time and geography.
References for Appendix C
1 BIPM. JCTLM: Joint Committee for Traceability in Laboratory Medicine, http://www.bipm.org/en/committees/jc/
jctlm. Accessed August 15, 2014.
2 European Parliament and the Council. Directive 98/79/EC of the European Parliament and of the Council
of 27 October 1998 on in vitro diagnostic medical devices. http://eur-lex.europa.eu/LexUriServ/LexUriServ.
do?uri=CONSLEG:1998L0079:20120111:EN:PDF. Accessed August 15, 2014.
3 European Commission. Reference material details: ERM/IFCC-DA451. https://irrnm.jrc.ec.europa.eu/rmcatalogue/
detailsrmcatalogue.do?referenceMaterial=DA451%2B%2B%2B%2B%2B%2B%2B. Accessed August 15, 2014.
4 World Health Organization. WHO Expert Committee on Biological Standardization, http://www.who.int/
biologicals/expert_cornrnittee/en/. Accessed August 15,2014.
s NIBSC. Reference materials for use in the standardisation of biological medicines, http://www.nibsc.ac.uk/
products/reference_standards.aspx. Accessed August 15,2014.
© Clinical and Laboratory Standards Institute. All rights reserved.
79
Number 12
EPl 5-АЗ
The Quality Management System Approach
Clinical and Laboratory Standards Institute (CLSI) subscribes to a quality management system approach in the
development of standards and guidelines, which facilitates project management; defines a document structure via a
template; and provides a process to identify needed documents. The quality management system approach applies a
core set of "quality system essentials” (QSEs), basic to any organization, to all operations in any health care service's path
of workflow (ie, ope rational aspects that define how a particular product or service is provided). The QSEs providethe
framework for delivery of any type of product or service, serving as a manager's guide. The QSEs are as follows:
Organization
Customer Focus
Facilities and Safety
Personnel
Purchasing and Inventory
Equipment
Process Management
Documents and Records
Information Management
Nonconforming Event Management
Assessments
Continual Improvement
EP15-A3 addresses the QSE indicated by an"X." Fora description of the other documents listed in the grid, please refer
to the Related CLSI Reference Materials section on the following page.
Organization Customer Focus Facilities and Safety Personnel Purchasing and Inventory Equipment Process Management Documents and Records Information Management Nonconforming Event Management Assessments Continual Improvement
X
C24
EP05
EP06
EP09
EPIO EPIO
EP14
EP17
EP21
EP28
M29
QMS03
Copyrighted material licensed to O.lena Ramazanova on 2018-04-12 for licensee's use only. No further reproduction or networking is permitted. Distributed by Clarivate Analytics (US) LLC, www.techstreet.com, under license from Clinical and Laboratory Standards
80
© Clinical and Laboratory Standards Institute. All rights reserved.
Volume 34
EP15-A3
Related CLSI Reference Materials*
C24-A3 Statistical Quality Control for Quantitative Measurement Procedures: Principles and Definitions; Approved Guideline—Third Edition (2006). This guideline provides definitions of analytical intervals, planningof quality control procedures, and guidance for quality control applications.
EP05-A3 Evaluation of Precision of Quantitative Measurement Procedures; Approved Guideline—Third Edition (2014). This document provides guidance forevaluatingthe precision performance of quantitative measurement procedures. It is intended for manufacturers of quantitative measurement procedures and for laboratories that develop or modify such procedures.
EP06-A Evaluation of the Linearity of Quantitative Measurement Procedures: A Statistical Approach; Approved Guideline (2003). This document provides guidance for characterizing the linearity of a method during a method evaluation; for checking linearity as part of routine quality assurance; and for determining and stating a manufacturer's claim for linear range.
EP09-A3 Measurement Procedure Comparison and Bias Estimation Using Patient Samples; Approved Guideline—Third Edition (2013). This document addresses the design of measurement procedure comparison experiments using patient samples and subsequent data analysis techniques used to determine the bias between two in vitro diagnostic measurement procedures.
EP1O-A3- AMD Preliminary Evaluation of Quantitative Clinical Laboratory Measurement Procedures; Approved Guideline—Third Edition (2014). This guideline provides experimental design and data analysis for preliminary evaluation of the performance of a measurement procedure or device.
EP14-A3 Evaluation of Commutability of Processed Samples; Approved Guideline—Third Edition (2014). This document provides guidance for evaluating the commutablity of processed samples by determining if they behave differently than unprocessed patient samples when two quantitative measurement procedures are compared.
EP17-A2 Evaluation of Detection Capability for Clinical Laboratory Measurement Procedures; Approved Guideline—Second Edition (2012). This document provides gu id a nee for evaluation and documentation of the detection capability of clinical laboratory measurement procedures (ie, limits of blank, detection, and quantitation), for verification of manufacturers' detection capability claims, and for the proper use and interpretation of different detection capability estimates.
EP21-A Estimation of Total Analytical Error for Clinical Laboratory Methods; Approved Guideline (2003). This document provides manufacturers and end users with a means to estimate total analytical error for an assay. A data collection protocol and an analysis method, which can be used to judge the clinical acceptability of new methods using patient specimens, are included. These tools can also monitor an assay's total analytical error by using quality control samples.
* CLSI documents are continually reviewed and revised through the CLSI consensus process; therefore, readers should refer to the most
current editions.
© Clinical and Laboratory Standards Institute. All rights reserved.
81
Number 12
EP15-A3
Related CLSI Reference Materials (Continued)
EP28-A3c Defining, Establishing, and Verifying Reference Intervals in the Clinical Laboratory; Approved
Guideline—Third Edition (2010). This document contains guidelines for determining reference values
and reference intervals for quantitative clinical laboratory tests.
M29-A4 Protection of Laboratory Workers From Occupationally Acquired Infections; Approved
Guideline—Fourth Edition (2014). Based on US regulations, this document provides guidance on
the risk of trans miss ion of infectious agents by aerosols, droplets, blood, and body substances in a
laboratory setting; specific precautions for preventing the laboratory transmission of microbial infection
from laboratory instrumentsand materials; and recommendations for the management of exposure to
infectious agents.
QMS03-A3 Training and Competence Assessment; Approved Guideline—Third Edition (2009). This
document provides background information and recommended processes for the development of
training and competence assessment programs that meet quality and regulatory objectives.
StatisPro StatisPro™ (2013). This feature-rich, easy-to-use method evaluation software can be used for
establishing or verifying performance characteristics of a laboratory test method. This robust statistical
tool can report on precision, linearity, bias (related to trueness), comparability, reference intervals, limits of
detection, and limits of quantitation based on the most up-to-date CLSI guidelines.
82
© Clinical and Laboratory Standards Institute. All rights reserved.
Active Membership (As of 1 August 2014)
Industry and Large Commercial
Laboratories
Abbott (IL)
Abbott Point of Care Inc. (NJ)
AdvaMed (DC)
Aria Diagnostics (CA)
ARUP Laboratories (UT)
Astellas Pharma (IL)
AstraZeneca Pharmaceuticals (MA)
Astute Medical, Inc. (CA)
Axis-Shield PoC AS (United Kingdom [GB])
Bayer Healthcare, LLC Diagnostic Division (IN)
BD(NJ)
Beckman Coulter, Inc. (PA)
Bioanalyse, Ltd. (Turkey)
Biohit Oyj. (Finland)
BioMerieux, Inc. (ЛЛО)
Bio-Rad Laboratories, Inc. (CA)
Canon U.S. Life Sciences, Inc. (MD)
Cempra Pharmaceuticals, Inc. (NC)
Cepheid (CA)
Abbott (IL)
Abbott Point of Care Inc. (NJ)
Accelerate Diagnostics Inc. (AZ)
AdvaMed (DC)
ARH Regional Medical Center (KY)
ARUP Laboratories (UT)
Astellas Pharma (IL)
AstraZeneca Pharmaceuticals (MA)
Astute Medical, Inc. (CA)
Axis-Shield PoC AS (United Kingdom [GB])
Bayer Healthcare, LLC Diagnostic Division (KS)
BD(NJ)
Beckman Coulter (PA)
Bio-Rad Laboratories, Inc. (CA)
Bioanalyse, Ltd. (Turkey)
Biohit Oyj. (Finland)
Biomedia (Thailand) Co.,Ltd. (Thailand)
BioMerieux, Inc. (MO)
Canon U.S. Life Sciences, Inc. (MD)
Cempra Pharmaceuticals, Inc. (NC)
Cepheid (CA)
Cerexa, Inc. (CA)
Clinical Reference Laboratory (MO)
Cubist Pharmaceuticals, Inc. (MA)
Eiken Chemical Company, Ltd. (Japan)
Elanco Animal Health (IN)
EMH Regional Medical Center (OH)
Enzo Clinical Labs (NY)
Exosome Diagnostics, Inc. (MN)
Greiner Bio-One GmbH (Austria)
Greiner Bio-One Inc. (NC)
Guangzhou Daan Clinical Laboratory Center
Co. Ltd (China)
Himedia Labs Ltd (India)
Hinsdale Pathology Associates (IL)
Hologic, Inc. (AAA)
Icon Laboratories, Inc. (NY)
Instrumentation Laboratory (MA)
Johnson & Johnson Pharmaceutical Research
& Development, L.L.C. (NJ)
Kaiser Permanente (CA)
Laboratory Corporation of America (VA)
Life Laboratories (AAA)
LifeLabs (Canada)
LifeLabs Medical Laboratory Services (Canada)
AAbio Diagnostics, Inc. (CO)
Melinta Therapeutics, Inc. (CT)
Merck &t Company, Inc. (NJ)
Meria I Limited & Newport Laboratories (MO)
Microbiologies (MN)
Micromyx, LLC (AAI)
Myraqa, Inc. (CA)
Nihon Kohden Corporation (Japan)
Nissui Pharmaceutical Co., Ltd. (Japan)
Nova Biomedical Corporation (AAA)
NovaBiotics (United Kingdom [GB])
Novartis Institutes for Biomedical
Research (CA)
Ortho-Clinical Diagnostics, Inc. (NY)
Oxyrase, Inc. (OH)
PathCare Pathology Laboratory (South Africa)
PerkinElmer (Finland)
PerkinElmer Genetics, Inc. (PA)
Pfizer Inc (PA)
Phadia AB (Sweden)
Philips Healthcare Incubator (Netherlands)
QML Pathology (Australia)
Quest Diagnostics Nichols Institute (CA)
Radiometer Medical A/S (Denmark)
Roche Diagnostics Corporation (IN)
Sanofi Pasteur (PA)
Sarstedt, Inc. (NC)
Sekisui Diagnostics (MA)
Siemens Healthcare Diagnostics, Inc. (GA)
Sonic Healthcare USA (TX)
Streck Laboratories, Inc. (ME)
Sysmex America, Inc. (IL)
The Binding Site Group Ltd (United
Kingdom, [GB])
The Medicines Company (Canada)
Theranos (CA)
Theravance Inc. (CA)
Thermo Fisher Scientific (CA)
Thermo Scientific Microbiology Sdn Bhd
(Malaysia)
Ventana Medical Systems Inc. (AZ)
Verinata Health, Inc. (CA)
Viracor-IBT Reference Laboratory (MO)
Wellstat Diagnostics, LLC (MD)
XDx, Inc. (CA)
Zoetis (Ml)
Health Care Professions/Government
436 Medical Group - Dover Air Force Base (DE)
Aberdeen Royal Infirmary (United
Kingdom [GB])
Academisch Ziekenhuis-VUB (Belgium)
ACL Laboratories (Wl)
ACL Laboratories (IL)
ACM Medical Laboratory (NY)
Adams Memorial Hospital (IN)
Advanced Laboratory Services (PA)
Affiliated Laboratory, Inc. (ME)
AHS Morristown (NJ)
Akron Children's Hospital (OH)
Akron General Medical Center (OH)
Al Noor Hospital (United Arab Emirates)
Al Rahba Hospital (United Arab Emirates)
Alameda County Medical Center (CA)
Alaska Native Medical Center (AK)
Alaska Regional Hospital (AK)
Albany Medical Center Hospital (NY)
Alberta Health Services (Canada)
Alexandra Health Pte Ltd (Singapore)
Alfred I. du Pont Hospital for Children (DE)
All Children’s Hospital (FL)
Allegiance Health (Ml)
Alliance Community Hospital (OH)
Alpena Regional Medical Center (Ml)
Alta Bates Summit Medical Center (CA)
Altru Health Systems (ND)
Alverno Clinical Laboratories, Inc. (IN)
American Association for Clinical
Chemistry (DC)
American Association for Laboratory
Accreditation (MD)
American Bio-Clinical Laboratories (CA)
American Medical Technologists (VA)
American Society for Clinical Pathology (IL)
© Clinical and Laboratory Standards Institute. All rights reserved.
83
Active Membership (As of 1 August 2014)
American Society for Microbiology (DC)
American Society of Phlebotomy
Technicians (SC)
American Type Culture Collection (VA)
American University of Beirut Medical
Ce (Lebanon)
Ampath (South Africa)
Anderson Cancer Center (TX)
Ann & Robert H. Lurie Children’s Hospital of
Chicago (IL)
Anne Arundel Medical Center (MD)
Anson General Hospital (Canada)
Appalachian Regional Healthcare System (NC)
Applied Proteomics Inc (CA)
Arhus Universitets Hospital (Denmark)
Arizona State Health Laboratory (AZ)
Arkansas Children's Hospital (AR)
Armed Forces Health Surveillance Center
(AFHSC) (MD)
Arrowhead Regional Medical Center (CA)
Asan Medical Center (Korea, Republic of)
Asante Health System (OR)
Asia Pacific Regional - FH1360 (Thailand)
Asiri Group of Hospitals Ltd. (Sri Lanka)
ASPETAR (Qatar Orthopedic and Sports
Medicine Hospital) (Qatar)
Aspirus Wausau Hospital (Wl)
Associacao Das Pioneiras Sociais (Brazil)
Association of Public Health Laboratories (MD)
Atlantic Diagnostics Laboratories (PA)
Atlanticare Regional Medical Center (NJ)
Atrium Medical Center (OH)
Augusta Health (VA)
Aultman Hospital (OH)
Aultman North Canton Medical
Foundation (OH)
Austin State Hospital (TX)
Avera McKennan Laboratory (SD)
AZ Sint-Lucas Hospital (Belgium)
Azienda Ospedale Di Lecco (Italy)
Banyan Biomarkers (CA)
Baptist Health Medical Center (FL)
Baptist Health System (TX)
Baptist Hospital Laboratory (FL)
Baptist Hospital of Miami (FL)
Baptist Memorial Health Care Corporation -
Hospital Laboratories Works (TN)
Barnes-Jewish Hospital (VT)
Bassett Healthcare (NY)
Baton Rouge General (LA)
Baxter Regional Medical Center (AR)
Bay Area Hospital (OR)
Bay Medical Center (FL)
BayCare Health System (FL)
Bay front Medical Center (FL)
Bayhealth Medical Center-Kent General
Hospital (DE)
Baylor Health Care System (TX)
Baystate Medical Center (MA)
B.B.A.G. Ve U. AS., Duzen Laboratories (Turkey)
BC Centre for Disease Control (Canada)
Beaver Da mi Reference Lab (Wl)
Berlin Memorial Hospital (Wl)
Berwick Hospital Center (PA)
Beth Goldstein Consultant (PA)
Beth Israel Deaconess Medical Center (MA)
Beth Israel Medical Center (NY)
Bethesda AAemorial Hospital (FL)
Billings Clinic (ЛЛТ)
Bio-Reference Laboratories (NJ)
Biodesign Institute at ASU (AZ)
Biothera,The Immune Health Company (MN)
Blanchard Valley Hospital (OH)
Blount Memorial Hospital (TN)
Blue Mountain Health System (PA)
Bon Secours Health Partners (VA)
Bon Secours Hospital (Ireland)
Boyce & Bynum Pathology Labs (MO)
Bozeman Deaconess Laboratory (MT)
Braintree Rehabilitation Hospital (MA)
Brant Community Healthcare System/Brant
General Hospital (Canada)
Brazosport Regional Health System (TX)
Breathitt Veterinary Center, Murray State
University (KY)
Bridgeport Hospital (CT)
Bristol Hospital (CT)
British Columbia Institute of
Technology (Canada)
Brockvilie General Hospital (Canada)
Bronson Methodist Hospital (Ml)
Broward General Medical Center (FL)
Brownwood Regional Medical Center (TX)
Bryan Medical Center (NE)
BSA Health System (TX)
Cad ham Provincial Laboratory-MB
Health (Canada)
California Pacific Medical Center (CA)
Cambridge Health Alliance (АЛА)
Campbellford Memorial Hospital (Canada)
Canadian Science Center for Human and
Animal Health (Canada)
Canadian Society for Medical Laboratory
Science (Canada)
Canberra Hospital (Australia)
Cape Fear Valley Medical Center
Laboratory (NC)
Capital Health Regional AAedical Center (NJ)
Capital Region Medical Center (MO)
Care Medics (Canada)
Carle Foundation Hospital (IL)
Carolinas Healthcare System (NC)
Carolinas Hospital System (SC)
Carpermor S.A. de CV. (Mexico)
Carroll Hospital Center (MD)
Carteret General Hospital (NC)
Cary Medical Center (ME)
Castle Medical Center (HI)
Catholic Health Systems-Sisters of Charity
Hospital (NY)
Catholic Medical Center (NH)
Cayuga Medical Center at Ithaca (NY)
CD Diagnostics, Inc. (PA)
Cedars-Sinai Medical Center (CA)
Cedimat Medical Center (FL)
Center for Phlebotomy Education (IN)
Centers for Disease Control and
Prevention (GA)
Centers for AAedicare & Medicaid
Services (MD)
Central Baptist Hospital (KY)
Central Newfoundland Regional Health
Center (Canada)
Central Ohio Primary Care Physicians (OH)
Central Pennsylvania Alliance Laboratory (PA)
Central Washington Hospital (WA)
Centre Hospitalier Anna-Laberge (Canada)
Centre Hospitalier Lyon SUD (France)
Ceylon Hospitals Limited (Sri Lanka)
Chaleur Regional Hospital (Canada)
Chambersburg Hospital (PA)
Champlain Valley Physicians Hospital (NY)
Chesapeake General Hospital (VA)
Chester County Hospital (PA)
Chi Solutions, Inc. (Ml)
Children's Healthcare of Atlanta (GA)
Children's Hospital (AL)
Children's Hospital & Medical Center (NE)
Children's Hospital & Research Center At
Oakland (CA)
Copyrighted material licensed to Olena Ramazanova on 2018-04-12 for licensee's use only. No further reproduction or networking is permitted. Distributed by Clarivate Analytics (US) LLC, www.techstreet.com, under license from Clinical and Laboratory Standards
84
© Clinical and Laboratory Standards Institute. All rights reserved.
Active Membership (As of 1 August 2014)
Children's Hospital Boston (MA)
Children's Hospital of Central California (CA)
Children's Hospital of Philadelphia (PA)
Children's Hospitals and Clinics (MN)
Children's Medical Center (TX)
Childrens Hospital - Kings Daughters (VA)
Childrens Hospital Los Angeles (CA)
Childrens Hospital of Wisconsin (Wl)
Chino Valley Medical Center (CA)
Christiana Care Health Services (DE)
CHU-St. Justine (Canada)
Cibola General Hospital (NM)
Cincinnati Children's Hospital Medical
Center (OH)
Citizens Memorial Hospital (MO)
City of Hope National Medical Center (CA)
City of Milwaukee Health Department (Wl)
Cleveland Clinic (OH)
Clifton Fine Hospital (NY)
Clinica Hospital San Fernando (Panama)
Clinical Hospital Merkur (Croatia/Hrvatska)
CLMA (IL)
COLA (MD)
College of American Pathologists (IL)
College of Physicians and Surgeons of
Alberta (Canada)
College of Physicians and Surgeons of
Saskatchewan (Canada)
College of the North Atlantic (Canada)
College of Veterinary Medicine, Auburn
University (AL)
Collingwood General & Marine
Hospital (Canada)
Colorado State University (CO)
Columbia Memorial Hospital (NY)
Columbia Memorial Hospital (OR)
Commonwealth of Kentucky (KY)
Commonwealth of Virginia (DCLS) (VA)
Community College of Rhode Island-Flanagan
Campus (Rl)
Community Foundation of Northwest
Indiana: Community Hospital (IN)
Community Hospital of the Monterey
Peninsula (CA)
Community Hospitals of Williams County (OH)
Community Medical Center (MT)
Complexe Hospitalier de la Sagarnie (Canada)
CompuNet Clinical Laboratories (OH)
Concord Hospital (NH)
Coney Island Hospital (NY)
Consultants Laboratory of Wl LLC (Wl)
Contra Costa Regional Medical Center (CA)
Cook Children’s Medical Center (TX)
Cooper University Hospital (NJ)
Counties Manukau District Health Board,
Middl'emore Hospital (New Zealand)
Covenant Medical Center (TX)
Crozer-Chester Medical Center (PA)
CSSS Papineau/Hopital de Papineau (Canada)
CSSS St-Jerome (Canada)
Curry General Hospital (OR)
Dameron Hospital Association (CA)
Danat Al Emarat, Women and Children's
Hospital (United Arab Emirates)
Darwin Health Library, NT Dept, of
Health (Australia)
Daviess Community Hospital (IN)
Dayton Children's Medical Center (OH)
Deaconess Hospital Laboratory (IN)
Dean Medical Center (Wl)
Delano Regional Medical Center/
Laboratory (CA)
Delaware Public Health Laboratory (DE)
Delnor Community Hospital (IL)
Denver Health Medical Center (CO)
Department of Vetera ns Affairs (DC)
DHHS NC State Lab of Public Health (NC)
Diagnostic Accreditation Program (Canada)
Diagnostic Center for Population & Animal
Health (Ml)
Diagnostic Laboratory Medicine, Inc. (MA)
Diagnostic Laboratory Services, Inc. (HI)
Diagnostic Medicine Services (Iceland)
Diagnostic Services of Manitoba (Canada)
Dialysis Clinic, Inc. Laboratory (TN)
Dimensions Healthcare System Prince
George's Hospital Center (MD)
DMC University Laboratories (Ml)
Docro, Inc. (CT)
Doctor's Data, Inc. (IL)
Dominican University of California (CA)
Door County MedicaI Center (Wl)
Dr Sulaiman Al Habib Medical Group
(Saudi Arabia)
Driscoll Children’s Hospital (TX)
Drug Scan Inc. (PA)
DuBois Regional Medical Center (PA)
DUHS Clinical Laboratories (NC)
Duke University Medical Center (NC)
Dynacare Laboratory (Wl)
DynaLIFE (Canada)
East Georgia Regional Medical Center (GA)
East Houston Regional Medical Center (TX)
East Texas Medical Center (ETMC)
Henderson (TX)
East Texas Medical Center-Pittsburg (TX)
East Texas Medical Center - Tyler (TX)
Eastern Health Pathology (Australia)
Eastern Ontario Regional Laboratory
Association (EORLA) (Canada)
Easton Hospital (PA)
Edgerton Hospital & Health Services (Wl)
Edmonds Community College (WA)
Edward Hospital (IL)
Effingham Hospital (GA)
Emerson Hospital Laboratory (MA)
Emory University Hospital (GA)
Ephrata Community Hospital (PA)
Erie County Medical Center Corporation (NY)
Erlanger Health Systems (TN)
ESCMID (Switzerland)
EvangelicaI Community Hospital (PA)
Excela Health Latrobe Hospital (PA)
Exempla Lutheran Medical Center (CO)
Fairfax County Health Department (VA)
Fauquier Hospital (VA)
Fayette County Memorial Hospital (OH)
Federal Medical Center (MN)
Federal Medical Center Lexington (KY)
Firelands Regional Medical Center (OH)
Fisher-Titus Memorial Hospital (OH)
Fletcher Allen Health Care (VT)
Fleury S.A. (Brazil)
Floyd Memorial Hospital (IN)
Forrest General Hospital (MS)
Fort Defiance Indian Hospital (AZ)
Franklin Memorial Hospital (ME)
Fresno Community Hospital & Medical
Center (CA)
Fundacao Faculdadede Medicina (Brazil)
Fundacion Mexicana Para la Salud Capitulo
Peninsular A.C. (Mexico)
Gamma-Dynacare Laboratories (Canada)
Garden City Hospital (Ml)
Genesis Healthcare System (OH)
Genesis Medical Center (IL)
Genome DX (Canada)
Genova Diagnostic Laboratory (NC)
George Mason University (VA)
© Clinical and Laboratory Standards Institute. All rights reserved.
85
Active Membership (As of 1 August 2014)
German Society of Allergy and Clinical
Immunology (DGAKI) (Germany)
Ghent University Hospital (Belgium)
Glasgow Royal Infirmary (United
Kingdom [GB])
Good Samaritan Hospital (IN)
Good Samaritan Hospital Medical Center (NY)
Grana S.A. (TX)
Grand River Hospital (Canada)
Grays Harbor Community Hospital (WA)
Great Plains Regional Med. Ctr. (NE)
Greater Lowell Pediatrics (MA)
Grey Bruce Regional Health Center (Canada)
Group Health Cooperative (WA)
Grove City Medical Center (PA)
Guelph General Hospital (Canada)
Gunnison Valley Hospital (CO)
Guthrie Clinic Laboratories (PA)
H. Lee Moffitt Cancer Center (FL)
Halton Healthcare Services (Canada)
Hamad Medical Corp-DLMP LAB QM (Qatar)
Hamilton Regional Laboratory Medicine
Program - St. Joseph’s (Canada)
Hannibal Regional Hospital (MO)
Hanover General Hospital (PA)
Hardin Memorial Hospital (KY)
Hardy Diagnostics (CA)
Harford Memorial Hospital (MD)
Harris Methodist HEB Hospital (TX)
Harris Methodist Hospital Southwest (ГХ)
Hartford Hospital (CT)
Hawaii State Hospital (HI)
HCA (TN)
Healdsburg District Hospital (CA)
Health City Cayman Islands (Cayman Islands)
Health Canada (Canada)
Health Network Lab (PA)
Health Sciences North (Canada)
Heartland Health (MO)
Helen Hayes Hospital (NY)
Hendrick Regional Laboratory (TX)
Hendricks Regional Health (IN)
Hendry Regional Medical Center (FL)
Henry Ford Hospital (Ml)
Henry M. Jackson Foundation for the
Advancement of Military Medicine-MD (MD)
Henry M. Jackson Foundation-Brook Army
Medical Ctr (ВАМС) (TX)
Hera General Hospital (Saudi Arabia)
Hiawatha Community Hospital (KS)
Highlands Medical Center (AL)
Hill Country Memorial Hospital (TX)
Hillcrest Medical Center (OK)
Hoag Memorial Hospital Presbyterian (CA)
Holstebro Hospital (Denmark)
Holy Name Hospital (NJ)
Holy Redeemer Hospital & Medical Center (PA)
Holy Spirit Hospital (PA)
Holzer Health System (OH)
Hong Kong Accreditation Service Innovation
and Technology Commission (Hong Kong)
Hong Kong Sanatorium & Hospital
(Hong Kong)
Hopital Charles Lemoyne (Canada)
Hopital Cite de La Sante De Laval (Canada)
Hopital de Granby-CSSS Haute-
Yamaska (Canada)
Hopital du Haut-Richelieu (Canada)
Hopital Maisonneuve-Rosemont (Canada)
Hopital Santa Cabrini Ospedale (Canada)
Horizon Health Network (Canada)
Hospital Albert Einstein (Brazil)
Hospital Italiano Laboratorio
Central (Argentina)
Hospital Sacre-Coeur de Montreal (Canada)
Hotel Dieu Grace Hospital Library (Canada)
Houston Medical Center (GA)
Hunt Regional Healthcare (TX)
Hunterdon Medical Center (NJ)
Huntington Memorial Hospital (CA)
Huntsville Memorial Hospital (TX)
Hutchinson Clinic, P.A. (KS)
Hutt Valley Health District Health Board
(New Zealand)
IDEXX Reference Laboratories (Canada)
Imelda Hospital (Belgium)
Indiana University Health Bloomington
Hospital (IN)
Industrial Technology Research Institute
(ITRI) (Taiwan)
INEI-ANLIS Dr. C. G. Malbrain (Argentina)
Ingalls Hospital (IL)
Institut National de Sante Publique du
Quebec (Canada)
Institute Health Laboratories (PR)
Institute of Tropical Medicine Dept, of Clinical
Sciences (Belgium)
Institute of Veterinary Bacteriology
(Switzerland)
Integrated BioBank (Luxembourg)
Integrated Regional Laboratories (HCA) (FL)
Interior Health (Canada)
Intermountain Health Care Lab Services (UT)
International Accreditation New Zealand
(New Zealand)
International Federation of Clinical
Chemistry (Italy)
International Health Management Associates,
Inc. (IL)
Iredell Memorial Hospital (NC)
Italian Society of Clinical Biochemistry and
Clinical Molecular Biology (Italy)
IU Health Bedford, Inc. (IN)
Jackson County Memorial Hospital (OK)
Jackson Health System, (FL)
Jackson Hospital & Clinic, Inc. (AL)
Jackson Purchase Medical Center (KY)
Jameson Memorial Hospital (PA)
Jefferson Memorial Hospital (WV)
Jefferson Regional MedicaI Center (PA)
Jennings American Legion Hospital (LA)
Jessa Ziekenhuis VZW (Belgium)
John D. Archbold Hospital (GA)
John F. Kennedy Medical Center (NJ)
John H. Stroger, Jr. Hospital of Cook County (IL)
Johns Hopkins Medical Institutions (MD)
Johnson City MedicaI Center Hospital (TN)
Jonathan M. Wainwright Memorial Veterans
Affairs Medical Center (WA)
Jones Memorial Hospital (NY)
Jordan Valley Community Health Center (MO)
JPS Health Network (TX)
Kaiser Medical Laboratory (HI)
Kaiser Permanente (GA)
Kaiser Permanente (MD)
Kaiser Permanente Colorado (CO)
Kaiser Permanente Medical Care (CA)
Kaleida Health Center for Laboratory
Medicine (NY)
Kalispell Regional Medical Center (MT)
Kansas Department of Health &
Environment (KS)
Kansas State University (KS)
Kaohsiun Chang Gung Memorial Hospital
(Taiwan)
Karmanos Cancer Institute (Ml)
Karolinska University Hospital (Sweden)
KCHL St. Elisabeth Hospital (Netherlands)
Keck Hospital of USC (CA)
Keelung Chang Gung Memorial Hospital
(Taiwan)
Copyrighted material licensed to Olena Ramazanova on 2018-04-12 for licensee's use only. No further reproduction or networking is permitted. Distributed by Clarivate Analytics (US) LLC, www.techstreet.com, under license from Clinical and Laboratory Standards
86
© Clinical and Laboratory Standards Institute. All rights reserved.
Active Membership (As of 1 August 2014)
KehOra-Rainy River Regional Laboratory
Program (Canada)
Kenya Medical Laboratory Technicians and
Technologists Board (KMLTTB)
Kindred Healthcare (KY)
King Abdulaziz Hospital (Saudi Arabia)
King Fahad Specialist Hospital-Dammam,
K.S.A. (Saudi Arabia)
King Faisal Specialist Hospital & Research
Center (Saudi Arabia)
King Hussein Cancer Center (Jordan)
Kingston General Hospital (Canada)
KK Women's & Children's Hospital (Singapore)
Kuwait Cancer Control Center (Kuwait)
La Rabida Childrens Hospital (IL)
Lab Medico Santa Luzia LTDA (Brazil)
LABIN (Costa Rica)
Labor Stein + Kollegen (Germany)
Laboratoire National de Sante Publique (Haiti)
Laboratorio Bueso Arias (Honduras)
Laboratorio Clinic© Amadita P. de Gonzales
S.A. (DR)
Laboratorio de Referenda (FL)
Laboratorio Medico De Referencia (Colombia)
Laboratory Alliance of Central New York (NY)
Laboratory for Medical Microbiology and
Infectious Diseases (Netherlands)
Laboratory Medicin Dalarna (Sweden)
Laboratory of Clinical Biology Ziekenhuis Oost-
Limburg (ZOL) (Belgium)
LabPlus Auckland District Health Board
(New Zealand)
Labrador Grenfell Health (Canada)
LAC/USC Medical Center (CA)
Lafayette General Medical Center (LA)
La hey Hospital & Medical Center (MA)
Lake Charles Memorial Hospital (LA)
Lakeland Regional Laboratories (Ml)
Lakeland Regional AAedical Center (FL)
Lamb Healthcare Center (TX)
Lancaster General Hospital (PA)
Lanier Health Services (AL)
Lawrence and Memorial Hospitals (CT)
LeBonheur Children's Hospital (TN)
Legacy Laboratory Services (OR)
Leiden University Medical Center
(Netherlands)
Lewis-Gale Medical Center (VA)
LewisGale Hospital Montgomery (VA)
Lexington Medical Center (SC)
Licking Memorial Hospital (OH)
LifeCare Medical Center (MN)
Lithuanian Society of Laboratory Medicine
(Lithuania)
Little Company of Mary Hospital (IL)
Littleton Regional Healthcare (NH)
Lodi Health (CA)
Loma Linda University Medical Center
(LLUMC) (CA)
London Health Sciences Center (Canada)
Long Beach Memorial Medical Center-
LBMMC (CA)
Long Island Jewish Medical Center (NY)
Longmont United Hospital (CO)
Louisiana Office of Public Health
Laboratory (LA)
Louisiana State University Medical Ctr. (LA)
Lower Mainland Laboratories (Canada)
Loyola University Medical Center (IL)
LuminexCorporation (Wl)
Lutheran Hospital of Indiana Inc. (IN)
Lynchburg General (VA)
Lyndon B. Johnson General Hospital (TX)
AAA Dept, of Public Health Laboratories (AAA)
Mackenzie Health (Canada)
Magnolia Regional Health Center (MS)
Main Line Clinical Laboratories, Inc. Lankenau
Hospital (PA)
Mammoth Hospital Laboratory (CA)
AAargaret Mary Community Hospital (IN)
Margaret R. Pardee Memorial Hospital (NC)
Maria Parham Medical Center (NC)
Mariaziekenhuis vzw (Belgium)
Marion County Public Health Department (I N)
Marshall Medical Center South (AL)
Marshfield Clinic (Wl)
Martha Jefferson Hospital (VA)
Martha's Vineyard Hospital (MA)
Martin Luther King, Jr./Drew Medical
Center (CA)
Martin Memorial Health Systems (FL)
Mary Black Memorial Hospital (SC)
Mary Greeley AAedical Center (IA)
Mary Hitchcock Memorial Hospital (NH)
Mary Washington Hospital (VA)
Massachusetts General Hospital (AAA)
Mater Health Services - Pathology (Australia)
Maury Regional Hospital (TN)
Mayo Clinic (MN)
McAllen Medical Center (TX)
McCullough-Hyde Memorial Hospital (OH)
MCG Health (GA)
McGill University Health Center (Canada)
MCN Healthcare (CO)
MD Tox La boratoi res (CA)
Meadows Regional AAedical Center (GA)
Med Health Services Laboratory (PA)
Medecin Microbiologiste (Canada)
Media Lab, Inc. (GA)
Medical Center Hospital (TX)
Medical Center of Central Georgia (GA)
Medical Centre Ljubljana (Slovenia)
Medical College of Virginia Hospital (VA)
Medical University Hospital Authority (SC)
Medical, Laboratory & Technology
Consultants, LLC (DC)
Medlab Ghana Ltd. (Ghana)
Memorial Health System (CO)
Memorial Hermann Healthcare System (TX)
Memorial Hospital (PA)
Memorial Hospital ofTexas County (OK)
Memorial Hospital of Union City (OH)
Memorial Medical Center (IL)
Memorial Regional Hospital (FL)
Memorial Sloan Kettering Cancer Center (NY)
Menonnite General Hospital (PR)
Mercy Franciscan Mt. Airy (OH)
Mercy Hospital (MN)
Mercy Hospital (IA)
Mercy Hospital of Franciscan Sisters (IA)
Mercy Hospital of Tiffin (OH)
Mercy Hospital St. Louis (АЛО)
Mercy Integrated Laboratories/Mercy St.
Vincent (OH)
Mercy Medical Center (CA)
Mercy Medical Center (MD)
Mercy AAedical Center (IA)
Mercy Medical Center (OH)
Mercy Regional Medical Center (OH)
Meritus Medical Laboratory (MD)
Methodist Dallas Medical Center (TX)
Methodist Healthcare (TN)
Methodist Hospital (TX)
Methodist Hospital Pathology (NE)
Methodist Sugarland Hospital (TX)
MetroHealth AAedical Center (OH)
Metropolitan Medical Laboratory (IL)
Michigan Department of Community
Health (Ml)
Microbial Research, Inc. (CO)
MicroPath Laboratories. (FL)
© Clinical and Laboratory Standards Institute. All rights reserved.
87
Active Membership (As of 1 August 2014)
Mid America Clinical Laboratories (IN)
Mid Coast Hospital (ME)
Middelheim General Hospital (Belgium)
Middlesex Hospital (CT)
Midland Memorial Hospital (TX)
Midwestern Regional Medical Center (IL)
Mile Bluff Medical Center/Hess Memorial
Hospital (Wl)
Milford Regional Hospital (АЛА)
Minneapolis Community and Technical
College (MN)
Minneapolis Medical Research
Foundation (MN)
Minnesota Department of Health (MN)
Mira Vista Diagnostics (IN)
Mission Hospitals Laboratory (NC)
Mississippi Baptist Medical Center (MS)
Mississippi Public Health Laboratory (MS)
Missouri State Public Health Laboratory (MO)
MolecularMD (OR)
Monadnock Community Hospital (NH)
Monongahela Valley Hospital (PA)
Monongalia General Hospital (WV)
Montana Department of Public Health and
Human Services (MT)
Montefiore Medical Center (NY)
Morehead Memorial Hospital (NC)
Mount Nittany Medical Center (PA)
Mt. Sinai Hospital (Canada)
Mt. Sinai Hospital - New York (NY)
Mt. Sinai Hospital Medical Center (IL)
MultiCare Health Systems (WA)
Munson AAedical Center (Ml)
Muskoka Algonquin Healthcare (Canada)
Nacogdoches Memorial Hospital (TX)
Nanticoke Memorial Hospital (DE)
Nash General Hospital/Laboratory (NC)
National Cancer Institute (MD)
National Cancer Institute, CCR, LP (MD)
National Directorate for Medical Assistance
(DNAM) (Mozambique)
National Food Institute Technical University of
Denmark (Denmark)
National Health Laboratory Service C/O F&M
Import & Export Services (South Africa)
National Heart Institute (Institut Jantung
Negra) (Malaysia)
National Institute of Health-Maputo,
Mozambique (Mozambique)
National Institute of Standards and
Technology (MD)
National Pathology Accreditation Advisory
Council (Australia)
National Society for Histotechnology,
Inc. (MD)
National University Hospital (Singapore) Pte
Ltd (Singapore)
National University of Ireland, Galway
(NUIG) (Ireland)
National Veterinary Institute (Sweden)
Nationwide Children's Hospital (OH)
Naval Hospital Lemoore (CA)
NB Department of Health (Canada)
Nebraska LabLine (NE)
Netlab SA (Ecuador)
New Brunswick Community College (Canada)
New Brunswick Provincial Veterinary
Laboratory (Canada)
New Dar Al Shifa Hospital - Kuwait (Kuwait)
New England Baptist Hospital (MA)
New Hampshire Public Health Labs. (NH)
New' Hanover Regional Medical Center (NC)
New Lexington Clinic (KY)
New London Hospital (NH)
New Medical Centre Hospital (United
Arab Emirates)
New'York City Department of Health and
Mental Hygiene (NY)
New York Eye and Ear Infirmary (NY)
New York Presbyterian Hospital (NY)
New York State Department of Health (NY)
New Zealand Blood Service (New Zealand)
Newark Beth Israel Medical Center (NJ)
Newborn Metabolic Screening Programi/
Alberta Health Services (Canada)
Newman Regional Health (KS)
Niagara Health System (Canada)
NICL Laboratories (IL)
Ninewells Hospital and Medical School
(United Kingdom [GB])
NorDx- Scarborough Campus (ME)
North Bay Regional Health Center (Canada)
North Carolina Baptist Hospital (NC)
North Colorado Medical Center (CO)
North Dakota Department of Health (ND)
North District Hospital (China)
North Kansas City Hospital (MO)
North Oaks Medical Center (LA)
North Shore Hospital Laboratory
(New Zealand)
North Shore Medical Center (MA)
North Shore-Long Island Jewish Health
System Laboratories (NY)
Northeast Georgia Health System (GA)
Northfield Hospital & Clinics (MN)
Northside Hospital (GA)
Northside Medical Center (OH)
Northumberland Hills Hospital (Canada)
Northwest Arkansas Pathology Associates (AR)
Norton Healthcare (KY)
Nova Scotia Association of Clinical Laboratory
Managers (Canada)
Nova Scotia Community College (Canada)
NSW Health Pathology (Australia)
NSW Health Pathology, Sydney South West
Pathology Service (Australia)
NTD Laboratories Inc (NY)
NW Physicians Lab (WA)
Oakton Community College (IL)
Ochsner Clinic Foundation (LA)
Oconee Memorial Hospital (SC)
Octapharma Plasma (NC)
Odense University Hospital (Denmark)
Office of Medical Services Laboratory (DC)
Ohio Department of Health Lab (OH)
Ohio State University Hospitals (OH)
Oklahoma Heart Hospital, LLC (OK)
Oklahoma State University: Center for Health
Sciences (OK)
01 iveView-UCLAMedical Center (CA)
Olmsted Medical Center Laboratory (MN)
Oneida Healthcare Center (NY)
Ontario Medical Association Quality
Management Program-Laboratory
Service (Canada)
Onze Lieve Vrouwziekenhuis (Belgium)
Orange County Community College (NY)
Orange Park Medical Center (FL)
Ordre Professionnel DesTechnologistes
Medicaux Du Quebec (Canada)
Oregon Health and Science University (OR)
Oregon Public Health Laboratory (OR)
Orillia Soldiers AAemorial Hospital (Canada)
Orlando Health (FL)
OSF - Saint Anthony Medical Center (IL)
OSU Veterinary Diagnostic Laboratory (OR)
OU Medical Center (OK)
Overlake Hospital Medical Center (WA)
Ozarks Medical Center (MO)
PA Veterinary Laboratory (PA)
Pacific Diagnostic Laboratories (CA)
Copyrighted material licensed to Olena Ramazanova on 2018-04-12 for licensee's use only. No further reproduction or networking is permitted. Distributed by Clarivate Analytics (US) LLC, www.techstreet.com, under license from Clinical and Laboratory Standards
88
© Clinical and Laboratory Standards Institute. All rights reserved.
Active Membership (As of 1 August 2014)
Palmetto Baptist Medical Center (SC)
Palmetto Health Baptist Easley (SC)
Palo Alto Medical Foundation (CA)
Park Nicollet Methodist Hospital (MN)
Parkview Adventist Medical Center (ME)
Parkview Health Laboratories (IN)
Parkwest Medical Center (TN)
Parrish Medical Center (FL)
Pathgroup (TN)
Pathlab (IA)
Pathology Associates Medical Lab. (WA)
PathWest Laboratory Medicine WA (Australia)
Pavia Hospital Santurce (PR)
PeaceHealth Laboratories (OR)
Peninsula Regional Medical Center (MD)
Penn State Hershey Medical Center (PA)
Pennsylvania Dept, of Health (PA)
Pennsylvania Hospital (PA)
Peoria Tazewell Pathology Group, P.C. (IL)
PEPFAR President's Emergency Plan for AIDS
Relief: PEPFAR Nigeria: Medical Laboratory
Sciences Council of Nigeria
PEPFAR President's Emergency Plan for AIDS
Relief: PEPFARTanzania: Centers for Disease
Control and Prevention - Tanzania
PEPFAR President's Emergency Plan for AIDS
Relief: PEPFAR Tanzania: Ministry of Health
and Social Welfare - Tanzania
PEPFAR President's Emergency Plan for AIDS
Relief: PEPFARZambia: Centers for Disease
Control and Prevention - Zambia
PEPFAR President's Emergency Plan for AIDS
Relief: PEPFAR Zambia: Ministry of Health -
Zambia
PerkinElmer Health Sciences, Inc. (SC)
Peterborough Regional Health Centre
(Canada)
PHIA Project, NER (CO)
Phlebotomy Training Specialists (CA)
Phoenix Children's Hospital (AZ)
Phoenixville Hospital (PA)
PHS Indian Hospital (MN)
Physicians Choice Laboratory Services (NC)
Physicians Laboratory & SouthEast
Comm unity College (NE)
Physicians Preferred Laboratory (TX)
Placer County Public Health Laboratory (CA)
Portneuf Medical Center (ID)
Poud re Valley Hospital (CO)
Prairie Lakes Hospital (SD)
Presbyterian/St. Luke's Medical Center (CO)
Preventive Medicine Foundation (Taiwan)
Prince of Wales Hospital (Hong Kong)
Princess Margaret Hospital (Hong Kong)
Proasecal LTD (Colombia)
ProMedica Laboratory Toledo Hospital (OH)
Providence Alaska Medical Center (AK)
Providence Everett MedicaI Center (WA)
Providence Health Services, Regional
Laboratory (OR)
Providence Hospital (AL)
Providence St. Mary Medical Center (WA)
Provista Diagnostics (AZ)
Public Health Ontario (Canada)
Pullman Regional Hospital (WA)
Queen Elizabeth Hospital (Canada)
Queen Elizabeth Hospital (China)
Queensland Health Pathology Services
(Australia)
Quest - A Society for Adult Support and
Rehabilitation (Canada)
Quinte Healthcare Corporation - Belleville
General (Canada)
Quintiles Laboratories, Ltd. (United
Kingdom [GB])
Ramathibodi Hospital (Thailand)
Range Regional Health Services (Fairview
Range) (MN)
Rapides Regional Medical Center (LA)
RCPA Quality Assurance Programs Pty Limited
(Australia)
Redlands Community Hospital (CA)
Regina Qu'Appelle Health Region (Canada)
Regional Laboratory of Public Health
(Netherlands)
Regional Medical Laboratory, Inc. (OK)
Rehoboth McKinley Christian Health Care
Services (NM)
Renown Regional Medical Center (NV)
Research Institute of Tropical Medicine
(Philippines)
Rhode Island Hospital (Rl)
Rice Memorial Hospital (MN)
Ridgeview Medical Center (MN)
Riverside Community Hospital (CA)
Riverside Health System (VA)
Riverside Medical Center (IL)
Robert Wood Johnson University Hospital (NJ)
Robert Wood Johnson University Hospital
Rahway (NJ)
Rochester General Hospital (NY)
Roger Williams Medical Center (Rl)
Roper St. Francis Healthcare (SC)
Ross University School of Veterinary Medicine
(Saint Kitts and Nevis)
Roswell Park Cancer Institute (NY)
Royal Hobart Hospital (Australia)
Royal Victoria Hospital (Canada)
Rush Copley Medical Center (I L)
Rush Health Systems (MS)
Russellville Hospital (AL)
SA Pathology at Women's and Children's
Hospital (Australia)
Sacred Heart Hospital (Wl)
Sacred Heart Hospital (FL)
Saddleback Memorial Medical Center (CA)
Saint Francis Hospital & Medical Center (CT)
Saint Francis Medical Center (IL)
Saint Mary's Regional Medical Center (NV)
Salem Hospital (OR)
Salisbury University (MD)
Samkwang Medical Laboratory (Korea,
Republic of)
Sampson Regional AAedical Center (NC)
Samsung Medical Center (Korea, Republic of)
San Angelo Community Medical Center (TX)
San Francisco General Hospital-University of
California San Francisco (CA)
San Jose State University (CA)
San Juan Regional Medical Group (NM)
Sanford Health (ND)
Sanford USD Medical Center (SD)
Santa Clara Valley Health & Hospital
Systems (CA)
Sarasota Memorial Hospital (FL)
Saratoga Hospital (NY)
SARI Laboratoire Caron (France)
Saskatchewan Disease Control Laboratory
(Canada)
Saskatoon Health Region (Canada)
Saudi Aram co Medical (TX)
SC Department of Health and Environmental
Control (SC)
Schneider Regional AAedical Center (Virgin
Islands [USA])
Scientific Institute of Public Health (Belgium)
Scott & White Memorial Hospital (TX)
Scripps Health (CA)
Scuola Di Specializzaaione- University Milano
Bicocca (Italy)
Seattle Cancer Care Alliance (WA)
Seattle Children's Hospital/Children's Hospital
and Regional Medical Center (WA)
© Clinical and Laboratory Standards Institute. All rights reserved.
89
Active Membership (As of 1 August 2014)
Sentara Healthcare (VA)
Sentinel CH SpA (Italy)
Seoul National University Hospital (Korea,
Republic of)
Seton Healthcare Network (TX)
Seton Medical Center (CA)
Shands Jacksonville (FL)
Shanghai Centre for Clinical Laboratory
(China)
Sharon Regional Health System (PA)
Sharp Health Care Laboratory Services (CA)
Shiel Medical Laboratory Inc. (NY)
Shore Memorial Hospital (NJ)
Shriners Hospitals for Children (OH)
Silliman Medical Center (Philippines)
SIMeL (Italy)
Singapore General Hospital (Singapore)
Singulex (CA)
Slidell Memorial Hospital (LA)
SMDC Clinical Laboratory (MN)
Sociedad Espanola de Bioquimica Clinica у
Patologia Molec. (Spain)
Sociedade Brasileira de Analises Clinicas
(Brazil)
Sociedade Brasileira de Patologia Clinica
(Brazil)
Sonora Regional Medical Center (CA)
South Bay Hospital (FL)
South Bend Medical Foundation (IN)
South Bruce Grey Health Centre (Canada)
South County Hospital (Rl)
South Dakota State Health Laboratory (SD)
South Eastern Area Laboratory Services
(Australia)
South Miami Hospital (FL)
South Peninsula Hospital (AK)
South West Medical Center (KS)
Southeast Alabama Medical Center (AL)
SouthEast Alaska Regional Health Consortium
(SEARHC) (AK)
Southern Health Care Network (Australia)
Southern Hills Medical Center (TN)
Southwest General Health Center (OH)
Southwestern Regional Medical Center (OK)
Sparrow Hospital (Ml)
Speare Memorial Hospital (NH)
Spectra East (NJ)
St Elizabeth Hospital (Wl)
St Rose Dominican Hospital (AZ)
St. Agnes Healthcare (MD)
St. Anthony Hospital (OK)
St. Anthony Shawnee Hospital (OK)
St. Antonius Ziekenhuis (Netherlands)
St. Barnabas Medical Center (NJ)
St. Clair Hospital (PA)
St. David's Medical Center (TX)
St. David's South Austin Hospital (TX)
St. Elizabeth Community Hospital (CA)
St. Elizabeth's Medical Center (NY)
St. Eustache Hospital (Canada)
St. Francis Hospital (SC)
St. Francis Hospital & Health Centers (NY)
St. Francis Medical Center (LA)
St. John Hospital and Medical Center (Ml)
St. John's Hospital (IL)
St. John's Hospital (WY)
St. John's Hospital Health Center (CA)
St. John's Regional Health Center (MO)
St. Joseph Health Center (MO)
St. Joseph Health System (CA)
St. Joseph Hospital (NH)
St. Joseph Medical Center (TX)
St. Joseph Mercy - Oakland (Ml)
St. Joseph Regional Health Center (ГХ)
St. Joseph’s Hospital & Medical Center (AZ)
St. Jude Children's Research Hospital (TN)
St. Jude Medical Center (CA)
St. Luke's Episcopal Hospital (TX)
St. Luke's Hospital (IA)
St. Luke's Hospital (MN)
St. Luke's Hospital (MO)
St. Luke's Hospital (PA)
St. Luke's Hospital at The Vintage (TX)
St. Luke's Medical Center (AZ)
St. Luke's Regional Medical Center (ID)
St. Mark’s Hospital (UT)
St. Mary Medical Center (CA)
St. Mary Medical Center (PA)
St. Mary's Good Samaritan (IL)
St. Mary's Health Care System (GA)
St. Mary's Health Center (MO)
St. Mary's Healthcare (NY)
St. Mary’s Hospital (CO)
St. Mary's Hospital (NJ)
St. Mary's Hospital (Wl)
St. Michael's Hospita l/Mi nistry Health
Care (Wl)
St. Nicholas Hospital (Wl)
St. Peter's Bender Laboratory (NY)
St. Peter's Hospital (MT)
St. Rita's Medical Center (OH)
St. Rose Hospital (CA)
St. Tammany Parish Hospital (LA)
St. Thomas Hospital (TN)
St.Thomas-Elgin General Hospital (Canada)
St. Vincent's Medical Center (FL)
Stanton Territorial Health Authority (Canada)
Stat Veterinary Lab (CA)
State of Alabama (AL)
State of Washington Public Health Labs (WA)
Statens Serum Institut (Denmark)
Steward Norwood Hospital (АЛА)
Stillwater Medical Center (OK)
Stony Brook University Hospital (NY)
Stormont-Vail Regional Medical Ctr. (KS)
Strong Memorial Hospital (NY)
Sturgis Hospital (Ml)
Summa Barberton Hospital (OH)
SUNY Downstate Medical Center (NY)
Susquehanna Health System (PA)
Sutter Health (CA)
Sutter Health Sacramento Sierra Region
Laboratories (CA)
SV Biosystems (CA)
Swedish American Health System (IL)
Tahoe Forest Hospital (CA)
Taiwan Society of Laboratory Medicine
(Taiwan)
Tallaght Hospital (Ireland)
Tampa General Hospital (FL)
Taranaki Medlab (New Zealand)
Tartu University Clinics (Estonia)
Tataa Biocenter (Sweden)
Temple University Hospital - Parkinson
Pavilion (PA)
Tenet Healthcare (PA)
Tennessee Department of Health (TN)
Tewksbury Hospital (MA)
Texas A & M University (TX)
Texas Children's Hospital (TX)
Texas Department of State Health
Services (TX)
Texas Health Harris Methodist Hospital Fort
Worth (TX)
Texas Health Presbyterian Hospital Dallas (TX)
Texas Scottish Rite Hospital for Children (TX)
The Charlotte Hungerford Hospital (CT)
The Cheshire Medical Center (NH)
The Children's Mercy Hospital (MO)
The Doctor's Clinic (OR)
Copyrighted material licensed to Olena Ramazanova on 2018-04-12 for licensee's use only. No further reproduction or networking is permitted. Distributed by Clarivate Analytics (US) LLC, www.techstreet.com, under license from Clinical and Laboratory Standards
90
© Clinica! and Laboratory Standards Institute. All rights reserved.
Active Membership (As of 1 August 2014)
The Good Samaritan Hospital (PA)
The Hospital for Sick Children (Canada)
The Korean Society for Laboratory Medicine
(Republic of Korea)
The Michener Institute for Applied Health
Sciences (Canada)
The Naval Hospital of Jacksonville (FL)
The Nebraska Medical Center (NE)
The Norwegian Institute of Biomedical
Science (Norway)
The Permanente Medical Group, Inc. (CA)
The University of Texas Medical Branch (TX)
The University of Tokyo (Japan)
Thomas Jefferson University Hospital, Inc. (PA)
Thomas Memorial Hospital (WV)
Timmins and District Hospital (Canada)
Torrance AAemorial Medical Center (CA)
Touro Infirmary (LA)
Tri-Cities Laboratory (WA)
TriCore Reference Laboratories (NM)
Trillium Health Partners CreditValley
Hospital (Canada)
Trinity Medical Center (AL)
Trinity Muscatine (IA)
Tucson Medical Center (AZ)
Tuen Mun Hospital, Hospital Authority
(Hong Kong)
Tufts Medical Center (АЛА)
Tulane MedicaI Center Hospital & Clinic (LA)
Tulane University Health Sciences Center (LA)
Twin Lakes Regional MedicaI Center (KY)
U.S. Medical Center for Federal Prisoners (MO)
UC Davis Medical Center Department of
Pathology & Laboratory Medicine (CA)
UC San Diego Health System Clinical
Laboratories (CA)
UCI Medical Center (University of California,
Irvine) (CA)
UCLA Medical Center (CA)
UCONM Health Center (CT)
UCSF Medical Center China Basin (CA)
UMass Memorial Medical Center (MA)
UMC of El Paso- Laboratory (TX)
UMC of Southern Nevada (NV)
Umea University Hospital (Sweden)
UNC Hospitals (NC)
United Christian Hospital (Hong Kong)
United Clinical Laboratories (IA)
United Health Services Hospital/Wilson
Hospital Laboratory (NY)
United Memorial MedicaI Center (NY)
United States Coast Guard (NJ)
Universidad de Guadala jara (Mexico)
UniversitairZiekenhuis Antwerpen (Belgium)
University College Hospital (Ireland)
University General Hospital (TX)
University Health Network (Canada)
University Hospital (TX)
University Hospital Center Sherbrooke
(CHUS) (Canada)
University Hospital of Northern BC (Canada)
University Hospitals of Cleveland (OH)
University Medical Center (TX)
University of Alabama at Birmingham (AL)
University of Alabama Hospital
Laboratory (AL)
University of Arizona Medical Center (AZ)
University of Bonn (Germany)
University of California Veterinary Medical
Teaching Hospital (CA)
University of Chicago Hospitals (IL)
University of Cologne Medical Center
(Germany)
University of Colorado Denver, Anschutz
Medical Campus (CO)
University of Colorado Hospital (CO)
University of Guelph (Canada)
University of Idaho (ID)
University of Illinois Medical Center (IL)
University of Iowa Hospitals and Clinics (IA)
University of Iowa, Hygienic Lab (IA)
University of Louisville Hospital (KY)
University of Maryland Medical System (MD)
University of Miami (FL)
University of Michigan, Department of
Pathology (Ml)
University of Minnesota Medical Center-
Fairview (MN)
University of Missouri Hospital (MO)
Universityof North Carolina - Health
Services (NC)
University of Oregon (OR)
University of Pennsylvania (PA)
University of Pennsylvania Health System (PA)
University of Pittsburgh Medical Center (PA)
University of Prince Edward Island Atlantic
Veterinary College (Canada)
Universityof Rochester Medical Center (NY)
Universityof South Alabama Medical
Center (AL)
University of Tasmania (Australia)
University of Texas Health Center (Tyler) (TX)
University of Texas Health Science Center (TX)
University of Texas Southwestern Medical
Center (TX)
Universityof Utah Hospital & Clinics (UT)
University of Virginia Medical Center (VA)
University of Washington Medical Center (WA)
University of Wisconsin Health (Wl)
UPMC Bedford Memorial (PA)
Uvalde Memorial Hospital (TX)
UZ-KUL Medical Center (Belgium)
VA (Bay Pines) Medical Center (FL)
VA (Indianapolis) Medical Center (IN)
VA (Miami) Medical Center (FL)
VA (Tampa) Hospital (FL)
VA (Tuscaloosa) Medical Center (AL)
Va i I Va I ley Med ica I Center (CO)
Valley Medical Center (WA)
Vancouver Island Health Authority (SI)
(Canada)
Vanderbilt University MedicaI Center (TN)
Vejle Hospital (Denmark)
Vernon Memorial Hospital (Wl)
Via Christi Hospitals - Wichita (KS)
Vibrant America LLC (CA)
Vidant Medical Center (NC)
Virginia Mason Medical Center (WA)
Virginia Physicians, Inc. (VA)
Virtua - West Jersey Hospital (NJ)
WakeMed (NC)
Waterbury Hospital (CT)
Watson Clinic (FL)
Wayne Healthcare (OH)
Wayne Memorial Hospital (GA)
Weeneebayko General Hospital (Canada)
Weirton Medical Center (WV)
Wellstar Health Systems (GA)
Wenatchee Valley Medical Center (WA)
Wesley Medical Center (KS)
West Georgia Health Systems (GA)
West Kendall Baptist Hospital (FL)
West Shore Medical Center (Ml)
West Valley Medical Center Laboratory (ID)
West Virginia University Hospitals (WV)
Westchester Medical Center (NY)
Western Healthcare Corporation (Canada)
Western Maryland Regional Medical
Center (MD)
Western Missouri Medical Center (MO)
Western Reserve Hospital (OH)
Western State Hospital (VA)
© Clinical and Laboratory Standards Institute. All rights reserved.
91
Active Membership (As of 1 August 2014)
Whangarei Hospital (New Zealand)
Wheaton Franciscan Laboratories at
St. Francis (Wl)
Wheeling Hospital (WV)
Whitehorse General Hospital (Canada)
Whitman Hospital & Medical Center (WA)
Wickenburg Community Hospital (AZ)
William Beaumont Army Medical Center (TX)
William Osler Health Centre (Canada)
Williamson Medical Center (TN)
Winchester Hospital (MA)
Winter Haven Hospital, Inc. (FL)
Wisconsin State Laboratory of Hygiene (Wl)
Women & Infants Hospital (Rl)
Women's and Children's Hospital (LA)
Woodside Health Center (Canada)
World Health Organization (Switzerland)
WuXi AppTec Co., Ltd. (China)
Wyckoff Heights Medical Center (NY)
Yale New Haven Hospital (CT)
York General Health Care Services (NE)
York Hospital (PA)
Yukon-Kuskokwim Delta Regional
Hospital (AK)
Yuma Regional Medical Center (AZ)
Individuals
Mohamed О Abdelhalim (Oman)
Franklin Adkinson (MD)
ParkAeJa (Korea, Republic of)
Shana Ahmad (NY)
Fayha Ahmed (United Kingdom [GB])
Lawai Akeem (Nigeria)
Evelyn W. Akers (NY)
Ahmed M. Al barrag (Saudi Arabia)
Erika В Ammirati (CA)
Mohammed Attaelmannan (MA)
Chris Aug (CT)
Ahmed M Azaybi (Saudi Arabia)
Cary Baird (OH)
Amy Baracz (CA)
Susan Barber (NC)
Colette Batog (PA)
Joanne Becker (NY)
Nancy Behling (AZ)
Lynn Bell (IN)
Steven Beilistri (PA)
Melissa Bennett (Canada)
Dr. Lynette Y Berkeley PhD (MD)
Ms. Lucia M. Berte MT(ASCP) SBB, DLM;
CQA(ASQ) CMQ/OE (CO)
Bhaskar Bhattacharya (India)
Elma Kamari Bidkorpeh (CA)
Abbejane Blair (MA)
Dennis Bleile (CA)
Ms. Susan Bionshine RRT, RPFT, FAARC (Ml)
Fran Boemer (Belgium)
Elizabeth Brown (PA)
Steven Brown (OR)
Carey-Ann Burnham (MO)
Karen Bush (IN)
Donald R Callihan (MD)
Rebecca Cameron (MS)
Ms. Natalie Campbell RT (Canada)
Sheldon Campbell (CT)
Alan T. Cariski (CA)
A. Bjoern Carle (ME)
Dr. Maria Paz Carlos DVM, PhD, MBA (MD)
Eileen Carreiro-Lewandowski (MA)
Dr. Alexis Carter MD, FCAP, FASCP (GA)
Dr. Jose B. Casals (Denmark)
Ning Cegielski (WA)
Emily Chang (VA)
Mintrude Charles-Young (Canada)
Denise Choriey (CA)
W. Gregory Cooper, LLC (TX)
Wi Ilia mi A Coughlin (VT)
Pauline Cyr (Canada)
Redintor Dagos (Philippines)
Dr. Jeff Dahlen PhD (CA)
Im el da Daniel (CA)
Saffiatou Darboe (Gambia)
Ms. Arlene Darmanie MS (Trinidad
a nd Tobago)
Dr. Trivikram Dasu PhD (Wl)
Ms. Diana R. DeHoyos MS, MT(ASCP) (TX)
Dr. Maria del Pilar Aguinaga PhD,
CLDir(NCA) (TN)
N. de Jonge (Netherlands)
Anne Delaney (AZ)
Dr. Francois Depasse PharmD, MSc (France)
Narendra Desai (CA)
Dr. Edward P. Desmond PhD (CA)
Patricia Devine (MA)
Tom Dew (PA)
Ms. Diana L. Dickson MS, RAC (PA)
Donna Downs (NV)
Dr. Sherry A. Dunbar PhD (TX)
Mr. A. Paul Durham MA (CA)
• •••«•••«••••••••••••«•••••a
Kathleen Dwyer (TX)
Pinar Eker (Turkey)
Saha r Garni I EL-Wakil (Egypt)
Dr E Elnifro (Malta)
Paulo Enrico P. Belen (Philippines)
Mi ke E ro (CA)
Mr. German Esparza BSc (Colombia)
Amy F, MS (NY)
Dr. William Fa les (MO)
Pilar Fernandez-Calle (Spain)
Leah Ferrier (MT)
Ms. Sue Forrest (Australia)
Marcia Foxworthy (AL)
Dr. Timothy S. Frana DVM, MS, MPH, PhD (IA)
Dr. Jeff Fuller PhD, FCCM,ABMM (Canada)
Mary Lou Gantzer (DE)
Dr. Valerio M. Genta MD (VA)
Karima Ghazzaly (TX)
Marc Gold ford (IN)
Merran Gove nd ir (Australia)
Tanya Graham (SD)
Neil Greenberg (NY)
Ann M. Gronowski (MO)
Jason Gruver (IA)
Dr. Tibor Gyorfi (GA)
John F Halsey (SC)
Dr. W. Harry Hannon PhD (GA)
Syed N Hassan (NY)
Alandria Hatcher (TX)
B. Y. Hsieh (Taiwan)
Ро-Ren Hsueh (Taiwan)
Mr. Darren C. Hudach (OH)
Doreene Hyatt (CO)
Anne Igbokwe (CA)
Lugard Igharo (TX)
CathyTrumel (France)
T. S Isbell (MO)
Dr. Megan E. Jacob PhD (NC)
Ellis Jacobs (NJ)
Carlos A. Javier (FL)
Amy Jerabek (Wl)
Daniel M. Johnson (IA)
Judith Johnston (CA)
Stephen Kahn (IL)
Jiesheng Kang (MA)
Na ch urn Kaplan (Canada)
Mr. Bob Kaplanis PBT, MT(ASCP) (AZ)
David Kasper (Austria)
Dr. Steven C. Kazmierczak PhD, DABCC,
FAC В (OR)
Copyrighted material licensed to Olena Ramazanova on 2018-04-12 for licensee's use only. No further reproduction or networking is permitted. Distributed by Clarivate Analytics (US) LLC, www.techstreet.com, under license from Clinical and Laboratory Standards
92
© Clinical and Laboratory Standards Institute. All rights reserved.
Active Membership (As of 1 August 2014)
Natalie J. Kennel (CA)
Michael Kent (OH)
Mr. Klaus M. Kjoller MSc (Denmark)
William F. Koch (MD)
Denise Kramer (OH)
Teresa Kraus (OK)
Mr. Narayan Krishnaswami MS, MBA (MO)
Mar tin Kroll (NJ)
Jan Krouwer (MA)
Kristi Kuper (TX)
Dr. Patrick B. Kyle PhD (MS)
Giancarlo la Marca (Italy)
Michael La Fleur (MA)
Grace Largado (CA)
Professor Szu-Hee Lee MD, PhD (Australia)
Dr. Thomas J. Lenk PhD (CA)
Sarah В Leppanen (CA)
Andrew Leung (CA)
Jacob В Levine (NJ)
Ernst Lindhout (Netherlands)
Kristian Linnet (Denmark)
Yuqing Liu (China)
Philip Lively (PA)
Mark Loch (MN)
Moushumi Lodh (India)
Brian Lubbers (KS)
Darrell Lundrigan (Canada)
Dr. Raquel Yahyaoui AAacias (Spain)
Dr. Roberta Madej (CA)
Edward Mahamba (NV)
Mr. David Mana.lan F(ASQ), CSQE, CBA (MA)
Wilma Mangan (CA)
Linda M Mann (CA)
Adrienne Manning (CT)
Kristin M Marckel (MN)
Richard A. Marlar (OK)
Barbara Masten (MM)
Christine McRoberts (Canada)
Dr. Piet Meijer PhD (Netherlands)
Jacques F Meis (Netherlands)
Vanessa D. Mercado (Puerto Rico)
Barbara Mervin (MD)
James J. Miller (KY)
Kathryne Miskavige (ND)
Ms. Barbara Mitchell (KS)
Kristine Moraski (PA)
Yaser Morgan (NY)
Ian Morrissey (Switzerland)
Mohamed HanafyMorsy (Saudi Arabia)
Anna Murphy (NJ)
Nombuso Ndlovu (South Africa)
Vishwanand Negi (India)
Melanie O'Keefe (Australia)
Jeffrey O'Kel ley (GA)
Joseph Oduor Ochieng (Kenya)
Olajumoke Oladipo (NY)
Mr. Gregory Olsen (NE)
Ms. Margaret Ordonez Smith de
Danies (Colombia)
Mr. Jan Ostrup (Finland)
Dr. Elizabeth Palavecino MD (NC)
Dr. Mark G. Pa pi ch DVM, MS (NC)
Niketankumar Patel (Ml)
Ketan Patel (MD)
Dr. Deborah Payne PhD (CO)
A. K. Peer (South Africa)
Armando Perez-Cardona (FL)
David S Perl in (NJ)
Linda Perryman (GA)
Philip A Poston, PhD (VA)
Dr. Mair Powell MD, FRCP, FRCPath (United
Kingdom [GB])
Nicole Procise (IN)
Dr. Mathew Putzi (TX)
Dr. QinfangQian MD, PhD (MA)
Albert Rabi novi tch (CA)
Tawni Reller (MN)
Ms. Allison Remensperger (CA)
Dr. Robert P. Rennie PhD (Canada)
Mary Rice (CO)
Hanna Ritzen (Sweden)
Jennifer Rogers (Ml)
Dr. Markus Rose DVM, PhD (Germany)
Andreas Rothstein (Colombia)
Daniel Ryan (CA)
Habib Sadat Chaudaury (Bangladesh)
Dr. Linoj Samuel PhD, D(ABMM) (Ml)
Dr. Leticia J. San Diego PhD (Ml)
Caroline Satya di (CA)
Theresa Schnellman (SC)
Paul Schreckenberger (IL)
Melvin Schuchardt (GA)
Kathleen Selover (NY)
Dan Shi reman (KS)
Dinah Shore Myers (NC)
Dr. Venkatakrishna Shyamala PhD (MD)
Dr. Vijay K. Singu DVM, PhD (NE)
Martha Skorczewski (IL)
Jane L. Smith (TN)
Janis F. Smith, Laboratory (MD)
Anna V. Sombong (Philippines)
Oyetunji 0. Soriyan (Nigeria)
Paul D Stamper (MD)
John Stelling (MA)
Jennifer Strom (TX)
Ara Tahmassian (MA)
LenTanaka (HI)
Jose Eduardo MucitoVarela (Mexico)
Michelle Vanderpool (CA)
Suresh H Vazirani (India)
Ryan A. Vicente (Qatar)
Lenin Villalta (Ecuador)
Kim Walker (CA)
Megan Waller (MD)
Dr. Hui Wang PhD (China)
Peter Warn (United Kingdom [GB])
Mr. Niels Wartenberg (MN)
Markita Weaver (MA)
Mr. Marlon A. Webb (MD)
Alice S Weissfeld (TX)
Gary Wells (TX)
EricWhitters (PA)
Dr L.A. Nilika Wijeratne (Australia)
Bernadette Wildemore (GA)
Dr. Emily S. Winn-Deen PhD (CA)
Mr. Dennis Winsten (AZ)
William W Wood (MA)
Ms. Sheila M. Woodcock ART, MBA, FCSMLS(D)
(Canada)
Ginger Wooster (Wl)
Dr. Ching Ching Wu DVM, PhD (IN)
MaxWu (CA)
Dr. Shangwei Wu PhD (China)
Stanley Wu (GA)
Idris Mohammed Yahaya (Nigeria)
Patty Yates (MS)
Steven York (OH)
Ats us hi Yoshida (Japan)
Michelle L. Zaharik (Canada)
Dr. Marcia L. Zucker PhD (NJ)
Kimberly Zunker (TX)
© Clinical and Laboratory Standards Institute. All rights reserved.
93
Copyrighted material licensed to Olena Ramezanova on 2018-04-12 for licensee's use only. No further reproduction or networking is permitted. Distributed by Clarivate Analytics (US) LLC, www.techstreet.com, under license from Clinical and Laboratory Standards It
Clinical and Laboratory Standards Institute. All rights reserved.
NOTES
Clinical and Laboratory Standards Institute
Setting the standard for quality in medical laboratory testing around the world.
The Clinical and Laboratory Standards Institute (CLSI) is a not-for-profit membership organization that brings
together the varied perspectives and expertise of the worldwide laboratory community for the advancement of a
common cause: to foster excellence in laboratory medicine by developing and implementing medical laboratory
standards and guidelines that help laboratories fulfill their responsibilities with efficiency, effectiveness, and global
applicability.
Consensus Process
Consensus—the substantial agreement by materially affected, competent, and interested parties—is core to the
development of all CLSI documents. It does not always connote unanimous agreement, but does mean that the
participants in the development of a consensus document have considered and resolved all relevant objections
and accept the resulting agreement.
Commenting on Documents
CLSI documents undergo periodic evaluation and modification to keep pace with advancements in technologies,
procedures, methods, and protocols affecting the laboratory or health care.
CLSI’s consensus process depends on experts who volunteer to serve as contributing authors and/or as participants
in the reviewing and commenting process. At the end of each comment period, the committee that developed
the document is obligated to review all comments, respond in writing to all substantive comments, and revise the
draft document as appropriate.
Comments on published CLSI documents are equally essential, and may be submitted by anyone, at any time, on
any document. All comments are managed according to the consensus process by a committee of experts.
Appeals Process
When it is believed that an objection has not been adequately considered and responded to, the process for
appeals, documented in the CLSI Standards Development Policies and Processes, is followed.
All comments and responses submitted on draft and published documents are retained on file at CLSI and are
available upon request.
Get Involved—Volunteer!
Do you use CLSI documents in your workplace? Do you see room for improvement? Would you like to get
involved in the revision process? Or maybe you see a need to develop a new document for an emerging
technology? CLSI wants to hear from you. We are always looking for volunteers. By donating your time and talents
to improve the standards that affect your own work, you will play an active role in improving public health across
the globe.
For additional information on committee participation or to submit comments, contact CLSI.
Clinical and Laboratory Standards Institute
950 West Valley Road, Suite 2500
Wayne, PA 19087 USA
P: +1.610.688.0100
F: +1.610.688.0700
www.clsi.org
standard@clsi.org__________________________________________________________________________________
CLINICAL AND
LABORATORY
STANDARDS
INSTITUTE*
950 West Valley Road, Suite 2500, Wayne, PA 19087 USA
P: +1.610.688.0100 Toll Free (US): 877.447.1888 F: +1.610.688.0700
E: customerservice@clsi.org www.dsi.org
PRINT ISBN 1-56238-965-3
ELECTRONIC ISBN 1-56238-966-1